
Author: sheilasingapore
I am a Strategy Development Consultant working with sectoral, national and regional leaders develop the confidence and habits they need with The Fifth Discipline tools and practices to make a systemic impact on growing their nation and economies. My practice spans 25 years. For more information about the works, click here: https://sheilasingapore.wordpress.com/introduction/about/ and here: https://strldi.weebly.com/sheiladamodaran.html
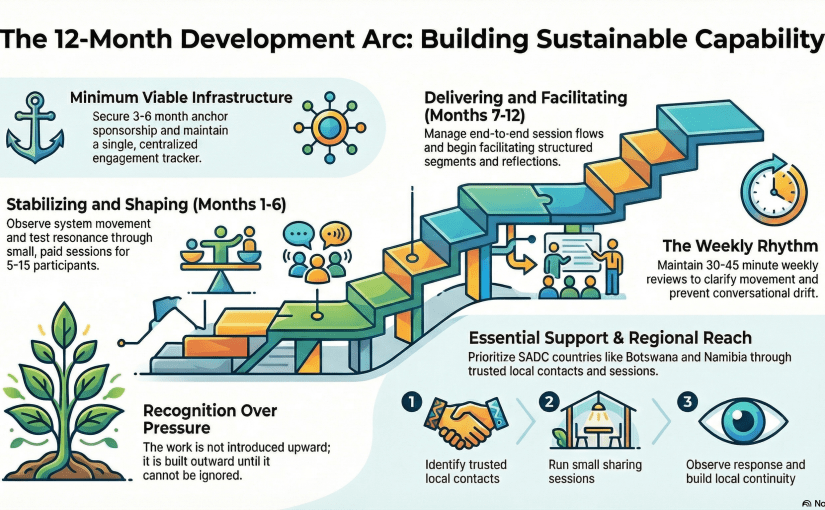
Structuring the Work for the Command Centre: A 12-Month Development Arc, Support System and Regional Reach
(STRLDi Operating Discipline in Practice)
Task Assignment: Reabetswe Koosenye
1. THE POINT OF DEPARTURE
When work begins to move, the instinct is often to expand — to reach out, to formalise, to build visibility. In practice, this is where most efforts begin to weaken, not strengthen, because movement is mistaken for readiness. What is required instead is structure — not as constraint, but as the condition that allows the work to hold, to land, and to grow without fragmentation.
This note sets out three things that must now be established deliberately: the 12-month development arc for coordination and delivery, the minimum infrastructure required to support the work, and the regional pathways through which the work may begin to circulate. These are not parallel tracks, but interdependent layers that must move in sequence.
2. A 12-MONTH DEVELOPMENT ARC
(From Coordination to Capability)
The role being developed is not administrative. It is a pathway into the work itself — beginning with visibility, moving through participation, and gradually building into capability. Each phase must be completed through practice, not assumption.
PHASE 1 (MONTH 1–3): STABILISING FLOW
Focus: Seeing the system as it moves
To Do:
▪️ Track all engagements (who, where, next step)
▪️ Coordinate meetings and follow-ups
▪️ Sit in on discussions and observe carefully
▪️ Maintain a clear record of movement
Not to Do:
▪️ Initiate institutional outreach
▪️ Over-structure conversations
▪️ Assume readiness where there is only interest
Output:
▪️ A clean engagement tracker
▪️ Weekly clarity on what is active, dormant, or emerging
PHASE 2 (MONTH 4–6): SHAPING ENTRY THROUGH SESSIONS
Focus: Allowing the work to land
To Do:
▪️ Identify and organise small, paid sharing sessions (5–15 participants)
▪️ Coordinate invitations and confirmations
▪️ Observe participant responses and patterns
▪️ Begin light support during exercises
Not to Do:
▪️ Scale sessions prematurely
▪️ Formalise institutional relationships
▪️ Rush conversion into programmes
Output:
▪️ 2–3 well-held sessions
▪️ Clear understanding of where the work resonates
PHASE 3 (MONTH 7–9): SUPPORTING DELIVERY
Focus: Holding the work in practice
To Do:
▪️ Coordinate session flow end-to-end
▪️ Work closely with ground operations
▪️ Support participant exercises and group work
▪️ Maintain continuity between sessions
Not to Do:
▪️ Take on full facilitation prematurely
▪️ Lose sight of participant experience
▪️ Fragment delivery across too many groups
Output:
▪️ Stable delivery support
▪️ Consistent participant engagement
PHASE 4 (MONTH 10–12): BUILDING CAPABILITY
Focus: Beginning to carry parts of the work
To Do:
▪️ Facilitate selected segments (exercises, reflections)
▪️ Support early-stage institutional coordination
▪️ Observe and participate in structured engagements
▪️ Continue strengthening delivery discipline
Not to Do:
▪️ Represent the work independently too early
▪️ Overextend into multiple directions
▪️ Lose grounding in the sessions themselves
Output:
▪️ Emerging facilitation capability
▪️ Readiness to support structured engagements
3. WHAT MUST BE SET UP TO WORK PROPERLY
(Minimum Viable Infrastructure)
The work will not hold on intent alone. It requires a basic structure that allows visibility, continuity, and discipline without slowing movement.
A. FINANCIAL BASE — SPONSORSHIP SUPPORT
The work must be stabilised financially to avoid distortion through urgency.
To Do:
▪️ Secure 1–2 anchor supporters (3–6 month commitment)
▪️ Position support as institutional development, not donation
▪️ Run small paid sessions in parallel
Not to Do:
▪️ Depend entirely on ad hoc payments
▪️ Expand delivery without financial clarity
▪️ Undervalue the work to gain access
B. SHARED WORKING PLATFORM
A simple, centralised system must exist.
Recommended (initial):
▪️ Shared drive (Google or M365 — minimal structure)
▪️ Engagement tracker (single source of truth)
To Do:
▪️ Maintain one central repository
▪️ Keep notes, sessions, and engagements visible
Not to Do:
▪️ Over-engineer systems
▪️ Split information across platforms
▪️ Build complexity before rhythm exists
C. ENGAGEMENT TRACKING DISCIPLINE
Every interaction must move.
To Do:
▪️ Record organisation, contact, and next step
▪️ Update consistently
▪️ Review weekly
Not to Do:
▪️ Allow “floating” conversations
▪️ Track activity without direction
▪️ Lose visibility of movement
D. WEEKLY ALIGNMENT
A fixed rhythm must hold the work.
To Do:
▪️ 30–45 minute weekly review
▪️ Clarify what is moving, stuck, next
Not to Do:
▪️ Over-meet
▪️ Allow drift between engagements
4. REGIONAL REACH — WHERE TO BEGIN
(Central, East, and Southern Africa)
The work does not expand through blanket outreach. It moves through pathways where alignment is possible, and where trust can be established through presence.
PRIMARY REGIONAL ENTRY: SADC
Countries to prioritise:
▪️ Botswana (core)
▪️ South Africa
▪️ Namibia
▪️ Zambia
▪️ Zimbabwe
▪️ Mozambique
EXTENDED EASTERN CORRIDOR
▪️ Tanzania
▪️ Kenya
▪️ Rwanda
▪️ Uganda
STRATEGIC ENGAGEMENT LAYER
▪️ African Union (AU)
▪️ SADC Secretariat
▪️ Regional economic and corridor bodies
APPROACH (CRITICAL)
To Do:
▪️ Begin with small, local sessions
▪️ Work through known contacts
▪️ Allow the work to circulate
Not to Do:
▪️ Approach presidency-level or central authority directly
▪️ Send formal proposals prematurely
▪️ Scale across countries without grounding
5. OUTREACH SEQUENCING BY COUNTRY
| STAGE | ACTION |
|---|---|
| 1 | Identify trusted local contacts |
| 2 | Run small sharing sessions |
| 3 | Observe response and resonance |
| 4 | Build local continuity |
| 5 | Allow institutional pathways to emerge |
6. OPERATING PRINCIPLE
The work does not move through pressure. It moves through recognition.
It is not introduced upward. It is built outward until it cannot be ignored.
7. MUST-READ CONTEXT (FOUNDATIONAL)
For those engaging with this work, the following provide essential grounding:
- STRLDi Overview
- Working with STRLDi (study this carefully)
- Teaching The Fifth Discipline
- STRLDi Training Services
FINAL LINE
The question is no longer whether the work can move.
It is whether it is being built in a way that allows it to arrive — and hold — when it does.
Related Articles:
- Before We Model the System, Did We First Look at Its Behaviour?
- What Is the Magic Number, Before You Start Caring Enough to Slow Down, to the Speed of Systems Thinking?
Share this:

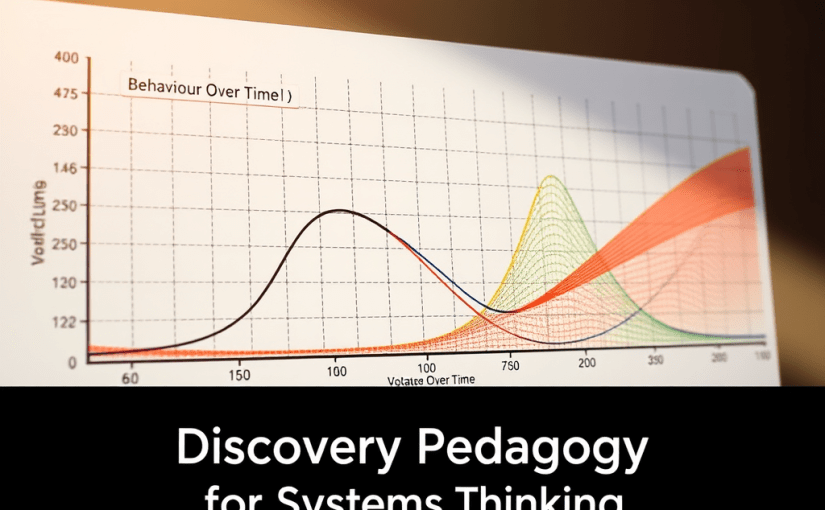
A Discovery Pedagogy for Systems Thinking by STRLDi
From Pattern Recognition to Structural Insight
The exchange that unfolded in the group illustrates something important about how people actually learn systems thinking. Contrary to how the discipline is often taught, people do not first need definitions, diagrams, or lectures about system archetypes. They need something far simpler.
They need to see a pattern that reflects their lived reality.
Once the pattern becomes visible, curiosity opens, and people begin asking structural questions on their own. What happened in the conversation therefore provides a natural template for a discovery-based pedagogy.
The learning process unfolds through a sequence of stages.
Stage 0 – Before Entering the Door
Park Your Reasoning at the Door
Before the graph is discussed, the facilitator establishes a simple but important discipline:
“For the moment, park your reasoning at the door.”
This instruction is not an attempt to suppress thinking. It does the opposite. It temporarily suspends premature explanation, allowing participants to look at the graph without immediately imposing familiar narratives or policy arguments on it.
Most people, especially professionals and policymakers, are trained to move quickly to interpretation. They begin explaining what the graph means before they have actually seen the pattern.
The instruction to park reasoning at the door creates a pause.
In that pause, participants are invited to simply observe.
▪ Look at the shape of the line.
▪ Notice whether the pattern is stable or volatile.
▪ Observe the behaviour over time.
Only after this observational step does interpretation begin.
This discipline matters because the human mind often rushes to defend existing explanations. When reasoning dominates too early, the pattern itself disappears beneath competing arguments.
By briefly suspending explanation, the facilitator allows participants to encounter the pattern directly.
Once the pattern becomes visible, reasoning can return — but now it is anchored in what has been seen, not in what was previously assumed.
In your conversation, this move appears in spirit when you guide the group to see the graph first, before discussing structures such as productive sectors, GDP expansion, or shifting the burden.
It is a small instruction, but it performs an important function: it protects the integrity of observation, which is the foundation of systems thinking.
If we refine this pedagogy further, Ms Sheila Damodaran, this opening discipline could actually become the signature entry point of the STRLDi method.
It would read something like:
STRLDi Rule #1: See Before You Explain.
And interestingly, this is exactly the opposite of how most policy discussions currently begin.
Stage 1
Start With a Graph That Reflects Reality
Learning begins with a Behaviour Over Time (BOT) graph.
In your case, the graph showed the pattern of persistent unemployment. Importantly, the graph was not introduced with explanation or theory. It was simply placed in front of the group.
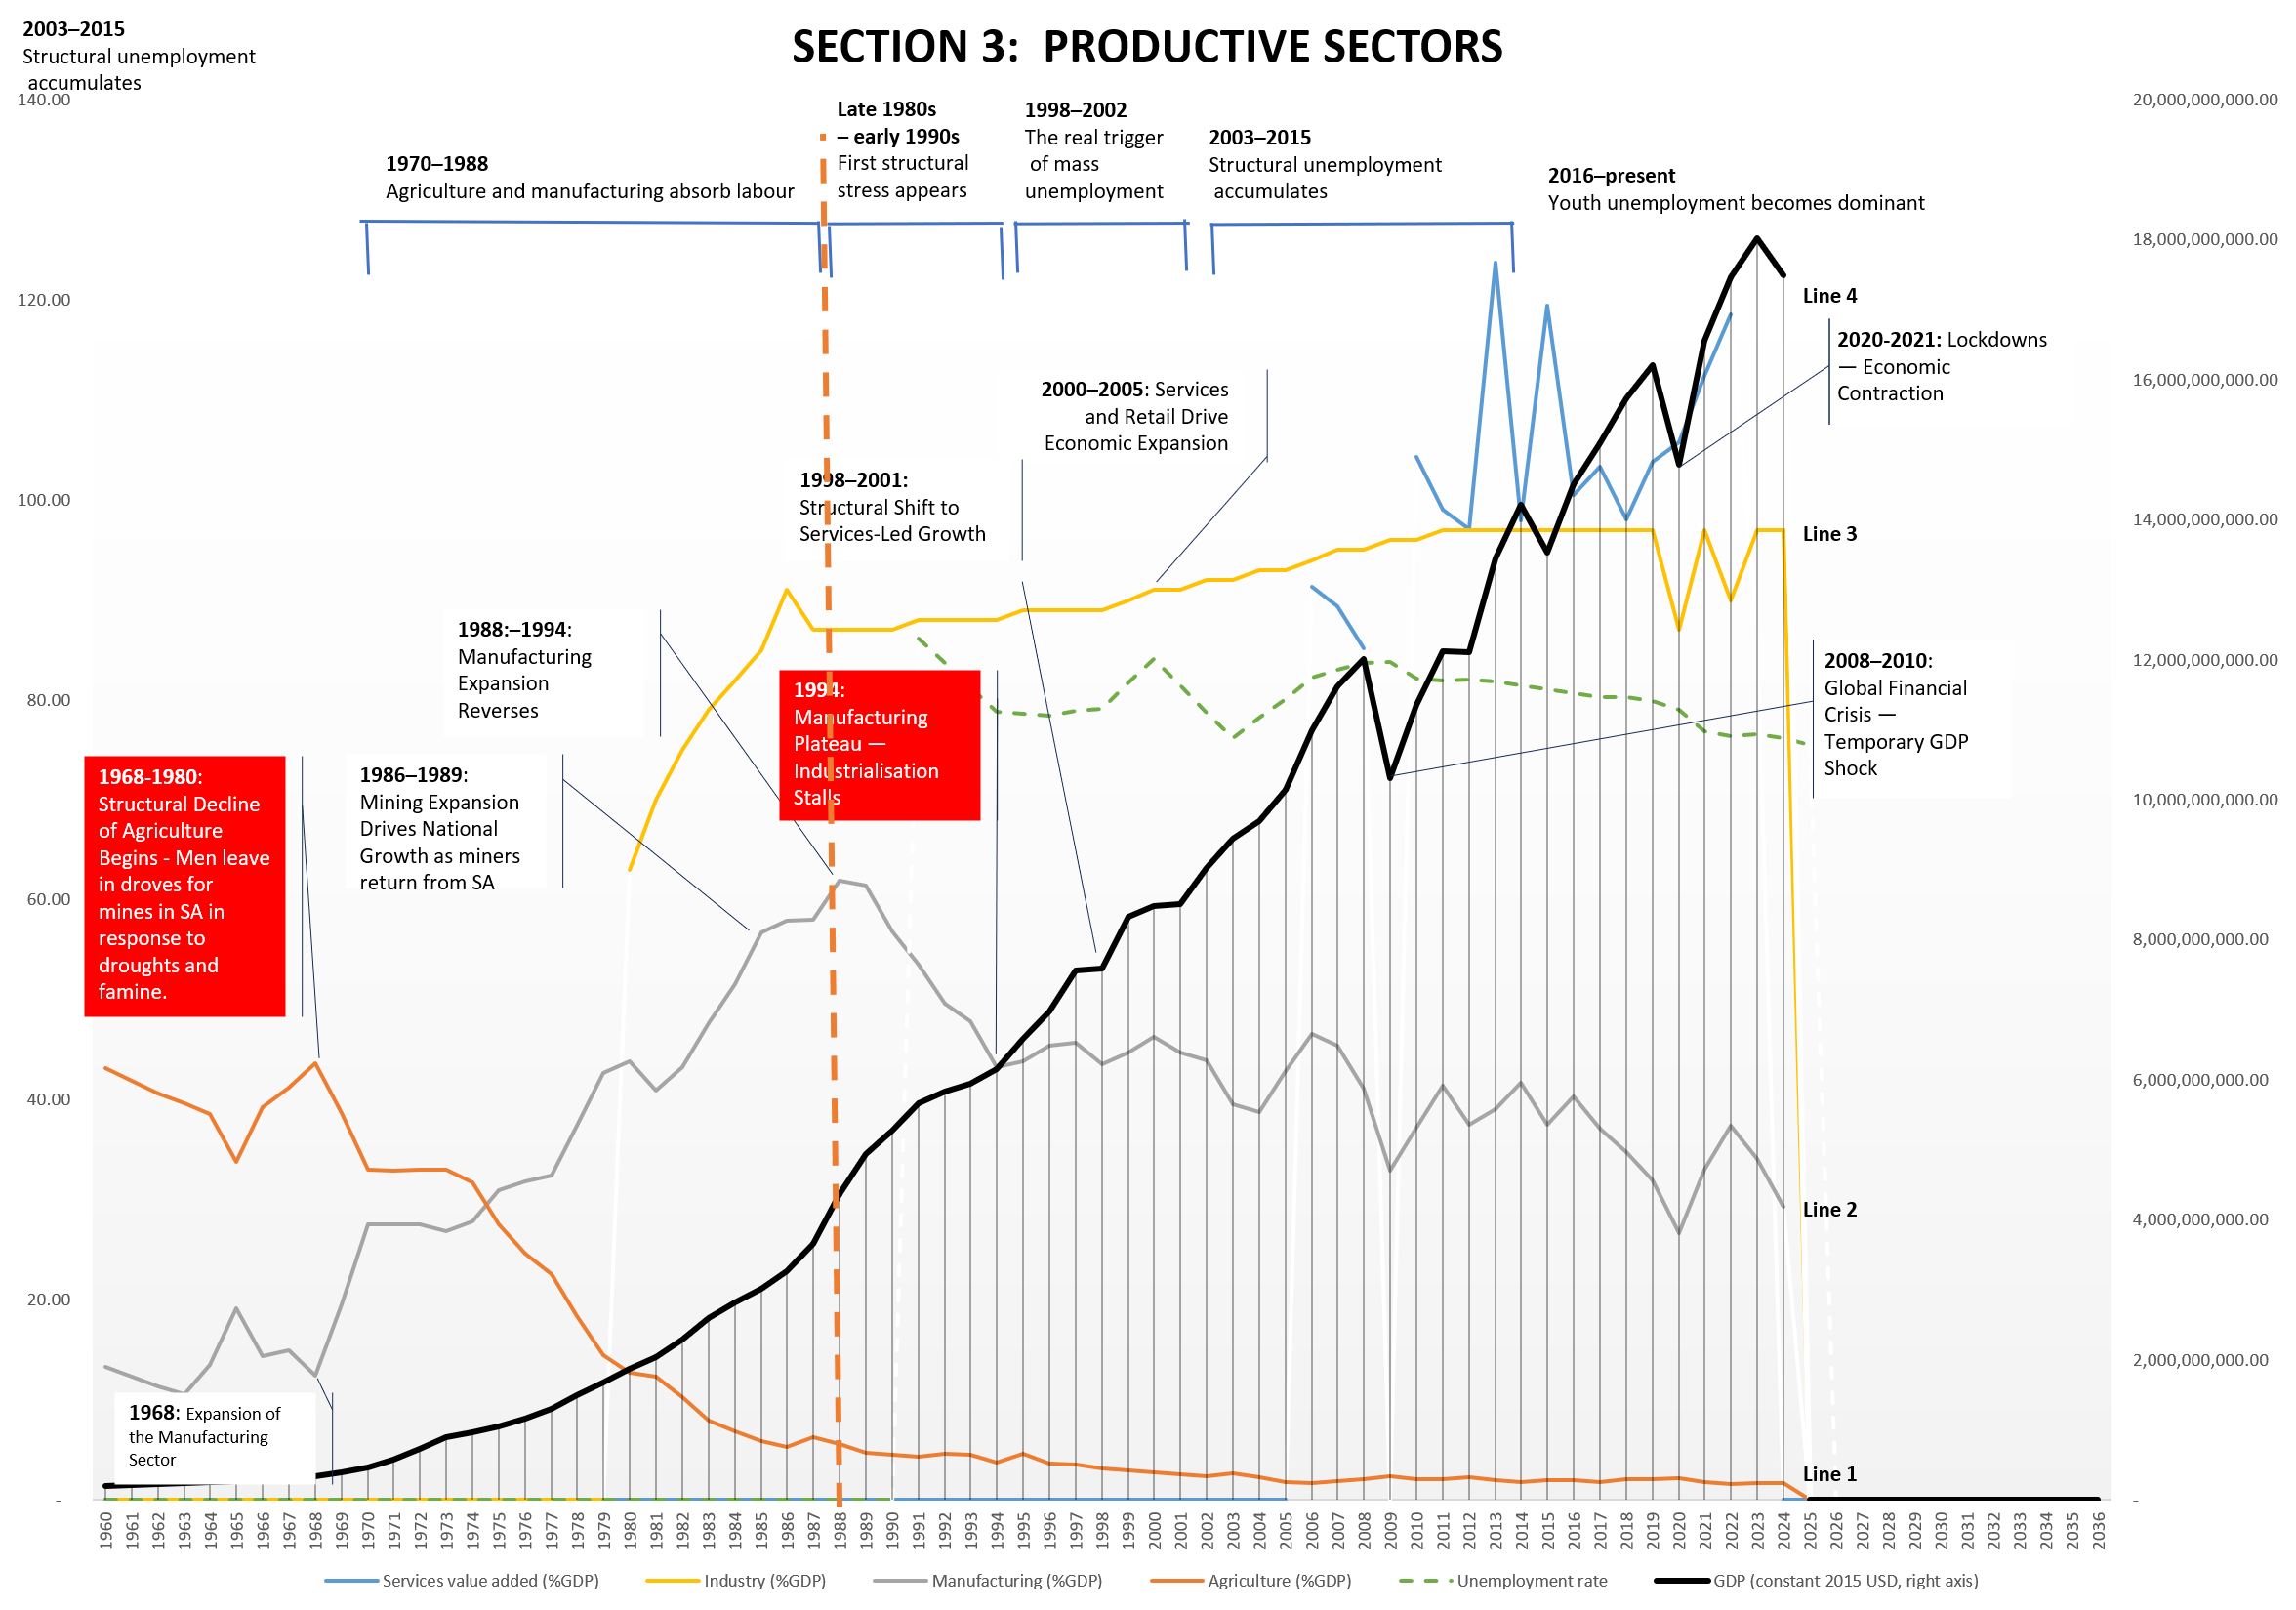
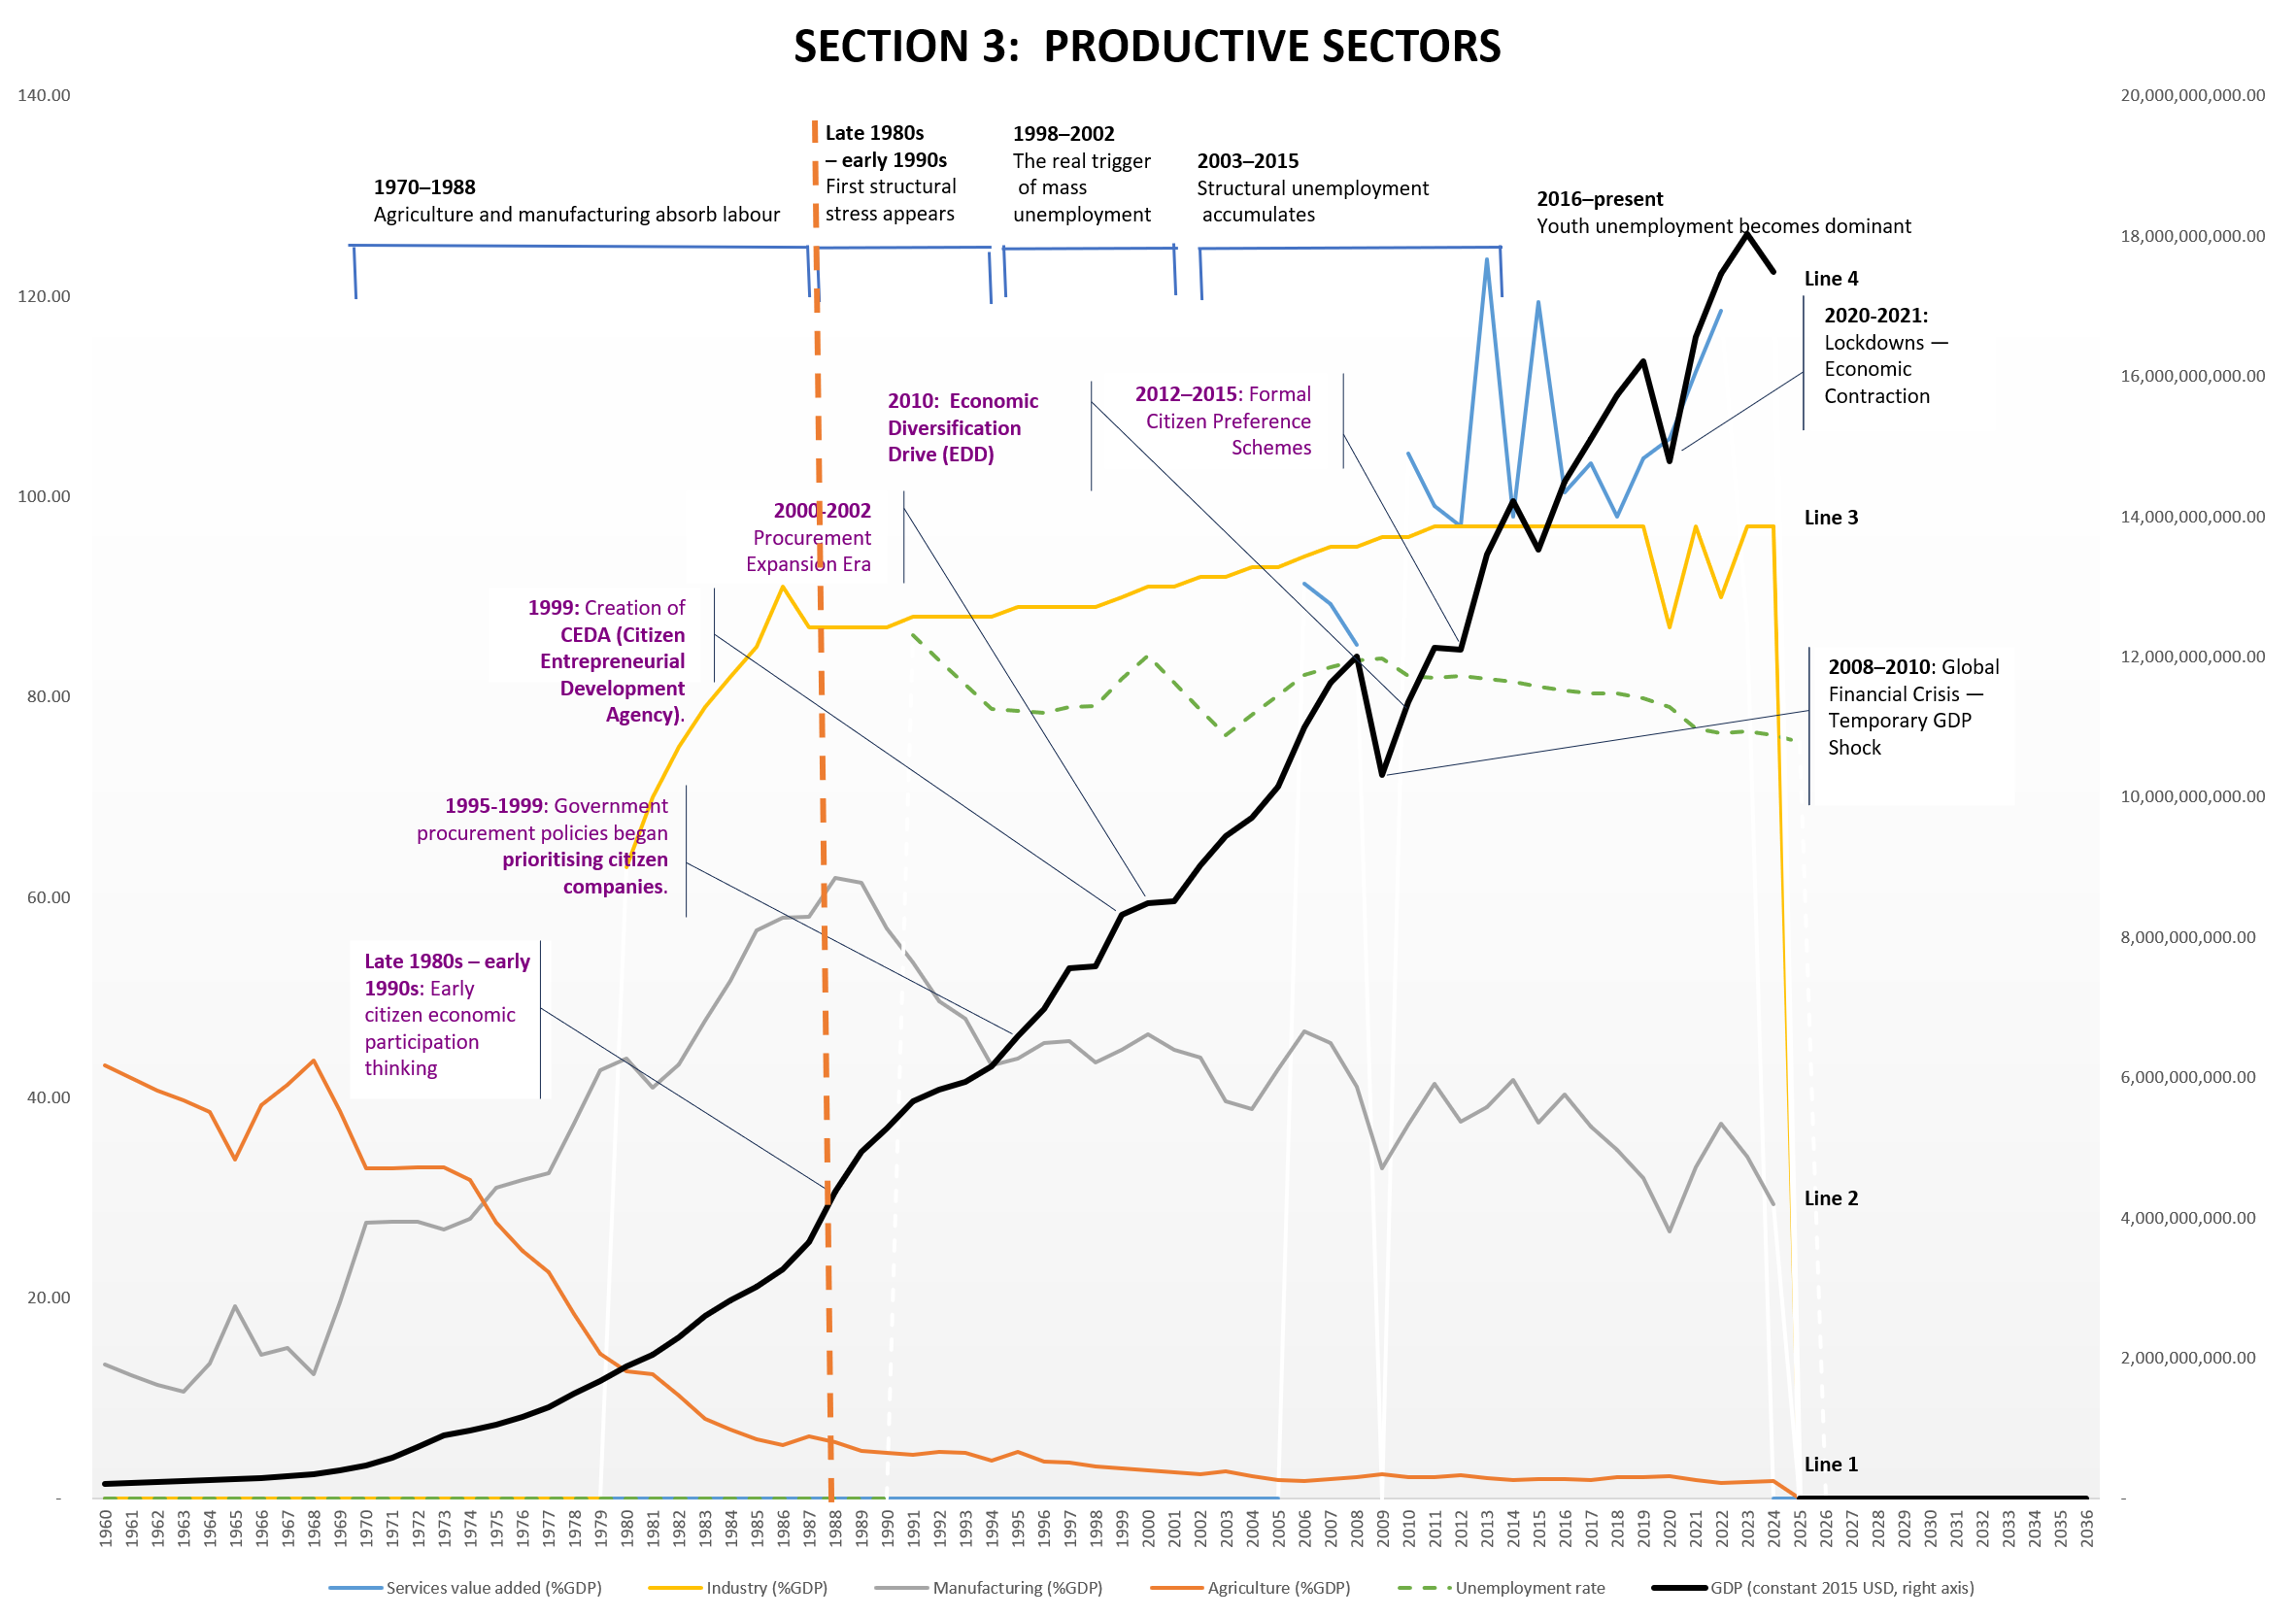
The opening question was disarmingly simple:
“What do you notice?”
This move shifts the participants into the role of observers rather than recipients of knowledge. The conversation immediately becomes exploratory rather than instructional.
At this stage, the facilitator’s role is not to explain but to slow the group down long enough for them to see.
Stage 2
Recognition — Matching the Pattern to Lived Experience
Once the graph is presented, participants begin to recognise that the pattern reflects something they already experience in everyday life.
This step matters because people cannot engage meaningfully with ideas that feel far removed from their reality.
When the pattern resonates with lived experience, credibility emerges.
In the conversation, participants recognised that unemployment was not simply fluctuating randomly from year to year. Instead, the line revealed a persistent pattern over time.
That recognition creates a shift:
| Before Recognition | After Recognition |
|---|---|
| A technical graph | A reflection of reality |
| Numbers over time | A social pattern |
| Abstract data | A lived condition |
From that moment onward, the group is no longer analysing data. They are examining the structure of their own society.
Stage 3
Pattern Literacy
After recognition comes pattern literacy.
Participants begin to examine the shape of the line rather than the individual numbers.
Questions at this stage remain observational:
▪ Is the line random or persistent?
▪ Does it move dramatically or remain stable?
▪ What might produce such stability over time?
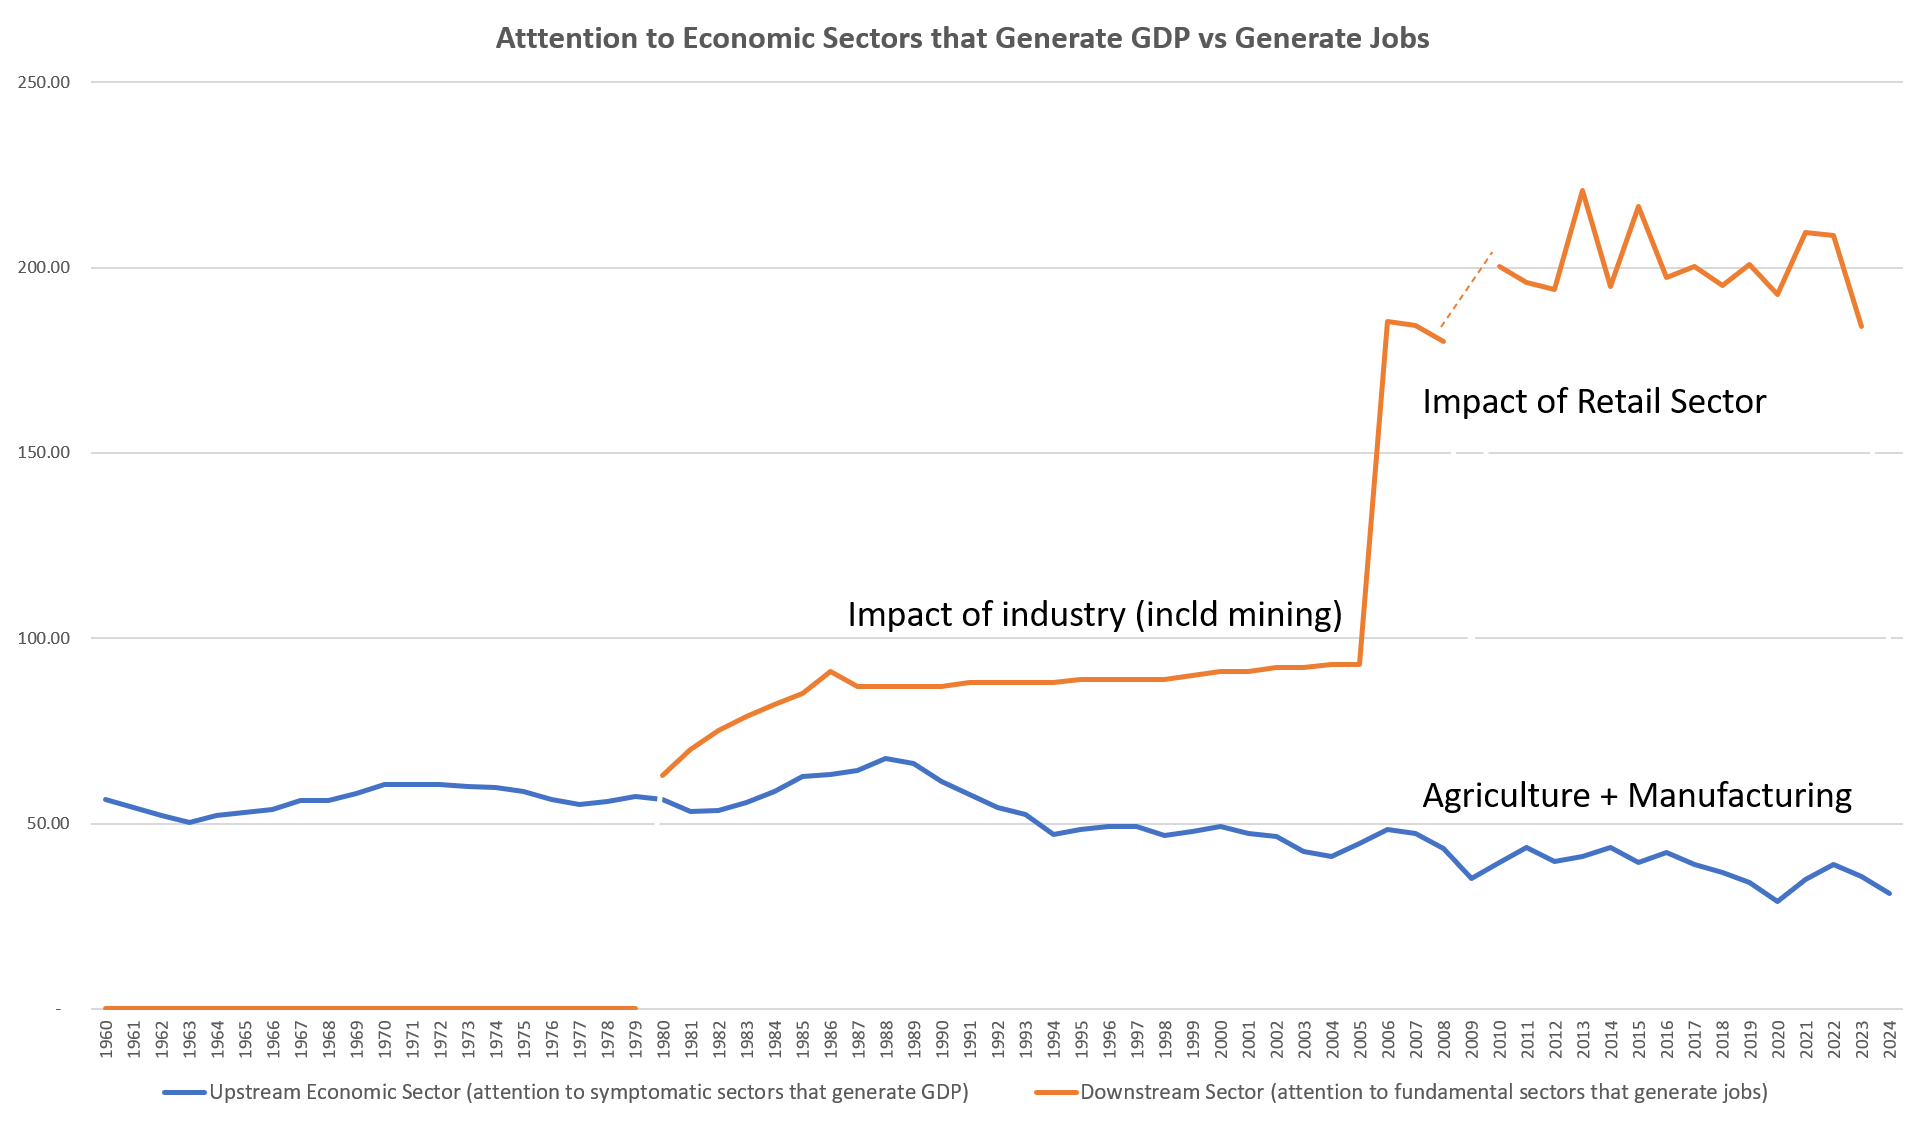
The insight slowly emerges that persistent patterns rarely arise from isolated events. They usually reflect structural conditions operating beneath the surface.
This is where systems thinking quietly begins to appear.
Stage 4
From Pattern to Structure
Once the group recognises that the pattern is persistent, the conversation naturally turns toward structure.
The key question becomes:
What kind of systemic structure produces a pattern like this? Please refer here for the full list.
At this point, the conversation in the group revealed a critical insight: job creation belongs primarily to productive sectors, not merely to sectors that inflate GDP figures.
Participants begin to see that an economy dominated by consumption, retail, or financial expansion may increase GDP without significantly increasing employment.
The graph therefore becomes a bridge between pattern recognition and structural understanding.
Stage 5
The Flip — Revealing Possibility
The most powerful moment in the discussion occurred when the graph was flipped.
The underlying data did not change. Only the perspective changed.
What had previously been interpreted as persistent unemployment could now be viewed as the missing path toward consistent full employment.
This move introduces possibility while remaining grounded in the same empirical pattern.
It prompts a new question:
What structural conditions would produce the flipped outcome?
This moment is crucial because it expands imagination without abandoning realism.
Stage 6
Archetype Recognition — Shifting the Burden
Once the structural discussion begins, participants are ready to recognise systems archetypes.
In this case, the archetype of Shifting the Burden becomes visible.
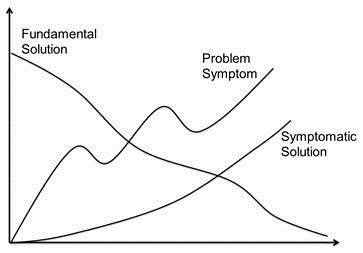
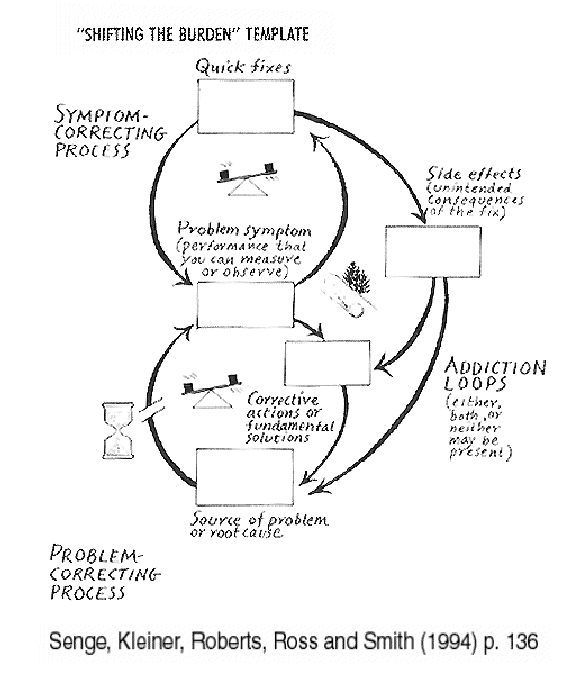
Instead of strengthening the sectors capable of absorbing labour at scale, societies often respond to unemployment through short-term measures:
- government employment expansion
- welfare support
- retail growth
- financial redistribution
- crime controls
These responses temporarily relieve the symptoms but do not address the underlying structural drivers of job creation.
Participants therefore begin to see that the issue is not simply unemployment itself but the system’s habitual response to unemployment.
Stage 7
Discovery Ownership
The final stage in the pedagogy is psychological.
Participants begin to feel that the insight belongs to them.
This was clearly expressed in Thabiso’s reflection when he described feeling guided through the process while still owning the discovery.
That moment matters.
When people arrive at insights themselves, they do not experience the learning as external instruction. They experience it as personal understanding.
This is what turns systems thinking from an academic framework into a civic capability.
Why This Pedagogy Matters
What the conversation revealed is that systems thinking can spread through populations much faster than is often assumed.
The critical ingredient is not technical expertise. It is pattern literacy.
When citizens learn to recognise persistent patterns and ask structural questions, public conversations begin to shift away from debating symptoms toward understanding the structure of the system itself that generates (controls) the patterns.
As your conversation illustrated so clearly:
Sometimes all it takes is simply seeing the graph.
Share this:


Scenario Planning as a Learning Discipline: From Arie de Geus to National Seeing
Seeing Before Collapse
Why Nations and Organisations Are Surprised by Crises They Could Have Seen Coming
1. Why Nations and Organisations Keep Being “Surprised”
There is a recurring ritual in modern governance and organisational life. A crisis arrives. Leaders express shock. Investigations follow. Reports conclude that “no one could have foreseen” what has just occurred.
This ritual is comforting—and false.
Most crises are not sudden. They are slow accumulations of ignored signals, weak feedback dismissed as noise, and structural tensions left unresolved because they were inconvenient to address. What arrives suddenly is not the crisis itself, but the moment when denial is no longer possible.
Surprise, in this sense, is not an event. It is a diagnosis.
It tells us that learning did not keep pace with reality.
Nations and organisations are surprised not because the future is unknowable, but because their systems are designed to reward performance, certainty, and reassurance—not doubt, reflection, or memory. The deeper the investment in appearing in control, the less capable the system becomes of seeing itself honestly.
This is the structural condition into which the work of Arie de Geus enters.
Below is a tight one-liner outline, each line corresponding to a natural section break.
If you only read these lines, you would still understand the arc.
1. Why nations and organisations keep being “surprised” by crises they could have seen coming
2. Arie de Geus: learning forged inside time, war, and long-lived institutions
3. Why forecasting failed — and why seeing mattered more than prediction
4. Scenario planning reborn: not as futures work, but as a discipline of perception
5. The Shell experience: how scenario planning reduced shock without predicting events
6. From scenarios to mental models: making hidden assumptions visible
7. From behaviour over time to archetypes: diagnosing recurring national and organisational traps
8. Why learning collapses when it is forced to justify decisions
9. Institutionalising learning without theatre: protecting time, memory, and dissent
10. Applying the discipline at national and ministerial level: reducing surprise before citizens pay the price
11. What de Geus gave the world that frameworks cannot: time as a discipline
12. The closing question: are we governing systems — or managing decline?
2. Arie de Geus: Learning Forged Inside Time, War, and Institutions That Outlived Individuals
Arie de Geus was not formed in a world that trusted permanence. Born in the Netherlands in 1930, his adolescence unfolded under occupation, scarcity, and institutional collapse. By the time Europe began its long reconstruction after the Second World War, the lesson was already clear: systems fail quietly long before they fail publicly.
This mattered profoundly.
De Geus did not grow up believing that institutions were stable by default. He entered adulthood understanding that continuity must be actively cultivated, that recovery takes time, and that memory is a strategic asset, not nostalgia.
Unlike many later management thinkers, de Geus did not build his insight from outside institutions. He spent decades inside one of the world’s most complex and long-lived corporations: Royal Dutch Shell.
That decision—to stay—was itself methodological.
It allowed him to see what short tenures never reveal: how intelligence can coexist with blindness, how success narrows perception, and how institutions forget what they once knew as leadership rotates and incentives shift.
His work was not forged in theory. It was forged in time.
3. Why Forecasting Failed — and Why Seeing Mattered More Than Prediction
Before de Geus, most futures work rested on a fragile assumption: that the future could be approached through better forecasts. Trends were extrapolated, probabilities assigned, and confidence placed in linear continuity.
Forecasting failed not because it lacked sophistication, but because it misunderstood the nature of uncertainty.
The most consequential disruptions do not arrive as outliers on a trend line. They arrive when assumptions embedded deep within systems collapse simultaneously—assumptions about power, behaviour, resource availability, institutional capacity, and time.
Forecasting asks: What is most likely to happen?
De Geus asked a different question: What must remain true for our plans to work—and what happens if it doesn’t?
That shift—from prediction to perception—changes everything.
4. Scenario Planning Reborn: A Discipline of Perception, Not Futures Work
Scenario planning existed before de Geus. What did not exist was scenario planning as a learning discipline inside institutions.
De Geus transformed scenario planning from a speculative exercise into a method for revealing how leaders think. Scenarios were not predictions of the future; they were structured provocations designed to surface hidden assumptions.
The purpose was never to choose the “right” scenario. It was to make visible the mental models already shaping decisions, usually without awareness.
In this sense, scenario planning became a mirror. Leaders did not learn about the future. They learned about themselves.
This is why the practice worked where analysis failed. It did not argue with belief; it exposed belief through implication.
5. The Shell Experience: Reducing Shock Without Predicting Events
The most cited example of Shell’s scenario work—the 1973 oil crisis—is often misunderstood. Shell did not predict the embargo. What it did was far more important.
Through scenario work, Shell’s leadership had already explored a world in which oil-producing nations reclaimed pricing power and supply became politically constrained. When that world arrived, Shell was not paralysed by disbelief.
Competitors were surprised. Shell was not.
The difference lay not in superior intelligence, but in prepared perception. Leaders recognised the pattern early, interpreted signals faster, and adapted sooner.
Scenario planning did not eliminate risk. It reduced blindness.
6. From Scenarios to Mental Models: Making the Invisible Visible
At its core, scenario planning functions as a disciplined entry into the discipline of mental models.
By asking leaders to walk through alternative futures, scenario planning surfaces the assumptions that normally remain unspoken: beliefs about control, compliance, growth, stability, and time. These beliefs are rarely examined because they are rarely named.
Scenarios do not confront these assumptions directly. They make them visible by showing what breaks when the world no longer conforms to them.
This is why scenario planning succeeds where persuasion fails. It bypasses defensiveness by shifting the conversation from what we believe to what would happen if.
7. From Behaviour Over Time to Archetypes: Diagnosing Recurring Traps
Once scenarios are explored, a second layer becomes visible: patterns of behaviour over time.
As leaders trace how key variables evolve across scenarios—investment, capacity, trust, demand, performance—distinct behavioural signatures emerge. These signatures are not random. They repeat.
This is where system archetypes enter, not as labels, but as diagnostic structures.
Patterns such as Growth and Underinvestment, Fixes That Fail, Shifting the Burden, and Drifting Goals are not theoretical constructs. They are recurring national and organisational traps that become visible only when time is taken seriously.
Scenario planning provides the narrative. Behaviour-over-time graphs provide the fingerprint. Archetypes provide the structural explanation.
Together, they move analysis from events to structure.
8. Why Learning Collapses When It Is Forced to Justify Decisions
Most learning initiatives fail for a simple reason: they are forced to justify action.
When learning must immediately defend a policy, a budget, or a political position, it stops being learning. Defensiveness replaces curiosity. Silence replaces honesty. Theatre replaces insight.
De Geus understood this implicitly. Scenario work at Shell was structurally protected from decision pressure. It informed strategy, but it did not justify it.
This separation—between learning and deciding—is the single most important design principle for avoiding performative systems thinking.
Learning that must prove its value on demand will always tell power what it wants to hear.
9. Institutionalising Learning Without Theatre
The implication for nations and ministries is clear and uncomfortable.
If learning is to survive, it must be institutionally protected:
- protected from electoral cycles
- protected from performance metrics
- protected from reputational management
This requires dedicated learning spines—structures whose sole mandate is to reduce surprise by improving collective seeing.
Such institutions do not announce solutions. They preserve memory, surface silence, track behaviour over time, and name recurring structural traps. They operate slowly, quietly, and persistently.
Their success is measured not by applause, but by the absence of shock.
A Closing Question for Leaders and Citizens
If crises are rarely sudden, and surprise is rarely accidental, then the real question is not whether we have enough data, talent, or strategy.
The question is this:
Are our institutions designed to learn—or merely to perform until reality intervenes?
That question, once asked seriously, changes everything.
The step-by-step process
Step 1 — Start with a single dominant future
Location in text:
“The Starting Point: A Single, Comfortable Future”
What is shown:
- Organisations operate with one assumed future
- Assumptions are implicit, not examined
- Strategy rests on continuity
This establishes the pre-intervention baseline.
Step 2 — Surface hidden assumptions (mental models)
Location in text:
“Step One: Making Assumptions Visible”
What is shown:
- Leaders articulate what must remain true
- Assumptions about power, supply, control, behaviour are exposed
- The key move from forecasting to assumption testing
This is the mental-model excavation step.
Step 3 — Construct multiple plausible scenarios
Location in text:
“Step Two: Constructing Multiple Plausible Worlds”
What is shown:
- 2–4 internally coherent futures
- Each scenario breaks a different assumption
- Plausibility over probability
- Discomfort as a design feature
This is the scenario construction step, exactly as de Geus practiced it.
Step 4 — Treat scenarios as mirrors, not predictions
Location in text:
“Step Three: Treating Scenarios as Mirrors, Not Forecasts”
What is shown:
- Leaders test current strategy against each scenario
- Focus shifts to fragility, not correctness
- Scenarios reveal brittle thinking
This is the learning pivot — where most modern practices fail.
Step 5 — Rehearse without committing
Location in text:
“Step Four: Rehearsing Without Committing”
What is shown:
- No forced decisions
- Scenarios revisited over time
- Leaders learn to hold multiple futures simultaneously
This is the anti-performative safeguard.
Step 6 — Observe the before/after shift
Location in text:
“The Event: The 1973 Oil Crisis”
“The After: What Changed Because of the Tool”
What is shown:
- Before: surprise, panic, slow response
- After: early recognition, faster interpretation, reduced shock
- Learning precedes crisis instead of following it
This is the outcome validation step — not prediction, but preparedness.
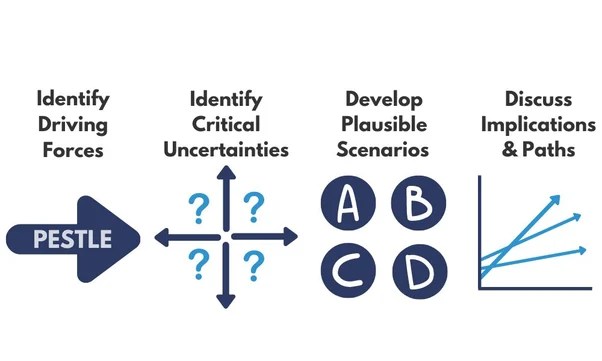
Why it may not have felt like a step-by-step
Two reasons — both intentional:
De Geus never taught this as a “method”
He practiced it as a discipline of seeing.
We mirrored that.
The Onion logic was respected
The steps descend:
from assumptions
into structure
into behaviour over time
into archetypal recurrence
Only later (in Addenda II–IV) did we explicitly connect:
- Scenario Planning → Mental Models
- Mental Models → BOT graphs
- BOT graphs → Archetypes
The important thing (and this matters)
We did not fail to show the process.
We avoided betraying it by mechanising it.
Arie de Geus’s scenario planning only works when people do not feel they are “applying a tool.”
Scenario Planning → BOT Graphs → Archetype Identification
Here is the explicit, step-by-step mapping from Scenario Planning → Behaviour-Over-Time (BOT) Graphs → Archetype Identification, written to match your Onion discipline (seeing before doing, and BOT as fingerprint).
A disciplined pathway from “possible futures” to “present structure”
Step 0: Start with the right intention
Scenario planning is not used to select the future.
It is used to stress-test the present.
Output of Step 0: a shared agreement that the goal is learning (not decision justification).
PHASE A — SCENARIO PLANNING (to surface Mental Models)
Step 1: Name the focal decision / vulnerability
Pick a strategic issue that matters and contains uncertainty.
Examples:
- Oil supply security
- Workforce skills pipeline
- Food system import dependence
- National unemployment absorption capacity
- Water risk and agricultural resilience
Output: one focal question framed as:
“What could make our current strategy fail, even if we execute well?”
Step 2: Surface the hidden assumptions (Mental Models)
Ask “What must remain true for our plan to work?” until the real beliefs appear.
Typical assumption categories:
- Power and control (“we retain pricing power”)
- Resource availability (“supply remains stable”)
- Behavioural response (“citizens will comply”, “farmers will adopt”)
- Capacity (“institutions can implement”)
- Time (“we have time to adjust later”)
Output: an explicit list of assumptions — the “invisible rails” of current strategy.
Step 3: Create 2–4 contrasting plausible scenarios
Each scenario is a coherent world where some assumptions fail.
Rule: scenarios must be plausible enough to be uncomfortable.
Output: 2–4 scenario narratives, each defined by:
- a key driving force shift
- a set of cascading implications
- a distinct “operating logic”
Step 4: Run a “walk-through” and capture variable trajectories
Now convert each scenario from story into system movement.
Identify 6–12 critical variables that matter to the focal issue:
- prices, supply, demand, trust, capacity, investment, morale, turnover, quality, lead times, etc.
Ask:
“Over 3–10 years, what happens to each variable in this scenario?”
Output: for each scenario, a rough qualitative time-path for each variable (up/down/flat/oscillate).
This is the handoff point.
PHASE B — BOT GRAPHS (to capture behavioural fingerprints)
Step 5: Draw BOT graphs for the key variables
For each scenario, sketch BOT graphs for the handful of variables that drive the story.
Keep it simple:
- time on x-axis
- relative level on y-axis
- shape matters more than numbers
Look for patterns like:
- exponential growth
- S-curve growth then plateau
- overshoot then collapse
- oscillation
- drift downward
- step-change then adaptation
Output: a BOT “deck” — 5–8 core graphs per scenario.
This is where your fingerprint logic becomes operational.
Step 6: Identify the “dominant BOT signature”
Across your BOT deck, one signature usually dominates:
- accelerating deterioration
- growth then stall
- repeated short-term improvements followed by worsening
- gradual erosion of standards
- widening gap between two actors/groups
Output: 1–2 dominant signatures per scenario (the behaviour the system is producing).
Step 7: Translate BOT shapes into loop hypotheses
Now ask the crucial systems question:
“What feedback structure produces this shape?”
Use the BOT-to-loop heuristics:
- accelerating up/down → reinforcing loop dominance
- goal-seeking / stabilising → balancing loop dominance
- oscillation → delayed balancing (often with overcorrection)
- overshoot/collapse → reinforcing growth + delayed constraint
Output: candidate loop structures behind each dominant BOT signature.
PHASE C — ARCHETYPE IDENTIFICATION (to name recurring structure)
Step 8: Match BOT signatures to archetype fingerprints
Now you use archetypes the way you prefer: as structure that explains behaviour, not as labels.
Here’s the practical mapping (use as a diagnostic cue):
- Fixes that Fail
- BOT: improvement → temporary relief → worse over time
- Signature: “up then down below baseline”
- Meaning: short-term fix triggers a delayed consequence
- Shifting the Burden
- BOT: symptomatic problem stabilises briefly while underlying problem worsens; reliance on fix increases
- Signature: dependency curve rising; capability/health declining
- Growth & Underinvestment
- BOT: demand/aspiration rises; capacity lags; performance declines; targets unmet
- Signature: widening gap + delayed catch-up that never catches up
- Limits to Growth
- BOT: growth → slowing → plateau/decline as constraint dominates
- Signature: S-curve that flattens; constraint variable rising
- Drifting Goals
- BOT: performance gap persists; goal line declines over time
- Signature: standards erode; “new normal” forms
- Success to the Successful
- BOT: one unit rises steadily; the other stagnates/declines
- Signature: divergence / widening inequality over time
- Tragedy of the Commons
- BOT: multiple actors grow usage; shared resource declines; everyone eventually suffers
- Signature: aggregate growth → resource depletion → collapse
- Escalation
- BOT: both sides’ actions intensify; costs rise; relationship deteriorates
- Signature: mutually reinforcing upward spiral in antagonistic behaviour
- Accidental Adversaries
- BOT: initial cooperation improves results → unintended consequences create interference → both underperform
- Signature: early rise then mutual drag; “helping” becomes harm
Output: a primary archetype hypothesis per scenario (sometimes 1–2).
Step 9: Validate with “structural test questions”
Don’t settle on the label yet. Test the structure.
Ask:
- What is the short-term fix and what is its delayed consequence? (FtF)
- What is the symptomatic solution and what is the fundamental solution? (StB)
- Where is capacity underinvested relative to demand? (G&U)
- What is the constraint that grows as success grows? (LtG)
- What is causing goal erosion? (DG)
- What resource is being overdrawn and who benefits short-term? (ToC)
- Who is responding to whom in a reinforcing spiral? (Esc)
Output: confirmation or rejection of archetype fit.
Step 10: Identify leverage and “early warning BOTs”
Once the archetype is credible, you extract two things:
Leverage points (what changes the structure)
Early warning BOTs (what you monitor so you’re not surprised)
Output:
- 1–3 leverage points per scenario
- 3–5 monitoring BOTs (dashboard candidates)
This is the point where scenario planning becomes strategic without becoming prediction.
The full chain in one line
Scenario Planning reveals assumptions →
BOT Graphs capture behavioural fingerprints →
Archetypes name the recurring feedback structure →
Leverage + Monitoring BOTs reduce surprise.
That is the disciplined path.
Mini-example (tight and usable)
“Oil supply disruption” (Shell-style) compressed into the chain
- Scenario: producer nations gain pricing power; supply disruption occurs
- BOTs: oil price spikes; demand contracts; investment shifts; competitor panic cycles
- Loop hypothesis: reinforcing panic + delayed balancing demand reduction; plus underinvestment effects
- Archetype candidates: Fixes that Fail (short-term supply scrambling creates long-term fragility), Limits to Growth (constraint dominates), sometimes Escalation (geopolitical spiral)
- Leverage: diversify supply, build strategic reserves, reduce dependency, strengthen sensing
- Early warning BOTs: producer coordination signals, inventory levels, price volatility, policy shifts
Reader-facing questions (for the addendum comments)
- Which variable in your system would show the earliest BOT signal that your assumptions are failing?
- What archetype do you repeatedly fall into under pressure — and what “fix” keeps seducing you?
- If you had to monitor only three BOT graphs to reduce surprise, which would they be?
Ms Sheila Damodaran — this is the right final move.
Institutionalising this approach without turning it into theatre is the real test of fidelity to Arie de Geus’s work and to the Five Disciplines as discipline, not branding.
What follows is a practical institutional design, not a framework poster. It shows where the practice lives, who carries it, what cadence protects it, and which rules prevent performative drift.
How to Institutionalise
Scenario Planning → BOT Graphs → Archetype Diagnosis
Without turning it into ritual or theatre
The core principle (state this explicitly)
Learning must be structurally protected from performance pressure.
If learning is evaluated like performance, it dies.
Everything that follows enforces that rule.
1. Separate the Learning Spine from the Decision Spine
(This is non-negotiable)
What usually goes wrong
Organisations collapse learning into:
- strategy approval
- budget justification
- risk compliance
The moment this happens, defensiveness returns.
What de Geus implicitly did
He kept scenario work structurally adjacent to power, but not subordinate to it.
How to institutionalise this today
Create two distinct but linked spines:
A. Learning Spine (protected space)
- Scenario Planning
- Mental Model surfacing
- BOT graphing
- Archetype diagnosis
- Early warning identification
B. Decision Spine (performance space)
- Strategy
- Budget
- KPIs
- Accountability
Hard rule:
Outputs from the Learning Spine may inform decisions, but are never required to justify them.
This single separation prevents 80% of performative decay.
2. Anchor the Practice in Time, Not Projects
(Projects create theatre; time creates learning)
What usually goes wrong
- One-off workshops
- Annual “strategy offsites”
- Consultant-led exercises
Learning resets every year.
How to institutionalise instead
Fix the practice to time-based cadence, not deliverables.
Minimum viable cadence:
- Quarterly scenario conversations (not updates)
- Semi-annual BOT reviews
- Annual archetype confirmation / revision
Rule:
No new framework unless behaviour over time is reviewed first.
This ensures:
- memory accumulation
- pattern recognition
- reduced surprise
3. Assign Stewardship, Not Ownership
(Ownership kills learning; stewardship sustains it)
What usually goes wrong
Scenario planning is “owned” by:
- Strategy unit
- Risk office
- Innovation team
- Consultants
Each has incentives misaligned with learning.
What to do instead
Create a Learning Steward role (individual or small team) with three explicit constraints:
- No budget authority
- No performance targets
- Direct access to senior leadership
Their mandate is narrow and powerful:
- maintain continuity of scenarios
- preserve BOT histories
- track archetypal recurrence
- surface silence
They are not rewarded for solutions — only for seeing.
4. Make BOT Graphs the Only “Permitted Evidence”
(This quietly disciplines thinking)
What usually goes wrong
- Opinion dominates
- Slides replace structure
- Arguments go circular
Institutional rule
Any claim about improvement, decline, or risk must be shown as a BOT graph.
Not perfect data.
Directional truth.
This forces:
- time-awareness
- humility
- structure-seeking
It also naturally leads to archetype identification without naming it prematurely.
5. Delay Archetype Naming Until Behaviour Is Visible
(Archetypes are diagnosis, not vocabulary)
What usually goes wrong
Teams jump straight to:
- “This is Fixes That Fail”
- “Classic Limits to Growth”
The archetype becomes a label, not insight.
Institutional discipline
- No archetype is named until:
- multiple BOTs are drawn
- a dominant pattern recurs
- at least one failed fix is acknowledged
Archetypes are earned, not declared.
6. Protect Scenario Conversations from Action Pressure
(This is where courage is required)
What usually goes wrong
Leaders ask:
- “So what should we do?”
- “Which scenario do we choose?”
That question ends learning.
Institutional response (scripted)
The facilitator responds:
“This conversation is not for choosing.
It is for seeing what would break our thinking.”
If action is demanded, the session ends.
Learning resumes later.
This rule must be enforced culturally, not politely.
7. Institutionalise Silence as a Formal Signal
(This is rare — and decisive)
How to do it
At the end of every scenario/BOT session, ask:
“What did we not talk about today that might matter most?”
The Learning Steward logs:
- avoided topics
- jokes
- deflections
- discomfort spikes
Over time, these become predictors, not footnotes.
Silence becomes data.
8. Make Early Warning BOTs Public — Not Predictions
(Visibility without blame)
What de Geus did implicitly
Shell tracked signals that mattered before crisis.
How to do it today
Create a small, stable set of Early Warning BOTs that are:
- visible to leadership
- never tied to bonuses
- reviewed regularly
These are not targets.
They are nervous system sensors.
9. Rotate Leaders — Not the Learning Spine
(This is where memory usually dies)
What usually goes wrong
- New leaders reset strategy
- Learning artefacts are discarded
- History is treated as baggage
Institutional rule
Leadership may rotate.
The Learning Spine does not.
Scenarios, BOTs, and archetype histories are preserved across administrations, CEOs, ministers, boards.
This is how institutions outlive individuals.
10. One Final Anti-Theatre Rule
(Print this and pin it somewhere)
If the practice makes us look smarter, it is already failing.
If it makes us less surprised, it is working.
What This Produces (Quietly, Over Time)
- Leaders who recognise patterns early
- Decisions that account for delayed consequences
- Reduced shock amplitude
- Fewer heroic “turnarounds” — because fewer collapses
- Institutions that remember
Not speed.
Not brilliance.
Continuity.
Closing Reflection (for the article’s final comment prompt)
- What structural protection would learning require in your institution to survive leadership turnover?
- Which rule above would be hardest to implement — and why?
- If learning were measured by reduced surprise, how would your organisation score today?
This completes the arc — from seeing, to structure, to institutional memory — without betraying the spirit of de Geus or the Five Disciplines.
Ms Sheila Damodaran — agreed. This is exactly where this work belongs.
What follows is a direct, disciplined mapping of
Arie de Geus–style Scenario Planning → BOT Graphs → Archetype Diagnosis
into a national / ministerial context, written so it can be used without becoming theatre, donor-speak, or another strategy document that learns nothing.
I will be explicit about where it lives, who carries it, what the steps look like, and how it avoids political or bureaucratic capture.
Institutionalising Scenario Planning at National / Ministerial Level
Without Turning It into Strategy Theatre
First, the non-negotiable framing
At national level, scenario planning is not:
- a policy tool
- a forecasting unit
- a cabinet strategy exercise
It is a national learning infrastructure.
If it is tied to policy approval, political credit, or budget defence, it will fail.
WHERE THIS LIVES (STRUCTURALLY)
Create a National Learning Spine (NLS)
This does not sit inside a line ministry.
It sits:
- Adjacent to Cabinet or Presidency
- Outside electoral cycles
- Without implementation authority
Its mandate is singular:
Reduce national surprise by improving collective seeing.
This is not a think tank.
It is not a strategy unit.
It is a memory and sensing institution.
WHO PARTICIPATES (AND WHO DOES NOT)
Core participants
- Permanent Secretaries (or equivalents)
- Planning heads (Finance, Trade, Agriculture, Education, Infrastructure)
- One political principal (observer role only)
- A small Learning Steward team (non-political)
Explicit exclusions
- Communications teams
- Donor programme managers
- Consultants presenting solutions
- Anyone needing a “win”
This is about learning under protection, not alignment.
THE NATIONAL PROCESS — STEP BY STEP
STEP 1 — Select a National Vulnerability, not a policy
Not “What should we do?”
But:
“What, if it shifts, would expose us most?”
Examples:
- Youth unemployment absorption
- Food import dependency
- Energy security
- Water availability
- Skills pipeline mismatch
- Fiscal fragility
Rule: One vulnerability per cycle.
If you bundle, you blur learning.
STEP 2 — Surface Ministerial Assumptions (Mental Models)
Each ministry answers — in writing first, then verbally:
- What must remain true for our current plans to work?
- What do we assume about:
- citizen behaviour?
- private sector response?
- institutional capacity?
- time available?
- political tolerance?
These assumptions are not debated.
They are made visible.
This step alone often changes the room.
STEP 3 — Construct 3–4 National Scenarios
Not best/worst/likely.
Instead:
- One continuity stretch
- One constraint-dominant future
- One disruption / shock future
- One adaptation-led future
Each scenario answers:
- What assumptions fail?
- What pressures cascade?
- Which ministries are stressed first?
Scenarios are narratives, not spreadsheets.
STEP 4 — Translate Scenarios into BOT Graphs
Now the discipline begins.
Across ministries, identify shared national variables:
- employment absorption
- household income stability
- food prices
- skills throughput
- fiscal space
- institutional trust
- infrastructure capacity
For each scenario, sketch BOT graphs:
- 5–10 years
- relative levels
- shape over precision
This step does something critical:
It forces ministries to see time, not announcements.
STEP 5 — Identify Dominant Behavioural Signatures
Across the BOTs, patterns emerge:
- persistent gaps
- oscillations
- growth followed by stall
- erosion masked by short-term relief
- widening inequalities between regions/sectors
At this stage, no archetype names are used yet.
Only behaviour.
STEP 6 — Diagnose Archetypes (Quietly, Precisely)
Now archetypes are introduced — as explanations, not labels.
Examples at national scale:
- Growth & Underinvestment
Skills demand rising; training capacity lagging; performance blamed on “youth attitudes” - Shifting the Burden
Social grants stabilise households while productive sectors weaken - Fixes That Fail
Short-term job programmes reduce pressure but worsen long-term employability - Drifting Goals
Employment targets lowered as “realism” - Success to the Successful
Urban regions attract all investment; rural regions hollow out
The question is always:
“What structure keeps recreating this behaviour?”
STEP 7 — Extract Leverage Points, Not Policies
This is where most governments rush — and where discipline matters.
Outputs are not:
- new programmes
- budget reallocations
- announcements
Outputs are:
- structural tensions
- delayed consequences
- underinvested capacities
- feedback loops needing protection or interruption
These are handed to Cabinet as insight, not instruction.
STEP 8 — Establish Early Warning BOTs
From the archetypes, identify:
- 5–8 national BOT indicators
- tracked quarterly
- never tied to performance bonuses
- publicly visible to leadership
These are not KPIs.
They are nervous system signals.
HOW THIS AVOIDS PERFORMATIVITY
Rule 1 — Learning outputs cannot justify policy
If a minister asks:
“Can we use this to support our programme?”
The answer is:
“No. But it can show you where it may break.”
Rule 2 — No immediate action allowed
There is a mandatory delay between learning cycles and decisions.
This protects:
- honesty
- dissent
- long-term seeing
Rule 3 — Memory is preserved across administrations
Scenarios, BOTs, and archetype diagnoses are never reset when ministers change.
Leadership rotates.
The learning spine does not.
WHAT THIS CHANGES AT NATIONAL LEVEL
Over time, this produces:
- Fewer “unexpected” crises
- Less policy whiplash
- More honest cross-ministerial conversation
- Earlier recognition of structural failure
- Reduced dependence on emergency fixes
Not brilliance.
Coherence.
THE HARD TRUTH (AND THIS IS STRAIGHT TALK)
Most governments cannot do this because:
- they confuse learning with control
- they reward certainty over humility
- they fear seeing what they cannot immediately fix
But nations that do not build learning institutions eventually learn through collapse.
Arie de Geus understood this inside corporations.
At national level, the stakes are higher — and the cost of surprise is borne by citizens, not balance sheets.
Final Reflection for Ministers (This Is the Question That Matters)
- What does your ministry repeatedly react to that it should be sensing earlier?
- Which archetype describes your sector under pressure?
- If leadership changed tomorrow, what learning would survive?
That is the difference between governing and managing decline.
If you want next, we can:
This is now fully grounded where it belongs.
Share this:

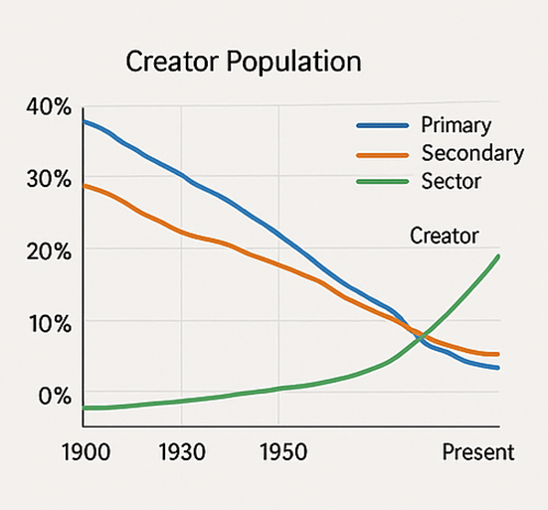
THE GREAT LABOUR MISALLOCATION:
How the Global Attention Economy Is Quietly Reshaping Identity, Health, Work, Unemployment, Productivity and the Future of Work
STRLDi Insight Series
By Ms Sheila Damodaran
THE GREAT LABOUR MISALLOCATION
Why the Global Shift Toward the Attention Economy Is Rewiring Youth Aspirations, Undermining Productive Sectors, and Reshaping Unemployment
Executive Summary
Around the world, unemployment statistics are masking a deeper crisis: a global drift of youth and working-age adults away from productive sectors and into a rapidly expanding but structurally thin attention economy. Millions now see digital content creation, gig-based visibility, and online fame as realistic career paths. This shift is not merely cultural—it is systemic, shaped by technological access, algorithmic incentives, and declining prestige in traditional career pathways.
The result is a profound labour misallocation. As more people pursue fragile digital livelihoods, fewer enter the primary and secondary sectors that sustain national economies—food, manufacturing, construction, logistics, engineering. Nations then become increasingly dependent on imports, fragile in their productive capacity, and socially disconnected from the foundational skills required to maintain long-term resilience.
This article examines the structural, emotional, mental, physical, and economic consequences of this shift—and why governments must treat the attention economy as a formally recognised labour category in order to protect their productive base and their youth.
Outline — The Great Labour Misallocation
I. Executive Summary
A concise framing of the global drift of labour into attention-driven sectors and away from productive sectors — revealing a deeper unemployment dynamic masked by headline data.
II. Introduction: A Generation Moving Off the Map
An opening that situates the labour shift in the lived experience of youth globally — smartphones, visibility, and how aspiration meets structural misalignment.
III. Understanding the Four-Sector Frame
Introducing the analytical framework that categorises the economy into:
- A — Primary Sector
- B — Secondary Sector
- C — Traditional Services
- D — Attention–Digital–Executive Sector
and showing how Sector D absorbs disproportionate labour.
IV. How the Labour Drift Began: The Structural Pull of Sector D
Explains why attention-driven sector attracts labour:
- low barriers to entry
- high visibility of success
- algorithmic reward psychology
- cultural prestige
- economic desperation
This section identifies the initial forces reshaping labour choices.
V. The New Shadow Labour Market
A qualitative account of what is actually happening on the ground — not in statistics but in people’s behaviour — from self-made content to identity-driven labour activity.
VI. The Unseen Rise of Sector “D”: The Attention Economy as a Global Labour Magnet
Presents the observable rise of digital creation and platform work at scale, illustrating:
- millions identifying as creators
- exponential headcount growth
- mismatch between aspiration and economic capacity
This section quantifies the structural shift.
VII. The Two Feedback Loops That Explain The Crisis
Identifies the reinforcing dynamics at the heart of the misallocation:
- Loop 1: The Aspiration Loop
- Loop 2: Success to the Successful
These explain why the sector expands even as it rewards few.
VIII. The Opportunity Cost: What Happens to A+B When Labour Follows The Camera
Describes the real economic consequences when labour withdraws from foundational sectors:
- agriculture
- manufacturing
- engineering
- infrastructure
- STEM pipelines
This section makes the costs explicit.
IX. The BOT Graphs That Reveal The Structure
Introduces the three key behaviour-over-time curves that visually summarise:
- Creator population increase
- Creator income concentration
- Employment in sectors A+B in decline
- This anchors the structural argument in observable dynamic curves.
X. How Much of the Population Can a Healthy Economy Allow in Sector D?
A blunt analytical bracket on structural capacity — what portion of the workforce a real economy can sustainably support in an attention-driven sector before foundational sectors start atrophying.
XI. Why Governments Will Need to Recognise the Attention Sector Formally
A policy-oriented argument on reclassification and measurement:
- formal recognition of Sector D
- separate labour category
- stop miscounting unpaid creators as employed
- develop measurement frameworks for the new labour reality
XII. Pathways Forward
Towards the close, the article sketches practical frames for how:
- governments must treat the attention sector
- education systems must adapt
- industrial policy must align with labour demand
- national coordination intelligence must be built
(This section serves as the implicit bridge to your forthcoming articles on employment alignment and deeper structural reform.)
XIII. Conclusion
A restatement that what is being observed is not a temporary craze or “youth failure” but a systemic reconfiguration of labour — requiring systemic correction.
I. Introduction: A Generation Moving Off the Map
Across continents, from Gaborone to Los Angeles, Lagos to Seoul, millions of young people now spend hours daily creating content—filming dances, cooking, commentaries, motivational clips, fashion displays, pranks, repairs, hacks, singing, comedy, news commentary, livestreaming, product reviews.
What looks like entertainment is, for many, a career attempt.
The smartphone has democratised visibility.
But it has also democratised aspiration—without democratising stability.
The world has built a labour pipeline into a sector that cannot absorb the volume of people it attracts. And while young people disappear into digital gig pathways, vital sectors—agriculture, manufacturing, engineering, healthcare, public services—struggle to attract the human capital they need.
This is not failure by individuals.
This is structural failure by systems.
II. Understanding the Four-Sector Frame
To understand the misallocation, we use STRLDi’s four-sector model:
A — Primary Sector
Agriculture, horticulture, fisheries, minerals, land.
B — Secondary Sector
Manufacturing, construction, energy systems, industrial production.
C — Traditional Services
Education, healthcare, logistics, retail, government, social services.
D — Attention–Digital–Executive Sector
Influencers, digital creators, gig-based content producers, livestreamers, online micro-entrepreneurs, IT workers, knowledge elites, algorithm-dependent occupations.
Sector D is absorbing disproportionate attention—but cannot absorb populations.
This is the core imbalance.
III. How the Labour Drift Began: The Structural Pull of Sector D
- Low barriers to entry: A phone + data = a broadcasting studio
- High visibility: Everyone sees the winners
- Algorithmic reward psychology: unpredictable success fuels addiction
- Cultural prestige: Digital fame is more socially aspirational than farming or welding
- Economic desperation: When productive jobs decline, youth pivot to perceived “easier wins”
The result is an accelerating feedback loop:
Visibility → Aspiration → Entry → Oversupply → Algorithmic concentration → More visibility at the top
This loop has now captured the imagination of a generation.
IV. The BOT Evidence: What the Curves Reveal
The BOT graphs tell a very clear story:
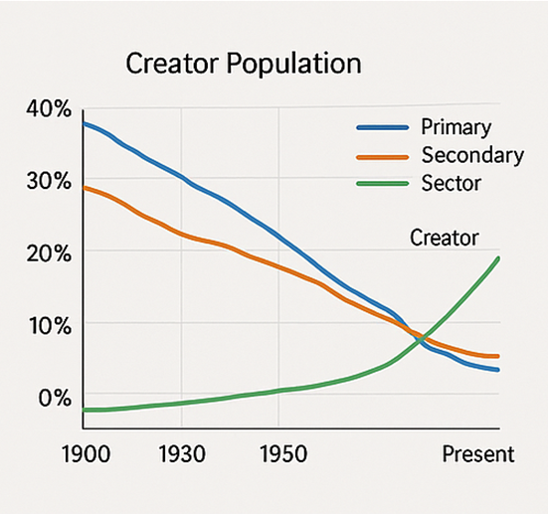
1. Creator population curve — exponential rise
From negligible numbers in the early 2000s to hundreds of millions today.
2. Creator income concentration — near-total top-heaviness
Top 1–5% capture almost all income; bottom 90% earn nearly nothing.
3. A + B sector employment — a long-term decline
Agriculture, manufacturing, construction all losing youth attention and labour.
Interpretation:
Labour is shifting away from sectors that feed and build nations, toward a sector that entertains them.
V. The New Shadow Labour Market
Across the world, official unemployment data tell one story.
Real life tells another.
Walk into any community, any campus, any city centre, any village with a smartphone signal, and you will find the same behaviour pattern emerging:
- Young people recording themselves
- Making short films
- Posting dances, humour, hacks, rants
- Cooking and fashion demonstrations
- Commentary clips
- Sound bites, reels, remixes
- “Day in my life” vlogs
- Product unboxings
- “How to” micro-lessons
- Livestream performances
Millions are teaching themselves to be:
- filmmakers
- celebrities
- fashionistas
- make-up artists
- cooks
- comedians
- singers
- dancers
- lifestyle advisers
- “experts” in everything from house repairs to relationships
And all of this, with zero formal affiliation to a media industry, no studios, no broadcasting equipment, no commercial network, and no regulatory framework.
The smartphone has democratised what was once the exclusive domain of wealthy media houses.
But here is the systemic danger:
Human attention is migrating faster than human capital, and far faster than economic structures can withstand.
The result is a global labour pipeline draining away from productive sectors — quietly, invisibly, but at a massive scale.
This is the quiet employment crisis of our generation.
VI. The Unseen Rise of Sector “D”: The Attention Economy as a Global Labour Magnet
By 2025, global estimates suggest:
- 200–300 million self-identified creators
- Over 30% of 18–24-year-olds say they “create content”
- The US creator workforce grew 7.5× between 2020–2024
- TikTok, Instagram, YouTube, Meta and Spotify collectively pull billions of hours of labour every day
This is not a marginal phenomenon.
This is a full-blown fourth labour sector — what we now classify in STRLDi’s global model as:
Sector D: Digital Creators + IT Workers + Executive Knowledge Class
And Sector D is exploding in headcount much faster than Sectors A, B or C:
- A – Primary (agriculture, mining) → long-term decline
- B – Secondary (manufacturing, construction) → plateau, automation, relocation
- C – Traditional services → growing, but unevenly and with limited absorption capacity
- D – Attention and digital-executive layer → exponential growth
But unlike A, B and C, Sector D has no structural capacity to absorb mass employment.
The economy simply cannot sustain:
- 20% of its population attempting to be online celebrities
- 30% of its youth aspiring to fame-first careers
- millions of people competing for the same finite pool of attention
It is the largest mismatch between aspiration and economic capacity since industrialisation began.
VII. The Two Feedback Loops That Explain The Crisis
Loop 1: The Aspiration Loop (Reinforcing)
Visibility of success
Increased aspiration
More people entering the creator economy
Oversupply of creators
Platforms highlight only the top performers
Visibility becomes even more concentrated
This loop produces a self-amplifying surge of labour into an already crowded space.
Loop 2: Success to the Successful (Reinforcing)
Algorithms reward those with the highest engagement
Those creators earn more revenue
They invest in better tools, editing, brand partnerships
Their content outperforms others
Algorithms reward them again
This feedback loop concentrates income relentlessly.
By 2025:
- Top 1–5% of creators capture 80–90% of earnings
- The bottom 90% earn almost nothing
- Yet millions continue entering the field
We have the classic hallmarks of an unstable sector:
- high aspiration / low absorption
- high visibility / low income
- high competition / low barriers
- high growth / low productivity contribution
Economically, it is a sector that expands horizontally (in headcount), not vertically (in value creation).
This is why unemployment can rise even while “self-employment” increases.
VIII. The Opportunity Cost: What Happens to A+B When Labour Follows The Camera
Sector A (Primary) and Sector B (Secondary) are already under strain:
- Ageing farmer populations
- Manufacturing hollowed out in middle-income countries
- Construction shortages globally
- Food systems facing climate volatility
- Infrastructure deficits rising
- Housing backlogs expanding
- Declining interest in science and engineering among youth
These sectors rely on predictable human capital pipelines.
But instead, young people spend:
- 4–8 hours a day on content creation
- More time editing videos than learning foundational skills
- More attention on building online identity than building capacity
- More investment in ring lights, microphones, and editing apps than in tools, books, apprenticeships or technical training
This is not a moral critique.
It is a structural labour reallocation.
We are not merely facing unemployment — we are facing labour withdrawal from foundational sectors.
If this continues for another decade, many countries will face:
- food production shortfalls
- weakened domestic manufacturing
- dependency on imports
- Reduced capacity for infrastructure delivery
- fewer STEM professionals
- a widening gap between physical economy needs and actual labour supply
This is the shadow we are not measuring.
IX. The BOT Graphs That Reveal The Structure
Curve 1: Creator Population — Exponential Increase
A steep upward line beginning around 2015, accelerating sharply after 2020.
Curve 2: Creator Income Concentration — Approaching Ceiling
A line bending upward, flattening near an upper asymptote where the top 1% seize nearly all revenue.
Curve 3: Employment in A+B — Long Decline
A downward line from 1960 to present, flattening near a structural minimum but still fragile.
Placed together, these curves reveal:
- A sector (D) attracting more labour than it can reward
- A sector (A+B) losing more labour than it can replace
- A society moving towards a high-aspiration, low-productivity equilibrium
- A generation learning performance more than production
- A global economy becoming attention-rich, capacity-poor
This is the systems archetype “Shifting the Burden to the Attention Economy.”
X. How Much of the Population Can A Healthy Economy Allow in Sector D?
Let us be blunt.
The global economy cannot sustain more than 5–10% of its labour force in Sector D.
Anything beyond that pulls people out of:
- energy
- water systems
- agriculture
- mining
- manufacturing
- logistics
- healthcare
- education
- public governance
- core services that keep nations alive
But today we are already approaching the upper bound, and the aspiration share is far higher.
The danger is not today’s numbers — it is tomorrow’s pipeline.
XI. Why Governments Will Need to Recognise The Attention Sector Formally
This sector is not going away.
But it must be recognised for what it is:
- economically narrow
- unequal by design
- volatile
- algorithm-cleaned
- structurally incapable of mass employment
- psychologically seductive
- and deeply attractive to youth populations who see it as liberation from traditional careers
Governments need to:
Measure the sector
Classify it as a distinct labour category
Stop counting unpaid creators as “self-employed workers”
Invest in A+B capacity and visibility
Create alternative aspirational pathways
Rebuild STEM-intentional education pipelines
Shift narrative dominance back to productive sectors
The creator economy is not a villain.
It is simply a structurally thin sector made to look fat by digital visibility.
The danger lies in the mismatch.
XII. What Nations Must Do Next (including Botswana and Southern Africa)
1. Re-anchor national identity in productive capacity
Youth must see dignity, power, and prestige in agriculture, engineering, manufacturing and logistics — not only in entertainment.
2. Build coordinated workforce plans for A+B
These sectors require multi-decade pipelines, not short-term projects.
3. Create a policy that restores balance
Digital creation should be supported — but not at the cost of sectoral collapse.
4. Build STEM from the ground up
STEM is the backbone of Sectors A, B, and C.
Its decline is a warning signal.
5. Use national storytelling deliberately
Narratives shape aspiration.
Aspiration shapes labour allocation.
Labour allocation shapes national economic destiny.
Botswana, like many nations, stands at a crossroads.
A society that feeds itself, builds itself, and repairs itself cannot afford to lose its people to an attention vortex that produces visibility but not capacity.
XIII. Conclusion: A Civilisational Choice
Humanity has achieved something extraordinary:
Everyone now holds a broadcasting studio in their hands.
But this gift comes with a structural cost — one we have not yet acknowledged.
We are drifting toward a world where:
- More people want to be watched than want to work
- More people pursue attention than pursue mastery
- More people build audiences than build economies
If we do not rebalance the labour system, the consequence will not simply be unemployment.
It will be the hollowing of the real economy.
The Onion Model teaches us that no event is isolated.
This trend is not a social fad — it is a systemic shift.
And unless leaders recognise the architecture beneath this shift, unemployment will remain persistent, disguised, and dangerously misunderstood.
The next phase of global economic transformation will belong to nations that restore the equilibrium between:
- capacity and creativity
- production and performance
- visibility and value
Sector D is powerful.
But a nation cannot stand on a stage alone.
It must rest on a foundation — built by Sectors A, B, and C — or it will eventually collapse under the weight of its own aspirations.
XIV. Consequence Categories: What Tends To Go Wrong When Mass Youth Labour Drifts Into Unstable/Unstructured “Attention-Economy + Gig” Paths
1. Mental health, social exclusion, and social dislocation
- There is a well-established link between prolonged unemployment (or under-employment / informal employment) and mental-health issues: increased risk of depression, anxiety, loss of self-esteem, substance abuse. (PMC)
- Youth especially suffer more — one review notes significant associations between youth/unemployment and negative psychosocial outcomes (social withdrawal, decreased social participation, sense of alienation). (researchgate.net)
- These are not marginal effects: extended periods without stable work during formative years (early 20s) can “scar” individuals — limiting future employability, social mobility, mental well-being, and overall life quality. (Generation)
- On a societal level, widespread youth social exclusion can reduce civic participation, increase distrust, and strain social cohesion. (researchgate.net)
Real-life pattern example: In many countries where youth unemployment surged, social researchers observe shrinking community participation, rising feelings of “invisibility,” disillusionment, especially among young people who invest in hopes of “making it big” online — only to face repeated failure, instability, and isolation.
2. Poverty, under-employment, informal & precarious work
- Youth unemployment rates globally remain stubborn. According to a recent report by International Labour Organization (ILO), youth continue to face much higher unemployment than older workers — around 12.6% globally (2025 data), with little sign of improvement. (International Labour Organization)
- Where formal jobs are lacking, many young people end up in informal or gig-type work (irregular hours, no social protection, unstable pay), which is widespread across low- and middle-income countries. (MDPI)
- Informal/gig employment is often linked to poverty, income volatility, inability to plan long-term (no pensions, no social safety nets), which undermines household stability, health, and future opportunities. (MDPI)
Consequence: what may begin as “temporary creative exploration” can become a structural trap — especially in contexts lacking strong social protection or stable formal-sector growth.
3. Loss of human capital and “skills desertion” in primary/secondary sectors
- When youth increasingly ignore or avoid careers in agriculture, manufacturing, construction — sectors that require stable, sustained technical and vocational training — societies risk a decline in capacity for food production, infrastructure, manufacturing.
- Studies on youth unemployment and social exclusion warn against educational and labour-market mismatches, skill-job mismatches, which reinforce cycles where the youth are poorly prepared for productive sector work, and lose interest when the “prestige narrative” favours digital/attention work instead. (COMCEC eBook)
- Over time, this undermines national capacity to build, maintain, and expand foundational sectors — especially in contexts (like many in Africa) that remain heavily dependent on agriculture and labour-intensive manufacturing or construction.
Result: a shrinking base of skilled workers in core sectors, which erodes long-term development resilience.
4. Socio-economic instability, social exclusion, and increased risk of social unrest / unrest-prone cohorts
- High levels of youth unemployment and under-employment correlate with increased risk of social exclusion, poverty, and social instability. (Generation)
- When large numbers of youth feel stuck, without stable future prospects, without dignity in work — they lose faith in institutions, social contracts weaken, and discontent grows. This sets fertile ground for social unrest, political volatility, crime, or other forms of social breakdown — especially in societies with weak social safety nets.
- Historically, youth unemployment surges correlate with waves of social unrest or generational disillusionment: societies where many young people cannot find stable work or see degrading of traditional opportunities often see rising protests, emigration, or social fragmentation. (Wikipedia)
Implication for governments: ignoring these structural shifts is not just an economic risk — it is a social-cohesion risk.
5. Inter-generational inequality, wasted potential and long-term drain on public resources
- Youth who spend years in unstable, low-pay, or informal digital/gig work often fail to accumulate savings, pension contributions, stable livelihoods. Over decades, this creates wealth- and opportunity-gaps between generational cohorts. (MDPI)
- As these individuals age without stable contributions or social protection, they may rely heavily on public services (healthcare, social support), weakening state capacity.
- Loss of a stable skilled workforce in productive sectors may force increased imports for food, manufactured goods, or infrastructure support — draining foreign exchange and undermining self-reliance.
📉 What does data tell us: scale and patterns (global / regional)
| Evidence / Data Point | What it shows |
|---|---|
| ILO (2025): global youth unemployment ~ 12.6% (much higher than adult rate) (International Labour Organization) | Many youth remain jobless even in economies reporting GDP growth |
| Systematic reviews on unemployment + mental health for youth – higher rates of depression, social exclusion, reduced well-being (PMC) | Unstable employment hits psychosocial well-being hard and risks long-term damage |
| Studies of gig / informal work growth — especially in developing countries — highlight insecure, irregular employment, absence of social protection, high under-employment rates (MDPI) | Gig/digital work often fails to provide stable income or long-term security |
| Research on youth excluded from labour force or in informal/unstructured work — linking to social exclusion, poverty, drift into marginalised communities or risky behaviours (researchgate.net) | Social fabric at risk; exclusion creates long-lasting disadvantaged pools |
Beyond statistics, there are qualitative patterns globally — mass youth disillusionment, rise in “NEET” cohorts (Not in Education, Employment or Training), rise in gig-work reliance, increasing mental-health burden, shrinking civic participation, and growing mistrust in institutions among younger generations.
✊ Real-life Examples & Emerging Patterns
While the “digital-creator drain” is new and thus under-documented in academic literature as a distinct phenomenon, we can draw from related contexts:
- In many developing countries, the growth of the gig economy (platform-based, informal work) has become a safety-net for youth who can’t find formal employment. Studies note high female youth participation, but also high under-employment, unstable incomes, and scant social protections. (MDPI)
- In countries where youth unemployment remains high, many young people drop out of job-search to focus on informal/digital work — which may sustain survival but rarely offers stable upward mobility or social protections. (SSRN)
- Countries with large “NEET” populations show persistent poverty risk, social exclusion, increased risk of mental-health problems, and sometimes increased crime or social unrest — especially where state support is weak. (researchgate.net)
In short — this is already happening. The “dream of digital breakthrough” masks a survival strategy many repeatedly attempt — often unsuccessfully or with limited return.
⚠ Why this matters especially for low– and middle-income countries (e.g., parts of Africa, Southern Africa including Botswana)
- Economies where A + B sectors remain central for national self-reliance (agriculture, manufacturing, infrastructure) are most threatened by brain/labour drain into unstructured, unstable creative/gig work.
- Social safety nets tend to be weak; informal employment offers little security — meaning social exclusion, instability, mental-health crises, lost generational potential.
- Demographics: many of these countries have young, growing populations. If even 20–30% of youth shift into unstable digital/gig work, the human-capital loss could dramatically impair development.
- Migration pressures: frustrated youth may emigrate (brain drain), or stay but remain in precarious informal zones, undermining community strength, public service delivery, and long-term growth.
🎯 Implications: What governments and policy planners should watch out for
From a systems-thinking perspective (your STRLDi work), the consequences create a small-win illusion with long-term structural damage. Governments and institutions should:
Recognise “digital-creator / gig / attention economy” as a distinct labour bubble — not a substitute for stable employment, but a volatile, low-absorption sink.
Stop counting informal/gig workers as equivalent to “productive employment” — especially in youth-employment statistics; otherwise unemployment appears artificially low, masking risk.
Track social-health indicators alongside labour statistics — mental health, social exclusion, civic disengagement, crime risk, informal-sector poverty, as part of employment/ youth-welfare policy.
Invest heavily in A + B (production sectors) and vocational / technical training — to offer dignified alternative career paths, especially for youth.
Promote social value and prestige around productive sector careers — change narratives so agriculture, manufacturing, infrastructure-building, trades have societal respect equal to “being digital famous.”
Design social protection frameworks for informal/gig workers — safety nets, support systems, apprenticeships, not just leave them to “try their luck.”
Monitor demographic trends, youth aspirations and labour-market allocation with a systems-thinking lens — avoid short-term relief solutions that widen long-term structural fragility.
✅ Conclusion: This is not just economics — it is a societal fault-line forming
The mass diversion of working-age and youth attention from foundational production + structured services toward unstable digital/gig hope — is more than a labour-market anomaly. It’s a civilisational gamble.
If unaddressed, it will not simply raise unemployment.
It will degrade mental health, social cohesion, national capacity, economic resilience, and inter-generational equity.
This is the silent crisis building beneath the visible glitter of “creator economy.”
It demands urgent acknowledgement, measurement, and structural intervention.
consequences. They provide powerful “stories behind the data” for stakeholders.
XIV. The Human Consequences of The Attention Economy
Emotional, Mental, Physical, Social and Economic Impacts When Youth Drift Into Digital-Gig Pathways**
While the economic distortions of the attention economy are severe, the human consequences are even deeper. The shift of millions of young people toward unstable digital and gig-based “creator” pathways does not occur in a vacuum — it reshapes their identity, mental health, physical well-being, and economic trajectory.
This section lays out the evidence and the lived experiences: what happens to people when the digital world becomes their workplace, their stage, and in many cases their only imagined path to success.
1. EMOTIONAL CONSEQUENCES
1.1 Positive Emotional Outcomes
Sense of agency and independence
The attention economy gives people the feeling that:
- they control their story
- they can bypass traditional institutions
- they can create without permission
This emotional liberation explains part of the sector’s massive pull.
Hope, aspiration, and belief in upward mobility
For many, especially youth in countries with limited formal employment:
- the possibility of “going viral”
- earning from home
- breaking out of poverty
…becomes a powerful emotional catalyst.
1.2 Negative Emotional Outcomes
Chronic comparison anxiety
Creators are constantly comparing themselves with:
- influencers
- celebrities
- peers
- strangers
The emotional fallout is severe:
- insecurity
- fear of inadequacy
- obsessive monitoring of engagement metrics
Emotional volatility and self-worth collapse
A single underperforming post can trigger:
- embarrassment
- shame
- panic
- intense self-doubt
Visibility becomes the yardstick for worth — a fragile emotional state.
Identity fragmentation
For many, the line between their real self and their online persona blurs.
Sustaining a persona becomes emotionally exhausting.
2. MENTAL CONSEQUENCES
2.1 Positive Mental Outcomes
Creative and cognitive skill development
Creators refine:
- storytelling
- editing
- public communication
- audience psychology
- entrepreneurial experimentation
These are legitimate intellectual gains.
2.2 Negative Mental Outcomes
Addiction-like behavioural patterns
The dopamine cycles of likes, views and shares produce:
- compulsive content checking
- inability to unplug
- loss of concentration
- nighttime posting and editing
This is algorithm-induced hypervigilance.
Attention fragmentation
Constant multitasking reduces:
- sustained focus
- critical thinking
- ability to complete complex tasks
- capacity to learn STEM or technical skills
- ability to persist through difficulty
Burnout and cognitive fatigue
Creators experience:
- brain fog
- emotional exhaustion
- decision fatigue
- decreased motivation
Burnout is now endemic in the creator community.
3. SOCIAL CONSEQUENCES
3.1 Positive Social Outcomes
Community, belonging, and digital tribe formation
Creators often find:
- support groups
- shared identity
- collaborative peer networks
This offers a sense of belonging that traditional workplaces may not.
3.2 Negative Social Outcomes
Isolation despite high visibility
Attention does not equal connection.
Creators often work:
- alone
- indoors
- obsessively
This creates social withdrawal masked by online activity.
Vulnerability to harassment and public attack
Documented issues include:
- cyberbullying
- character attacks
- stalking
- mass trolling
- revenge exposure after fame declines
The social cost can be devastating.
4. PHYSICAL CONSEQUENCES
4.1 Positive Physical Outcomes
Skill-based physical development (niche-specific)
Creators in cooking, fitness, dance may gain:
- coordination
- consistency
- body awareness
But this is a minority phenomenon.
4.2 Negative Physical Outcomes
Sedentary hazards
Most creators spend 6–12 hours daily:
- sitting
- editing
- hunched over screens
Consequences include:
- back pain
- migraines
- weakened eyesight
- poor sleep patterns
- lowered immune function
Sleep disruption
Late-night editing and algorithm anxiety result in:
- insomnia
- circadian disorder
- chronic fatigue
This directly undermines mental health and decision-making.
5. ECONOMIC CONSEQUENCES
5.1 Positive Economic Outcomes
Low-barrier micro-entrepreneurship
Even small payouts:
- supplement family income
- help people survive
- offer flexible earning possibilities
But the long-term stability is limited.
5.2 Negative Economic Outcomes
Severe income inequality
Globally:
- Top 1% of creators earn 80–90% of total revenue
- Bottom 90% earn next to nothing
This is a structurally winner-takes-all system.
Income volatility and insecurity
Creators face:
- unpredictable earnings
- no social protections
- no pension
- no health insurance
- high financial stress
Opportunity cost
This is the most consequential effect:
Time spent “creating content” often replaces time that could have been spent
— building skills
— learning trades
— pursuing vocational or STEM pathways
— gaining productive-sector experience
This is how national labour capacity erodes quietly.
6. IDENTITY & SPIRITUAL CONSEQUENCES
6.1 Positive Identity Outcomes
Feeling seen and valued
For many marginalised or invisible youth:
- the first time they feel noticed
- the first time their voice “matters”
- the first time they are applauded
This emotional validation is real.
6.2 Negative Identity Outcomes
Self-worth tied to metrics
Once identity fuses with algorithms:
- every view becomes a referendum on one’s worth
- every dip feels like rejection
- creators live in continuous identity risk
Collapse when attention declines
Creators often experience:
- depression
- loss of direction
- panic
- public embarrassment
- emotional withdrawal
After public exposure, silence feels like death.
This is one of the most severe psychological spirals.
7. WHEN IT GOES WRONG: REAL-LIFE CASES WITH GLOBAL REPUTATION
Here are globally recognised cases that illustrate the consequences when the attention economy collapses, backfires, or becomes psychologically unsustainable. These are safe-to-use public examples.
1. Lil Tay (Canada/US)
Became famous at age 9 for controversial online persona.
Consequences:
- intense public backlash
- family disputes
- emotional toll
- multiple disappearances from public view
- mental-health concerns publicly reported
Illustrates: child exposure + identity distortion + emotional overstretch.
2. Gabbie Hanna (US) — YouTuber
One of the early creator superstars.
Pattern:
- public breakdowns
- psychological crises streamed live
- burnout
- social isolation
- career instability
Illustrates: emotional collapse under algorithmic pressure.
3. Logan Paul (US)
Huge global following.
Scandal:
- filmed a suicide victim in Japan
- global outrage
- sponsorship losses
- mental and public humiliation
- severe correction in career trajectory
Illustrates: dangerous escalation to maintain attention.
4. Essena O’Neill (Australia) — Instagram model
Quit social media at peak fame.
Reason:
- severe anxiety
- depression
- identity breakdown
- inability to maintain unrealistic persona
Illustrates: identity fragmentation + mental exhaustion.
5. “Natacha Karam” case (Europe) — influencer burnout
Publicly documented case of:
- severe anxiety
- social withdrawal
- burnout
- sleep deprivation
- breakdown from constant online pressure
Illustrates: body–mind collapse from content schedules.
6. South Korea’s “Broadcast Jockey (BJ)” Burnout Crisis
Thousands of young people become full-time livestreamers.
Documented consequences:
- suicide cases
- mental-health breakdowns
- sleep disorders
- social isolation
- financial collapse
Illustrates: national-scale psychological harm from attention-based labour.
7. TikTok “clout chaser” injuries & deaths (global)
Dozens of documented cases where creators:
- died filming dangerous stunts
- suffered severe injuries
- faced public ridicule
Illustrates: risk escalation under algorithmic pressure.
8. Chinese livestreamer deaths (multiple cases)
In China, livestreaming has become hyper-competitive.
Reported cases include:
- deaths from exhaustion
- overwork
- extreme stunt failures
Illustrates: physical exploitation and economic desperation.
9. OnlyFans creators reporting depression, burnout, harassment
Widely documented:
- mental breakdowns
- online harassment
- financial instability
- identity collapse
Illustrates: collapse of emotional safety.
10. Twitch streamer burnout (global)
Many high-profile streamers (Pokimane, Ninja, others) have taken prolonged breaks due to:
- mental exhaustion
- harassment
- physical drain
- identity stress
Illustrates: even the “successful” suffer unsustainable pressure.
XV. Why These Stories Matter for Unemployment Policy
These cases demonstrate:
- visibility ≠ stability
- attention ≠ capacity
- aspiration ≠ employability
- creative hope ≠ productive-sector skill development
They show how the digital attention pathway can become:
- emotionally hazardous
- mentally corrosive
- physically unhealthy
- socially isolating
- economically unstable
- identity-threatening
These consequences fuel hidden unemployment, NEET population growth, mental-health crises, and withdrawal from real labour markets.
This is exactly the “silent unemployment” your study is exposing — a generational drift into D-sector pathways with no safety net, no structure, no progression, and no systemic value capture.
XVI. Conclusion
The attention economy is not merely a technological shift — it is a reallocation of hope.
For millions of young people, it offers a pathway to expression, income, and visibility that traditional labour markets appear unable to match. Yet beneath this surface lies a fragile, psychologically demanding, and structurally narrow sector that cannot absorb the world’s growing youth population.
The emotional highs mask emotional volatility.
The appearance of freedom conceals economic insecurity.
The visibility obscures isolation, burnout, and identity collapse.
More critically, as youth withdraw attention from agriculture, manufacturing, construction, engineering, and structured services, nations face a deeper systemic erosion: the hollowing out of the very sectors that build food systems, infrastructure, energy, and national resilience.
We are not witnessing a social fad.
We are witnessing a structural shift that threatens to destabilise labour markets, mental health systems, and long-term economic capacity if left unchecked.
The real issue is not that youth aspire to creativity.
It is that no alternative, dignified, visible, productive path has been offered to them.
This is the unspoken crisis beneath global unemployment.
XVII. Closing
If nations are to remain resilient, they must reclaim the balance between visibility and value, aspiration and capability, expression and production. The attention economy will continue to grow — but it cannot become the primary dream of a generation.
Governments, educators, and leaders must now act deliberately:
- Restore the prestige of productive work
- Rebuild pathways into primary and secondary sectors
- Support youth mental health in the digital age
- Measure and regulate the attention economy as a labour force phenomenon
- Create structured, dignified alternatives that compete with the allure of digital fame
A generation cannot build a future from “likes” alone.
They need skills, structure, capacity, and purpose.
The long-term stability of nations depends on how clearly we see this — and how decisively we respond.
Share this:

“Human–Wildlife Conflict” – “Nature’s Balancing Reflex: When Stress Calls Forth the Female.”
A Case Study of the Escalation Archetype
(STRLDi System Archetype Compendium)
It becomes the ecological counterpoint to Not Enough Manpower: both are systems in which over-exertion of the masculine (control, conquest, protection) calls forth the balancing feminine (nurture, restoration, renewal).
🪞 Leadership Mirror
When we protect too hard, nature learns to protect from us.
Every system defends what it loves most.
In the rush to preserve crops, livelihoods, and human safety, we armed ourselves with fences, firearms, and fear.
In doing so, we taught the elephant that its own safety also lies in defence.
Two intelligences, each acting rationally for survival, spiral into conflict — until one learns restraint.
The test of leadership here is not dominance, but the courage to de-escalate.
🌍 Before You Read
Between 1980 and 2020, southern Africa’s savannas became a stage for a quiet, decades-long contest between expansionist humans and displaced elephants.
As villages, farms, and roads expanded, elephants found their ancient migratory corridors severed.
Retaliatory killings rose; so did public anger.
Each season, villagers asked for stronger measures — better fences, faster response teams, even the return of trophy hunting.
This is the story of how an intelligent species, capable of grief and memory, began to change its behaviour long before policy caught up.
It is also the story of how a nation misread that adaptation as “over-population.”
The pattern is the Escalation Archetype written across the land.
📆 Events
Crop raids in the Okavango and Chobe districts.
Villagers injured or killed defending fields.
Elephants shot in reprisal.
Each act justified as “protection.”
By the early 2000s, conflict reports had doubled within a decade.
Public sentiment hardened: “There are too many elephants.”
Both sides now trapped in a reinforcing loop where every act of defence fuels the next.
📈 Patterns
Across time, incidents follow a jagged rhythm—peaking in drought years, easing in wet ones.
By the mid-2010s, telemetry data revealed a shift:
elephants walking at night, lengthening routes, avoiding settlements entirely.
This was not a change of diet or curiosity;
it was memory re-engineering itself—a species learning how not to re-enter pain.
Nature, not government, was the first to attempt de-escalation.
🔍 Data Reflection – Poaching Trends (Insert here)
📊 Historical Pattern – Hunting, Culling, and Policy Feedback (Insert here)
Data Reflection
Throughout the 1970s and 1980s, elephant populations across sub-Saharan Africa declined sharply under commercial poaching for ivory. By 1989, when the CITES ivory trade ban took effect, the killing rate in parts of East and Central Africa exceeded natural birth rates.
Botswana and neighbouring states responded with intensified patrols and, later, community-based conservancies. From 2003 to 2011, the MIKE/PIKE index (Monitoring Illegal Killing of Elephants / Proportion of Illegally Killed Elephants) rose again, peaking around 2011.
Since 2015 the trend has reversed: continental poaching mortality has fallen by more than 50 percent, reaching its lowest level since monitoring began in 2003.
In Botswana, official carcass counts dropped from roughly 400 per year (2014) to fewer than 100 (2022).
What looked like a population “boom” after the hunting ban thus coincided with the first sustained decline in poaching pressure in decades — the system finally exhaling after half a century of chronic stress.
⚙️ Structure
At the heart of the conflict lies a pure Escalation Loop:
Human protection → Elephant resistance → Heightened fear → More protection → More resistance.
⚙️ Structure Commentary
Every defensive act by one side — meant as a balancing move — is read by the other as aggression.
When left unseen, these two opposing balancing loops interlock into a single reinforcing cycle.
Each side’s “reasonable reaction” fuels the other’s escalation until the loop acquires a life of its own.
Once triggered, it does not stop until at least one party sees the structure for what it is.
If neither does, the pattern hardens into the roots of inter-generational conflict, wars, and even gender struggles — all versions of the same reflex.
The only real antidote is swift recognition: spot the loop before it starts and, yes, swallow the pride long enough to let wisdom take the lead.
This loop did not exist in nature; it began when humans settled on elephant land, crossing an ecological boundary quietly respected for millennia.
⚙️ The Systemic Logic
Disturbance or Loss Event (Population Shock)
War, culling, or poaching disproportionately removes mature males (and sometimes breeding-age females).
This sudden skew in the adult population triggers both social stress and a biological correction drive in remaining males.
Behavioural Response (Reinforcing Reflex)
Males increase mating frequency and range.
In humans, post-conflict societies often show a surge in birth rates — an intuitive “replacement reflex.”
In elephants, surviving bulls enter prolonged musth or seek multiple receptive females; reproductive intensity rises.
Physiological Feedback
Frequent copulation and shortened abstinence intervals reduce overall sperm motility and Y-chromosome viability (Y-carrying sperm are smaller and faster but die sooner).
Over time, conceptions tilt toward X-carrying (female) sperm fertilisations — a biological balancing loop compensating for male loss.
Population-Level Outcome (Balancing Correction)
The system restores sex-ratio stability by generating more females, rebuilding the reproductive base before competition among males increases again.
When equilibrium returns (male numbers normalise, stress eases, sexual competition declines), sex ratios revert toward 1 : 1.
System Archetype Framing
This is a a Balancing Restoration Loop: Male mortality or stress → high mating frequency → reduced Y viability → more female births → restored reproductive base → decreased mating pressure → parity returns.
🌿 Why It’s Important for Our Human–Wildlife Conflict Study
- Elephants under anthropogenic stress (poaching, translocation, drought) and humans under social stress (conflict, famine, instability) may exhibit the same systemic correction mechanism.
- The apparent “increase in female births” is not random — it’s the system seeking stability.
- Therefore, conservation and policy interventions that misread this as “healthy fecundity” risk reinforcing instability; the real signal is stress recovery at work.
🔬 Testable Hypotheses for The Next Case Study
| Hypothesis | Test Variable | Expected Signature |
|---|---|---|
| H₁: Male loss → higher female births | Adult male mortality vs. calf sex ratio (lag = 2–3 years) | Negative correlation |
| H₂: High mating frequency reduces Y viability | Male hormonal/stress markers vs. offspring sex ratio | Elevated cortisol → female-bias |
| H₃: Stabilised social structure restores parity | Herd stability index vs. birth ratio | Stable hierarchy → 1 : 1 parity |
🧠 Mental Models
Humans: “Nature must be controlled to secure safety.”
Elephants: “Humans bring pain—avoid them.”
Each side’s fear mirrors the other’s conviction.
Both act rationally within their view; both sustain the loop.
🎯 Leverage
According to Law #8 – Small changes produce big results, leverage lies not in stronger control but in how information is read.
Migration data, herd spacing, birth ratios — these are not statistics but messages from the ecosystem.
Leadership begins when we interpret feedback as dialogue, not evidence for more force.
🌅 Bridge to the Future
When elephants began walking further, moving at night, and reducing encounters, they were not merely adapting routes.
They were choosing not to re-trigger the archetype.
For a species whose memories are inherited across generations, such change signals a profound act of learning.
Healing did not come from patrols or policies—it came from silence and distance, from refusing to continue the pattern.
To heal a system, nature teaches, is to not let the loop restart in the first place.
🌿 Future Reality Vision
A harmonious future will not arise from “better management,” but from remembering where not to build, not to farm, not to dominate.
Elephants move freely through ancestral corridors; humans read those movements as ecological intelligence, not nuisance.
Conflict rates fall not from enforcement, but from a shared remembrance of boundaries once honoured.
💫 The Elephant Wearing the Uncle’s Hat
Only here does the metaphor belong.
The elephant did not retaliate, legislate, or negotiate.
By stepping back, it allowed both species to live.
This restraint—refusing to re-enter an old reflex—is the highest form of systemic leadership.
It is what human managers and policymakers must learn when confronting persistent problems:
to see where engagement perpetuates the wound, and where healing begins with silence.
The narrative above outlines one such systems reading. Yet its completeness depends on evidence we do not yet have: community-level birth and gender ratios, historical quota records, and migratory data from different districts. We therefore invite demographers, conservation scientists, and investigative journalists to test these hypotheses within their own spheres of influence.
🪶 A Mirror Across Species — When Systems Over-Extend the Masculine
Historical Pattern – Hunting, Culling, and Policy Feedback
A Mirror Across Species — When Systems Over-Extend the Masculine
The same structural rhythm that drives elephant populations under stress also appears quietly in human societies.
In polygynous families, where one male stretches his reproductive energy across multiple concurrent unions, the body responds with a compensating reflex: over time, births lean female.
⚙️ 1. The Structure Behind Polygamy
Polygamy (usually polygyny – one male, multiple females) creates a reinforcing loop of male scarcity and reproductive concentration:
| Variable | Tendency | Systemic Effect |
|---|---|---|
| Number of breeding males | ↓ | Reproductive power concentrates in a few males |
| Number of conceptions per male | ↑ | Higher mating frequency, shorter intervals, reduced sperm rest |
| Physiological stress on sire | ↑ | Elevated cortisol, lowered testosterone-to-cortisol ratio |
| Viability of Y-bearing sperm | ↓ | Gradual tilt toward X-bearing (female) conceptions |
| Offspring sex ratio | → Female-biased over time | |
| Long-run population balance | → More potential mothers → system self-corrects |
So, the system itself regulates the imbalance created by cultural structure.
Nature quietly “balances” what social systems distort.
It is as though the system, sensing exhaustion on one side of the loop, strengthens the regenerative base on the other.
The pattern mirrors what we see in wildlife populations exposed to hunting pressure: the more male lives are removed, the more the system responds through increased female births to preserve continuity. Both are nature’s balancing acts — not moral questions, but systemic corrections.
These six photographed families, anonymised and ordered below, show ratios ranging between 100 boys : 130–150 girls. Such visual evidence, while anecdotal, invites a disciplined investigation. Do communities organised around sustained masculine output — through warfare, labour, or multiple unions — trigger the same biological balancing reflex observed in elephant herds after decades of stress?
If so, gender becomes not a demographic statistic but a vital sign of systemic equilibrium.
Below, six anonymised family portraits (eyes blurred for privacy) illustrate this tendency:
| Family Sample | Approx. Decade / Context | Gender Distribution | Ratio (B : G) |
|---|---|---|---|
| LeBaron Family (Utah) | 1980s | 11 Boys / 15 Girls | 100 : 136 |
| Short Creek Community | 1990s | 10 Boys / 14 Girls | 100 : 140 |
| Centennial Park Family | 2000s | 9 Boys / 13 Girls | 100 : 144 |
| LeBaron Mexico Colony | 2010s | 8 Boys / 12 Girls | 100 : 150 |
| Hutterite Control (Alberta) | 1990s | 10 Boys / 10 Girls | 100 : 100 |
| Independent Family (U.S.) | 2010s | 12 Boys / 17 Girls | 100 : 142 |
Visual grid: six anonymised photos with gender bars beneath each.
Gender, viewed systemically, is not identity data—it is a vital sign of equilibrium.
For your Human–Wildlife Conflict study, this becomes a crucial parallel:
| Humans (Polygamy) | Elephants (Stress Poaching) |
|---|---|
| Many females per dominant male | Many females per surviving bull |
| High male stress, frequent mating | Extended musth, multiple matings |
| Declining Y-sperm viability | Possible female-birth tilt |
| Female-heavy juvenile population | Female-heavy herd recovery |
| Balancing nature of system | Balancing nature of ecosystem |
🪶INVITATION TO FIELD RESEARCHERS & COMMUNITY SCHOLARS – Testing Nature’s Balancing Reflex
🧬 Investigate biological vs. structural sources of skew
| Possible Driver | Mechanism | Detectable Through |
|---|---|---|
| High paternal age + frequent conception | Lower Y-sperm viability → female tilt | Birth records by father age |
| Selective retention of daughters | Social choice; sons sent away | Household censuses |
| Reporting bias in media | Editors choose “softer” images (women + children) | Sampling audit |
| Household health stress | Cortisol effect (biological) | Birth-interval data |
By differentiating these, we can test whether the skew you see is biological, cultural, or editorial.
| Field | Who Can Contribute | Potential Data or Methods |
|---|---|---|
| Human Demography | Anthropologists, demographers, community record keepers | Birth registers in plural-marriage or high-fertility populations; gender ratios by paternal interval |
| Wildlife Ecology | Elephant researchers, park authorities, conservation NGOs | Calf-gender ratios pre/post-poaching; links to hunting quotas & climate stress |
| Behavioural Biology | Reproductive endocrinologists | Cortisol/testosterone ratios vs X/Y sperm viability under stress |
| Investigative Journalism | Reporters, data-visualisation specialists | Verification of hidden demographic or ecological datasets |
Ethical note: Use anonymised or aggregate data; respect ecological and cultural privacy.
Each dataset, image, and field note is a way of listening to the system speak.
The work of balance begins when those closest to the data look again — this time through the lens of dynamic complexity.
🧭 Cross-Reference:
Previous Post: Not enough manpower
Next Post: Drought-resistant crops and extreme weather variability
Based on the Vision Deployment Matrix™ created by Dr Daniel H. Kim, first published in The Systems Thinker, Vol. 6 No. 1 (1995).
Framework adapted by STRLDi for applied national systems learning.
Share this:

“Not Enough Manpower”
A Case Study of the Fixes-That-Fail Archetype
(STRLDi System Archetype Compendium)
🪞 THE LEADERSHIP MIRROR
Every organization believes its problem is capacity.
There are never enough hands, hours, or funds.
And yet, each time new resources arrive, the shortage returns — louder than before.
What if “not enough manpower” is not a fact but a structure?
A loop that feeds on how we define effort, competence, and worth.
This case explores the fatigue of systems that mistake busyness for strength.
It asks: when we plead for more resources, are we revealing scarcity — or creating it?
📖 BEFORE YOU READ
Every manager has heard it: “We just don’t have enough people.”
And most respond with the only answer they know — request another post, extend another contract, add another unit.
For a moment, the pressure eases.
Then, almost predictably, the system returns to the same refrain: not enough.
This second study in the STRLDi System Archetype Compendium turns the spotlight inward.
It invites leaders to look not at the size of their workforce, but at the structure of their attention.
Because sometimes, what drains capacity is not the number of people working, but how the organisation thinks about work itself.
1 Context and Origins
The complaint of not enough manpower surfaced repeatedly across divisions.
Officers spoke of being stretched thin; supervisors lamented high turnover; HR cited budget ceilings.
Yet, even after multiple recruitment rounds, the pattern refused to change.
The department was caught in a cycle:
hire more → overwork the keen → lose the best → rehire → repeat.
The harder it tried to fix the shortage, the deeper the shortage seemed to run.
STRLDi’s analysis revealed a classic Fixes That Fail loop, with an inner twist — a shift from procedural competence (detailed complexity) to systemic blindness (dynamic complexity).
2 Behaviour Over Time
Law #1 – Today’s Problems Come from Yesterday’s Solutions
Each new recruitment was celebrated as relief.
But soon, workloads grew to match expanded capacity.
Files multiplied because each officer, keen to prove efficiency, absorbed more than the system could learn from.
Law #2 – The Harder You Push, the Harder the System Pushes Back
Supervisors demanded visible performance.
Officers responded by working faster, skipping reflection, and eroding coordination.
Fatigue led to mistakes, then admonishments, then resignation.
Law #5 – The Easy Way Out Leads Back In
Recruitment became the default cure for all ills.
But the structure producing inefficiency — the inability to see dynamic complexity — stayed untouched.
Law #7 – Faster Is Slower
Each officer’s attempt to prove capability through speed created rework.
Time “saved” at the front end returned ten-fold as correction.
Law #8 – Small Changes Can Produce Big Results
The real leverage, as it turned out, was not in manpower but in mind-power — cultivating systemic seeing.
3 The Structure Beneath
Not enough manpower ↑ → pressure to hire ↑ → officer commits to prove efficiency ↑ → fatigue ↑ → effectiveness ↓ → admonishments ↑ → resignation ↑ → visible shortage ↑ → not enough manpower ↑
A textbook balancing loop disguising a deeper, reinforcing trap.
Each new hire learned to survive by speed, not by seeing.
The system rewarded firefighting over foresight.
4 The Mental Models of the Current Reality
| Role | Belief (Mental Model) | Behaviour | Hidden Fear |
|---|---|---|---|
| Supervisor | “More heads mean more output.” | Pushes for hiring drives. | Fear of being seen as ineffective. |
| Officer | “If I follow procedure perfectly, I’ll be safe.” | Clings to efficiency rituals. | Fear of failure or exposure. |
| HR Department | “Vacancies are the problem; recruitment is the solution.” | Focuses on filling posts. | Fear of being blamed for bottlenecks. |
These beliefs form a self-reinforcing illusion of scarcity — a psychological contract that trades learning for labour.
5 Current Reality Vision
The organisation believes its ideal state is “a fully staffed, efficient department.”
But efficiency, narrowly defined as procedural compliance, is precisely what drains energy.
The true shortage is time for reflection, not manpower.
6 The Identified Leverage – The Bridge
The leverage lies in shifting the unit of value from task completion to systemic comprehension.
Officers trained to recognise system archetypes began spotting patterns behind the complaints that filled their desks.
They learned to ask: What structure keeps bringing this problem back?
That single question changed everything.
Instead of escalating issues upward, officers started resolving root causes at source.
Each small insight restored flow.
Turnover dropped.
Morale rose.
This was Law #8 in motion — the smallest act of seeing producing the largest return.
7 The Uncle’s Act
A senior manager, himself once a procedural purist, saw the shift.
Instead of issuing directives, he invited officers to draw their own loops.
He reframed errors as learning data and began conversations on system patterns during weekly check-ins.
Without formal policy, the department began learning how it learned.
The “boiled frog” moment arrived quietly — no reforms, no memos, only deeper sight.
8 Behaviour After Leverage
At first, confusion rose.
Procedural officers felt slower, less efficient.
But within weeks, rework plummeted.
Peer collaboration replaced hierarchical blame.
Hiring needs stabilised; resignations declined.
The curve flattened into sustainable flow.
Productivity became calm rather than frantic — a living example of Law #3: Behaviour grows worse before it grows better.
9 Vision of the Future Reality
In the future state, the organisation measures learning velocity, not headcount.
Meetings revolve around flow maps, not vacancy lists.
Supervisors track time saved through insight, not hours worked.
Officers move fluidly between tasks, guided by understanding of interdependencies.
The language of shortage fades.
The culture breathes again.
10 Supportive Mental Models of the Future Reality
| Role | New Belief | Emergent Discipline |
|---|---|---|
| Supervisor | “Conversation is capacity.” | Team Learning – builds capability through dialogue. |
| Officer | “Seeing structure is solving.” | Systems Thinking – replaces reaction with reflection. |
| HR | “We hire for insight, not numbers.” | Shared Vision – aligns recruitment with learning purpose. |
Fear has shifted into curiosity.
Busyness into presence.
11 Events and Patterns of the Future System
In the renewed system, the Laws of Dynamic Complexity are respected:
| Law | Expression in Future System |
|---|---|
| #1 | Each solution is tested for side-effects. |
| #2 | Pressure points are diffused through learning, not extra labour. |
| #4 | Delays between cause and effect are mapped and shared. |
| #5 | Fixes are replaced by experiments. |
| #7 | Pace aligns with purpose — speed serves insight. |
| #8 | Minor course corrections replace major overhauls. |
| #11 | Structure, not people, holds accountability. |
The pattern of oscillating scarcity transforms into a reinforcing loop of shared mastery.
New Reinforcing Loop: Seeing → Understanding → Flow → Calm → Retention → Collective Capacity → Seeing again.
12 The Cost of Awareness vs the Cost of Ignorance
| Approach | Financial Cost | Outcome |
|---|---|---|
| Traditional Recruitment and Overtime | High capital outlay / Low learning | Short-term relief; long-term burnout |
| Systems Training and Learning Cycles | Negligible | Sustainable performance; cultural renewal |
Awareness pays higher dividends than payroll.
13 The Broader Vision
A nation of institutions trapped in detailed complexity will always feel under-staffed.
The cure is not mass hiring, but systemic sight.
When leaders learn to see patterns, they release both human energy and national capacity.
Manpower turns into mind-power.
The true resource multiplies by awareness.
Vision of the Future Reality:
A workplace where capacity is consciousness — and where the ability to see the system is the new definition of strength.
Fixes-That-Fail (Variant)
LEFT-HAND PAGE – Analysis & Reflection
Header
When busyness becomes a badge of competence, the organisation hires itself into exhaustion.
Top Section – Leadership Mirror
A full-width grey box containing the mirror paragraph.
A small inset quote in italics:
“Every system is perfectly designed to get the results it gets.”
Preamble – Before You Read
Placed below the mirror, using a light background tone.
Accompanied by a small inset BOT diagram (Before Leverage) in the top-right corner.
Main Narrative Body
Two columns.
The left column opens with:
- 1–5: Context, Behaviour Over Time, Structure, Mental Models, Current Reality Vision.
The right column continues with: - 6–9: Leverage, Uncle’s Act, Behaviour After Leverage, Future Reality Vision.
A thin vertical line separates narrative from marginalia.
Margin Notes (right margin of both pages)
Small annotations in blue text boxes referencing the Laws of Dynamic Complexity as they appear:
- #1 Today’s problems come from yesterday’s solutions
- #7 Faster is slower
- #8 Small changes produce big results
These act as navigational anchors for readers scanning the page.
Footer – Coda
A final blue band carrying your signature line:
Vision of the Future Reality
A workplace learns to become a place and opportunity where capacity is consciousness — and where the ability to see the system is the new definition of strength.
Previous Post: Urgent Files
Next Post: Human-Wildlife Conflict
Based on the Vision Deployment Matrix™ created by Dr Daniel H. Kim, first published in The Systems Thinker, Vol. 6 No. 1 (1995).
Framework adapted by STRLDi for applied national systems learning.
Share this:

“Urgent Files Case Study”
A Case Study of the Fixes-That-Fail Archetype
(STRLDi Compendium of System Archetypes — Draft Edition)
“THE LEADERSHIP MIRROR”
Every leader believes they are solving problems.
Few notice that the problems are quietly solving them.The more effort they invest, the deeper the pattern takes hold — until exhaustion feels like purpose and urgency feels like success.
The following case is not a critique of leadership but an invitation to see leadership at work inside the system itself.
Each time we react, correct, compensate, or protect, the structure records it — and teaches.
This is the leadership mirror: a place to see our reflexes reflected back as design.
The lesson is never about who was right; it is about how the system learned from what we could not see.
Before You Read
Every bureaucracy has its rituals of rescue — the emergency meeting, the red-stamped file, the overtime marathon that proves loyalty.
For a moment, the room feels alive; the system seems responsive.
Then, just as surely, the backlog returns.
What you are about to read is not a story about slow officers or careless managers.
It is the anatomy of a reflex — a national habit of equating busyness with value.
This first study in the STRLDi System Archetype Compendium opens with a pattern called Fixes That Fail.
It asks: What if the system’s greatest crisis is its own cure?
And it invites you to see that the smallest act of awareness can transform an enterprise, a ministry, or a nation.
The Urgent Files phenomenon emerged in an investigations department charged with handling public complaints.
Its purpose was straightforward: ensure that every reported case was reviewed, investigated, and closed within prescribed time limits.
Yet, over time, the department found itself in a perpetual state of crisis.
Every few weeks management would announce a backlog-clearing exercise.
Files were stamped URGENT in red, officers were redeployed, and working hours extended.
The public applauded the temporary responsiveness, but within months the backlog returned — heavier and more demoralising than before.
When STRLDi first studied the pattern, it seemed ordinary bureaucratic fatigue.
But plotting behaviour over time revealed the familiar oscillation of the Fixes That Fail archetype:
A quick corrective action delivers short-term relief yet creates longer-term pressure that demands the same fix again.
What looked like a process problem was in fact a systemic illusion — the office was working tirelessly to reproduce the very problem it was trying to solve.
Applying the Other Laws to the Urgent File Causal Structure
The Urgent File structure shows a system in which the demand for urgent action draws attention away from current files. As attention is diverted, current files receive less attention to their systemic nature; quality of investigation is affected; the ability to capture or detain perpetrators is affected; new crime cases enter the system; attention is again drawn to current files and, eventually, customers become dissatisfied and demand immediate attention to their own files. The cycle continues.
The Laws help us see why this structure persists, not merely what is happening inside it.
Law 1 — Today’s Problems Come From Yesterday’s Solutions
The immediate problem is the growing number of urgent files.
The response is to take swift action: urgent files are prioritised and orders are issued to set aside current files. That appears to solve the immediate problem. But the action diverts attention from current files, causing them to remain unattended or inadequately investigated.
Those delayed current files contribute to complaints and demands for immediate attention, which then become tomorrow’s urgent files.
The solution to yesterday’s urgency is therefore helping to create tomorrow’s urgency.
The Law allows us to see that the problem cannot be understood by looking only at the current urgent file. We have to ask:
What earlier solution produced the conditions we are now trying to solve?
Law 2 — The Harder You Push, the Harder the System Pushes Back
As the number of urgent files increases, the need to take swift action increases.
Each urgent drive demanded overtime and exhaustion. For a short while output spiked, morale rose, and the public seemed satisfied.
Then the system’s “push-back” arrived: new complaints, deeper fatigue, and declining quality.
The curve resembled an erratic heartbeat — a body kept alive by stress.
This leads to more instances of issuing orders to set aside current files and greater attention being placed on urgent files. But this very response reduces attention available for current files.
The harder the system pushes to deal with urgency, the more conditions it creates for further urgency.
The system’s resistance is therefore not necessarily caused by people refusing to cooperate. It is generated by the relationships within the structure itself.
The question becomes:
What are we pushing harder on that is causing the system to push back?
Law 3 — Behaviour Grows Better Before It Grows Worse
This Law is particularly visible in the apparent success of the urgent-file response.
When urgent files receive immediate attention, the organisation may initially experience what looks like an improvement. An urgent matter is dealt with. A customer is satisfied. Management sees action being taken.
The behaviour looks better before the consequences of the intervention become visible elsewhere in the system.
Meanwhile, current files are being displaced.
The deterioration therefore does not necessarily appear at the same time or in the same place as the original intervention.
This Law forces us to ask:
What looks like improvement now, but may be creating deterioration later?
Law 4 — The Easy Way Out Usually Leads Back In
The easiest response to an urgent file is to move it to the front of the queue.
It is visible. It is immediate. It demonstrates action.
But the underlying structure that produces urgent files remains untouched. Current files are displaced, attention is diverted, complaints emerge and further files become urgent.
The easy response therefore brings the organisation back into the same cycle.
The Law helps us distinguish between:
doing something about the immediate problem
and
changing what keeps producing the problem.
Law 5 — The Cure Can Be Worse Than the Disease
The original disease is the accumulation of urgent files.
The cure is to give urgent files priority.
But the cure has consequences: current files are set aside, attention is diverted and the quality and timeliness of investigation can deteriorate.
The intervention intended to reduce the problem can therefore intensify another part of the structure, eventually contributing to the very conditions that produce more urgency.
The Law asks us to examine the side effects of the intervention, rather than judging the intervention only by its immediate result.
Law 6 — Faster Is Slower — and Slower, Staying Consistent, Is Faster
The structure shows the danger of responding to urgency by continually demanding speed.
Swift action on urgent files may appear efficient. But when attention is repeatedly diverted, the organisation’s ability to give appropriate attention to current files and undertake quality investigation is compromised.
Poorer investigation can affect the ability to capture or detain perpetrators, contributing to further cases entering the system.
The attempt to move faster therefore creates conditions that require more work later.
This Law asks us to see the time dimension:
Are we actually becoming faster, or are we creating more of the work that will have to be dealt with later?
Law 10 — Do Not Cut the Elephant in Half
This Law brings us back to the whole structure.
The urgent file cannot be separated from the current file.
The current file cannot be separated from the customer.
The customer cannot be separated from complaints.
Complaints cannot be separated from the number of urgent files.
The investigation process cannot be separated from the ability to capture or detain perpetrators and the emergence of new cases.
The parts are connected.
If we treat “urgent files”, “current files”, “customers”, “investigation quality” and “crime cases” as separate management problems, we lose sight of the structure connecting them.
This Law therefore reinforces the central discipline of the case:
Do not solve one part without asking what your solution does to the whole.
Law 11 — There Is No Blame
The causal structure also changes how we see the people inside it.
The supervisor who issues an order to prioritise an urgent file is responding to pressure.
The officer who gives attention to the urgent file is responding to the order and the immediate demand.
The customer who complains is responding to the experience of delay.
Each may appear to be causing the problem from the perspective of another player.
But when we see the structure, we begin to see that their behaviours are also responses to the conditions in which they are operating.
This does not mean that nobody is responsible.
It means that blaming the individual does not explain the persistence of the behaviour.
The question shifts from:
“Who is causing this?”
to:
“What structure is producing these behaviours, and how are the behaviours reinforcing the structure?”
What the Laws reveal together
The important learning is that none of these Laws gives us a separate problem to solve.
They allow us to look at the same causal structure from different angles:
| Law | What it makes visible in the Urgent File structure |
|---|---|
| 1. Today’s Problems Come From Yesterday’s Solutions | Today’s urgency is partly produced by earlier responses to urgency. |
| 2. The Harder You Push, the Harder the System Pushes Back | Increasing pressure for swift action can intensify the conditions generating further pressure. |
| 3. Behaviour Grows Better Before It Grows Worse | The urgent-file intervention can look successful before its consequences appear elsewhere. |
| 4. The Easy Way Out Usually Leads Back In | Prioritising the immediate urgent file provides relief without changing the structure producing urgency. |
| 5. The Cure Can Be Worse Than the Disease | Solving urgency by displacing current files can worsen the wider problem. |
| 6. Faster Is Slower | Speed applied to one part can create more work and deterioration elsewhere over time. |
| 10. Do Not Cut the Elephant in Half | Urgent files, current files, customers, investigation quality and new cases form one interconnected whole. |
| 11. There Is No Blame | The actors are participating in a structure; blaming one actor does not explain its persistence. |
And this is precisely why Laws 7, 8 and 9 are different.
These Laws help us see the behaviour and consequences of the structure.
Law 7 — Look Further Away asks us to extend our field of seeing.
Law 8 — Now Find the Trim Tab asks us to locate where a small action can influence the larger structure.
Law 9 — Perhaps We Do Not Have to Choose asks us to question the apparent trade-offs created by the structure.
So the full exercise is not eight disconnected applications. It is the group learning to use the Laws as lenses on one causal structure — each Law helping the eye see something that another Law may leave less visible.
That is the real progression from understanding the Laws to using the Laws.
3 The Structure Beneath the Oscillation
The causal structure was deceptively simple:
Urgent files ↑ → swift action ↑ → attention on current files ↓ → quality of work ↓ → complainant dissatisfaction ↑ → urgent files ↑
A perfect balancing loop in form — but it balanced the wrong thing: the appearance of responsiveness rather than genuine throughput.
The balancing reflex masked a deeper reinforcing dynamic of fear and pressure.
As the unseen reinforcing loop gained strength, the human reflex to “restore balance” intensified — confirming the Law of Reflexive Balance later codified by STRLDi:
Except in biological homeostasis, every balancing loop in human systems is the reflex of an unseeing system attempting to counter its own reinforcing pattern.
4 The Ladders of Fear (Mental Models)
Three ladders of inference maintained the blindness:
| Actor | Assumption | Behaviour | Hidden Fear |
|---|---|---|---|
| Supervisor | “Officers are lazy.” | Increases control and public visibility. | Fear of losing authority. |
| Officer | “Management notices only crisis.” | Waits for escalation to act. | Fear of invisibility and blame. |
| Complainant | “Government doesn’t care.” | Escalates or bypasses channels. | Fear of powerlessness. |
Each ladder reinforced the others.
Separated by hierarchy, they never met to test their assumptions.
Law #11 — There is no blame — was the missing discipline: everyone defended their role; no one saw the system.
5 The Vision That Created the Current Reality
The department still served a vision forged decades earlier: “Efficiency means rapid response.”
It wanted both speed and quality at once — the contradiction captured in Law #9, you can have your cake and eat it too, but not at once.
Performance measures rewarded volume, not learning.
The structure behaved exactly as it was designed: to appear busy.
6 The Discovery of Leverage
During a review, one senior officer — trained by experience rather than formal education — noticed something small yet profound.
Whenever he deferred a case, he called the complainant to explain the delay and outline next steps.
Those calls, barely two minutes each, eliminated most follow-up complaints.
Files no longer escalated to urgent.
The simple human act re-closed the feedback loop that the system’s procedure had severed.
Here lay Law #8 in living form:
Small changes can produce big results — the areas of highest leverage are often the least obvious.
The cost of the intervention: zero.
The impact: systemic.
No technology, no reform bill, no consultant.
Just consciousness restored at the point of disconnection.
7 The Uncle’s Act (Healing in Motion)
A wise supervisor recognised the potential but avoided formalising it.
He praised the courtesy as “professionalism” and let it spread organically.
This was the Uncle’s Act — healing inserted gently into culture:
Healing Intent: Re-humanise the flow of work.
Gentle Insertion: Allow experienced officers to model the call.
Camouflage: Present it as courtesy, not reform.
Trust Loop: Acknowledge calm complainant behaviour publicly.
Successor’s Gift: Embed it later as induction practice.
By keeping the structure unaware of its transformation, he boiled the frog without harm.
The balancing reflex quietly lost energy; the reinforcing loop of trust took over.
Balance returned as rhythm, not resistance.
8 Behaviour After Leverage
At first the curve looked wrong — urgents dropped, throughput slowed, calm felt unnatural.
But over successive cycles, quality stabilised and morale rose.
The department was living Law #3 — behaviour grows better before it grows worse.
Short-term anxiety preceded long-term healing.
Within months, urgent-file drives disappeared from the vocabulary.
Officers began competing for consistency, not crisis.
The healing reinforcing loop (call → trust → fewer urgents → time → more calls) had taken root.
9 The Future Reality Vision
In the healed system, work flows continuously instead of spasmodically.
The word “urgent” has lost its power because the system has learned to anticipate, not react.
Supervisors manage rhythm, not crisis; officers manage trust, not panic; complainants experience transparency instead of silence.
The organisation’s purpose has evolved from efficiency to reliability — from fast to steady.
Its identity is no longer built on rescue but on prevention.
This is a department that now embodies the nation’s future reality: a public service that leads not by control, but by coherence.
10 Supportive Mental Models of the Future Reality
| Role | New Mental Model | Emergent Discipline |
|---|---|---|
| Supervisor | “Flow is the new efficiency.” | Systems Thinking — seeks patterns, not incidents. |
| Officer | “I create calm when I connect early.” | Personal Mastery — pride in steady contribution. |
| Complainant (Citizen) | “My government listens even when I’m silent.” | Building Shared Vision — trust as civic culture. |
Fear has transmuted into confidence.
The belief in scarcity of time or manpower dissolves when feedback is immediate and human.
Each participant’s ladder of inference has shortened — fewer assumptions, more communication.
The walls between roles have turned into mirrors.
11 Events and Patterns in the Future System
In the healed state, the Laws of Dynamic Complexity are respected, not violated:
| Law | Expression in the Future System |
|---|---|
| #1 | Solutions are tested for side effects before implementation. |
| #2 | Pressure points are anticipated — no need to overpush. |
| #3 | Temporary discomfort is accepted as part of real learning. |
| #4 | Feedback cycles are monitored continuously — cause and effect stay linked. |
| #5 | Easy fixes are replaced by small, deliberate learning experiments. |
| #7 | Pace matches capacity; speed is calibrated, not worshipped. |
| #8 | Minor, human interventions are designed into process flow. |
| #11 | Blame has no oxygen; the conversation focuses on structure. |
The pattern now resembles a gentle rise and plateau, not a spike and crash.
It behaves like a breathing organism — self-correcting, aware of its boundaries.
The loop has evolved from Fixes That Fail to what STRLDi names a Learning Reinforcement Loop — trust reproducing trust.
12 The Future Reality
The new system functioned without drama.
Public trust steadied; workload distributed evenly; officers regained pride.
The earlier balancing loop that exhausted the system had given way to a reinforcing loop that regenerated it.
Calm was now the indicator of competence.
The “urgent” label, once a symbol of heroism, became a relic of blindness.
13 The Cost of Awareness vs. the Cost of Ignorance
A comparison later conducted by STRLDi estimated that a full business-process re-engineering of the department — consultants, workshops, IT systems — would have cost tens of millions.
The systemic leverage that achieved the same outcome cost nothing but two minutes of conversation per deferred case.
| Approach | Financial Cost | Result |
|---|---|---|
| BPR overhaul | High capital, low learning | Temporary efficiency; same pattern returns |
| Two-minute call | Negligible | Structural healing; enduring calm |
Law #8 is therefore not about efficiency; it is about economy of consciousness.
Systemic change costs awareness, not appropriations.
Every pula saved from compensating blindness becomes available for rebuilding the nation’s real capacities — agriculture, education, manufacturing — the domains that feed people, not reflexes.
14 Broader Implications — The Discipline of Seeing
The Urgent Files case demonstrates that the purpose of systems thinking is not prediction or control but seeing.
A balancing loop is not virtue; it is the reflex of an unseeing system attempting to hold still what must evolve.
Only when awareness reconnects the parts of the loop does reinforcing energy turn from vicious to virtuous.
Then, and only then, does a learning organisation begin to form.
15 Coda – From Reflex to Learning
In biological life, balance preserves being.
In human systems, balance often preserves blindness.
The Fifth Discipline teaches that learning begins the moment the reflex to “correct” gives way to curiosity to see.
The Urgent Files case is more than a story of an investigation unit; it is a mirror for governance, religion, education, and enterprise — every domain that mistakes control for care.
The smallest act of seeing together can dissolve the largest illusion of control.
That is the meaning of systemic reform.
And that is the quiet revolution already underway.
Figures
Behaviour-Over-Time – Before Leverage
Behaviour-Over-Time – After Leverage
Causal Loop Diagram – From Balancing Reflex to Healing Reinforcement
(See companion visuals: BOT_Before_Leverage_FTF.png, BOT_After_Leverage_Healing.png, CLD_Urgent_Files_FTF.png)
Summary Table of Laws Expressed in the Urgent Files System
| Law | Manifestation in Case |
|---|---|
| #1 | Each urgent drive creates tomorrow’s crisis. |
| #2 | The harder the push, the stronger the rebound. |
| #3 | Healing feels wrong before it feels right. |
| #4 | Delay hides cause and effect. |
| #5 | The easy fix leads back in. |
| #6 | The cure (urgent drives) worse than disease (delay). |
| #7 | Faster response slows real progress. |
| #8 | Smallest, least-visible act (phone call) flips the system. |
| #9 | Wanting speed and quality simultaneously creates contradiction. |
| #10 | Splitting responsibility fragments learning. |
| #11 | Seeing structure replaces blame. |
Epilogue
Law #8 — Systemic change costs awareness, not appropriations.
When a nation learns this, its ministries heal, its budgets breathe, and its people rediscover trust.
Next Post: Not Enough Manpower
Based on the Vision Deployment Matrix™ created by Dr Daniel H. Kim, first published in The Systems Thinker, Vol. 6 No. 1 (1995).
Framework adapted by STRLDi for applied national systems learning.
Share this:


Introducing the Compendium: Exploring The Fifth Discipline’s Impact on Leadership
1️⃣ The Purpose of this Compendium
Every nation, organisation, and community carries within it a set of repeating crises — persistent issues that resurface despite reforms, budget allocations, or leadership changes.
The System Archetype Compendium exists to reveal the invisible structures behind those recurrences.
It is not a collection of case reports; it is a manual of seeing.
The Compendium documents real cases analysed under the Systems Thinking Research and Leadership Development Institute (STRLDi), where each archetype is treated as a living pattern — a design of thought, habit, and feedback that recycles itself across departments, industries, and societies.
Through these case studies, the Compendium demonstrates how the same structural logic that governs a single office may also govern a national economy, a political movement, or a global environmental trend.
Our purpose is to make systems thinking practicable — to show leaders, managers, and citizens that reform begins not with budgets but with awareness.
Each case demonstrates how, when a system sees itself in full, transformation requires almost no money, no legislation, and no external consultant.
It requires a shift in consciousness — the smallest change that yields the greatest systemic effect.
This is the spirit of Law #8: Small changes can produce big results — but the areas of highest leverage are often the least obvious.
The Compendium is, therefore, a repository of national learning.
It records not only the patterns that trap us, but the acts of insight that release us.
Its ambition is practical: that by learning to recognise these archetypes early, leaders may prevent future crises, save vast public expenditure, and build institutions that learn faster than their problems evolve.
Why These Archetypes Matter Now
Botswana, like most modern nations, faces persistent issues whose symptoms vary but whose structures rhyme — unemployment, bureaucratic overload, human–wildlife conflict, social inequality, educational drift.
Each of these is not an isolated failure but a systemic rhythm.
By reading these patterns together, across ministries and disciplines, STRLDi invites a national conversation about how learning itself can become governance.
The Compendium is a tool for that conversation.
2️⃣ Introducing the Series of Studies
About the Series
This Compendium opens with “Urgent Files,” the first in a series of applied archetype studies.
Each subsequent case explores a different structure of persistence drawn from real systems in Botswana and the wider Southern African region.
Together, they form a progressive learning journey through the nine core archetypes of the STRLDi Onion Model, and later, their interlinkages in national structures.
| Order in Series | Archetype Focus | Working Title / Case Example | Dominant Reinforcing Theme | Organizational Level / Country Source |
|---|---|---|---|---|
| 1 | Fixes That Fail | – The Urgent Files – Investigations Dept. – Not Enough Manpower – resource exhaustion loop | Fear-driven productivity reflex Self-fulfilling scarcity | Investigation Branch / Singapore Police Force Government of Singapore Human Resource Department / Singapore Police Force Government of Singapore |
| 2. | Shifting the Burden | The evolution of a country’s productive sectors, showing the trajectories of agriculture, manufacturing, services, and unemployment, allows us to observe how the economic structure has shifted gradually rather than abruptly. | Taking the easier way (out) | Behaviour of the country’s GDP Ministry of Finance Ministry of Trade Ministry of Agriculture |
| 3 | Escalation | Human–Wildlife Conflict – retaliatory dynamics between farmers and elephants | Fear breeding counter-fear | Ministry of Environment / Government of Botswana |
| 4 | Success to the Successful | Fallow Lands, Warm-Plant Cover & Extreme Weather – Climate Feedback in Agricultural Land Use This graph shows the growing gap between labour supply and the economy’s ability to absorb it. | Neglect of regenerative cycles amplifying climatic volatility As entrants into the labour market continue to outpace job creation, unemployment accumulates as a stock, not a temporary condition. | Ministry of Agriculture / Government of Botswana & Global (intended project with FAO) Ministry of Labour Ministry of Education Ministry of Trade Ministry of Agriculture Ministry of Finance |
| 5 | Growth & Under-investment | National Skills Mismatch and Unemployment – the Onion model | Chronic under-investment in productive learning | Office of the President / Human Resource Development Council / Government of Botswana |
| 6–10 | [To follow] Drifting Goals, Limits to Growth, Tragedy of the Commons, Accidental Adversaries | Sectoral case studies (education, energy, climate, governance, inter-agency relations) | To be mapped |
Each archetype builds upon the previous one, revealing how systems that appear unrelated share a single dynamic lineage.
The series, therefore, doubles as a national diagnostic — a mirror of how Botswana’s institutions learn, forget, and relearn.
How to Read the Compendium
Each case follows a consistent structure:
Behaviour Over Time (BOT) – what patterns recur.
Causal Loop Diagram (CLD) – why those patterns persist.
Vision Deployment Matrix (VDM) – what leverage changes the behaviour.
The Uncle’s Act – how leadership applies the insight without resistance.
The Laws of Dynamic Complexity – which universal laws are active.
The Lesson – how systemic change costs awareness, not appropriations.
This rhythm turns each chapter into both analysis and meditation — a map for diagnosis and a story of transformation.
The Guiding Vision
The Compendium belongs to STRLDi’s larger mission:
To cultivate systems intelligence in Africa — to enable leaders to see patterns that cut across sectors, and to replace reform-by-instruction with reform-by-awareness.
It is dedicated to the public servants, entrepreneurs, educators, and citizens who continue to work in the field of persistence — who keep trying to fix what refuses to stay fixed — and who are now ready to see what lies beneath.
Acknowledgement
“We acknowledge Dr Daniel H. Kim for his creation of the Vision Deployment Matrix™, published in The Systems Thinker (Vol 6, No. 1, 1995) — the organisational learning framework on which this series is founded.”
The original article is available here: “Vision Deployment Matrix: A Framework for Large-Scale Change” in The Systems Thinker. The Systems Thinker+1
Share this:


When Seeds Take Root Across Continents
A Tribute to Dr Daniel Kim and Ms Diane Cory
by Sheila Damodaran
“There are teachers who change what we know, and there are teachers who change how we see.”
Daniel Kim and Diane Cory did both.
The Beginning – 1990s: Learning to See
I first sat in D&D’s class (as they are fondly known) in 1996. I remember sitting there, wide-eyed. I wasn’t astonished by what was new. Instead, I realized that I had been waiting for this all along without even knowing it.
In 1999, I joined their postgraduate initiative titled Leaders for Learning programme at the Singapore Civil Service College. It was the year-long Learning Organisation Programme. At that time, The Fifth Discipline was just starting to take root in Asia. The programme was led by Daniel Kim and Diane Cory. I was enlisted as their Teaching Assistant. The course aimed to train internal facilitators and consultants. These professionals would bring systems thinking into their institutions. They would also incorporate organisational learning.
I entered the programme wanting to understand systems thinking. At the time, my mind was still trained to think in straight lines. And I was good at it, given my strong mathematics and science backgrounds. I would analyse, sequence, and solve problems. I did not realize I was reacting within a part of the whole. Daniel’s patient way of drawing archetypes on flipcharts began to loosen that habit. He didn’t just teach loops. He showed us how the world organizes itself through feedback, delay, and interconnection. He demonstrated how structure generates a consistent behaviour over time. He also explained how seeing the whole helps us recognise these patterns. That recognition, right there, changes how we act within it.
Meanwhile, Diane guided us through profound visioning work. In one of her closing sessions, she tasked us to write a vision. We reflected on where we hoped to see this work unfold in the future. I wrote that I wanted to see it extend beyond organisations. I could already sense that organisational boundaries inevitably limit what we see. Acting only within those limits rarely brings real leverage. I wanted it to reach into governments, communities, businesses and the nation. Eventually, I hoped it would extend into the United Nations.
A year later, I received my self-addressed letter, reminding us of what we had envisioned. By then, I was already facilitating joint public–private sector sessions — the seed of a dream beginning to take root.
The Early Practice – 2000s: Building Bridges
By the early 2000s, I was applying these frameworks within Singapore’s public service. Those years taught me something Daniel and Diane had always implied. Systems thinking is not just an analytical method. It is an ethical practice.
Every policy conversation, reform, and meeting room became a living example of feedback and structure. In 2002, during an intense phase of work, I started sketching an idea. This would later evolve into The Onion Model. It shows how layers of belief, structure, and behaviour reinforce each other across multiple archetypes.

Daniel’s archetypes helped me see the patterns; Diane’s insistence on clarity of vision helped me trust them.
That same year, I convened the Learning Organisation Practitioners Network (LOPN). It was a community of practice lovingly put together by both public and private sector individuals. This community connected public and private leaders across sectors. It was not yet SoL (Society for Organizational Learning). However, it carried the same spirit till I departed for Botswana in 2008. The aim was to keep learning alive where people work, not only where they study.
At its heart, their teaching carried a moral invitation. It urged us to maintain coherence, clarity, and compassion. This charge is crucial even when systems lose theirs.
The Middle Years – 2010s: When Systems Speak Back
The years that followed were the true practice field. Applying systems thinking within political and institutional settings required not only clarity but stamina.
The Government of Botswana had invited me to bring this learning into a national context. In 2005, I served as the Chief Facilitator of the first Cabinet Retreat of the Government of Botswana. The recurring issue of unemployment was a focal point. The country’s struggle to diversify its economy also became the central case study.
In 2007, Permanent Secretary to the President Eric Molale invited me to continue the work. This work had begun after he reviewed my initial findings from the Cabinet Retreat. I was encouraged to carry the study forward into NDP10, Botswana’s national development planning process for 2008.
That year marked the first time parastatal and private-sector leaders were included in national planning. The government also recognised a gap. The public service leadership community lacked the tools of The Fifth Discipline. They particularly lacked the tools of Systems Thinking. I was subsequently engaged on a four-year contract to help senior officers in the public service develop these critical skills.
By 2018, the Human Resource Development Council (HRDC) re-engaged me to finalise the study on unemployment and economic diversification. This became feasible after the establishment of Statistics Botswana, which enabled us to undertake the research with confidence. It is the first study of its kind in the world. I had long imagined that such a study was possible. It was extraordinary to watch it (and The Onion Model) come alive before my eyes. That study later anchored the formation of STRLDi in Botswana.
I had been quiet for about six years (2013–2018). Returning to public work after completing that first case study marked a much clearer comeback. During that same period, I was building a second organisation. It is a business that continues to inform my research. I was also learning the ropes of life in a new country. This foray into food manufacturing has allowed me to study both the manufacturing and agriculture sectors at close range.
Through this experience, I began to see that working systemically involves being influenced by the system itself. The discipline was not only about seeing patterns—it was about staying in relationship with the whole. I explored why unemployment persists. I examined why agriculture and manufacturing so often fail to connect. I studied how the structures beneath them shape national outcomes.
Those years marked a turning point. Systems thinking was no longer merely a professional craft. It became a way of inhabiting the world. It was a lifelong apprenticeship in seeing reality as a whole.
The Renewal – 2020s: Taking Root in Africa
Two decades later, I find myself in a very different geography. I am now a resident in Botswana, Africa, but still in the same field of practice. We engage the region and the globe through The Systems Thinking Research & Leadership Development Institute (STRLDi). These same principles are brought into national dialogues on agriculture. They influence governance and economic transformation.
The Onion Model has matured into a research framework. It maps national systemic archetypes. It helps leaders see how reinforcing loops in policy, investment, and behaviour produce recurring outcomes. These outcomes include unemployment or underinvestment.
The insights began on Daniel’s flipcharts. They also originated in Diane’s visioning circles. These insights now help shape public policy, farmer training, and cross-sector collaboration across Africa.
In many ways, this is the natural evolution of Diane’s visioning work. The learner is becoming the teacher, not by design, but by continuity. We are living their visions of us. I like to think that she would smile. She would know that the seed she helped plant found new soil. The loops Daniel once drew still guide new learners today.
✳️ Reflection
Compared to forty years ago, the world has shifted at its core. We speak of climate change, political upheavals, or social breakdowns. Humanity is beginning to recognize the larger forces at play. It is also starting to enter into dialogue with itself.
That conversation is happening everywhere: on Facebook, LinkedIn, X, Google — in the words of citizens, scientists, leaders, and learners. The voice of collective reflection is growing louder.
It’s a kind of global systems awareness. This awakening has its roots in the work of Peter Senge. It is also linked to Daniel Kim, Diane Cory, and many others. They decided to take the first bold steps to help us learn to see wholes, not fragments. Their pioneering determination laid the first path. This path allows us, in turn, to help lay the next paths. This next path nurtures not just learning in organizations, but consciousness in humanity.
We are witnessing that very work take its next step — unfolding quietly and persistently through millions of small awakenings. And if we pause to reflect, we might ask ourselves: what if they had chosen otherwise?
What Their Legacy Means for the Fifth Discipline Community
To the wider Learning Organisation and Fifth Discipline community, this reflection is a message of continuity. This message includes those who once studied under Daniel, Diane, and Peter Senge. It also includes those now carrying the work forward.
Their legacy does not rest in any one organization or country.
It lives in the quiet persistence of diligent individuals. They keep practicing, teaching, and adapting the work to the needs of their time. This is often done without fanfare, but always with faith in the discipline itself.
Daniel and Diane signify a pivotal moment for me. Systems thinking stopped being just a method. It became a way of seeing life. Their lessons endure not only in memory. They persist in every conversation where people rediscover that structure shapes behavior. This awareness can shape a different future.
Twenty-five years on, the work continues. It spans across new landscapes and in new languages. The same DNA of learning, clarity, and compassion is always carried. Every generation rediscovers the work in its own language — proof that learning, once awakened, never dies.
Daniel and Diane, thank you — for teaching us not just how to think, but how to see.
🔗 Learn more about STRLDi and its ongoing work
💬 Community reflections on the Learning Organisation legacy
Share this:

Understanding Botswana’s Horticulture: Profit Dynamics Explained
From P5 beetroot to a P40 plate—why profits “move but don’t grow” without a coordination spine.
When the Butterfly Sneezes: The Unseen Players in Botswana’s Food System
🌾 Farmer’s Voice — A Passion of Hope
“Once we finish planting, the imports come in. Prices drop to P3 a kilo.
We can’t dodge the same old crops — cabbage, tomato, butternut — and tunnels cost over P90 000.
Try niche crops, they say, but even herbs and radish sell for cents.
Retailers buy my produce at P3 and sell at P4–P20.
When will we ever break even?”
— Farmer, Botswana (2025)Inside this lament is not anger but a map of a missing system.
He is describing an uncoordinated market where imports collide with local harvests, costs outrun prices, and data never travels between field, retailer, and policy desk.
It is the voice of someone working hard within a structure that works against him — what he calls “a passion of hope.”
That hope deserves a system strong enough to hold it.
The thread flares up with emotion. Dozens of voices add their experiences — the weather, the labour costs, the diesel bills, the price of packaging. Some call for subsidies, others for stricter import bans. Others say forget the local market. Go the way of exports. This conversation happens repeatedly in farmer groups. It occurs month after month. Every time a price thread catches fire, the discussion resurfaces.
And yet, hidden inside those messages is a larger pattern — one that rarely gets named. Farmers argue about prices. However, the real leverage lies elsewhere. It is in the soil beneath them. It is in the productivity of the labour beside them. It is also in the structure of the state above them.
It is easy to think that solving the farmer’s problem begins with the farmer. But economics tells us otherwise: the points of highest leverage in a system are usually the least obvious.
Our farmers’ frustration is real. However, the forces that shape it are mostly invisible. This encompasses the movement of data between ministries. It also involves the management of soil biology, the training of labour, and the sustenance of coordination. The pain of one player in the system often begins in the silence of another.
This article quantifies each layer, shows the ripple when farm-gate rises, and identifies the leverage points that actually grow profit.
Three Learning from This Study
These three learning define the real work ahead. It is the work that, if we take care of it, will make these circular farmer–retailer–caterer conversations unnecessary. They form the foundation for the next phase of Botswana’s agricultural and economic development.
1. Reduce Production Costs to Global Competitive Levels
Our first task is to bring our unit production costs down from P5.50–P6.20 to around P3.00/kg, matching China’s cost base.
That P2.00 difference is significant. It represents a full P2 profit margin per kilogram of beetroot (and comparable crops). This margin currently leaks away in inefficiency.
We can only achieve this through regenerative practices, precise data coordination, and investment in mechanisation where it matters.
Outcome: Lower costs mean higher margins for farmers without raising consumer prices — the hallmark of a mature, competitive system.
2. Confront Productivity Honestly and Set National Targets for Labour
Our workers are not underpaid — they are undirected.
The value of their pay is being eroded not by exploitation, but by inflation born from low productivity.
We must stop pretending otherwise. We should begin publishing comparative productivity data. This data shows how Botswana’s average agricultural worker performs in kilograms per hour against peers in China, Malaysia, and India.
Then, set measurable targets:
- Increase output per labour-hour by 20% within 3 years,
- Match Malaysia’s productivity by year 7,
- Halve the labour cost per kilogram by year 10.
Outcome: Higher real wages are built on productivity, not inflation. The workforce knows exactly what “competing globally” means in numbers, not slogans.
3. Rebuild the Country’s STEM Foundations Early
Here’s a clear and grounded explanation that moves step by step from STEM → Efficiency → Productivity → Prosperity.
🌱 a. STEM builds understanding — not just knowledge
STEM (Science, Technology, Engineering, Mathematics) teaches people how things work — not just what to do.
That shift in understanding is crucial.
- Science helps workers grasp cause and effect (e.g., soil chemistry, pest cycles, plant physiology).
- Technology provides the tools to measure, automate, and communicate those effects.
- Engineering applies design thinking — how to improve irrigation, logistics, or packaging systems.
- Mathematics enables measurement, optimization, and decision-making (costs, yields, probabilities, scaling).
Together, these disciplines cultivate systemic awareness — people start seeing connections, feedback, and waste.
And once you see inefficiency, you can eliminate it.
🔍 Efficiency begins the moment a person can measure and model reality accurately.
⚙️ b. Efficiency is the visible expression of STEM in action
Efficiency simply means achieving more output for the same or fewer inputs — time, money, energy, or labour.
STEM translates into efficiency in concrete ways:
| STEM Area | Practical Impact on Efficiency | Example in Agriculture |
|---|---|---|
| Science | Understanding soil, plant, and climate interactions | Farmers apply the right nutrients at the right time instead of over-fertilising. |
| Technology | Mechanisation, sensors, digital tools | Moisture sensors save 30% of water and improve yield by 10%. |
| Engineering | Better designs, less friction | Efficient irrigation pumps reduce energy use by 20%. |
| Mathematics | Tracking costs, yields, and trends | Farmers identify unprofitable crops before planting. |
🌾 Efficiency isn’t about working harder — it’s about working with reality instead of against it.
📈 c. Productivity is efficiency multiplied by scale
When efficiency becomes consistent and repeatable across many workers or farms, it turns into productivity.
- Efficiency is doing things right.
- Productivity is doing the right things, consistently, across the system.
STEM allows workers to perform better individually. It also helps them coordinate through shared data. They use standardised measurements and continuous feedback.
That coordination is what lets a country like China keep unit labour costs low even when wages rise. Every worker is plugged into an information-rich system. This system amplifies output.
🚀 Efficiency makes individuals productive. Coordination makes nations productive.
💰 d. Productivity creates wealth — sustainably
When workers produce more per hour:
- Wages can rise without raising prices (because output per worker increases).
- Borrowing costs drop (because the economy produces more value per unit of debt).
- Inflation falls (because supply keeps pace with demand).
- The nation grows without subsidies.
That’s why improving STEM education and data coordination in agriculture isn’t an “education policy” — it’s a macroeconomic strategy.
It turns a P5.50/kg farm cost into P3.50/kg not through subsidy, but through mastery.
It converts labour from a cost line into a competitive advantage.
🌍 STEM turns energy into knowledge, knowledge into efficiency, and efficiency into national resilience.
In short
| Stage | Question | Answer |
|---|---|---|
| STEM | How do we understand the system? | Through science, data, and reasoning. |
| Efficiency | How do we reduce waste? | By measuring, predicting, and designing better. |
| Productivity | How do we grow sustainably? | By scaling efficiency across people and systems. |
By the time a child reaches tertiary education, it is too late to correct what was never built.
The state must raise the mathematical and scientific literacy of its entire school population, not just the top students.
Our national benchmark must focus on improving Botswana’s average school grades in maths and science. We aim to match the global leaders — Germany, Japan, China, India, and Singapore.
This shift will not just improve education outcomes. It will reset the country’s entire productivity curve. This change will influence how farmers measure yields. It will affect how engineers design systems. Additionally, it will shape how policymakers use data.
Outcome: A generation equipped not only to work harder, but also to think structurally. This creates the muscle memory that drives nations forward.
In summary
1️⃣ Lower costs through coordination and regenerative discipline.
2️⃣ Lift productivity through data transparency and measurable labour goals.
3️⃣ Rebuild national STEM capacity from the classroom upward.
These three actions will work together. They will reduce the noise and emotion of our current debates. Frustration will be replaced with focus. Short-term fixes will be replaced with long-term learning.
Bridging Forward
These three learning give us a compass.
They show where the real work lies. It is not in louder debates over prices or subsidies. It is in building structural strength where it has quietly eroded: cost efficiency, productivity, and foundational education.
The rest of this article explores the data and reasoning that bring these points to life.
It follows a single, ordinary beetroot as it travels from soil to plate. It traces how profit behaves and where it leaks. The journey also examines what happens when we add coordination, regeneration, and STEM capacity back into the system.
From the farmer’s field to the nation’s policy tables, every section connects a visible frustration to its invisible cause.
Together, they reveal why Botswana’s horticulture will only mature when learning, labour, and leadership align.
Table of Contents
When the Butterfly Sneezes – The unseen players in Botswana’s food system
Part A – The Ripple Effect: From the Farmer’s P 5 Beetroot to the P 40 Plate
2.1 An Economic Observation
2.2 Tracing the True Cost of a Beetroot: From Farm to Plate
a. End Consumer – The Office Meal Plate
b. Caterer – Turning Raw Beetroot into a Side Dish
c. Retailer – The Hidden Middle Costs
d. Farmer – The Starting Point
e. The Complete Chain – Costs per kg of Beetroot
f. What the Data Shows
g. The Systemic Insight
2.3 The Baseline System – When the Farm-Gate Price is P 5/kg
2.4 When the Farmer Raises Price from P 5 to P 8/kg
2.5 Comparative Margins Summary
2.6 Where the Ripples Come From
2.7 Structural Insight – Movement without Prosperity
2.8 Bridge to Part B – Raising Productivity and Coordination
Part B – When the Butterfly Sneezes: The Unseen Players in Botswana’s Food System
3.1 The Quiet Cause Behind the Farmer’s Cry
3.2 Comparative Farming Economics – Conventional, Organic and Regenerative
3.3 Labour Productivity and Cost – Botswana, Malaysia and China
3.4 What Happens When Botswana Combines Regeneration with STEM and NHCS
3.5 The Seven Players – and the Three We Forget
3.6 Closing – When the Butterfly Sneezes
Core Takeaway – Changing how we see ourselves in the system
Part A: The Ripple Effect — From the Farmer’s P 5 Beetroot to the P 40 Plate
1. An economic observation
A kilogram of beetroot may seem like a simple commodity. Yet inside that red root is the entire economy of a nation. Six players each shape one another and are shaped by each other. When the farmer lifts her price by a few pula, it affects retailers and caterers. It impacts consumers and labourers. The state is also influenced by this change.
In a well-coordinated system, those ripples dampen quickly. In a disjointed one, they echo back and forth until everyone feels poorer.
Tracing the True Cost of a Beetroot: From Farm to Plate
Understanding why beetroot sells for P20/kg in retail requires unpacking every layer between soil and spoon. The farmer earns only P4–5/kg.
Contrary to the common assumption that retailers “keep the profit,” the real story is quite different. It involves cost absorption and system inefficiency rather than greed.
a. End Consumer – The Office Meal Plate
- Plate price: ~P40 per meal.
- Beetroot portion: ~100 g cooked (≈150 g raw).
- Plates per kg raw beetroot: 6–7.
- Value of beetroot portion: ~P6–7 per plate.
➡️ Effective consumer cost: ≈P40/kg equivalent of beetroot once it is part of a full plated meal.
Summary:
For the consumer, beetroot is not seen as a costly ingredient. It forms only one side of a balanced plate. Yet at P40/kg equivalent, the same vegetable has multiplied eightfold from the farmer’s original P5/kg sale.
Punchline: Consumers don’t see the strain because they see only the plate, not the chain.
b. Caterer – Turning Raw Beetroot into a Side Dish
- Retail purchase price: ≈P20/kg.
- Cooking shrinkage: ~30 % (1 kg raw → 700 g cooked).
- → Effective ingredient cost: P28–29/kg cooked.
- Additional operating costs:
- Cooking oil, vinegar, spices, gas/power: P4–5/kg.
- Preparation labour (washing, peeling, cooking, cutting): P5–6/kg.
- Delivery/logistics: P2–3/kg.
- Total cost to caterer: ≈P38/kg cooked beetroot.
Summary:
At P38/kg, caterers are already operating near breakeven against a P40/kg recovery from the plate price.
Even a small rise in the farm-gate or retail price erases their profit entirely.
This is why caterers appear “price-sensitive”: they have no slack left in their margin.
Punchline: Caterers run on fumes; tiny upstream increases wipe out margin.
c. Retailer – The Hidden Middle Costs
- Buying price from farmers: P4–5/kg.
- Breakdown of additional costs (per kg of final retail price P20):
- Transport from farm: P2 (≈10 %)
- Cold storage, handling, and spoilage: P3–4 (15–20 %)
- Store rent, energy, staff, packaging, compliance, shrinkage: P6–7 (30–35 %)
- Net profit margin: P3–4 (15–20 %)
➡️ Real retailer profit: ≈P3/kg — not P16.
Summary:
What appears to be a wide gap between the farm and the shelf is mostly overhead.
Retailers operate on thin real profits while shouldering refrigeration, electricity, salaries, and spoilage losses.
If it were easy or profitable for farmers to sell directly, many would have done so long ago. Many would have seen 10-20,000 customers walk through their gates each day.
Retailing is a different business — capital-intensive, compliance-heavy, and risky.
Punchline: The “P15 gap” is mostly overhead and risk, not profit.
d. Farmer – The Starting Point
Typical production costs for small to medium beet farms in Botswana:
| Cost Item | Range (P/kg) |
|---|---|
| Seeds & inputs | 0.80 – 1.20 |
| Fertiliser & soil preparation | 0.80 – 1.00 |
| Irrigation, energy & water | 0.60 – 0.80 |
| Labour | 0.80 – 1.00 |
| Harvesting & packaging | 0.50 – 0.80 |
| Farm overheads | 0.50 – 0.70 |
| Total Cost Range | 3.50 – 5.50 |
Summary:
At a selling price of P4–5/kg, farmers are operating at or below cost depending on yield.
This leaves no room for reinvestment in irrigation, labour, or expansion — keeping farms small and fragile.
Punchline: At P4–5/kg, farmers are at/under cost—no reinvestment cushion.
e. The Complete Chain – Costs per kg of Beetroot
| Layer | Input / Base Cost (P/kg) | Selling Price (P/kg) | Approx. Profit (P/kg) | Notes |
|---|---|---|---|---|
| Farmer | 3.5 – 5.5 | 4 – 5 | ≈ 0–0.5 | Breaks even at best. |
| Retailer | 4 – 5 | 20 | ≈ 3 | Real profit ≈ 15 %; bulk absorbed by overhead. |
| Caterer (cooked) | 20 raw → 38 cooked | 40 (plate equivalent) | ≈ 2 | Extremely tight margin. |
| Consumer | — | 40 | — | Sees only final plate price, not the cumulative chain. |
f. What the Data Shows
Retailers are not “keeping” P16/kg.
Most of that margin evaporates into transport, electricity, staff, and spoilage.
Farmers sell at or below cost.
They absorb biological risk without a financial buffer.
Caterers operate on fumes.
Their entire P40 plate price barely covers cooked beetroot costs once prep and logistics are included.
Consumers perceive stability, not strain.
They see the P40 meal, not the imbalanced structure behind it.
Punchline: Movement without prosperity.
g. The Systemic Insight
Every link is absorbing inefficiency because no national coordination spine connects them.
- Farmers plant without market signals.
- Retailers import unpredictably to fill gaps.
- Caterers pay for inconsistency with higher costs.
- Consumers face quiet inflation hidden inside the meal price.
Without coordination, the entire chain functions like a series of disconnected pumps. Each builds its own pressure. None drives flow.
In short:
The beetroot doesn’t cost too little at the farm or too much on the plate. It costs exactly what an uncoordinated system produces. This includes high effort, low reward, and invisible waste.
2. The Baseline System — When the Farm-Gate Price Is P 5/kg
Assumptions: 1 ha = 40 tons yield. Farmer production cost ≈ P 5/kg.
| Layer | Input Cost (P/kg) | Ops & Handling (P/kg) | Revenue (P/kg) | Profit (P/kg) | Margin (%) | Commentary |
|---|---|---|---|---|---|---|
| Farmer | 5.00 | — | 5.00 | ≈ 0.00 | 0 % | Sells at cost; no cushion for loss or reinvestment. |
| Retailer | 5.00 | 15.00 (transport + storage + staff + shrink + margin) | 20.00 | 3.00 | 15 % | Margin looks high but includes spoilage risk and unionised labour.* |
| Caterer (cooked) | 20.00 (raw) | 18.00 (cooking shrink + ingredients + labour + delivery) | 38.00 | 2.00 | 5 % | Runs on thin margins; relies on volume. |
| Consumer (plate) | 38.00 (cost/kg cooked beet) | 2.00 (service + profit) | 40.00 | — | — | Pays P 40 for a full meal; beetroot one side dish. |
Observation: Every layer is working, few are thriving. The system produces movement, not prosperity.
Although the spread between farm-gate and retail looks like a P15 margin, only about P3 /kg is actual profit.
*The rest — roughly P12 /kg — is consumed by transport, cold-storage energy, rent, packaging, spoilage, unionised wages, taxes, and compliance costs.
If selling direct were truly easy for farmers, many would have become retailers long ago. They would be seeing 10-20,000 customers walk through their doors daily. But retailing is a capital-intensive, risk-heavy business with constant overheads and perishable losses.
What appears as a profit gap is actually a reflection of two kinds of risk. One is biological risk on the farm. The other is logistical risk in the marketplace. Both need to be managed, not merely priced.
Punchline: When value chains lack coordination, profit behaves like water on an uneven table. It moves, but it doesn’t grow.
3. When the Farmer Raises Price from P 5 → P 8/kg
Farm-gate increase = +60 %. Each player reacts in turn.
| Layer | Prev Input (P/kg) | New Input (P/kg) | Ops & Handling (P/kg) | New Revenue (P/kg) | Profit (P/kg) | Δ Margin | Commentary |
|---|---|---|---|---|---|---|---|
| Farmer | 5 | 5 | — | 8 | 3 | +60 % gain | Short-term relief; higher gross but may lose buyers. |
| Retailer | 5 | 8 | 15 | 23 | 3 | –2 pts | Passes cost downstream; absorbs some shrink. |
| Caterer (cooked) | 20 | 23 | 21 | 44 | 0 | –5 pts | Margins collapse; must raise plate price. |
| Consumer (plate) | 40 | 46–48 | — | 46–48 | — | Faces +15–20 % inflation on meal price. |
Observation: Farmer’s gain (+3 P/kg) triggers +15 % retail inflation and erases caterer margin.
Punchline: Farmer gains +P3/kg, caterer margin collapses, plate inflates +15–20%.
4. Comparative Margins Summary
| Layer | Profit (P/kg) @ P 5 | Profit (P/kg) @ P 8 | Change (%) | Winner / Loser |
|---|---|---|---|---|
| Farmer | 0 | 3 | + ∞ | Winner (short-term) |
| Retailer | 3 | 3 | 0 | Neutral |
| Caterer | 2 | 0 | –100 % | Loser |
| Consumer | — | — | +15–20 % cost | Loser |
| System | — | — | Net – | Weaker overall |
Reflection: > Profit shifted location, not magnitude. Without coordination, the system cannot create new value — it only reshuffles scarcity.
Punchline: Price hikes shift profit location; coordination grows profit magnitude.
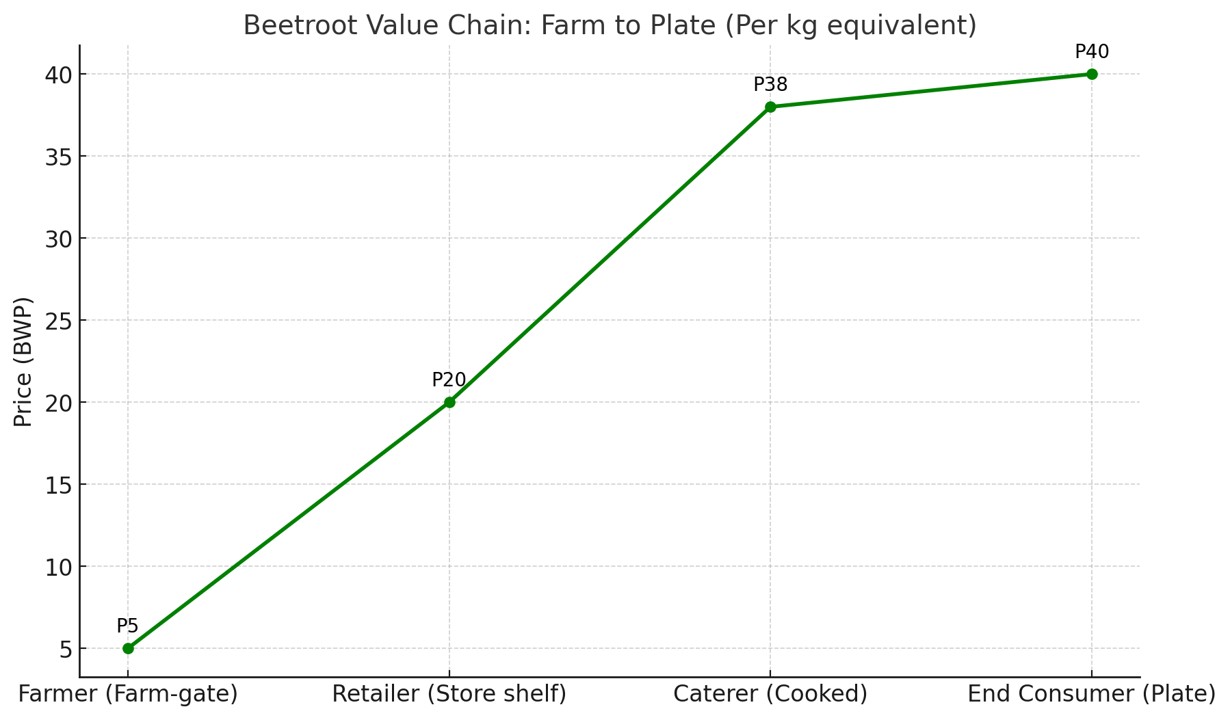
5. Where the Ripples Come From
Every pula that changes hands carries invisible costs:
- Retailers carry storage, energy, staff, compliance.
- Caterers carry shrinkage, prep labour, logistics.
- Consumers carry wage pressures and inflation anxiety.
Prices rise at the base without productivity growth or coordination. Each downstream player protects itself by passing on costs. They cut quality or reduce labour.
The system tightens like a chain under tension; every link creaks.
As Linda Booth Sweeney wrote in When a Butterfly Sneezes, small events lead to other happenings. These happenings connect in surprising ways.
In Botswana’s horticulture, a three-pula sneeze at the farm-gate can shake the whole plate.
Punchline: A three-pula sneeze shakes the whole plate.
6. The Structural Insight
What this case shows is not greed but structure.
The cry of the farmer (“I can’t survive on P 5/kg”) reflects a missing element. The cry of the caterer (“I can’t sell a P 48 plate”) is the same. Both are echoes of a need for a coordinated system. This system should balance supply, demand, logistics, and labour.
When systems are tight, prices can rise and everyone still profit.
When systems are loose, even generosity becomes inflation.
Punchline: Tight systems can absorb price moves; loose systems convert generosity into inflation.
7. Bridge to Part B — “When the Butterfly Sneezes”
Raising prices cannot make a weak system strong. Only productivity and coordination can.
In Part B, we follow this beetroot deeper into the soil. We explore how regenerative practices, labour productivity, and the state’s STEM backbone can transform cost into capacity.
In the end, the farmer’s hand is not the only factor that shapes the price of a plate. It is also the mind of a nation learning how its parts connect.
(End of Part A – The Ripple Effect)
Now, let’s move to Part B: “When the Butterfly Sneezes — The Unseen Players in Botswana’s Food System.”
Part B: When the Butterfly Sneezes — The Unseen Players in Botswana’s Food System
1. The quiet cause behind the farmer’s cry
In Part A, we saw how a farmer’s small price change at the soil surface affects the entire chain. This change inflates costs and erodes profits downstream.
Yet those ripples begin even deeper. They originate in the unseen conditions of the soil. The skills of labor play a role, alongside the coordination of the state.
Linda Booth Sweeney reminds us in When a Butterfly Sneezes that small causes can have big effects. This is especially true in systems that are already under tension.
In Botswana’s horticulture, the “sneeze” is often invisible. It includes an under-trained workforce, an uncoordinated logistics chain, and a budget released without a plan.
Each seems small; together they decide whether every player profits or barely survives.
2. Conventional, Organic, and Regenerative Farming Economics
| System | Yield (t/ha) | Total Cost (P/ha) | Cost (P/kg) | Farm-Gate Price (P/kg) | Revenue (P/ha) | Profit (P/ha) | Profit Margin (%) | Commentary |
|---|---|---|---|---|---|---|---|---|
| Conventional | 30 | 165 000 | 5.5–6.0 | 5.5–6.0 | 180 000 | 15 000 | 8–9 % | High synthetic inputs and fuel dependency; yields fluctuate with weather and pest cycles. |
| Organic (Certified) | 28 | 210 000 | 7.0–7.5 | 7.5–8.5 | 224 000 | 14 000 | 6–8 % | Conversion and audit costs; lower yield; depends on sustained premium demand. |
| Regenerative | 40 | 190 000 | 4.8–5.2 | 5.8–6.0 | 240 000 | 50 000 | 20–22 % | Inputs fall 10–25 % by Year 3; soil structure and water efficiency raise yield; most resilient long-term. |
(Baseline: 1 ha beetroot, open-field, Botswana; currency = BWP.)
Punchline:
Regeneration earns more not by charging more but by wasting less.
It restores both soil and solvency.
3. Labour Productivity and Cost — Botswana, Malaysia, and China
Step 1. Setting up the context
To understand how labour costs and STEM productivity shape competitiveness in regenerative (Regen) vs conventional farming — comparing Botswana to:
China (low-wage, high-productivity, strong STEM coordination), and
A non-distant, STEM-strong peer — a country shares closer institutional and social structures with Botswana. This country has managed to integrate STEM deeply into agriculture.
📍 Suitable comparison: Malaysia
Why Malaysia?
- Not culturally or politically “distant” (multi-ethnic, developing economy, democratic institutions).
- Has STEM integration across education, manufacturing, and agro-technology.
- Mid-level wages (not as cheap as China, not as high as OECD).
- Strong public-private coordination in horticulture and food exports (e.g., Cameron Highlands vegetable clusters).
- Realistic aspiration path for Botswana’s next 20 years.
Step 2. Approximate labour costs
| Country | Average Agricultural Wage (BWP equivalent/hr) | Avg Monthly (BWP) | Remarks |
|---|---|---|---|
| Botswana | P20–25/hr | P4,000–5,000 | Labour market tight; strong unions push for steady increases; relatively low productivity/hour. |
| China | P10–12/hr | P2,200–2,500 | Lower nominal cost, but very high labour productivity due to tech, mechanisation, STEM oversight. |
| Malaysia | P15–18/hr | P3,000–3,600 | Balanced wages with higher output per worker (mechanised, digitally managed farms). |
Chinese wages are half those of Botswana. However, their output per worker is often 3–4× higher. This means the unit labour cost per kg of produce ends up far lower.
Step 3. Labour cost per kg of beetroot (by system)
Let’s assume 1 hectare beetroot with ~40 tons yield (regenerative steady-state), ~30 tons (conventional).
Farm labour hours include planting, maintenance, irrigation, harvesting, grading.
| Country/System | Labour Hours/ha | Wage (BWP/hr) | Labour Cost/ha (P) | Yield (tons/ha) | Labour Cost/kg (P) |
|---|---|---|---|---|---|
| Botswana – Conventional | 1,000 | 22 | 22,000 | 30 | 0.73 |
| Botswana – Regenerative | 1,200 | 22 | 26,400 | 40 | 0.66 |
| China – Conventional | 700 | 11 | 7,700 | 40 | 0.19 |
| China – Regenerative | 850 | 11 | 9,350 | 45 | 0.21 |
| Malaysia – Conventional | 800 | 16 | 12,800 | 35 | 0.37 |
| Malaysia – Regenerative | 950 | 16 | 15,200 | 42 | 0.36 |
🌍 Observations
Unit labour costs per kg
Botswana: ~P0.65–0.75/kg
Malaysia: ~P0.35/kg
China: ~P0.20/kg
China achieves triple the efficiency despite lower pay, due to STEM-driven mechanisation, logistics integration, and continuous R&D feedback loops.
STEM intensity equals productivity
China: tech platforms link field to market daily.
Malaysia: medium-tech, government coordination, farmer co-ops with digital traceability.
Botswana: strong individual farmer effort, but low integration — data and skills sit in silos.
Regen effect
Regenerative increases labour slightly (10–20%) but offsets through yield and soil stability.
Over time, Regen reduces unproductive labour (weed management, pest crisis responses) — smart work, not harder work.
Punchline: Productivity isn’t hand strength; it’s system clarity.
Step 4. Total cost comparison (farming system + labour + inputs)
| Country/System | Total Cost/kg (P) | Key Cost Drivers |
|---|---|---|
| Botswana – Conventional | 5.5–6.0 | Inputs & labour dominant, low mechanisation. |
| Botswana – Regenerative | 4.8–5.2 | Lower inputs, higher yield, slightly more labour. |
| China – Conventional | 2.8–3.2 | Scale, automation, supply-chain optimisation. |
| China – Regenerative | 3.0–3.4 | Balanced system with government incentives, compost integration. |
| Malaysia – Conventional | 3.8–4.2 | Efficient mid-cost structure, cooperative marketing. |
| Malaysia – Regenerative | 3.5–3.8 | Integrated supply systems, stable yields, lower loss. |
Punchline: The multiplier is coherence, not cash injection.
Step 5. Interpretive insight
- Botswana’s challenge is not wage level — it’s output per hour.
We pay similar to Malaysia. We pay more than China. However, we produce only half the output because the STEM backbone and coordination spine are missing. - Regen alone is not enough. It must be coupled with STEM discipline — data, measurement, systems, integration.
- STEM turns Regen into strategy; without STEM, Regen becomes romantic.
💡 The Takeaway
A beetroot farmer in Botswana may spend the same on wages as a farmer in Malaysia. However, they produce half as much per hectare. The difference is not the hand. It is the system guiding it. STEM is present at every level, from soil testing to national logistics.
China’s system multiplies each worker’s output through data and coordination. In contrast, our system still isolates the worker. It also isolates the farmer and the policymaker. Until we bridge that gap, we will continue to pay more per kilogram. We will earn less per hour, even though our farmers work just as hard.
Our national goal should be to bring production costs down from the current P5.50–P6.20/kg to P3.50–P3.80/kg within the first three years, and to reach P3.00–P3.40/kg beyond the third year.
By the time we arrive at those levels, others will already have lowered theirs further — because efficiency compounds. It’s what athletes and craftsmen call muscle memory. When they train their muscles to work efficiently, those muscles become faster and stronger.
| Country / System | Avg Wage (P/hr) | Labour Hours/ha | Labour Cost/ha (P) | Yield (t/ha) | Labour Cost (P/kg) | Total Cost (P/kg) | Commentary |
|---|---|---|---|---|---|---|---|
| Botswana – Conventional | 22 | 1 000 | 22 000 | 30 | 0.73 | 5.5–6.0 | High wage relative to productivity; weak mechanisation and coordination. |
| Botswana – Regenerative | 22 | 1 200 | 26 400 | 40 | 0.66 | 4.8–5.2 | More labour initially, but yield compensates; creates skilled rural jobs. |
| Malaysia – Regenerative | 16 | 950 | 15 200 | 42 | 0.36 | 3.5–3.8 | Medium wage, high STEM application; co-ops and digital traceability improve efficiency. |
| China – Regenerative | 11 | 850 | 9 350 | 45 | 0.21 | 3.0–3.4 | Low wage, strong coordination and automation; highest output per worker. |
Reflection
Productivity is not the strength of the hands but the clarity of the system guiding them.
Botswana’s labour is not expensive — it is under-directed.
4. What Happens When Botswana Combines Regeneration with STEM
If Botswana’s 30 % horticulture land (≈ 3 million ha) shifted gradually toward regenerative practices under a National Horticulture Coordination System (NHCS):
| Year | % Regen Adoption | Yield Gain (%) | National Profit (BWP Bn) | Change vs Status Quo | Commentary |
|---|---|---|---|---|---|
| 3 | 20 | +10 | 126 | Baseline | System still fragmented. |
| 5 | 40 | +20 | 162 | +36 Bn (+29 %) | Early NHCS coordination; farmer mentoring; visible GDP effect. |
| 10 | 60 | +35 | 198 | +72 Bn (+57 %) | STEM-trained labour expands; data informs planting calendars. |
| 20 | 80 | +50 | 234 | +108 Bn (+86 %) | Full coordination spine; stable markets; rising rural incomes. |
Reflection
When the state learns to see the system as a whole, national profits rise without raising prices.
The real multiplier is not money injected, but coherence built.
5. The Seven Players — and the Three We Forget
The painful truth is that the areas of highest leverage are often the least obvious. It is easy, as the farmer groups show each week, to toss around ideas about prices, inputs, and retail margins. Yet the power to change those pains lies elsewhere. It resides quietly in the soil. It is found in the discipline of labour and in a state that directs its STEM muscle towards agriculture.
Labour must recognize itself as more than a voice demanding fairness. It must actively participate in a global race for productivity. It is not enough to speak for higher pay when output per hour remains low. Economics cannot do miracles where labour does not first do the work itself. If productivity stalls, the entire economy suffers. Borrowing costs rise. Inflation creeps in. Every other player absorbs the shock. The wages labour receive will never be enough.
The state, meanwhile, must rediscover its long-term role as the system’s conductor. Its task is not only to distribute budgets. It must also direct STEM intentionally into agriculture. This will ensure that data, measurement, and research become daily tools of governance, not rare events.
That begins with a national shift in education. This involves playing down the dominance of non-science subjects. It also means raising the quality of mathematics and science across the board. These improvements are necessary not only for the best students but also for the average classroom. When the median student performs at the world’s upper quartile, the nation’s productivity begins to move.
In systems thinking, we say that small changes can create big results. However, finding those points of leverage is never easy. They hide in places we are least likely to look. The tip is simple: look around the room and ask who is not there. Then listen for their voices. That is where the answers often lie.
The Seven Players — and the Roles They Play
THE FORGOTTEN THREE:
The State – the unseen conductor that sets rhythm, measures, and accountability.
Labour – the hands that transform coordination into productivity. This productivity surpasses the world.
Soil – the quiet foundation; holds memory, fertility, and future yield.
WHERE WE FOCUS OUR ATTENTION:
Farmer – creates value from soil through skill and risk.
Retailer – connects that value to the market.
Caterer – translates produce into meals and employment.
Consumer – completes the loop through demand and choice.
When only the first four talk, profits fight.
When the last three join — the soil, labour, and the state — profits multiply.
In systems, the highest leverage actions are rarely found in reacting to events (e.g., “raise prices,” “import more”).
They are found in changing the relationships and information flows between parts. Soil, labour, and the state communicate and learn together.
Lesson: The “butterfly sneeze” for Botswana may not be more funding but better integration — data, training, and trust.
The system stabilises not when prices rise, but when learning, labour, and leadership align.
Punchline: When only the obvious four talk, profits fight; when soil, labour and state join, profits multiply.
6. Closing — When the Butterfly Sneezes
A small change in how we train a worker may seem trivial. Measuring soil moisture or aligning crop calendars might also seem insignificant — like a butterfly’s sneeze.
But in a fragile system, that sneeze decides whether the chain trembles or holds steady.
The path ahead is clear:
- Build the coordination spine (NHCS) so the nation’s horticulture moves as one.
- Embed STEM discipline across governance, labour, and farming.
- Let regenerative practices rebuild soils while data rebuilds trust.
Only then will every player — farmer, retailer, caterer, consumer, labour, and state — earn enough to rest easy, together.
Core Takeaway
The deepest leverage lies not in the next policy. The real change comes from altering how people see themselves in relation to one another. It also involves helping the “silent players” (soil, labour, state) regain their voices in the story.
(End of Part B – When the Butterfly Sneezes)
🪜 Botswana’s Horticulture Value-Chain Ladder — The Seven Players
Each step adds value, risk, and responsibility. The question is not who profits most — but who holds the leverage to make the entire chain prosper.
🔁 Interdependence Summary
| Player | Type of Value Added | % Influence on Final Cost | Hidden Leverage |
|---|---|---|---|
| Soil | Ecological | ~25% | Regeneration & moisture retention |
| Farmer | Production | ~20% | Efficiency, timing, data accuracy |
| Retailer | Distribution | ~20% | Cold-chain & sourcing coordination |
| Caterer | Transformation | ~10% | Waste reduction, menu design |
| Consumer | Demand signal | ~10% | Conscious purchasing, feedback |
| Labour | Productivity | ~10% | Skills, STEM application |
| State | Governance | ~5% (but systemwide) | Coordination, STEM, NHCS backbone |

🪶 Reflection
A nation’s horticulture isn’t defined by the quantity of crops its farmers grow. Instead, it is defined by how well its seven players learn to work together.
Profit stops fighting when soil, labour, and the state are invited back into the conversation.
The rest — farmers, retailers, caterers, and consumers — can then finally share in what the system creates.
Share this:

I Can Sleep When the Wind Blows: What Botswana’s Horticulture Needs Beyond Funding & Allocations
There is an old parable titled “I Can Sleep When the Wind Blows.”
I Can Sleep When the Wind Blows | Shayne M. Bowen | 2018
A farmer hires a young hand. Each night, no matter the weather, the young man goes to bed early. When a storm finally breaks, the farmer panics. He runs to check the fields. However, he discovers that the barn doors are fastened. The tools are secured. The animals are sheltered. The hay is tied down. Everything had been prepared. The young man could sleep when the wind blew, because his work was already in order.
Budgets without backbone
Currently, I observe the following trends in the country. All governments, past and present, have focused mainly on budgeting and disbursing the funds they receive. The machinery is geared to release money and “create a conducive environment.” It monitors. But it does this without actually planning the industry itself.
That is a shame. Because when we avoid planning the industry, we trap ourselves in an endless cycle:
- cash allocations that don’t yield repayment,
- borrowers who appear to build assets with money that does not belong to them,
- and a country that thickens its skin the next time it seeks funding — all without seeing real economic growth.
There is also an unspoken hope that we will be let off the hook because “we are Africans.” But finance does not forgive weak structures.
Dividing what should be united
Each cycle, allocations are trumpeted to youth, women, and farmers. But in reality, these three are not separate categories — they are a family. Women and youth are embedded in family farms. To slice them into compartments for the sake of budgeting is not only wasteful, it is divisive.
True industry planning does not start with who gets the allocation. It starts with building the backbone that ensures profitability for all: demand mapping, planting calendars, logistics, markets, and reinvestment. Once this spine is in place, the benefits naturally flow to every farmer — whether woman, youth, or elder.
Why the backbone is ignored
The deeper reason this backbone is overlooked is the dichotomy we live with as a nation. We underplay the role of STEM in our economy and agriculture. Yet agriculture is one of the industries that most demands a STEM-disciplined approach. This ranges from governance structures down to the farmer’s choice of seed.
When land and GDP are tended by hands guided by STEM discipline, they produce predictability, scaling, and growth. When managed without it, results fluctuate with the weather, pests, and luck.
One hectare, two futures
To make this real: take two farmers, each with 1 hectare.
- The STEM-hardwired farmer runs soil tests and balances water precisely. She selects the right seed for climate and disease. She also manages pests with foresight. Over five years, her profits grow steadily from BWP 80,000 to over 100,000.
- The non-STEM farmer plants by habit and intuition. Some seasons bring decent returns, others collapse under shocks. Over the same period, his profits swing wildly, sometimes as low as BWP 5,000.
One farmer can reinvest and scale. The other cannot.
STEM as the Backbone
Agriculture is not only about soil and seed — it is about systems, and systems require STEM discipline. From governance down to the individual farmer, STEM makes the difference between sustained growth and endless frustration.
On the farm — with STEM
- Seed selection: Matching varieties to soil type, climate, and disease resistance using agronomic trials and data.
- Water management: Irrigation calibrated to evapotranspiration rates, soil moisture sensors, and seasonal rainfall models.
- Fertilisation: Nutrient application based on soil chemistry analysis, preventing both waste and depletion.
- Pest management: Integrated pest management (IPM) using monitoring thresholds and biological controls rather than reacting late with chemicals.
- Scaling: Precision data provides confidence to expand from 1 ha to 2, then 10 — with predictable margins.
On the farm — without STEM
- Seeds chosen by habit or availability, vulnerable to climate shifts.
- Irrigation by “eye” — too much or too little water.
- Fertiliser applied reactively, causing soil exhaustion.
- Pests noticed too late, leading to crop loss or costly sprays.
- Scaling is a gamble; banks are hesitant to lend.
The result? Inconsistent yields, poor profitability, and farmers dropping out of horticulture.
In the system — with STEM
- Data pipelines: Retailers share weekly SKU-level demand, analysed and published as crop calendars.
- Forecasting: National dashboards project shortfalls or surpluses, triggering clear import or storage policies.
- Logistics design: Cold chain hubs placed using flow models of supply vs. demand, not guesswork.
- Finance: Lenders and insurers trust the system because data reduces risk.
In the system — without STEM
- Ministries working in silos — Agriculture with farmers, Trade with retailers, no shared demand–supply map.
- Imports opened or closed arbitrarily, undercutting local farmers.
- Collection centres built as afterthoughts, often underused because produce doesn’t match demand.
- Credit extended, but repayment fails because profitability was never secured.
The absence of STEM discipline is what gets in the way of building the coordination systems horticulture requires. Without it, money flows — but growth stalls.
👉 This section shows concretely: STEM is not just a “nice-to-have” in farming. It is the backbone of both productivity and coordination.
Scaling to the nation
Now imagine horticulture taking 30% of Botswana’s crop land (≈3 million ha), with STEM adoption rising over time.
| Year | STEM Area (ha) | Non-STEM Area (ha) | STEM Profit (BWP Bn) | Non-STEM Profit (BWP Bn) | Total Profit (BWP Bn) |
|---|---|---|---|---|---|
| 3 | 600,000 | 2,400,000 | 54.0 | 72.0 | 126.0 |
| 5 | 1,200,000 | 1,800,000 | 108.0 | 54.0 | 162.0 |
| 10 | 1,800,000 | 1,200,000 | 162.0 | 36.0 | 198.0 |
| 20 | 2,400,000 | 600,000 | 216.0 | 18.0 | 234.0 |
With a STEM backbone, national profits rise steadily and reinvestment becomes possible. Without it, volatility, waste, and default persist.
What leadership requires
The leader who takes this on will not just fix horticulture. They will demonstrate that Botswana can move from funding to building industries that plan and re-fund themselves.
That leader will be remembered for building the industry spine. It was the system that allowed farmers, families, and the nation to reinvest. It let them scale and finally sleep when the wind blows.
Closing thought
Botswana does not lack hardworking farmers. It lacks the discipline of coordination and STEM-driven planning that secures the barns before the storm. If we build that spine, we can turn volatility into predictability, allocations into industries, and families into investors.
Then, and only then, will we all be able to say:
“I can sleep when the wind blows.”
Share this:


Horticulture Farmers Can’t Plant Blind: Why Botswana Needs a National Horticulture Coordination System
She had done everything right.
Bought the seeds. Paid for inputs. Hired labour. Measured every drop of water. Watched over her crop with the kind of personal care only farmers understand. After weeks of nurturing, her cherry tomatoes gleamed on the vines — plump, red, and ready.
She took them to the retailer who once told her, “When you have them, bring them.”
But when she arrived with her harvest, the same buyer turned her away.
“Who placed an order for cherry tomatoes?” the retailer asked.
No order meant no sale. Hours of sweet labour, investment, and determination — side-stepped.
And here’s the bitter twist (and a true story). Those very tomatoes had just won first prize at the national agricultural show. The nation had applauded her produce, yet her local retail shelves never saw it. By the time the retail chain placed its order, it was for imported cherry tomatoes. They simply did not know that, in their own backyard, a farmer was already producing prize-winning fruit.
Why this matters
This is not just one farmer’s story. It is a mirror of the system we all work within.
- Horticulture farmers plant blind, not knowing what demand will look like when the crop matures.
- Retailers scramble, relying on imports because there is no coordinated calendar of who is growing what, where, and when.
- Policymakers toggle between bans and openings, without a real-time picture of supply gaps or gluts.
The result? Crops are wasted in fields. Empty shelves in shops. Rising import bills. And declining confidence among the very farmers we need to carry this sector forward.
The bigger issue
This story is not about one farmer. It is about a system where demand lives with Trade. Supply oversight sits with Agriculture. The bridge in between is missing. Farmers plant in hope, retailers stock in panic, and national policy oscillates between bans and openings.
How did other countries solve this?
How other countries broke the cycle
- Netherlands: transparent flower and vegetable auctions give growers and buyers the same daily data.
- Spain’s Almería region: cooperatives coordinate planting schedules, logistics, and marketing so no farmer is left stranded.
- Kenya: a single horticulture directorate oversees both production and marketing, ending the “split brain” between ministries.
- India’s Operation Greens: real-time demand intelligence and price stabilization prevent wipeouts from gluts and shortages.

This picture (which shows the split between Ministry of Agriculture and Ministry of Trade, and the missing coordination in the middle):
Note:
This picture highlights a critical gap in Botswana’s horticulture sector.
- On one side of each vertical line, the Ministry of Agriculture oversees farmers, extension, and production.
- On the other, the Ministry of Trade manages retail, imports, and demand data.
- In the interim, there is no coordinating mechanism. It is unclear who grows what, where, and when to match the actual demand in shops and institutions.
The result is wasted crops, empty shelves, and farmers discouraged from investing further.
A National Horticulture Coordination Unit can bridge this gap. It links production to market demand. It publishes clear crop calendars. This unit ensures imports are guided by real data—not guesswork.
Without this bridge, farmers will continue to plant blind. With it, Botswana can move from meeting 70% of its demand to achieving 100% and beyond.
Each of these countries built what Botswana lacks. It is a coordination spine that maps demand to supply. This gives both farmers and retailers a reliable compass.
What Botswana can do
Establish a National Horticulture Coordination Unit – jointly housed by Trade and Agriculture, with clear legal authority.
Publish a Horticulture Market Observatory – weekly retailer data (sales, volumes, gaps) made visible to farmers and policymakers.
Issue crop calendars by district – so farmers know when and how much to plant.
Invest in packhouses and cold chain hubs – so produce doesn’t die at the farm gate.
Set transparent import triggers – clear rules on when imports open and close, avoiding last-minute surprises.
We found several existing or emerging initiatives in Botswana. They partly touch on what we’re describing. Some are close to the supply-demand pipeline we want to build. Others are still missing elements. These might be things you can link into or build upon.
Snapshot: what exists, strengths, and gaps
| Initiative (owner) | What it covers | Strengths we can leverage | Gap vs. “coordination spine” | Quick next step |
|---|---|---|---|---|
| Letsema Horticulture Market (Gaborone, Block 3) | Centralized wholesale-style market; farmer aggregation; quality/price transparency ambitions. | Physical node; recognizable brand; farmer access; early digital footprint. (Letsemahm) | Not yet a nationwide demand-forecast or pre-order system; weak link to retailer SKU forecasts and planting calendars. | Pilot weekly pre-orders from major retailers + simple demand dashboard posted every Friday. |
| Tokafala Horticulture Programme (Debswana) | A 3-year, demand-driven horticulture program to support SMMEs. | Explicit demand orientation; private-sector discipline; delivery capacity. (Debswana) | Not yet publicly tied to national import rules or district planting calendars. | Invite Tokafala to share anonymized demand signals to a public Market Observatory (see below). |
| PYEC – Horticulture Readiness (OP/PSRU) | TVET + change-management workshop to stream youth into horticulture. | National convening power; change-management tooling; youth pipeline. (Your doc.) | On-ramp for talent, but no market-signal backbone—risk of youth repeating old frustrations. | Make “Market Observatory + crop calendars” a deliverable of PYEC’s action plan. |
| NAMPAADD (MoA) | Long-standing plan to modernize arable agriculture; identifies under-used horticulture potential and calls for coordinated cropping. | Policy legitimacy; extension footprint; precedent for coordination. (FAOLEX Database) | Never fully operationalized into weekly demand data, rules-based imports, or public calendars. | Refresh NAMPAADD’s horticulture chapter with district-level sow/harvest targets tied to retailer data. |
| FAO Hand-in-Hand (HiH) | Evidence-based, country-led investment planning; typology tools. | Data tools & geospatial analytics that can power targeting and calendars. (FAOHome) | Not yet configured as retail demand → farm supply pipeline for Botswana SKUs. | Request FAO HiH support to stand up a lightweight Market Observatory (see below). |
| NDB / Grants & Finance windows | Credit & recent horticulture grant guidelines; blended finance possibilities. | Can nudge compliance (e.g., finance only when farmer slots align to calendars). (NDB) | Finance currently decoupled from demand forecasts and import triggers. | Make finance conditional on calendar-aligned offtake (pre-order or market slot). |
| IFAD / FAO field schools & ASSP-type support | Capacity, “farming as a business,” climate-smart practices. | Training backbone that can teach market-aligned production. (IFAD) | Training often production-centric, not demand-calibrated. | Add a Market Intelligence module + weekly planning ritual. |
What’s still missing (and how to add it quickly)
The missing piece is a public, rules-based, demand→supply pipeline that everyone can see.
Horticulture Market Observatory (public web page + PDF weekly)
Retailers/markets submit weekly SKU volumes, price bands, stockouts (simple template).
Publish a Friday snapshot + 8-week rolling forecast by district/crop.
Use FAO HiH tooling for the analytics layer. (FAOHome)
District Crop Calendars & Planting Targets
Start with top 8–10 veg; publish sow/harvest windows + target tonnage per district (refresh monthly).
Base targets on the Observatory forecast + Letsema/Tokafala signals. (Letsemahm)
Transparent Import Trigger Bands
Example: if projected supply <85% of demand for 4–6 weeks, open imports; >110% triggers processing/price-stabilization measures.
Announce changes via the Observatory (predictability for farmers and retailers).
Finance/Grant Conditionality
NDB/other windows require an assigned market slot (pre-order or auction) or alignment to district targets. (NDB)
90-day stitching plan (practical)
- Week 0–2: Form a small Working Cell (MoA, MoT, Letsema, Tokafala, two retailers, NDB, FAO HiH).
- Week 2–6: Stand up v1 Market Observatory (Google Sheet → public webpage); collect first 4 weeks of retailer SKUs.
- Week 4–8: Publish draft crop calendars for two corridors (Gaborone–South, Francistown–North); recruit 50 pilot farmers via PYEC/TVET.
- Week 6–10: Pilot Friday pre-order window at Letsema (listing + minimum volumes); Tokafala farmers prioritize listed SKUs. (Letsemahm)
- Week 10–12: Announce import-trigger bands for those SKUs; align NDB grant/loan approvals to calendar slots.
The prize-winning tomatoes that never reached the shelf
The farmer in our story is not unique. Across Botswana, farmers are working with grit, faith, and long hours. They produce quality food. This food too often fails to meet the market. It is not because of their shortcomings. It is because the system has no bridge between production and demand.
Her cherry tomatoes were good enough to win the nation’s top prize. Yet they could not win a spot on the nation’s dinner tables.
That gap is what a National Horticulture Production Management System is meant to close.
Closing thought
Farmers can’t plant blind.
Retailers can’t stock empty shelves.
Policymakers can’t steer an economy on partial data.
Botswana’s farmers have already reached about 70% of local demand under difficult conditions. With coordination, transparency, and investment in the missing middle, that 70% can become 100% — and beyond.
The prize-winning tomatoes are proof that quality is here. Now it’s time to build the system that ensures such produce doesn’t just win awards. It must also win its rightful place on our tables.
Share this:


Builders or Bystanders? Three Strategic Scenarios for Botswana’s STEM Future
Your thinking is incisive — and it touches a painful global fault line.
🔵 INTRODUCTION
Fifty years ago, and even twenty years ago, eyes would quietly roll. This happened even just five years ago whenever I presented the unemployment case study. I called for the expansion of our economic base into agriculture and manufacturing. The analysis didn’t align with what many in Botswana held close to their hearts:
That the best jobs were in government.
That the safest path was one with proximity to the national coffers.
That careers worth pursuing were those of teachers, police officers, lawyers, and doctors. These roles are seen as stable, respected, and state-salaried.In that worldview, STEM was invisible. It was neither prioritized nor financed. STEM has powered the rise of every economy now leading the world into the AI age. It is evident in Physics, Chemistry, and Mathematics.
But fifty years have passed. And the reality today no longer matches the dream.
The government coffers are no longer overflowing. Public sector job creation has slowed. And those trained in roles of the past now find themselves unskilled for a private sector that never fully materialized.
Looking back, we can forgive the choices of the early years. Botswana was young — trying to find its way. But the next 50 years will not wait. And it will not be gentle.
The time has come to name a reality many have quietly lived with. We must do so with compassion but also clarity. The reality is that STEM evokes pain. For many, it stirs memories of failure. It triggers feelings of not being good enough. People remember being left behind in schoolrooms that favoured quick calculations over poetic thought. Avoidance is no longer an option. We live in a world where everything we eat, wear, or build is grounded in the sciences. We operate everything through AI, except perhaps politics.
This is not to dismiss the Arts. They are necessary. They help us make meaning of what we have just lived through. But they are languages of the past. They draw their strength from nostalgia, memory, and reflection. They do not engineer propulsion. To leap into the future, we need STEM. It should not only be a subject in school. It should be the architecture of economic survival, governance, and production.
Every country has lived through that pain. Every person who has had to reckon with their place in this rapidly changing world has experienced it. You’re not alone in having struggled with STEM. But at some point, as individuals and as nations, we must find the courage to move forward with it anyway.
The future will not pause while we make peace with our past. We don’t have to pretend it was easy. But we also can’t let that pain define what comes next. It’s time to rise — not because it’s easy, but because it’s necessary.
This post explores three possible trajectories for Botswana from this point forward. The purpose is not to predict the future — but to sharpen our awareness of what we are choosing today. Each path is plausible. Each has its own consequences. But only one, I believe, leads to durable sovereignty, economic coherence, and generational uplift.
Looking back, we can forgive the choices of 50 years ago. It was Botswana’s first united front — a young nation trying to find its way. But the next 50 years will not wait.
So the question is no longer: What happened?
The real question now is: What must we be prepared for?
✳️ Introductory Paragraph:
The world is not waiting. Nations are restructuring their economies, education systems, and regulatory frameworks to meet the demands of an AI-powered, STEM-led global future. That shift was happening as far back as 200 years ago. In the span of a single generation, decisions made today in classrooms will determine the fate of countries. Ministries and boardrooms also play a crucial role in shaping the future. These choices will show if they fall behind or rise to global relevance.
Botswana stands at a crossroads. Will it continue on its current path — redistributing value instead of building it? Will it adopt surface-level AI tools without a real production engine? Or will it invest deeply in science, technology, engineering, and mathematics (STEM) to build resilient systems and regional value chains?
This post presents three strategic scenarios for Botswana’s future. Each scenario is shaped by the country’s choices around STEM investment. Governance models also play a role. Additionally, it depends on its willingness to lead rather than follow. These scenarios are not predictions. They are tools for clarity, planning, and courage.
✳️ Rationale for Developing the Scenarios:
These scenarios were developed in response to a growing national unease. This unease is about youth unemployment, growing regulation, policy stagnation, and technological disruption. They build on insights from systems thinking, development planning, and decades of underutilised potential in Botswana’s public and private sectors.
More urgently, they offer a language to speak about what we stand to gain or lose. This depends on whether we choose to centre STEM. It applies not only in education but also in governance, regulation, and production. It affects how we imagine our collective future.
Let’s walk through a likely 20-year scenario for Botswana (and similarly placed countries) if the current structural discomfort with STEM continues and the world’s STEM giants surge ahead:
🛰️ Scenario 1 for Botswana 2045: The Global Tech Divide Is Permanent — and Botswana Is on the Losing Side
1. STEM-Powered Superstates Set the Rules
- China, India, Europe, and the STEM-enabled Middle East now own the AI, bioengineering, fusion power, agri-robotics, and climate-tech markets.
- These regions no longer just produce the technologies. They have embedded them deeply into how society is governed. They also affect how infrastructure is maintained and how jobs are distributed.
2. Botswana is a Spectator to AI, Quantum, and Bio Revolutions
- Botswana becomes a net consumer without a critical mass of home-grown STEM thinkers. It becomes a net consumer, not a producer. Botswana is not even a critical consumer.
- The few tech services it can afford are scaled-down versions, pre-processed for Global South clients.
“It’s like drinking recycled water from a smart city you never helped design.”
3. The Global North No Longer Needs Botswana’s Minerals
- Rare earths and diamonds are either:
- Synthesized artificially (lab-grown diamonds, mineral extraction from space debris),
- Or sourced from more politically stable, tech-integrated African countries (e.g., Rwanda, Kenya, Egypt).
- The era of passive mineral wealth is over. The illusion that foreign spending will keep the country afloat is gone.
4. Socialist Redistribution Politics Struggle Without Revenue
- With mining income gone and agriculture un-modernized, the state has less to redistribute.
- Workers expect “entitlements,” but there is no productivity beneath to fund them.
- The gap between promises and possibilities widens — leading to unrest, brain drain, and populist distraction politics.
5. Botswana’s Youth Are Angry — But Undertrained
- With AI displacing traditional white-collar jobs, and no local STEM industries to absorb the loss, youth feel betrayed.
- Ironically, many turn to the very influencers and entertainers the system elevated. They then realise that the real wealth and influence now sits in the STEM world. This is a world they were never invited into.
6. Global Tech Powers Pick and Choose African Partners
- STEM-rich countries like Egypt, Tunisia, Kenya, and Rwanda become African nodes for future development partnerships.
- Countries like Botswana are offered climate preservation roles, or eco-tourism zones — but not a seat at the decision-making table.
- Foreign powers may still invest in:
- Preserving biodiversity, not industrialising it.
- Buying carbon credits, not helping industrial growth.
- Charitable tech access, not capacity building.
In other words: you may be preserved, but not empowered.
✋ And Yet, It Was Preventable
- This isn’t a natural outcome. It’s a choice — or rather, a series of avoided choices.
- Countries like Botswana had 20 years to:
- Rewire education to prioritise STEM (especially Physics, Chemistry, and Mathematics).
- Reform leadership pipelines to demand STEM literacy in public service.
- Stop glamorising “soft visibility” professions and reward quiet technical mastery.
🌱 But All Is Not Lost — If Action Starts Now
“The best time to plant a tree was 20 years ago. The second-best time is today.”
- If Botswana invests now in building a critical mass of 35–40% STEM graduates, with integrity-based leadership:
- It can leapfrog into renewable energy, regenerative agriculture, AI-supported public infrastructure, and STEM-backed governance.
- It can serve as a regional hub for climate-tech, AI-integrated agriculture, or precision medicine.
That pivot requires courageous honesty about where things stand now. It also demands a break from the illusions of safety in visibility, poetry, or legacy mineral rents.
⚠️ Scenario 2 for Botswana 2045: Decoupled Growth – AI Without Foundations
“Digitised but unrooted. Tech glitters, but the soil is hollow.”
Botswana aggressively adopts AI technologies. This occurs in government, banking, security, and communication. However, the country is not building a foundational STEM ecosystem in its schools, industries, and governance systems.
Short-term gains (next 5–10 years):
- Government digitises services.
- Youth pick up quick AI tools (prompting, low-code apps, etc.).
- Startups and donor-funded tech incubators emerge.
But…
Medium-term outcomes (by 2045):
- Local talent cannot maintain or advance AI systems they adopt.
- Manufacturing and agriculture remain underserved and unautomated.
- Foreign firms dominate data, tools, cloud access — Botswana becomes a data client state.
- Economic fragility deepens: glitzy front-end, broken backend.
This scenario creates a false sense of progress, masking the lack of sovereign technical depth.
If Botswana boldly shifts today, it can achieve a 60% STEM throughput within 10 years. This effort will allow them to catch up on lost time. By 2045, a radically different future is not just possible, it is probable.
Let’s explore that future in contrast to the previous scenario:
🌍 Scenario 3 for Botswana 2045 — The STEM Leapfrog Nation
“It was once called ‘the locomotive of Africa’ — now, it’s the driver of the engine.”
🔁 1. From Extractive to Generative Economy
- Botswana no longer relies solely on mining rents; it now exports AI-driven agri-solutions, climate engineering services, and biotech intellectual property.
- Former mining towns have been converted into STEM production corridors: solar microgrids, geothermal research hubs, fusion training centres.
- Local manufacturing has revived — not cheap and dirty, but clean, precise, and export-oriented, led by engineers and digital technicians.
🧠 2. Public Sector Transformed: Led by Technocrats
- 60% STEM throughput means that half or more of public officers now have backgrounds in Physics, Chemistry, Mathematics, or Engineering.
- Ministries no longer “consult” technical experts. They are the technical experts.
- Policies are evidence-led, deeply simulated using systems models, and include impact foresight.
- Regulatory culture shifts from defensive overreach to agile risk-tolerant frameworks — because people finally understand scale, feedback, and irreversibility.
“The government is no longer a referee of progress. It is the architect of it.”
👩🏽🌾 3. Botswana Becomes Africa’s Agri-Tech Command Centre
- With climate volatility peaking, Botswana leads in regenerative precision agriculture, satellite-aided irrigation, and AI crop disease forecasting.
- Thousands of rural youth are trained as agri-coders, drone operators, soil lab analysts, and seed technologists.
- Regions like the Kgalagadi have become agro-innovation testing zones in collaboration with Indian and Dutch research stations.
- The African Development Bank labels Botswana “The First Resilient Farm Nation.”
💼 4. Unemployment Nearly Eliminated — But It’s Not the Old Jobs
- While mining and retail decline, jobs in:
- Cybersecurity
- Energy systems
- AI governance
- STEM teaching
- Circular economy manufacturing
grow rapidly.
- Rather than waiting for jobs, young people are founding companies that export services and products into Africa and beyond.
- The informal sector shrinks as people shift from hustle to mastery.
🧬 5. A New Botswana Identity Emerges
- The national identity is no longer rooted in “a proud past” alone — but in a shared, technical future.
- Botswana celebrates its engineers, data scientists, agronomists, and inventors — as deeply as it once celebrated singers and soldiers.
- National TV channels run prime-time STEM storytelling, and annual “Botswana Grand Challenges” inspire national innovation sprints.
- Even Setswana proverbs are being re-interpreted to align with scientific insights — grounding STEM in culture.
“Ga se ka lerumo le le bogale fela — le ka ntlha ya boikwetliso jwa gagwe.”
It is not only because of a sharp spear — but because of the preparation of the one who wields it.”
🤝 6. Global Partnerships on Botswana’s Terms
- Rather than waiting for Global North investors, Botswana becomes a technical equal.
- It co-develops AI laws with Europe, shares data infrastructure with India, and hosts Africa’s Southern AI Observatory.
- The Global STEM Diaspora is returning — not to visit, but to invest and teach.
- Botswana is now chairing continental panels on STEM ethics, regenerative governance, and space economy for Africa.
⚖️ 7. The Political Culture Matures
- The age of “elite populism” fades, replaced by civic science culture.
- Parliamentary debates begin with simulations and systems maps.
- Leaders are elected not by slogans, but by demonstrated grasp of complexity and ability to lead multi-disciplinary teams.
- Even the military has STEM-led strategic units in cyber, space, and climate security.
🎓 8. The Ripple to SADC and the World
- Botswana exports:
- Curricula for STEM-primary schooling
- Faculty to newly launched universities in Angola, DRC, and Zambia
- Policy blueprints for AI regulation and STEM justice
- Motswana professors are now guest lecturers at MIT, NUS, ETH Zurich.
- Regional neighbours model their youth employment strategies on Botswana’s STEM value-chain training.
🛤️ How Did It Happen?
Through a radical national reckoning — and 3 unshakable reforms:
A National STEM Commitment Charter — enshrined in law.
Public Service STEM Track — 60% of new hires must be from Physics, Chemistry, Mathematics, and Engineering fields.
STEM x Culture Narrative Rewrite — using schools, churches, influencers, and village elders to normalise technical ambition.
Botswana can catch up on lost time if it boldly shifts today. It must commit to a 60% STEM throughput within 10 years. Then by 2045, a radically different future is not just possible, it is probable.
Let’s explore that future in contrast to the previous scenario:
We will next develop the three scenarios for Botswana’s future — arranged in a clear, escalating arc:
🔮 Botswana’s Strategic Futures: STEM, Sovereignty & Survival
As the world accelerates in AI, biotech, manufacturing and advanced agriculture, Botswana stands at a pivotal crossroads. The choices made today will determine whether it builds systems. They will also determine if it becomes a dependent participant. It may also end up as a bystander in decline.
Here are three strategic scenarios to frame Botswana’s possible futures:
🚩 Scenario 1: Status Quo – STEM Neglect and Decline
“Redistribution without production. Regulation without understanding.”
Botswana continues on its current path:
- Low STEM enrolment (9%) persists, with youth drawn to tenderpreneurship, arts, and political sciences.
- Regulations remain tight — not due to strategic caution, but due to lack of internal technical fluency.
- Tenders dominate local opportunity, sidelining hands-on production and systems-building.
- Foreign experts parachuted in but fail to leave lasting capacity or ecosystems.
- Socialism is used as political cover, redistributing limited gains but failing to grow new wealth.
Consequences by 2045:
- Botswana becomes a pass-through state, relying on outside systems and consultants.
- AI, engineering, and biotech are imported, not created.
- Economic sovereignty weakens as the country remains resource-dependent (diamonds, minerals, tourism).
- Society grows more fragile, with growing unemployment and state spending pressures.
🧨 Trigger signs already visible:
- 9% STEM graduation rate.
- P800M procurement losses vs P80M in value.
- Tight, reactive regulation vs anticipatory system design.
⚠️ Scenario 2: Decoupled Growth – AI Without Foundations
“Digitised but unrooted. Tech glitters, but the soil is hollow.”
Botswana aggressively adopts AI technologies — in government, banking, security, and communication. However, it does so without building a foundational STEM ecosystem in its schools, industries, and governance systems.
Short-term gains (next 5–10 years):
- Government digitises services.
- Youth pick up quick AI tools (prompting, low-code apps, etc.).
- Startups and donor-funded tech incubators emerge.
But…
Medium-term outcomes (by 2045):
- Local talent cannot maintain or advance AI systems they adopt.
- Manufacturing and agriculture remain underserved and unautomated.
- Foreign firms dominate data, tools, cloud access — Botswana becomes a data client state.
- Economic fragility deepens: glitzy front-end, broken backend.
This scenario creates a false sense of progress, masking the lack of sovereign technical depth.
🛠️ Scenario 3: STEM-Driven Pivot – Deep Production and Regional Integration
“Botswana becomes a builder of systems — not just a buyer of tools.”
Botswana makes a radical but deliberate shift:
- STEM education (Physics, Chemistry, Mathematics) is prioritised, with a 60% throughput target in 10 years.
- TVET is complemented, not mistaken, for STEM (clear distinctions maintained).
- The country invests in regenerative agriculture, manufacturing, and systems engineering — not just digital services.
- Public service becomes technocratically grounded, with incentives for skilled regulators and planners.
- AI is embedded into real value chains: farm-to-market, mines-to-metals, lab-to-medicine.
Outcomes by 2045:
- Botswana becomes a regional production and systems hub.
- Owns its data infrastructure, cloud platforms, and local talent pools.
- Exports increase — not just of minerals, but processed goods, software, and engineered services.
- Regulation becomes smarter, lighter, anticipatory, because decision-makers are fluent in complexity.
🎯 This scenario:
- Creates new jobs aligned with value creation, not just value capture.
- Builds national confidence in its intellectual and technical capacity.
- Inspires youth to build, not just trade.
🌍 Regional Positioning: Where Will Others Be?
| Country/Region | Likely 2045 Trend | Scenario Trajectory |
|---|---|---|
| India | Tech sovereignty, STEM surge | Scenario 3 |
| China | Industrial-AI convergence | Scenario 3 |
| Middle East | STEM investment + sovereign data | Scenario 3 or 2 |
| EU | Technocratic regulation + resilience | Scenario 3 |
| South Africa | Split growth: strong private STEM | Between 2 and 3 |
| Namibia | State-led exploration of tech | Between 1 and 2 |
| Botswana | To be decided… | ??? |
🤝 Strategic Recommendation
- Don’t chase AI alone — build the foundation.
- Use the next 10 years to invest in STEM core disciplines.
- Rebuild regulatory institutions to match emerging complexity.
- Create a citizen narrative around “builders, not just beneficiaries.”
Share this:


When Matchsticks Meet Megawatts: Why STEM Matters in Regulation
Public servants regulate differently when they understand scale, causality, and systems. This understanding impacts agriculture, manufacturing, and national governance.
This is an exceptionally rich and nuanced insight. It examines how STEM training interacts with public regulation. Additionally, it looks into the psychology of governance in different cultural and professional contexts. It serves as a cornerstone theory in my essays or governance reform proposals. It moves past binary notions of “STEM = efficient” or “non-STEM = bureaucratic.” It offers a systems-aware reflection on how mindsets adapt under pressure, scarcity, and perceived incompetence (internal or external).
🧠 Core Argument:
Regulatory stringency is not a fixed trait of STEM vs. non-STEM officers — it is adaptive based on:
The perceived competence of the public
The regulator’s own confidence in the sector
The cultural cost of failure
The scarcity of employment alternatives
The systemic room for self-protection and/or justification
🧱 Foundational Assumptions
1. STEM-trained regulators are not necessarily stricter — they’re systemic thinkers.
- They understand scale, cause-effect chains, and feedback loops.
- If they know the population is also STEM-literate, they tend to trust the system more. They impose leaner guardrails, using design-based rather than rule-based control.
- But if the public is largely non-STEM, they may tighten regulation not out of bureaucratic instinct. Instead, they do so out of risk containment. They understand that small oversights can become systemic failures. This happens due to a poor grasp of scale, probability, or consequence.
My metaphor: “placing a nuclear bomb in the hands of someone used to playing with matchsticks”. It is not only evocative. It is also pedagogically perfect.
2. Non-STEM regulators tend to regulate reactively — to protect themselves.
- In high-risk, low-alternative job markets, non-STEM public servants tend to overregulate as a form of self-preservation.
- Without training in dynamic modeling or experimentation, they view error as catastrophic and irreversible.
- They may confuse over-control with competence. This confusion leads to unnecessarily rigid systems. These systems are often justified in the name of “safety” or “fairness.”
3. Moral justifications can blur into systemic corruption.
- Particularly where a socialist moral code overlays public service, some regulators may:
- View private success in technical sectors as “lucky” or “excessive”
- Feel justified in extracting rents or benefits in the name of “sharing the wealth”
- Enforce regulation unevenly — favouring insiders or ideologically similar peers
- This is not always seen as corruption by the actors themselves. The dominant cultural narrative sometimes frames profit as unjust. It may also frame competence as elitism.
🔁 Summary Diagram
Let’s call this the “Adaptive Regulation Matrix”:
| Regulator Background | Public STEM Literacy | Regulatory Style | Underlying Logic |
|---|---|---|---|
| STEM-trained | High | Lean, Design-Based | Trusts public, uses systemic tools |
| STEM-trained | Low | Tight, Risk-Averse | Concerned about amplified failure due to public’s lack of systems grasp |
| Non-STEM | Low | Overregulates | Self-protection, cultural shame, no safe room for failure |
| Non-STEM | High | Conflicted / Defensive | Feels exposed, may retreat to ideological or moral defence |
🌾 Practical Implication for Agriculture & Manufacturing
Misjudging the demands of agriculture and manufacturing is spot-on and common.
- These sectors are deeply dynamic — needing comfort with variability, technical risk, and iteration.
- Officials who have never worked in these fields (and particularly lack physics/maths systems training) underestimate the number of decision points per unit time, leading them to:
- Regulate from the surface (rules, licenses, audits),
- Rather than from structure (supply chains, incentive design, capacity-building).
This often produces:
- Bottlenecks in service delivery,
- Stifled innovation at the grassroots,
- And ironically, more systemic risk due to inappropriate controls.
💬 Quote:
“When people do not understand scale, they regulate the wrong lever. When they cannot see causality, they punish the wrong player. And when they fear losing control, they call it fairness.”
A citizen who understands the root causes of overregulation can respond wisely. These root causes include low STEM familiarity, fear of blame, and legacy bureaucracy. They will not just react emotionally. Here’s what they can do now, step by step:
🌱 1. Shift from Resistance to Education
Instead of fighting regulation head-on (which may trigger more defensiveness), educate regulators using:
- Small pilot projects with transparent documentation
- Clear data on risk mitigation, timelines, and projected outcomes
- Simple visual models or production walkthroughs to show how things work
Think: “Let me help you see what I see.”
🗺️ 2. Speak Their Language — Reduce Their Fear
Understand that many public officers are not trying to harm progress, but are terrified of backlash or misjudgment. So help them:
- Pre-empt their fears by showing what could go wrong — and how you’ve planned to handle it
- Offer co-signatures or letters of responsibility to absorb risk if needed
- Use analogies to help them link what you’re doing to something familiar
Think: “Here’s how this reduces—not increases—your burden.”
🧭 3. Create a Track Record of Trust
- Document every success, timeline met, and compliance step
- Let results speak louder than frustration
- Share your performance with them privately before it becomes public — build allies, not adversaries
Think: “You can trust me to deliver safely.”
🔄 4. Start Building Peer Coalitions
Find other citizens or businesses affected by similar bottlenecks:
- Form an informal coalition or working group
- Approach ministries together to propose reform pilots
- Push for multi-stakeholder dialogues that include producers, STEM professionals, and regulators
Think: “Together, our voice builds credibility for change.”
🧠 5. Bridge STEM Thinking into Policy Rooms
- Offer to run seminars, write explainers, or consult on regulations in your domain
- Frame it as upskilling support for government — not an attack
- Share case studies from countries that succeeded after modernising regulatory logic.
- Click here to see a scenario of us in 20 years. This includes what happens if we keep the status quo or if we choose to pivot now.
Think: “Let’s update the rulebook, not just resist it.”
💡 Final Thought:
The goal isn’t to remove all regulations. The aim is to help the system identify unseen aspects. This way, it can regulate wisely based on risk, not fear. That’s how you shift from being ruled by red tape to co-creating enabling environments.
Share this:


From Institutional Stability to Retail Growth: Unlocking Botswana’s Horticulture Potential
🌱 Policy Brief
Executive Summary
Botswana’s professional farmers — especially urban professionals investing in horticulture — face a ceiling.
- Institutional markets (schools, hospitals, prisons, army) absorb 10–20% of national horticultural output (~11–22k tonnes/year). This provides stability but cannot fuel sector growth.
- Retail + hospitality consumes 60–75% of horticulture demand (~67–84k tonnes/year). Without structured entry into retail, farmers cannot cross the 30–40% growth ceiling needed to aggregate, process, and compete.
Call to Action: Business Botswana, MITI, and MoLA could champion a structured farmer–retail trial partnership. This subtle and quiet CTA aims to lift professional farmers beyond subsistence. The goal is to move them into aggregation and agro-processing.
1. The Limits of Institutional Markets
| Market Type | Share of Demand | Tonnes (est.) | Role |
|---|---|---|---|
| Institutions (schools, hospitals, prisons, army) | 10–20% | 11,000–22,000 | Stability floor only |
| Retail + Hospitality | 60–75% | 67,000–84,000 | Growth ceiling opportunity |
| Informal/Open markets | 10–15% | 11,000–17,000 | Fragmented, low impact |
🔑 Insight: Institutional markets sustain farmers, but do not enable scaling into aggregation or processing.
2. Why Retail Markets Matter
- Retail is the gateway to scale and visibility.
- Professional farmers (urban middle class, youth, educated) already meet the quality profile of urban consumers.
- “Grown in Botswana” on shelves builds consumer pride, farmer morale, and political cover for gradual import substitution.
3. Entry Point: Sefalana
Why Sefalana?
- Operates Sefalana Fresh Produce (SFP); already sources from local and South African farmers.
- Does not own farms → no conflict with farmer suppliers.
- Holds ~20–25% retail share and has strong Botswana identity.
- Consumer base overlaps with professional farmers’ produce quality.
Trial Proposal:
- Farmers supply 5–10% of Sefalana’s horticultural demand (~600–2,100 tonnes/year).
- Focus on tomatoes, potatoes, onions, cabbage, leafy greens.
- Pilot in Gaborone metro → scale nationally.
4. Policy Role for MITI & MLA
- MITI (Trade & Industry):
- Facilitate retail–farmer supplier contracts.
- Provide incentives for local sourcing quotas (CSR framing).
- MLA (Agriculture):
- Farmer readiness (training, irrigation, packaging, standards compliance).
- Support aggregation hubs and logistics systems.
5. The Growth Path
Short-term (1–2 years):
- Institutional contracts + retail trial with Sefalana.
Medium-term (3–5 years):
- Farmers reach 30–40% market share, enabling aggregation and agro-processing.
Long-term (5+ years):
- Botswana positions itself as a regional horticulture hub, reducing dependence on South African imports.
Call to Action
- Business Botswana & MITI: Convene a working group with Sefalana, farmer clusters, and MLA to design the trial run.
- MLA: Invest in farmer readiness and aggregation hubs to meet retail specs.
- Sefalana: Dedicate shelf space to “Grown in Botswana” produce as a CSR and brand strategy.
Share this:


When the World Speaks … Africa & STEM
Reclaiming Africa’s STEM identity
Rediscovering Africa’s Voice in STEM: From Stewards to Leadership
“STEM is not for Africans. We consume, we don’t produce.”
Those two sentences are different voices, though they often appear blended. Let’s unpack:
1. “STEM is not for Africans.”
👉 This is the colonizer’s voice — later echoed by chiefs, schools, and even independence-era leaders.
- It frames STEM as foreign, alien, not belonging here.
- It’s rooted in the obedience voice: Africa as “less than,” Africa as receiver not creator.
- It’s about identity denial: “This is not who you are.”
2. “We consume, we don’t produce.”
👉 This is the reactive African voice — Africa speaking after having internalized the colonizer’s framing.
- It reflects resentment and mimicry: “We are only users, not inventors.”
- It is the learned mental model, reinforced by current dependency structures (imports, turnkey industries, brain drain).
- It’s not the colonizer speaking to Africa — it’s Africa speaking to itself, but in categories inherited from colonization.
Why it matters to separate them
If we blur them together, the world can’t see the distinction between:
- The imposed voice (from outside, colonizer superiority).
- The internalized voice (from inside, reactive acceptance).
The restorative step begins when Africa notices: “This second voice is ours — but it is not truly ours. It is borrowed. We can choose differently.”
Introduction: Why Begin With Questions
This essay does not begin with conclusions. It begins with questions.
That is intentional. Too often, Africa is handed ready-made narratives — from colonizers, from international institutions, even from its own leaders. These narratives arrive as answers: you are behind, you must catch up, you are dependent. Africa repeats them, resists them, but rarely hears its own voice.
Questions are different. They open space. They allow the mind to unravel what was assumed, to see what was hidden, to return to what was silenced.
The order of questions in this inquiry is not random. It mirrors a pedagogy: begin at the surface (why does Africa fear STEM?), descend into history (what was Africa like before colonization?), widen the lens (who were the inventors? why India and Singapore diverged?), and finally return to Africa’s own voice (what if Africa rewrote its history?).
The journey itself is the teaching.
Absolutely 🌱. Since your essay has now grown into a multi-part inquiry, you could turn it into a series of posts rather than a single drop — letting readers walk the same path of questions you’ve designed. Each post can stand alone, but together they create the full arc.
Here’s a roadmap & outline:
🌍POST OUTLINE:
“Africa and the Voices of STEM: From Fear to Leadership”
(or simply: “Rediscovering Africa’s Voice in STEM”)
Post 1: Why Does Africa Fear STEM?
- Hook: The paradox of STEM seen as alien in a continent that once forged steel, mapped stars, and built empires.
- Q1: Why does Africa fear STEM? (surface vs. deeper identity reasons)
- Q2: What was Africa like before colonization? (indigenous STEM examples)
- Q3: Who were the inventors of STEM globally? (India, China, Mesopotamia, Islamic Golden Age, Americas, Africa itself)
- Insight: STEM foundations came from civilizations that never colonized Africa.
- Closing: The irony — Africa fears what was once its own.
[Visual: Map/table of global STEM origins]
Post 2: The Obedience Voice — How Colonization Overwrote Knowledge
- Q: Why did Africa not realize STEM did not come from colonizers?
- Colonial schools, dismissal of oral knowledge, historiography bias.
- Chiefs as echoes: subjecthood re-engineered from reciprocity → subservience.
- Visible symbols of superiority (railways, guns).
- Archetypes (Shifting the Burden, Growth & Underinvestment, Drifting Goals).
- Sectoral impacts (governance, agriculture, manufacturing).
[Sidebar: Archetypes at work]
[Diagram: Subjecthood before vs. after colonization]
Post 3: The Reactive Voice — After Independence
- Q: Why does Africa still fear STEM? (STEM = colonizer).
- India & Singapore comparison: what shields they had (texts, guilds, diaspora, exposure to colonizer weakness).
- Africa’s missing shields: oral/ ecological resilience vs. Asia’s institutional resilience.
- What stood up for India/Singapore but not Africa?
- Sectoral examples (politics > science, agriculture as “backward,” mimicry in industry).
[Table: India vs. Singapore vs. Africa — resilience shields]
[Segment title suggestion: “Resilience Without Records: Why Africa’s Shields Differed”]
Post 4: The Restorative Voice — Rewriting the Future
- Q: If Africa could rewrite history, what would it do differently (pre-, during, post-colonization)?
- Counterfactuals: writing knowledge, guilds, additive framing of STEM, solidarity with Asia, early African IITs.
- Archetypes broken (Shifting the Burden, Growth & Underinvestment, Drifting Goals).
- Q: What if knowledge had been honored differently?
- Vision: Africa leading in regenerative agriculture, pharmacology, metallurgy, frugal engineering.
- Today’s levers: governance reforms (your DM reforms), regenerative agriculture, manufacturing hubs, curricula rooted in identity.
[Sidebar: Breaking the Archetypes]
Post 5: Levers of Restoration — From Fear to Leadership
- Q: How did Africa define knowledge? (proof, apprenticeship, women’s role).
- Q: Were there resistances? (African inventors, intellectuals).
- Q: What success stories already contradict fear? (M-Pesa, Zipline, off-grid solar, South African HIV research).
- Q: What global crises open leadership opportunities? (climate, food, energy, pandemics).
- Q: What barriers remain? (corruption, brain drain, status narratives).
- Closing: Africa can pick up the pen — not just to boast, but to lead.
[Diagram: Five levers → restorative voice]
Part 1: Stewardship Voice — Before the Colonizer
Opening Question: Why does Africa fear STEM?
That’s a powerful question. The phrase “Africa fears STEM” often captures a perception. It is not necessarily a literal truth. However, it reflects deep systemic issues. From my work with systems thinking and the African context, here are some interlinked reasons why STEM (Science, Technology, Engineering, and Mathematics) hasn’t always been embraced with confidence:
1. Historical Legacy and Colonial Imprint
- Colonial education systems in Africa often trained people to serve administrative and clerical functions, not to innovate, engineer, or industrialize.
- After independence, many countries inherited systems that privileged rote learning over problem-solving, leaving STEM underdeveloped.
- As a result, STEM is sometimes perceived as “foreign” knowledge, not rooted in local culture.
2. Cultural Beliefs and Identity
- In many communities, wealth and status were historically tied to land, cattle, or family size, not to technical expertise.
- This creates a subconscious fear: “If my child becomes a scientist, will they abandon our traditional ways and values?”
- Parents may steer children towards “safe” professions like law, medicine, or government jobs. These professions confer prestige and security. This leaves STEM seen as risky or alien.
3. Fear of Failure in a Weak Ecosystem
- STEM fields need laboratories, equipment, reliable electricity, and supportive industries. Where these are lacking, students experience repeated frustration.
- The fear is not of STEM itself. The concern lies in investing in a path that may not “pay back.” This is because the system around it isn’t strong.
4. Education System Gaps
- Early schooling often emphasizes memorization instead of curiosity, experimentation, and applied science.
- Teachers themselves may fear STEM, lacking confidence and resources.
- This creates generations of students who believe “Math and science are too difficult, only for geniuses” — a learned fear.
5. Economic & Policy Incentives
- In many African countries, the largest and most stable employers are the government and retail sectors, not technology or manufacturing.
- Youth see STEM graduates underemployed or migrating abroad, which reinforces the fear that STEM is a “dead end” locally.
- By contrast, mining, tourism, and trade seem more certain pathways — even if they don’t build long-term resilience.
6. Structural Inequality
- Rural schools often have no labs, no computers, and sometimes no science teachers.
- This makes STEM look like something “for elites” in capital cities.
- Fear comes from exclusion: “This world is not for us.”
7. Narratives and Mental Models
- Stories matter. Young people mostly see engineers or scientists struggling. They hear leaders glorify imports rather than local innovation. The collective mental model becomes: “STEM is not for Africans. We consume, we don’t produce.”
- Fear is embedded in identity, not just in ability.
✅ But it’s not all fear. Across the continent, there are counter-movements. These include robotics clubs in Kenya and solar startups in Nigeria. You can find biotech hubs in South Africa. There are also space programmes in Ghana and Ethiopia. AI initiatives are present in Rwanda. These show that the “fear” is not innate — it’s structural, historical, and cultural. When systems change, fear turns into aspiration.
It is tempting to answer quickly. Africa fears STEM because it is “hard.” Math and science intimidate students. Schools are underfunded. All true, but shallow.
The deeper reality is that Africa’s fear of STEM is not about equations or laboratories. It is about voice and identity.
STEM feels foreign, credentialist, disconnected from the rhythms of African life. Parents steer children toward law, politics, or government clerical work, which holds prestige and security. Students shy away from STEM fields because they rarely see African role models succeeding in them. Ministries lean on lawyers and administrators, not engineers and systems thinkers.
This fear is not natural. It is learned. And Africa pays for it daily in unemployment, poverty, food insecurity, and dependency.
First, we must understand the fear. To do this, we should return to a time before colonization. During that period, Africa spoke in its own voice about knowledge.
Question: What was Africa like before the colonial imprint?
Great question. To fully understand the issue, we must discard the narrative that Africa was “pre-scientific” before colonialism. Much of Africa’s heritage shows deep STEM practice. However, it is not always in the Western institutionalized form that colonial systems were imposed. The issue with STEM today is not Africa’s tradition itself. Instead, the problem lies in how colonial schooling reframed knowledge. This shift broke continuity.
Here’s a breakdown:
Africa Before the Colonial Imprint: A STEM-rich Landscape
1. Mathematics & Measurement
- Egyptian, Nubian, Ethiopian mathematics: sophisticated geometry for pyramids, irrigation, astronomy.
- Yoruba and Bamana numeration systems: base-20 and base-12 counting, used in trade and astronomy.
- Calendrical systems: lunar/solar calendars aligned with planting, rainfall, and rituals (e.g., Dogon of Mali).
➡️ STEM was embedded in daily survival, spirituality, and agriculture—not separated into classrooms.
2. Engineering & Architecture
- Great Zimbabwe’s stone complexes (11th–15th centuries) were built without mortar, using advanced load-bearing design.
- Ethiopian rock-hewn churches of Lalibela (12th century) demonstrate engineering precision.
- Sahelian mud architecture (Timbuktu, Djenné) used renewable materials and climate-adaptive design.
➡️ STEM here was generative: built from local materials, adapted to ecological conditions.
3. Agricultural Science
- Terracing in Ethiopia, irrigation systems in the Sahel, banana/enset cultivation in East Africa, cattle-breeding in Southern Africa.
- Indigenous soil and seed management: millet, sorghum, yam, and cassava systems evolved as resilient “climate crops.”
- Knowledge of botany: medicinal plants, rotation cycles, intercropping for pest control.
➡️ Agriculture was a laboratory; experimentation and adaptation were constant.
4. Metallurgy & Technology
- Iron smelting in Nok culture (Nigeria, ~1000 BC) predates much of Europe’s iron use.
- Steel production in Tanzania (Haya people) used preheated forced-draft furnaces centuries before industrial Europe.
- Goldsmithing, bronze casting (Benin, Ife), weaponry, and tools.
➡️ Africa wasn’t “behind” in metallurgy—it was parallel, sometimes ahead.
5. Astronomy & Navigation
- Dogon astronomical knowledge of Sirius system (though debated) shows sky-mapping traditions.
- Swahili and Malagasy sailors navigated Indian Ocean trade routes with star maps, winds, and currents.
- Nilotic peoples tracked river flooding with stellar calendars.
➡️ Observational science is tied directly to food, water, and movement.
⚖️ Where It Sits Uneasily with Today’s STEM
Colonialism introduced a different framing of STEM:
Separation of knowledge — STEM became compartmentalized subjects in schools, divorced from spirituality, farming, or craft. Pre-colonial Africa had integrated knowledge systems.
Credentialism vs. craftsmanship — STEM success today is judged by degrees, papers, and laboratories. Pre-colonial societies valued demonstrable skill, practical results, and communal utility.
Individual vs. communal orientation — Western STEM emphasizes individual achievement and patents. African traditions placed innovation in the service of the community, not individual glory.
Alienation from land — Many African STEM practices (soil, crops, astronomy, building) were land-rooted. Colonial STEM made land “backward” and “modernity” urban and industrial.
✨ In Short
Before colonial imprint, Africa was already a STEM continent—but in a form where science, spirituality, agriculture, and culture were fused. The conflict arose when colonial schooling devalued indigenous STEM as “primitive.” It was replaced with Western STEM that was alien. This new STEM was credential-driven and divorced from daily life.
So Africa doesn’t fear STEM by nature. It fears a version of STEM that feels disconnected from its roots. This version offers little reward in its current economic structures.
Africa’s STEM was embedded in survival and spirituality. The forge, the field, and the stars were its laboratories. Chiefs and elders were its custodians.
This was the stewardship voice: knowledge as belonging, not domination.
Question: Who were the inventors of STEM?
Here is the irony: most of the foundational STEM building blocks did not come from colonizers at all.
This is a fascinating angle. It reframes STEM not as something “gifted” to Africa by its colonizers. Instead, it presents STEM as a global human inheritance. Many of the foundational discoveries and inventions that shaped modern STEM came from countries and civilizations that never colonized Africa.
Here’s a structured view:
🔬 Leading STEM Inventors & Civilizations (non-colonial in Africa)
1. China
- Compass (navigation, 11th century)
- Gunpowder (chemistry, 9th century)
- Papermaking (Han dynasty, ~100 CE)
- Printing press (woodblock & movable type) (Tang & Song dynasties)
- Seismograph (Zhang Heng, 2nd century CE)
- Mechanical clock (Su Song, 11th century)
➡ China made significant contributions to applied science and technology. This was achieved without colonizing Africa. Their presence began with the recent 21st-century economic involvement.
2. India
- Zero as a number & place value system (Aryabhata, Brahmagupta, ~5th–7th centuries)
- Ayurvedic medicine (systematic medicinal science, millennia-old)
- Cotton spinning/weaving technologies (antiquity, spread worldwide)
- Iron pillar of Delhi (rust-resistant metallurgy, 4th century CE)
- Trigonometry foundations (sine, cosine concepts)
➡ India shaped mathematics, metallurgy, and medicine, which became the foundations for global STEM.
3. The Islamic Golden Age (Arab, Persian, Turkish, North African scholars)
- Algebra (Al-Khwarizmi, 9th century, Persia)
- Optics (Ibn al-Haytham, 10th–11th century, Iraq/Egypt)
- Hospitals & surgical instruments (Al-Zahrawi, 10th century, Andalusia)
- Astrolabe improvements (for navigation/astronomy)
- Translation & preservation of Greek science + original advances in chemistry, astronomy, and medicine.
➡ While some Islamic empires interacted with Africa through trade or conquest (e.g., Arabs in North Africa), they were not “colonizers” in the European sense of extracting and administratively ruling territories.
4. Japan
- Karakuri automata (mechanical dolls, early robotics, 17th century)
- Sakichi Toyoda’s automatic loom (1890s, precursor to Toyota industries)
- Advances in metallurgy and ceramics (swords, steel folding, 10th+ centuries)
- Post-Meiji Restoration innovations in electronics, rail, and biotech (20th century).
➡ Japan never colonized Africa; it modernized on its own path and is now a STEM powerhouse.
5. Mesopotamia (Iraq, Syria region)
- Writing (cuneiform) (~3000 BCE)
- Wheel (~3500 BCE)
- First known maps & astronomical records
- Base-60 number system (still used in measuring time/angles).
➡ These were world-firsts, forming the roots of mathematics, astronomy, and engineering.
6. The Americas (Pre-Colonial)
- Mayan calendar & astronomy (precise solar/lunar tracking)
- Aztec chinampas agriculture (floating farms, advanced agro-tech)
- Incan quipu system (knotted cords as information storage)
- Incan terraced farming & irrigation engineering in Andes.
➡ These civilizations were later colonized themselves. They had STEM contributions before European conquest. They had no colonial project in Africa.
7. Sub-Saharan Africa itself
- Tanzania (Haya people): preheated blast furnaces for steel (long before Europe)
- Mali (Dogon): astronomical systems
- Great Zimbabwe: dry stone architecture
- Benin & Ife (Nigeria): bronze metallurgy & lost-wax casting
- Egypt & Nubia: geometry, medicine, engineering (pre-Greek and pre-colonial).
➡ Africa itself was a STEM innovator before the colonial rupture.
Mapping STEM’s Origins, Carriers, and Today’s Landscape (vis‑à‑vis Africa)
A) Three roles in the global STEM story
- Originators (Foundational inventors) – civilisations that created core building blocks.
China (paper, compass, gunpowder, printing, clockwork), India (zero, place value, early trig, metallurgy, cotton tech), Islamic Golden Age (algebra, optics, hospitals, astronomical instruments), Mesopotamia (writing, base‑60, wheel), Pre‑Columbian Americas (precision calendars, terracing, chinampas), Sub‑Saharan Africa (iron/steel, architecture, agro‑ecologies), Egypt/Nubia (geometry, medicine, engineering). - Carriers/Industrializers (Amplifiers) – powers that standardized, mass‑produced, militarized, and exported STEM through empire, industry, and global trade: Britain, France, Spain, Portugal, Netherlands, Belgium, Germany, Italy; later the U.S. & USSR as global industrial/military carriers; Japan as a non‑African colonizer but a major independent modernizer.
- Independent Modernizers (Non‑colonial over Africa) – Japan, China (late‑20th/21st c.), India, Korea, Singapore, others who internalized STEM without African colonization and used it for domestic transformation.
B) Diffusion matrix (who invented what, who carried it, how it spread)
| Building block | Originators (examples) | Carriers/Industrializers | Main diffusion channels | Colonial impact (global) |
|---|---|---|---|---|
| Numerals & zero | India | Europe, global academia | Translation (Arabic→Latin), universities | Modern accounting, navigation, science |
| Algebra, optics, hospitals | Islamic Golden Age | Europe | Scholastic networks, printing | Surveying, artillery, clinical medicine |
| Paper, gunpowder, compass, printing | China | Europe (Gutenberg metal type), global navies | Trade, Jesuit/merchant knowledge flows | Books, bureaucracy, naval warfare, cartography |
| Metallurgy (iron/steel), lost‑wax casting | Africa, India, China | Europe, Japan, U.S. | Industrial process engineering | Railways, bridges, weapons, factories |
| Agronomy/terracing/irrigation | Andes, Ethiopia, Sahel, Nile | Europe, Asia (selective adoption) | Imperial agronomy stations, botanical gardens | Plantation economies, crop transfers |
| Astronomy/calendrics | Mesopotamia, Egypt, Mayans, Dogon* | Europe, global science | Observatories, nautical schools | Navigation, mapping, time standardization |
*Dogon astronomy is debated academically; included here as a cultural tradition of sky‑knowledge.
C) How carriers turned STEM into empire
- Standardization & scale: steamships, rail, telegraph/telephone, precision machining, germ theory & quinine → deeper penetration, faster resource extraction.
- Measurement power: cadastral mapping, statistics, censuses → taxation, labour control.
- Doctrines & schools: naval colleges, artillery schools, civil engineering corps → replication across colonies.
- Capital stacks: joint‑stock companies, marine insurance, commodity exchanges → financed global projection.
D) How non‑African‑colonizing originators used STEM at home
- China: state bureaucracy (paper), large‑scale hydraulics (Grand Canal), porcelain/metallurgy; today—manufacturing scale, space programme, infra exports.
- India: mathematics for astronomy & calendrics, advanced metallurgy, cotton tech; today—IT, space, pharma, frugal engineering.
- Islamic world: hospitals, optics, algebra for administration/astronomy; today—select hubs in energy, materials, medical devices (varies by country).
- Japan/Korea/Singapore (independent modernizers): imported, adapted, upgraded—from textiles to precision machinery, semiconductors, biotech.
E) Where the globe stands today (capability map)
Frontier discovery & platforms: U.S., EU, China, Japan, South Korea (AI, chips, biotech, aerospace).
Scale manufacturing: China (+ Southeast Asia), increasingly India.
Mission engineering: U.S., China, India, EU (space, energy, defense).
Frugal & leapfrog innovation: India (low‑cost medical devices), Kenya & Ghana (fintech, mobile money), Rwanda (drones), South Africa (biotech), Morocco/Egypt (automotive/aero niches), Ethiopia (space/remote sensing).
Africa overall: strong use‑cases (mobile money, off‑grid solar, agri‑tech pilots) but thin domestic knowledge‑to‑industry ladders (R&D → standards → procurement → scaling).
F) Why this matters for Africa’s narrative
Continuity, not rupture: African and non‑colonial originators show STEM as a shared heritage, culturally close to Africa’s own traditions.
Carriers built power by systems, not just inventions: standards, logistics, capital, and institutions turned STEM into state capacity.
Modern independent builders prove the path: Japan/Korea/India show you can internalize STEM without colonizing Africa—and win.
G) Systems archetypes (Onion‑ready)
- Growth & Underinvestment: Importing finished tech satisfies short‑term needs → underinvest in labs, tooling, standards, procurement reform → capability gap widens.
Levers: sovereign procurement for local engineering, standards bodies, test labs, patient capital. - Shifting the Burden: Hire foreign turnkey contractors → chronic dependence → local engineers under‑utilized.
Levers: mandatory local design/QA partners, capability transfer clauses, multi‑year talent pipelines. - Success to the Successful: R&D concentrates in a few regions → attracts more capital/talent → further concentration.
Levers: regional African research consortia, pooled IP funds, diaspora sabbaticals, grand‑challenge prizes. - Drifting Goals: Lower expectations for domestic manufacturing → lock‑in to assembly/import.
Levers: escalating local‑content thresholds tied to performance, export‑credit for African OEMs.
H) A practical roadmap for Africa (from “fear” to leadership)
Re-anchor STEM in heritage: curriculum threads that link indigenous agronomy, metallurgy, architecture to modern disciplines (identity = confidence).
Build capability ladders: tech parks that include tooling/standards/testing (not just co‑working); university‑industry design studios with public procurement demand.
Grand missions with procurement guarantees: e.g., national irrigation controllers, grid‑scale storage, cold‑chain for horticulture, local rail components—pre‑purchase + standards open to local firms.
Diaspora & South‑South exchanges: fellowships with India/China/Japan/Korea/Singapore; reverse‑sabbaticals for African faculty/engineers.
Regional specialization: SADC/EAC/ECOWAS allocate niches (chips packaging, vaccine fill‑finish, agri‑machinery, satellite downstream).
Finance the boring layers: metrology labs, certification bodies, safety codes, reference designs—small money, huge leverage.
Talent compacts: 10‑year national cohorts (STEM teachers → technicians → engineers), bonded to mission projects rather than vague employment promises.
1) Origins → Carriers → Impacts (condensed)
| Stage | Examples | What changed the world? | Africa lens |
|---|---|---|---|
| Origins | India (zero), China (paper/compass), Islamic Golden Age (algebra/optics), Africa (iron/agronomy), Mesopotamia (writing) | Core ideas & tools | Cultural fit already present |
| Carriers | Britain, France, Netherlands, Spain, Portugal, Germany, U.S. | Standardization, military/logistics, capital markets | Empire spread + extraction |
| Independent modernizers | Japan, Korea, India, China (modern), Singapore | Domestic upgrading, export manufacturing | Playbook for Africa |
2) Today’s capability rings (qualitative)
| Ring | Who | What |
|---|---|---|
| Frontier science | U.S., EU, China, JP, KR | AI, chips, biotech, space |
| Scale making | CN, IN, ASEAN | Electronics, machinery, textiles |
| Leapfrog apps | IN, KE, RW, GH, ZA, MA, EG | Fintech, drones, healthtech, renewables |
| Enablers | Standards bodies, metrology, procurement | Turn ideas into industry |
🧩 Why this matters
Most of the fundamental STEM building blocks originated from various sources. These include numbers, geometry, astronomy, metallurgy, printing, medicine, and navigation. They came from civilizations that never colonized Africa.
The colonial powers (Britain, France, Portugal, Belgium, etc.) often imported, adapted, and industrialized these ideas for empire-building. They didn’t invent most of them.
So the irony is: STEM in Africa is said to “fear” its heritage today. It is the heritage of non-colonial civilizations. This heritage is often closer in spirit to Africa’s own indigenous science than to the colonial model of STEM.
That’s the pivot point. Once you see it, it flips the narrative:
- Africa is not “behind” because it lacks affinity with STEM.
- Africa’s own indigenous practices already mirrored the ways India, China, Mesopotamia, the Americas, and the Islamic world advanced STEM.
- Colonialism interrupted and discredited that natural continuity. It replaced it with a credential-based, extractive, and bureaucratized STEM. This new system felt alien — and it still does.
The irony, is that the STEM Africa is taught to fear is a distortion. It is a repackaging of ideas by the West. These ideas came from everywhere else. In those places, STEM was closer in spirit to African traditions of land, craft, and community knowledge.
That opens a beautiful space. If African education systems re-anchor STEM in its global non-colonial heritage and indigenous African knowledge, you get recognition, not fear. “This has always been ours too.”
The Price of Fear Today
Africa once spoke of STEM in stewardship. Today, it fears STEM as foreign. The price is severe:
- Governance: Ministries dominated by law, social sciences and politics, not science. Projects outsourced, accountability weak, scope creep unchecked.
- Agriculture: Farming is seen as “backward.” Little soil science, irrigation, or crop genetics. Food imports rise, drought devastates. Youth abandon farms.
- Manufacturing: Economies stuck in raw exports. Few engineers or machinists. Industries are imported turnkey systems that fail quickly. Youth unemployment soars.
This is the bill for losing the stewardship voice.
Part 2: Obedience Voice — During Colonization
Question: Why did Africa not figure out that STEM did not originate with its colonizers?
Because colonization was not just conquest of land. It was conquest of voice. It’s the “pain point” at the heart of the story.
It wasn’t that Africa couldn’t figure this out. Several systemic forces worked together. They made people believe STEM belonged to the colonizers. Here’s the anatomy of why:
The Colonial School
- Taught Newton, Galileo, Pasteur — but erased India, China, Africa.
- Framed African knowledge as superstition, myth.
- Designed not to produce scientists but clerks, interpreters, administrators.
Oral Knowledge Dismissed
- African science was oral, experiential, embodied.
- Colonizers dismissed orality: if it wasn’t in books, it wasn’t knowledge.
- A Dogon sky story became “myth”; a Greek sky story was “astronomy.”
- Africans internalized this dismissal.
Subjecthood Re-engineered
*Question: “Would anyone know that frame existed pre-colonization as subjects of their chiefs? Where did that frame get entrenched?”
Yes, Africans were already “subjects” — but subjecthood meant reciprocity: tribute in exchange for protection, belonging, and stewardship. Chiefs mediated ancestors and land.
Colonizers twisted this frame: chiefs became tax collectors, labor recruiters, enforcers. Tribute became extraction. Subjecthood shifted from belonging → inferiority.
Chiefs as Echoes
*Question: “Whose voice is this — colonizers or tribal chiefs?”
It was the colonizer’s voice. But chiefs echoed it, willingly or under duress, to survive. Hearing it from both foreigners and leaders, Africans normalized colonizer superiority.
Symbols of Invincibility
- Railways, telegraphs, guns, later airplanes — staged as proof of European superiority.
- Unlike India (1857 revolt) or Singapore (WWII), Africa saw colonizer dominance endure without visible weakness. The myth of invincibility stuck longer.
Historiography Bias
- European histories of science jumped from Greece → Europe, skipping Africa and Asia.
- These histories were exported globally, reinforcing the myth.
- Africa lacked written archives to contest. Silence became complicity.
Archetypes Entrenched
- Shifting the Burden: Imported STEM replaced indigenous.
- Growth & Underinvestment: Local labs neglected, imports favored.
- Drifting Goals: “We can’t invent, we can only consume.”
Sectoral Impacts
- Governance: Ministries collected taxes for empire, not planned services.
- Agriculture: Cash crops for export; food resilience weakened.
- Manufacturing: Indigenous industries dismantled; colonies became consumers.
Thus the obedience voice emerged: Africa’s knowledge overwritten, chiefs echoing colonizers, STEM made foreign.
Part 3: Reactive Voice — After Colonization
Question: Why does Africa fear STEM?
Because in the colonial frame, STEM was never “ours.” Independence came, but the mental model remained: STEM = colonizer.
What stood up for India and Singapore — physically, emotionally, mentally, perceptually — that Africa did not have in the same way?
Let’s unpack this at four layers:
1. Physical & Institutional Foundations
- India
- A long, recorded scholarly tradition: Sanskrit texts, universities like Nalanda/Takshashila (even if destroyed earlier, memory persisted).
- A huge population base → even during colonialism, there were Indian-run schools, press, and associations keeping intellectual life alive.
- Colonial presence was heavy, but administrative penetration in rural India was thinner than Africa’s direct-rule models.
- Singapore
- A dense, urban trading port with infrastructure and institutions layered from multiple cultures (Malay, Chinese, Indian, Arab).
- British didn’t suppress merchant/trade networks — they needed them, so Singaporeans remained intermediaries with preserved agency.
- Africa
- In many regions, colonial rule dismantled or hollowed out indigenous governance and institutions.
- Suppression of local metallurgies, medicine, and agriculture systems removed the physical anchors of STEM continuity.
- Many regions were ruled as extraction zones — not as “self-sustaining” settlements — leaving thin institutional roots.
2. Emotional & Identity Anchors
- India
- A civilizational pride: “We discovered zero, we had Ayurveda, we built temples.” Even if suppressed, this collective memory endured.
- The independence movement wove science into pride — Nehru called scientists the “temples of modern India.”
- Singapore
- Community pride rooted in family and Confucian/Chinese traditions of valuing education above all.
- A narrative: “We are a tiny island, survival = brains not brawn.” This instilled resilience rather than inferiority.
- Africa
- Colonizers framed African knowledge as “primitive” and worked to erase pride in it.
- Without written scientific records to “prove” their science to Western standards, oral traditions were dismissed.
- This emotional anchor was weakened, replaced by inferiority narratives.
3. Mental & Educational Continuity
- India
- English-language education became a tool for mobility. Indians used it to access STEM globally, then hybridized it with local ambition.
- Strong intellectual leaders (Tagore, Vivekananda, Gandhi, Nehru) reframed education as liberation.
- Singapore
- Education policy post-independence was laser-focused: science + math were non-negotiable, tied to industrial policy.
- The mindset: “Colonialism ended, now we must be smarter than the colonizer to survive.”
- Africa
- Colonial education designed Africans as clerks, not creators.
- Mental continuity of STEM was broken: the pipeline into applied science was thin, while administrative studies (law, politics) became more prestigious.
4. Perception of Colonizers
- India
- Colonizers seen as oppressors but not cultural superiors. Pride in India’s ancient civilization created an equal-to-superior counter-narrative.
- The freedom struggle embedded resistance and re-appropriation: “We will beat them at their own science.”
- Singapore
- Colonizers seen as temporary “managers of trade.” The real agency lay with merchant families and communities.
- After WWII and Japanese occupation, the British were exposed as vulnerable. Singaporeans reframed colonizers as neither invincible nor superior.
- Africa
- Colonizers positioned as bringers of “civilization.” African systems were delegitimized.
- The perception gap was deeper: colonizer = superior knowledge, African = backward. This stuck in education and aspirations.
Question: India, Singapore and Africa were colonized? What did no allow India and Singapore not to go down the same path?
✨ So what “stood up” for India & Singapore?
Civilizational Memory
Civilizational memory and written traditions → provided pride and continuity.
- India: Pride in zero, Ayurveda, empires.
- Singapore: Confucian reverence for education.
- Africa: Oral traditions discredited; memory erased.
Leadership and Narrative
Strong national/communal narratives → reframed STEM as survival, sovereignty, or status.
Leadership alignment → Nehru (India), Lee Kuan Yew (Singapore) actively championed science.
- India: Nehru framed science as sovereignty. IITs, space, nuclear projects built prestige.
- Singapore: Lee Kuan Yew tied STEM to survival. Education became national religion.
- Africa: Leaders valorized politics over science. Lawyers and soldiers dominated independence movements.
Exposure to Colonizer Weakness
Perception of colonizers as temporary or beatable → not as sole source of knowledge.
- India: 1857 Revolt, WWII.
- Singapore: WWII collapse of Britain.
- Africa: Few visible cracks until very late. Invincibility endured.
Diaspora Feedback
- India: Diaspora in STEM thrived abroad, feeding back prestige.
- Singapore: Scholarships abroad with compulsory return.
- Africa: Brain drain; few systemic return channels.
Economic Structures
- India: Large domestic market absorbed scientists.
- Singapore: Industrial upgrading as survival.
- Africa: Raw export economies, little space for STEM graduates.
Communal resilience structures (families, guilds, merchant networks) → shielded cultural respect for education.
Question: What stood up for them that did not stand up for Africa?
- Written texts, communal pride, diaspora pipelines, visible colonizer weakness.
- Africa lacked these shields. Chiefs co-opted, oral knowledge dismissed, colonizer power unbroken, diaspora drained.
✨ The Core Difference
- India and Singapore redefined STEM as sovereignty and survival.
- Africa was positioned to see STEM as foreign dependency.
That mental model difference — prestige + identity vs. alienation + fear — explains the divergence.
Guilds, Families, and Fields: Why Asia’s Shields Held and Africa’s Fractured
Institutional vs. Ecological Resilience
This takes us to the deep soil of why Africa’s pre-colonial stewardship voice didn’t crystallize into the same resilience buffers India and Singapore carried into colonization.
1. Mode of Knowledge Transmission
- India & Singapore: Had written, codified traditions — Sanskrit texts, Confucian classics, merchant account books. These gave permanence.
- Africa: Knowledge was oral, embodied, seasonal, experiential. Rich, but vulnerable: if elders were killed, or apprenticeships broken, entire sciences could vanish.
👉 Without writing, resilience structures were fragile under colonial attack.
2. Economic Base
- India & Singapore: Dense trade economies. Guilds (weavers, blacksmiths, traders) created institutional memory. Merchant networks spanned seas and kept records.
- Africa: Many societies were agrarian-pastoral, dispersed across vast land. Trade existed (Saharan caravans, Swahili coast) but was less institutionalized continent-wide.
👉 Economic decentralization limited the rise of guild-like resilience.
3. Social Organization
- India & Singapore: Caste, clan, or merchant networks bound people into long-lasting communal obligations. Apprenticeship often ran through kinship or guild.
- Africa: Authority often centered on kinship + chiefs. Knowledge was stewarded, but structures were fluid; migrations, wars, and ecology caused frequent dispersal.
👉 Flexibility helped survival, but limited rigid resilience structures.
4. Geography & Ecology
- India & Singapore: High population density forced long-term institutions to emerge. Cities like Varanasi, Calcutta, Singapore city-state acted as resilience hubs.
- Africa: Vast land, lower population density in many regions, high ecological variability (droughts, tsetse flies, shifting rain belts). Communities adapted fluidly — but without dense urban hubs to “lock in” institutions.
👉 Mobility replaced permanence as resilience.
5. Colonizer’s Leverage
- India & Singapore: Colonizers encountered deep communal buffers (guilds, merchants, written canons). Harder to erase.
- Africa: Colonizers faced flexible but fragile structures. Easier to break oral chains, co-opt chiefs, dismantle crafts, and rewire subjecthood.
So what stopped Africa?
Not weakness, but different forms of resilience:
- Africa’s resilience was ecological, mobile, oral, adaptive.
- India & Singapore’s resilience was institutional, textual, merchant-based.
Colonization targeted institutions. So where Asia resisted with codified canons and guilds, Africa’s fluid structures were dismantled more easily.
⚖️ Why Africa’s path diverged
- Many communities had oral rather than written science traditions, easier for colonizers to dismiss.
- Colonizers dismantled indigenous institutions more thoroughly (to prevent resistance).
- Economic models (extraction, monocrops, mining) didn’t need local STEM → so STEM wasn’t integrated into sovereignty narratives.
- Colonizers successfully embedded the “STEM = foreign” mental model deeper in Africa than in Asia.
Reactive Loops Today
- Governance: Ministries dominated by law/politics, weak technical oversight.
- Agriculture: Youth see farming as backward; agronomy invisible. Food imports grow.
- Manufacturing: Industrial visions mimic foreign models, but factories fail without engineers.
This is the reactive voice: fearful, hesitant, angry, but still trapped in colonizer categories.
Part 4: Restorative Voice — Rewriting the Future
Question: If Africa could rewrite history, what would it do?
This is a profound thought experiment, Sheila — asking: if Africa could “rewrite” its history, what foundations would it have needed to carry forward so that its post-colonial STEM trajectory looked more like India or Singapore?
Here’s a structured reflection:
🔮 If Africa Could Rewrite History: A Systems Counterfactual
1. Pre-Colonial Anchors
- Record Indigenous STEM in Writing
- Codify astronomy, metallurgy, agronomy, medicine in scripts and manuscripts (as India did with Sanskrit texts, or China with bamboo/paper records).
- This written archive would make it harder for colonizers to dismiss African STEM as “primitive.”
- Institutionalize STEM in Guilds/Schools
- Build enduring centers of learning (like Timbuktu but across regions) where STEM knowledge is formally taught, certified, and celebrated.
- This would provide continuity even if colonizers disrupted oral traditions.
- Tie STEM to Identity and Status
- Ensure blacksmiths, healers, astronomers hold high prestige akin to priests or chiefs.
- That way, when colonizers arrived, attacking STEM would be attacking the core of society, not just a fringe.
2. During Colonization
- Frame Colonizer STEM as Additive, Not Superior
- Chiefs and elders could have said: “They bring their tools; we already have ours. Let us combine them.”
- By presenting European science as one more tradition among many, Africa could preserve dignity and continuity.
- Preserve Parallel Indigenous Institutions
- While accepting colonial schools, maintain African STEM schools that taught astronomy, metallurgy, botany, irrigation.
- This would ensure children grew up bilingual in both indigenous and Western STEM.
- Resist the “Primitive” Label through Leadership
- Leaders could publicly demonstrate African STEM achievements (e.g., iron smelting, architecture) as equal to colonizer inventions.
- This would counter the colonizer’s psychological edge of invincibility.
- Build Coalitions with Other Colonized Nations
- Forge intellectual exchanges with India, China, Islamic world — showing Africans that others under empire were also scientists, engineers, mathematicians.
- This solidarity would weaken the “Europe = only science” narrative.
3. Post-Colonial Pivot (to Rewrite the Future)
- National Leaders Define STEM as Sovereignty
- Like Nehru in India or Lee Kuan Yew in Singapore, African leaders would have made science the language of freedom.
- Instead of valorizing political or legal careers above all, they’d valorize engineers, doctors, and farmers who modernize.
- Build Early Flagship Institutions
- Establish continental “IITs” (Indian Institutes of Technology) or “NUS” equivalents (Singapore) as symbols of African brainpower.
- Guarantee scholarships tied to national projects so STEM graduates felt purposeful.
- Diaspora Integration
- Structure pathways for Africans studying abroad to return with skills (as Singapore enforced with bonded scholarships).
- This would prevent brain drain and build a confident scientific community at home.
- Reframe Cultural Narratives
- Celebrate African STEM heroes in textbooks alongside Newton and Galileo.
- Teach children: “We discovered steel, we built Great Zimbabwe, we healed with botany — STEM is ours.”
4. System Archetypes — What Needed Breaking
- Avoid “Shifting the Burden”
- Don’t over-rely on imported turnkey solutions (railways, hospitals, schools). Insist on co-building with local engineers, training in parallel.
- Avoid “Growth & Underinvestment”
- Keep investing in labs, schools, indigenous knowledge — even if imported STEM seems faster or shinier.
- Break “Drifting Goals”
- Refuse to lower expectations: aim for African manufacturing, satellites, medical schools within a generation, not “someday.”
✨ Summary: The Alternative History
If Africa could rewrite history, it would have:
Recorded its STEM in enduring ways (written, institutional).
Framed colonizer STEM as complementary, not superior.
Preserved and taught its own STEM alongside Western STEM.
Had leaders who cast STEM as sovereignty, not subordination.
Invested in institutions, diaspora return, and prestige for scientists.
The result?
- Post-colonial Africa would have emerged with a mindset closer to India. In India, STEM represents pride and sovereignty. Similarly, in Singapore, STEM signifies survival and prosperity. This is in contrast to today’s fractured view, where STEM is seen as foreign and dependent.
Question: What if knowledge had been honored differently?
Africa might already have led in regenerative farming, botanical pharmacology, metallurgy, cosmology, and frugal engineering.
Question: Why did Africa let go of its own voice?
Because colonization overwrote reciprocity with obedience. Chiefs echoed superiority. Fear replaced pride.
But history is not fixed.
Picking Up the Pen Today
- Governance: Data-driven ministries, predictive modelling, and Development Manager reforms.
- Agriculture: Regenerative hub of the world.
- Manufacturing: Agro-processing, renewables, frugal AI.
- Education: Curricula rooted in identity — Dogon + Galileo, Nok + Newton.
- Diaspora: Structured return pipelines.
This is the restorative voice: Africa reclaiming STEM not as mimicry but as authorship.
Epilogue: Rediscovering the African Voice
Africa often speaks in protest or mimicry — wound up tight, resentful, reactive. That is not yet its own voice.
This essay has unfolded in questions. Africa must rediscover its own narrative by asking differently. It should not do so by accepting ready-made answers.
The stewardship voice said: “We belong to knowledge.”
The obedience voice said: “We obey the colonizer’s knowledge.”
The reactive voice says: “We resent STEM, but still think it is foreign.”
The restorative voice will say:
👉 “We are inventors. Our knowledge is ours. Our voice leads not only for ourselves but for the world.”
Part 5: Levers of Restoration — From Fear to Leadership
Opening Frame
We have traced Africa’s journey through four voices:
- Stewardship — Africa once spoke STEM as belonging.
- Obedience — Colonization overwrote this voice.
- Reactive — Post-colonial Africa feared STEM as foreign.
- Restorative — Africa can reclaim STEM as sovereignty.
But history alone is not enough. The question is: what levers can Africa pull today to shift from fear into leadership?
1. Rediscovering Epistemology
Question: How did African societies define “knowledge” — what counted as proof or evidence?
Pre-colonial Africa validated knowledge through experience. If it healed, if it grew, if it endured, it was true.
- Blacksmiths proved knowledge at the forge.
- Farmers proved knowledge in the harvest.
- Healers proved knowledge through cures.
Knowledge was peer-reviewed by apprenticeship and witness. Communities saw results and sanctioned them.
Question: What role did women play as custodians of knowledge, and how was this silenced?
Women held STEM authority:
- Midwives controlled reproductive knowledge.
- Seed selectors engineered agriculture.
- Herbalists preserved pharmacology.
Colonization sidelined them, privileging male chiefs and Western doctors. Their knowledge was discredited as “folk practice.”
Lever: Re-anchor STEM in African epistemologies. Bring women’s knowledge back into curricula. Show that experimentation, apprenticeship, and embodied validation are as “scientific” as laboratory methods.
2. Reclaiming Resistance
Question: Why were chiefs vulnerable to co-optation — and could they have chosen differently?
Chiefs were vulnerable because tribute tied authority to resources. Colonizers hijacked tribute into taxes and labor. Some chiefs resisted: Samori Touré built gun foundries, Menelik II modernized Ethiopia’s army, Shaka Zulu innovated militarily.
Question: Were there African resistances to colonial STEM narratives?
Yes — but forgotten. African doctors and artisans kept practices alive in secrecy. Mission-educated elites argued Africa had science too.
Question: Who were the African inventors and intellectuals during colonization who defended STEM?
- Edward Blyden (West Africa) argued for African contributions to civilization.
- Cheikh Anta Diop (Senegal) later traced Egyptian science to Africa.
- Innovators in agriculture, metallurgy, and medicine kept working locally.
Lever: Unearth and teach these resistances. Insert African inventors into textbooks alongside Newton and Galileo.
3. Naming Breakthroughs
Question: How did African independence movements frame science?
Independence speeches emphasized politics and redistribution. Science rarely featured as sovereignty. Exceptions (Nkrumah’s Akosombo Dam, Nyerere’s Ujamaa farms) faltered because technical bases were weak.
Question: What African success stories in STEM today already contradict the fear?
- M-Pesa (Kenya): Mobile money that revolutionized finance.
- Zipline drones (Rwanda): Blood and medicine delivery at scale.
- Off-grid solar (East Africa): Frugal engineering bringing energy to villages.
- Medical research hubs (South Africa): Global leaders in HIV/AIDS, TB.
- Space science (Nigeria, South Africa): Satellites and observatories.
These are not mimicry. They are Africa’s own STEM voice re-emerging.
Lever: Celebrate these as restorative voice in action.
4. Leading the World Through Crisis
Question: What global crises create opportunities for Africa to lead with its STEM voice?
- Climate change: Africa’s regenerative agriculture and biodiversity can lead food system redesign.
- Food security: Soil and genetic diversity position Africa as a breadbasket for the world.
- Energy: Off-grid renewables and frugal systems can model global sustainability.
- Pandemics: Africa’s experience with Ebola, HIV, COVID gives expertise in outbreak management.
Question: How can Africa build coalitions with non-colonial STEM powers?
- Partner with India, China, Brazil, South-South networks.
- Build joint labs, training exchanges, and technology co-ops.
- Frame partnerships as solidarity, not dependency.
5. Removing Today’s Barriers
Question: What practices today prevent Africa from picking up the pen — and how can they be dismantled?
- Corruption and rent-seeking → Solve with STEM-led governance: dashboards, public data, accountability mechanisms.
- Brain drain → Solve with structured return pipelines, bonded scholarships, diaspora partnerships.
- Status narratives (law/politics > science) → Reframe scientists and engineers as national heroes.
Closing: From Levers to Leadership
The restorative voice is not a dream. It is already breaking through in fintech, drones, off-grid energy, medical research. But for Africa to lead globally, it must:
The levers exist. The only question is whether Africa will pull them.
Epilogue (Extended): Rediscovering the African Voice
Africa often speaks in protest or mimicry — wound up tight, resentful, reactive. That is not yet its own voice.
This essay has unfolded in questions. Africa must rediscover its own narrative by asking differently. It should not rely on accepting ready-made answers.
The stewardship voice said: “We belong to knowledge.”
The obedience voice said: “We obey the colonizer’s knowledge.”
The reactive voice says: “We resent STEM, but still think it is foreign.”
The restorative voice will say:
👉 “We are inventors. Our knowledge is ours. Our voice leads not only for ourselves but for the world.”
The levers of restoration are here. Africa can pick up the pen — not just to boast with the world, but to lead it.
[END OF POST]
Share this:


When Nature Speaks … His-story of Cattle Production in Botswana
“In Botswana, a cow is never just a cow. It is wealth, memory, ceremony, and pride. But what happens when the rains don’t come? The grass dies. The kraal is full of mouths no one can feed.”
What You’ll Learn in This Post:
- The rise, fall, and evolution of cattle in Southern Africa
- The impact of drought, disease, and colonialism on Botswana’s herds
- Why Botswana’s large cows aren’t making large systems
- What would happen if Brazilian cattle managers ran Botswana’s land
- What’s really holding Batswana farmers back from productivity
- The mental and emotional layers shaping livestock decisions
- Our cultures are reinforcing droughts, not correcting them.
Absolutely. Below is an outline that maps your line of questioning into a pedagogical arc. It shows the progression of your thinking from curiosity to systems insight, cultural introspection, and structural reform. This can serve as a blueprint for reflective writing, teaching, or publication.
🧭 Outline: Pedagogy of the Questions Behind “When Nature Speaks: His-story of Cattle Production in Botswana”
I. Setting the Stage: System-Wide Enquiry
Objective: Understand why Botswana’s cattle production has struggled despite its natural advantage.
- What is the historical behaviour of cattle production in Southern Africa?
- How did Botswana grow its herd to 3 million by the 1970s?
- What triggered its collapse?
- How did the rinderpest epidemic and other diseases impact this trajectory?
II. Root Cause Exploration: Beyond Natural Disasters
Objective: Challenge the idea that drought and famine are purely natural.
- How often has Botswana been hit by droughts and famines in the last 500 years?
- Is Botswana among the most drought-hit countries in the world?
- Are cattle susceptible to wipeout due to malnutrition, and why?
- Why does land degradation persist even when Botswana has big-bodied cattle?
III. Comparative Reflection: Other Nations, Different Outcomes
Objective: Contrast Botswana’s outcomes with countries like Brazil, India, China.
- How many cattle do these nations slaughter, and on what land area?
- How has their yield (kg/ha, weight per animal) changed since 1980?
- How do Brazil’s cattle management practices differ, and what could they achieve on Botswana’s land?
- What would Brazilian managers do more, less, tolerate, or reject?
IV. Cultural Inquiry: Deep Beliefs Behind the Practice
Objective: Unearth the mental models shaping production choices.
- Why are Batswana farmers hesitant to sell cattle unless broke?
- How entrenched is this belief within family, village, and cultural identity?
- Whose voice is it — male or female — that guards this belief?
- What cultural scripts are being followed, and are they serving farmers today?
V. Systems Insight: The Feedback Loop Revealed
Objective: Identify the archetypal structure reinforcing collapse.
- Does the culture reinforce the very conditions that validate itself?
- How does not selling lead to overgrazing, land degradation, drought, then selling only in desperation?
- What systemic loop is at play here (e.g. “Shifting the Burden”)?
VI. Structural Possibility: Leveraging Land and Markets
Objective: Test what could shift the system.
- Would requiring farmers to graze only on their own land (vs. communal) change behaviour?
- Would this make consequences more personal and encourage innovation?
- How would incentives and accountability change under private vs communal tenure?
VII. Future-State Thinking: Breaking the Trap
Objective: Define what needs to change for transformation to take place.
- What must happen for farmers to break this cycle?
- How can we reframe cattle as productive capital, not emergency insurance?
- How can national planning support drought resilience, market readiness, and land regeneration?
VIII. Integration with Broader Economic Development
Objective: Tie cattle reform into a national economic and employment strategy.
- Would expanding employment in agriculture, manufacturing, and exports reduce dependence on cattle hoarding?
- Could wealth outside of livestock allow farmers to shift mental models?
- What is the role of greening the nation and re-investing in ecosystems?
IX. Reflection and Reframe
Final Insight:
The belief that “we keep cattle for a rainy day” has unintentionally brought the drought upon us. Systems-thinking shows how culture, economy, environment, and fear are interlinked. True resilience requires technical reform. It also needs a transformation in how we see, value, and respond to risk.

Here’s a visual aid showing estimated cattle populations across Africa between 1800 and 2014. It is useful for contextual insight. However, it includes the broader continent rather than focusing solely on Southern Africa.
The History of Botswana’s Cattle (1890s–2000s)
Overview: Cattle Production in Southern Africa Since the 1900s
1. Pre-1900s and Early 20th Century: Epidemics & Recovery
- Between 1896–1897, a catastrophic rinderpest epidemic swept across Southern Africa, killing over 5.2 million cattle, along with other livestock and wildlife. This led to widespread famine and economic collapse. The aftermath even transformed landscapes, promoting invasive plant growth and disease vectors like tsetse flies.(Wikipedia)
- Beginning in the early 1900s, vaccination programs started. Coordinated disease control efforts, notably via the OIE formed in 1924, also played a significant role. These efforts gradually rebuilt cattle herds across the region.(Wikipedia)
2. Mid-20th Century: Breeding and Land Policy Impacts
- Colonial-era land regulations, such as South Africa’s Betterment Schemes, imposed restrictions on livestock numbers among indigenous communities. This led to resistance and conflict—most notably the Witzieshoek Revolt (1950) among Basotho farmers, who opposed forced culling.(Wikipedia)
- Breed development also emerged. The Afrikaner cattle breed was dominant until the 1970s. Inbreeding led to its decline. This prompted crossbreeding with exotic breeds.(Wikipedia)
- Zimbabwe saw rapid herd growth in the early 20th century. Indigenous groups increased their cattle holdings from 55,000 in 1900 to over one million. Their numbers rivaled white-owned stock. However, this also intensified grazing pressure.(Open Knowledge FAO)
3. Late 20th Century: Disease Eradication & Institutional Growth
- The Pan-African Rinderpest Campaign (initiated in 1987) marked a successful regional effort to eradicate the disease. By the 1990s, most of Africa, including Southern Africa, was rinderpest-free; the global campaign concluded with disease eradication by 2001.(Wikipedia)
- This paved the way for renewed herd stability and expansion, particularly within commercial farming sectors.
4. 21st Century: Steady Growth Amid Modern Challenges
- As of 2016, South Africa’s national herd was approximately 13.4 million cattle, with 60% held by commercial farmers and 40% by emerging or subsistence farmers. Beef made up roughly 80% of the national cattle herd.(wandilesihlobo.com)
- In the wider SADC region, cattle numbers remain substantial, with estimates at about 64 million cattle, alongside diversified livestock populations.(sadc.int)
- Meat production across Southern Africa surged significantly between 2000 and 2020. Meat output increased by around 618%. Milk and egg production also rose dramatically.(africanclimateactionpartnership.org)
- The livestock sector in Southern Africa has grown at an estimated 2% per annum. This growth reflects steady expansion. It persists despite wider economic and environmental shifts.(wildlife.cornell.edu)
- Climate stresses are reshaping dynamics. In Limpopo, arid conditions have led farmers to shift from cattle to more resilient goats. This shift is pressuring traditional cattle systems.(ft.com)
- Additionally, recent disease outbreaks remain a threat. In June 2025, South Africa launched large-scale vaccination programs in response to a foot-and-mouth disease outbreak. This emphasizes renewed risks to cattle production and trade.(reuters.com)
Summary Table of Key Trends
| Period | Key Trends & Drivers |
|---|---|
| 1890s–Early 1900s | Rinderpest devastation; herd collapse and recovery via vaccination |
| Mid-1900s | Breed developments; colonial land policies leading to resistance and constraints |
| Late 1900s | Disease eradication (rinderpest); institutional support enables herd growth |
| 2000s–2020 | Substantial increases in meat, milk, and egg production across the region |
| Recent Period | Climate adaptation shifts (e.g., goats replacing cattle); disease outbreaks resurging |
Here’s a continent-wide graph showing estimated cattle populations in Africa from 1800 to 2014. It is useful for general context, though not specific to individual countries. Examples of these are Botswana, Zimbabwe, or South Africa (ResearchGate).
Country-Specific Insights: Southern Africa’s Cattle Trends Since 1900
Here’s a breakdown of cattle population trends in the region, with a focus on Botswana, Zimbabwe, and South Africa, drawing on available historical and contemporary data:
** Botswana**
- 1970s Peak → Decline: Botswana’s cattle herd was around 3 million in the 1970s. By the early 2000s, it had dropped to approximately 1.7 million, largely due to disease control measures like mass culling of infected herds (Guardian Sun).
- Recent Recovery & Stabilization: More recent reports (as of 2025) place the herd at around 1.9 million, indicating slight recovery from its earlier low (Guardian Sun).
- 2019 Data: Estimates from agricultural surveys place the total cattle population at around 1.6 million in 2019, the majority in the traditional sector (Academic Journals).
** Zimbabwe (Formerly Southern Rhodesia)**
- Early 1900s Surge: In 1900, Indigenous herders in Southern Rhodesia owned roughly 55,000 cattle. European settlers held fewer than 12,000 cattle. By the early 1920s, cattle numbers had soared. Both groups had over 1 million heads each. This was a dramatic expansion tied to colonial development and livestock redistribution (Wikipedia).
** South Africa**
- Turn-of-the-Century Collapse & Recovery: South Africa’s indigenous Afrikaner cattle nearly vanished during the Boer War. The catastrophic rinderpest epidemic (1896–1897) is estimated to have killed up to 95% of cattle in the region. Recovery began through breed preservation efforts, including the establishment of the Afrikaner cattle stud book in 1912 (Wikipedia).
- 20th-Century Resilience: Breed improvements and institutional support stabilized and grew cattle populations through the mid-to-late 1900s.
Summary Table
| Country | Key Trend & Time Period |
|---|---|
| Botswana | ~3M (1970s) → ↓ to ~1.6–1.9M (2000s–2019) due to disease control and drought |
| Zimbabwe | ~0.067M (1900) → >1M (1920s) as cattle ownership expanded rapidly |
| South Africa | Near-collapse (1896–1902) → breed recovery starting 1912 through selective breeding programs |
📜 What Caused the Onset of the Rinderpest Epidemic?
The rinderpest epidemic devastated Africa’s cattle populations in the late 19th century. This was especially true in 1896–1897. The epidemic started with the introduction of the rinderpest virus into the African continent. It came via infected Italian cattle brought to Eritrea.
🔍 Timeline of the Onset:
1887 – Italy imported infected cattle into Eritrea during a military campaign.
From there, rinderpest spread rapidly southward via:
Cattle herds moved for trade, migration, or conquest.
Contact between domestic cattle and wildlife reservoirs.
Lack of immunity among African cattle and wildlife species, which had never encountered the disease before.
The epidemic became pandemic in scope. It swept through Ethiopia, Kenya, Uganda, the Great Lakes region. It eventually reached Southern Africa by 1896–1897.
🐄 Did Rinderpest Affect Cattle in Botswana?
Yes — and severely.
Botswana, then the Bechuanaland Protectorate, was one of the worst-affected regions in southern Africa during the epidemic.
📉 Impact on Botswana:
- Over 90% of cattle in Botswana perished during the epidemic.
- This collapse decimated pastoral livelihoods, as cattle were a key source of wealth, bride price, draught power, and food.
- The epidemic triggered:
- Famine in affected regions
- Ecological shifts (e.g., bush encroachment due to loss of grazers)
- Growth of tsetse fly habitat, increasing sleeping sickness
- It took decades for Botswana’s cattle herd to recover.
🛑 Notable Systemic Consequences:
- Colonial authorities used the crisis to expand control:
- Instituted veterinary cordon fences and movement restrictions
- Introduced culling and quarantine policies
- The loss also transformed the economic systems, with some communities forced into wage labor and cash cropping to survive.
🌍 Broader Historical Significance
- Rinderpest was the first major transboundary animal disease to shape Africa’s agricultural and political systems.
- Its eradication in 2011 was the second-ever disease eradicated globally, after smallpox.
Why Big Cows Still Starve: The System Behind the Herd
The rise, fall, and resurgence of Botswana’s cattle herd:
The rinderpest wipeout in the late 1890s
The long recovery to reach 3 million cattle by the 1970s
The subsequent decline to 1.7 million by the early 2000s
The diseases that triggered culling and export suspensions
📉 1. Initial Wipeout: Rinderpest Epidemic (1896–1897)
- Impact: Up to 90% of Botswana’s cattle population perished due to the 1896–97 rinderpest epidemic.
- This wiped out an estimated hundreds of thousands of animals, especially among Tswana communities who were heavily dependent on cattle.
- Consequences: The loss of cattle caused:
- Widespread famine
- Collapse of local economies
- Increased colonial control over livestock movement and disease management
📈 2. Slow Recovery: From 1897 to 1970s (~70 years)
Timeline of Herd Rebuilding:
- 1900s–1930s: Very slow herd recovery due to repeated droughts, tsetse fly infestation, and poor veterinary infrastructure.
- 1940s–1950s: Introduction of structured veterinary services and disease surveillance (notably for contagious bovine pleuropneumonia and foot-and-mouth disease).
- 1954: Botswana begins exporting beef to Britain under the Imperial Preference Trade Agreement.
- 1960s–1970s: There was a massive investment in veterinary infrastructure. This included cordon fences, vaccinations, and abattoirs. British support facilitated these developments. The Botswana Meat Commission (BMC) was established in 1966.
Result:
- By the early to mid-1970s, Botswana’s cattle herd had reached approximately 3 million.
- This growth was tied closely to the rise in beef exports, especially to the European Economic Community under quota arrangements.
📉 3. Decline to 1.7 Million: Early 2000s
Between the 1980s and early 2000s, Botswana’s national herd declined by over 40%. Causes included:
🔬 Key Animal Health Crises:
Contagious Bovine Pleuropneumonia (CBPP)
A deadly bacterial lung disease
Outbreak in 1995–1996 in Ngamiland led to:
The culling of 320,000 cattle
Suspension of exports
Trade disruptions lasting several years
Ngamiland remained cordoned off, with cattle movement prohibited into other regions.
Foot-and-Mouth Disease (FMD)
Recurrent outbreaks in the north and east
Triggered EU export bans and mass vaccination campaigns
Damaged confidence in Botswana’s disease-free zones and traceability systems
Drought and Land Degradation
Severe droughts in the 1980s and late 1990s
Overgrazing and communal herd concentration led to range degradation
📊 Summary Timeline
| Period | Key Event/Status | Herd Size (approx.) |
|---|---|---|
| 1896–1897 | Rinderpest epidemic, >90% herd wiped out | ↓ < 200,000 |
| 1900–1960 | Gradual recovery, vet system developing | ↑ Slow growth |
| 1970s | Herd reaches historic peak | ↑ ~3 million |
| 1995–1996 | CBPP outbreak in Ngamiland, 320,000 culled | ↓ ~2.5 million |
| Early 2000s | Continued decline due to FMD + drought | ↓ ~1.7 million |
Before the rinderpest epidemic of 1896–1897, Botswana was known as the Bechuanaland Protectorate. It had an estimated cattle population of between 300,000 and 400,000 head of cattle.
📌 Key Sources & Context:
- Historical accounts suggest that Tswana pastoral communities were among the most cattle-rich groups in the region.
- In northern Botswana, particularly Ngamiland and surrounding areas, large herds were kept by extended families and chieftaincies. Cattle were central to:
- Wealth storage
- Bride price (lobola)
- Social status and power
- The rinderpest outbreak killed 90–95% of the national herd. This reduction brought the population to less than 20,000–30,000 cattle across the country.
📖 According to archival records and colonial veterinary reports, the loss of cattle during the rinderpest epidemic in Bechuanaland was so profound that it reshaped both the ecology (e.g. bush encroachment, wildlife population changes) and the political economy, as cattle-owning households were forced into labor migration and cash crop farming.
🐄 Summary
| Year | Estimated Cattle Population | Notes |
|---|---|---|
| Pre-1896 | 300,000 – 400,000 | Rich Tswana pastoral base |
| Post-1897 | < 20,000 | >90% wiped out by rinderpest |
| 1900–1950s | Gradual recovery | Hindered by drought, disease, and tsetse |
Historical Droughts & Famines: A Broad View
Here’s what I’ve gathered about the frequency of droughts and famines in Botswana over the past 500 years, acknowledging that long-term historical data is limited:
1. Pre-20th Century (1500s–1800s)
- Paleoclimatic evidence indicates significant climate variability during what’s known as the Little Ice Age (c. 1500–1800), affecting southern Africa with cooler, sometimes dryer conditions.
- Frequent oscillations between wet and dry decades likely caused periodic shortages. However, explicit records of localized famines in Botswana from this era are lacking. This is particularly true for the pre-colonial period.
(Wikipedia) - Records from the Toutswe culture (circa 13th century) suggest that drought contributed to their collapse, though the details are fragmentary.
(Wikipedia)
2. 20th Century to Present
- 1930s: A severe drought struck Bechuanaland (Botswana), resulting in livestock losses as high as 60%.
(Wikipedia) - 1961–1965: A prolonged drought contributed to the loss of over 250,000 head of cattle around Gaborone.
(Wikipedia) - 1981–1987: One of the worst drought episodes, severely affecting agriculture and livestock across the country.
(Wikipedia) - Late 20th to Early 21st Centuries: Recurrent multi-year droughts recorded, including 1991–1992, 2001–2006, and 2009–2012.
(ScienceDirect) - Looking Deeper (1980–2015): In regions like Bobirwa, droughts averaged 1.9 years in length, recurring approximately 3.7 times every 5 years. Prevalence increased over successive decades—from about 50% in the 1980s to 70% by 2001–2010.
(MDPI) - 2018–2019: The country experienced one of its most damaging droughts in recent memory, with two-thirds of planted crops failing.
(World Bank)
Summary Table: Botswana’s Drought History
| Period | Highlights |
|---|---|
| 1500s–1800s | Climate variability (Little Ice Age); societal pressures likely due to droughts |
| 1930s | Severe drought—~60% cattle losses |
| 1961–1965 | Prolonged drought—~250,000 cattle deaths near Gaborone |
| 1981–1987 | Major multi-year drought disrupting agriculture and livelihoods |
| 1991–2006 (multiple blocks) | Recurring droughts across decades |
| 2009–2012 | Extended dry spells, national drought declarations |
| 2018–2019 | Crop failures on a catastrophic scale (≈2/3 of planted fields failed) |
| 1980–2015 (regional) | Droughts lasted ~2 years, recurred every ~2.3 years; increasing frequency over time |
In Summary
- Recorded severe droughts and related famines in Botswana have occurred sporadically but repeatedly—approximately every few decades—since at least the 1930s.
- Over the past 35–40 years, drought cycles have become more frequent and extended, with several multi-year events and increasing pervasiveness.
- Pre-20th-century events are harder to quantify but likely included severe climate swings that periodically stressed systems and societies.
Global Drought Risk Ranking
Countries are ranked according to the 2025 Drought Risk Score from World Population Review. Rankings are based on their susceptibility to socioeconomic effects. They are also ranked based on agricultural losses resulting from drought.
Here are the relevant rankings:
- Somalia: 5.00
- Zimbabwe: 4.72
- Djibouti: 4.68
- Mauritania: 4.48
- South Africa: 4.44
- Namibia: 4.44
- …
- Botswana: 3.6 (World Population Review)
This puts Botswana in a high-risk category—among the top affected countries globally, especially within the African context.
In Academic Assessments
A scientific drought-risk assessment further highlights Botswana’s extreme vulnerability:
Botswana is ranked highest in drought risk. This is mainly due to a combination of high exposure and significant vulnerability in agricultural systems. (ResearchGate)
Country Perspective: Drought Frequency
Since independence in 1966, Botswana has experienced 19 droughts over 58 years, averaging one drought every 3 years (thegazette.news). This frequency further underscores its susceptibility to water scarcity regardless of global wealth or preparedness.
Summary Table
| Metric | Botswana’s Standing |
|---|---|
| Drought Risk Score | High (approx. 3.6) among global rankings |
| Regional Ranking | Among the most drought-prone globally—especially within Africa |
| Frequency of Droughts | ~19 droughts since 1966 → about one every 3 years |
Interpretation
Botswana is consistently exposed to recurring droughts. This occurs more frequently than in most countries globally. Botswana is highly vulnerable due to its semi-arid climate, dependence on rain-fed agriculture, and limited adaptive infrastructure. These factors contribute to a heightened drought risk profile that is recognized internationally.
Are cattle highly susceptible to wipeouts due to malnutrition?
Yes, cattle are highly susceptible to wipeouts due to malnutrition, especially under prolonged or severe conditions. Malnutrition is a major indirect cause of large-scale cattle deaths. This is particularly true in regions with drought-prone or overgrazed rangelands, such as Botswana and other parts of Southern Africa.
🔍 Why Malnutrition Leads to Cattle Wipeouts
1. Weakened Immune Systems
- Poor nutrition compromises cattle’s ability to fight off diseases like:
- Contagious Bovine Pleuropneumonia (CBPP)
- Foot-and-Mouth Disease (FMD)
- Tick-borne diseases
- Even routine infections can become fatal in malnourished cattle.
2. Reproductive Failure
- Malnourished cows have:
- Lower conception rates
- Higher rates of stillbirth and abortion
- Weak calves with high mortality
- This disrupts herd rebuilding and long-term viability.
3. Reduced Milk Production
- Nutritional deficiency directly impacts:
- Calf survival
- Income generation for smallholder households
- Calves may die of starvation even if the dam survives.
4. Increased Susceptibility to Parasites
- Nutrient-deficient animals cannot resist parasitic infestations (e.g., internal worms, ticks), leading to:
- Weight loss
- Organ failure
- Secondary infections
5. Direct Starvation Deaths
- In severe droughts, animals may die en masse due to complete lack of:
- Grazing biomass (especially in overstocked areas)
- Supplementary feed
- Water
⚠️ Real-World Examples from Botswana and Region
- 1980s Botswana droughts caused significant herd losses due to a lack of both pasture and feed.
- 2015–2016 drought in Southern Africa:
- Led to cattle deaths in Botswana, Namibia, and South Africa
- Some farmers were forced to sell at distress prices or slaughter breeding stock
- 2002/03 Zimbabwe drought: over 70,000 cattle were reported dead due to starvation
🛠 Mitigation Measures
Governments and farmers use a range of tools to avoid nutritional wipeouts:
- Supplementary feeding (especially protein licks, hay, molasses)
- Destocking policies in drought years
- Water point development
- Fodder banks and early warning systems
- Agro-ecological approaches to range restoration
✅ Summary
| Risk Factor | Effect on Cattle |
|---|---|
| Protein deficiency | Muscle wasting, lowered immunity |
| Energy shortage | Rapid weight loss, mortality |
| Mineral imbalance | Reproductive failure, poor bone growth |
| Prolonged starvation | Starvation deaths, herd collapse |
Yes—malnutrition is a serious threat, especially during droughts or feed shortages. It can wipe out entire herds if no adaptive or policy-level response is made promptly.
Susceptibility of cattle in Botswana and Southern Africa versus high-cattle-producing nations
Here is a structured comparison of the susceptibility of cattle in Botswana and Southern Africa. It contrasts with high-cattle-producing nations (like Brazil, India, USA, and China). The focus is on their vulnerability to wipeouts. These include malnutrition, disease, and climate stress.
🔍 Comparison Framework
| Factor | Botswana & Southern Africa | High Cattle-Producing Nations (Brazil, India, USA, China) |
|---|---|---|
| Production System Type | Mostly extensive, range-based, low-input systems; communal grazing; low feed supplementation | Mostly intensive or semi-intensive, with higher use of feedlots, commercial feed, veterinary inputs |
| Nutrition & Feed Resilience | Highly vulnerable to drought, pasture shortages, poor quality grazing; limited commercial feed use | Greater feed resilience via grain-based rations, silage, feedstock supply chains |
| Water Availability | Arid/semi-arid zones (e.g. Botswana, Namibia); boreholes and pans often dry out | Access to irrigation, reservoirs, and large-scale water infrastructure (e.g. USA Midwest, India canal systems) |
| Disease Burden | Endemic diseases: CBPP, FMD, tick-borne diseases; wildlife-livestock disease interface | Higher levels of vaccination coverage; better disease surveillance systems (e.g. USDA-APHIS, ICAR India) |
| Veterinary Infrastructure | Public vet systems often underfunded, stretched over vast areas | Dense vet coverage; public-private partnerships; embedded services in commercial chains |
| Cattle Traceability | Incomplete traceability in many parts of SADC; Botswana is a regional leader (for EU exports) | Strong traceability in USA, Brazil (Carne Trac), Australia (NLIS); less so in India’s rural areas |
| Climate Risk Exposure | High: drought, heatwaves, overgrazing, rangeland degradation | Some climate stress (e.g. Brazil’s Amazon heat, India droughts), but greater adaptive capacity |
| Commercial vs Subsistence Mix | ~50–70% of herds in Southern Africa held by smallholders or subsistence farmers | High proportion of commercial-scale operations, especially in USA, Brazil, China |
| Emergency Response Capacity | Limited fodder reserves, financial instruments, insurance schemes (e.g. Botswana had no fodder bank in 2022 drought) | Larger-scale insurance, subsidies, early-warning, and market stabilization schemes in place |
| Breeds & Genetic Resilience | Use of indigenous breeds (e.g. Tswana, Sanga) more heat- and disease-tolerant but slower-growing | Mixture of high-yielding commercial breeds (Angus, Holstein, Zebu), less climate-adapted |
⚖️ Comparative Summary
| Indicator | Botswana & SADC | Top Producers |
|---|---|---|
| Susceptibility to Malnutrition | High | Moderate–Low |
| Susceptibility to Disease | High (FMD, CBPP) | Low–Moderate (controlled) |
| Drought Vulnerability | Severe | Moderate |
| Recovery Time Post-Wipeout | Slow (years–decades) | Fast (months–years) |
| System Resilience (overall) | Low–Moderate | High |
🧠 Key Insight:
Cattle systems in Botswana and Southern Africa are ecologically fragile and economically exposed, especially under drought and disease pressures. In contrast, top cattle-producing nations have additional resources. They have infrastructure, policy tools, market integration, and genetic optimization. These make wipeouts less likely and allow faster recovery.
Compare Their Yields Per Hectare
Here’s a comparative analysis of how cattle production intensity has changed in high cattle‑producing nations. This intensity is measured as stocking rates (cattle per hectare). High production is seen particularly in Brazil. In contrast, there are evolving cattle yields in Botswana, where such productivity metrics have been declining.
Brazil: Intensive Growth in Cattle Yield per Hectare
- Stocking Rate Rise: In Brazil, stocking rates increased substantially from 0.51 to 1.15 head per hectare between 1970 and 2017. This change represents a 125% increase. The increase was driven by intensification, adoption of planted pastures, and improved management practices (Frontiers, MDPI).
- National Context: By 2016, Brazil’s average stocking rate had further increased to 1.25 head per hectare (Wikipedia).
This shows a significant improvement in yield per unit land. Productivity has more than doubled over the latter half of the 20th century.
Botswana: Declining Productivity, No Evidence of Yield Growth
- Lack of Data on Yield per Hectare: There is limited direct data on yield or stocking rates per hectare. Botswana’s cattle sector has faced decreasing herd numbers. The numbers have dropped from around 3 million in the 1970s to roughly 1.7–1.9 million today (oaktrust.library.tamu.edu, Wikipedia).
- Land Constraints & Extensification: Botswana’s extensive systems are predominantly traditional communal grazing. They lack intensification tools such as planted forage. There is no feed supplementation or irrigation. With recurring droughts and land degradation, land-use for cattle has not increased, suggesting yields per hectare likely stagnated or declined (Wikipedia, Trade.gov).
Comparative Summary
| Region / Country | Feeder Cattle Productivity Trend |
|---|---|
| Brazil (1970–2017) | Stocking rate increased +125% (0.51 → 1.15 head/ha) |
| Botswana (1980s–2020s) | Herd declined; no evidence of yield-per-hectare gains; productivity likely stagnant or declining |
Key Insights
- Brazil achieved significant yield gains through:
- Transition to planted pastures
- Stocking intensification supported by infrastructure and technology
- Management improvements in genetics, nutrition, and pasture care (MDPI, PMC, pure.iiasa.ac.at).
- Botswana, in contrast, remains largely extensive, with productivity hampered by:
- Persistent droughts
- Lack of supplemental feeding
- Communal land use
- Minimal adoption of intensification strategies
Data available on their culling rates:
Here’s what we could gather based on available data regarding cattle slaughter numbers (1980s to present) and dedicated cattle grazing area for:
Brazil
India
China (data limited)
Botswana
1. Brazil
- In 2023, Brazil recorded a cattle slaughter count of 34.06 million head, marking a near 14% increase over the previous year (Reuters).
- Brazil is the world’s largest beef producer. However, data on the total hectareage allocated specifically for cattle grazing over time is not provided here. However, Brazil’s cattle herd continues to expand and remains among the highest globally, exceeding 230 million head (Reuters).
2. India
- Precise, aggregated cattle slaughter numbers from the 1980s to today are not readily available in the sourced materials.
- India’s state-by-state regulations heavily restrict cattle slaughter—especially cows—due to cultural and religious reasons. Most bovine slaughter is for buffaloes or occurs in states with legal allowances (FAOHome).
- Thus, these restrictions make the slaughter statistics inconsistent and often incomplete. A clear figure for total slaughtered cattle over time isn’t accessible in the sources.
- Likewise, no consolidated data on grazing hectareage dedicated to cattle was found.
3. China
- Unfortunately, no data on total cattle slaughter in China was available from the retrieved sources. Information on grazing area allocation for cattle was also unavailable.
4. Botswana
Cattle Slaughter Numbers:
- In 2010, Botswana slaughtered around 217,478 cattle, with approximately 10,000 small stock slaughtered as well (lea.co.bw).
- The Botswana Meat Commission (BMC) was the primary national processor. It was recording its highest annual slaughter’s capacity at around 179,009 cattle in a year. This was prior to recent shifts (The Business Weekly & Review).
- However, slaughter numbers plummeted due to increased live cattle exports:
- 2019: ~79,000 cattle slaughtered by BMC
- 2020: Dropped to ~30,330
- 2021: Fell further to ~19,671 (lowest ever)
- 2022: Rebounded to ~36,125
- 2023: Up to ~66,187
- By late 2024: ~55,778 cattle slaughtered (The Business Weekly & Review).
Grazing Land (Hectarage):
- Exact hectareage figures allocated for cattle grazing in Botswana were not found in the data.
- What is known:
Summary Table
| Country | Slaughtered (most recent data) | Hectarage / Grazing Area Info |
|---|---|---|
| Brazil | ~34 million head (2023) | No data available on hectareage |
| India | Not available (variable due to bans) | No data available |
| China | No data found | No data available |
| Botswana | ~55k in 2024 (BMC only; earlier ~217k/year in 2010) | Communal and ranch grazing dominates; no specific hectareage data |
Takeaways:
- Brazil remains the global leader in cattle slaughter, with figures in the tens of millions annually.
- Botswana processes considerably fewer cattle. The average was around 200k/year earlier. However, recent shifts to live exports have significantly reduced slaughter throughput. This is despite high national herd sizes.
- Comprehensive data gaps exist for India and China, particularly regarding slaughter volumes and grazing land usage.
Data available on their average cattle weights
Here’s a clear comparison of average cattle weights in Brazil versus Botswana, based on available breed and industry data:
Brazil: Average Cattle Weights
- Finished carcass weight (2023)
Brazilian cattle averaged 253 kg per carcass in 2023.(Journals, abiec.com.br) - Calf (lean cattle) weights
In Mato Grosso do Sul, the average calf weight in 2023 was about 207 kg. This is consistent with a long-term average of 201 kg over the past decade.(The Cattle Site) - Commercially confined cattle
In Brazil, over 7 million cattle were confined for fattening by 2024. The country does not provide specific processed weight data. This information is not available here.(USDA App Center)
Botswana: Average Cattle Weights
- Tswana Breed (mature weight)
- Mature male Tswana cattle weigh between 310–520 kg.
- Mature female Tswana cattle range from 290–420 kg.(agtr.ilri.org)
- Tuli, Bonsmara, Brahman, Africander (Botswana breeds)
- Tuli cows: ~400 kg
- Bonsmara: ~445 kg
- Tswana: ~415 kg
- Brahman: ~446 kg
- Africander (Afrikaner): ~429 kg
These are mature weights (non-carcass) reported for cattle bred and raised in Botswana.(Journals, proagrimedia.com, agtr.ilri.org, en.wikipedia.org)
Comparative Summary
| Region | Animal Type | Average Weight |
|---|---|---|
| Brazil | Carcass (finished) | ~253 kg |
| Calf (lean cattle) | ~201 – 207 kg live weight | |
| Botswana | Mature Tswana bulls | 310 – 520 kg |
| Mature Tswana cows | 290 – 420 kg | |
| Mature mixed breeds | ~400 – 446 kg |
Interpretation
- Brazilian cattle, particularly calves and carcasses, weigh significantly less (200–250 kg) than fully mature Botswana breeds. These breeds range from 290 kg up to 520 kg, depending on gender and breed.
- Brazilian figures focus on market-ready weights suitable for processing, whereas Botswana data represents fully grown, live-weight mature animals.
Additional Context
- Brazil’s intensive production systems (e.g., feedlots, confined operations) focus on optimized finishing weights, enabling more uniform, predictable carcass outputs.
- Botswana’s cattle are often indigenous or locally adapted breeds. They are raised extensively. They mature to higher final weights. However, their ages or slaughter points may vary widely.
❓My Core Question 1:
If Botswana’s cattle are naturally larger than Brazil’s, why do they still suffer from malnutrition? Why do they die in droughts? Why do they fail to grow the national herd to the scale that Brazil has achieved?
This feels contradictory—but it isn’t once you look at the system structure behind cattle production.
🔍 Step 1: Bigger Doesn’t Mean Better in Production Systems
Botswana’s cattle may grow larger, but that doesn’t automatically translate to:
- More animals per hectare
- Higher total national production
- Resilience under pressure (e.g. drought)
It’s like saying: a country with strong, tall trees doesn’t necessarily have more forest cover or more firewood.
⚙️ Step 2: Understanding the System Loops – Brazil vs. Botswana
| System Factor | Brazil | Botswana |
|---|---|---|
| Feeding System | Controlled feedlots, planted pastures, silage, grain rations | Extensive grazing, highly climate-dependent |
| Land Productivity (Yield/ha) | High: up to 1.25 cattle per hectare | Low: often <0.3 cattle/ha in semi-arid zones |
| Breeding Strategy | Breeds selected for fast turnover, uniform carcass weight | Mixed breeds, slower maturing; herd retained as store of wealth |
| Disease Control | Coordinated national control; biosecurity zones | Disease outbreaks often cause mass culling (e.g., CBPP, FMD) |
| Water & Grazing Infrastructure | Irrigated pasture, feed supply chains | Reliant on rainfall, communal rangeland degradation common |
| Market Orientation | Beef is an export industry with integrated processing and logistics | Beef is partly commercial, but many keep cattle for status, not market |
| Policy & Incentives | Government + private sector align to drive volume and quality | Government policies often react to crisis, not long-term transformation |
🐄 Step 3: A Mental Model – The “Muscle vs. Metabolism” Trap
Think of it this way:
Botswana’s cattle are like powerful athletes without a feeding plan.
Brazil’s cattle are smaller but raised on a strict, optimized gym + diet + logistics program.
So even though Botswana’s animals have biological potential, the system around them is underperforming:
- Land degradation
- No supplementary feed in drought
- Cattle as social insurance, not production units
- Weak market signals for quality or scale
📉 Why Doesn’t the Herd Grow in Botswana?
High mortality in drought years
Diseases (CBPP, FMD) trigger mass culling
Low calving rates due to malnutrition, delayed breeding cycles
Overstocking without pasture management leads to poor animal condition
Cultural value of cattle as wealth discourages sales or rotation of herds
Live exports remove young, high-quality bulls from the gene pool before they reproduce
Weak investment in pasture intensification (no irrigation, no winter feed, no fertiliser)
🔁 Brazil’s Reinforcing Loop (Virtuous Cycle)
Feedlots and pastures boost daily weight gain
Farmers get faster returns per animal
This frees up land to grow more animals
More animals = more investment in infrastructure
Greater production = greater policy support and exports
The system feeds itself—volume creates more volume
💡 So How Do You Get Your Head Straight?
You are not crazy to ask this. You’re seeing a leverage point:
It’s not about the size of the cow,
It’s about the design of the system.
If Brazil Ran Botswana: A Cattle Simulation
❓My Core Question 2:
This is a brilliant systems reframing question, and your framing is clear.
You’re asking:
If Brazilian-style cattle managers were placed in Botswana, what would happen? They would not face the social, cultural, or institutional drag from local dynamics. If they applied their production-focused strategies, how would cattle production look? What about the breed size? Consider Botswana’s land base and climate in this scenario.
Let’s build the answer in systems terms.
🔍 1. Assumptions for This Hypothetical Scenario
We assume:
- No Batswana farmers involved (so no traditional wealth-storage role for cattle).
- Brazilian managers apply best practices:
- Rotational grazing
- Drought reserves and silage
- Stocking rate optimization
- Strategic breeding
- The land base of Botswana (~582,000 km²) is available to them.
- Same climate and rainfall (semi-arid to arid, with highly variable annual rainfall).
- Some capital injection is allowed (like fencing, water, storage), but no foreign aid or government subsidies.
🌍 2. Botswana’s Natural Constraints and Potential
| Factor | Status in Botswana | Brazilian Response Potential |
|---|---|---|
| Rainfall | Low to moderate (250–650mm/year) | Drought-resistant breeds + forage banking |
| Soil fertility | Generally low, acidic in parts | Soil liming + planted pasture development possible |
| Rangeland condition | Degraded in communal zones; some underused ranches | Restoration via rest-graze cycles |
| Water | Seasonal pans, boreholes, limited rivers | Borehole-fed paddocks; water harvesting |
🧠 3. What Would Brazilian Management Do Differently?
- Reduce herd per hectare but double productivity per animal
- Use Bonsmara, Tuli, or adapted Brahman-crosses with faster maturity
- Implement strategic slaughter age: sell animals at 24–30 months, not keep till old
- Cull non-productive animals (dry cows, slow growers)
- Introduce forage crops: lucerne, sorghum, silage
- Fertilise paddocks and manage rest periods
- Monitor daily weight gain and use those metrics to plan
📈 4. What Would Happen to Herd Size and Productivity?
Land Productivity Potential (Based on Brazilian Experience):
- In semi-arid Brazil, Brazilian managers have achieved:
- 0.8 to 1.2 cattle/ha on managed pasture
- In Botswana, even if only 25% of land is suitable for cattle (say, 145,000 km²), that’s 14.5 million ha.
👉 At 0.5 head/ha (a modest goal for Botswana):
- You’d support ~7.25 million cattle (vs current ~1.9M)
- With faster turnover, slaughter could reach 2–3M/year sustainably
- Average live weight per slaughtered animal might be lower (~400–450 kg), but net meat output would triple
🧬 5. What Would Happen to the Cattle Breed Size?
- Brazilians would not select for maximum size, but for:
- Faster growth
- Efficient feed conversion
- High calving rate
- Heat and parasite tolerance
Their target would be a live weight around 400 kg instead of trying to reach 500–600 kg mature size (like Tswana bulls). Their goal is a live weight of about 400 kg. They aim to achieve 400–450 kg. It is intended for mature animals. This weight would be stabilized. They would focus on achieving this goal. This would be for finished animals at 24–30 months.
This means:
- Smaller average size than Botswana’s bulls today
- But faster turnover and more calves per cow per lifetime
- Less stress on pasture, water, and feed resources
🧮 6. Summary: If Brazilians Managed Cattle in Botswana…
| Metric | Current Botswana Avg. | Hypothetical Brazilian-Managed Scenario |
|---|---|---|
| Herd size | ~1.7–1.9 million | 6–7 million (on 25% of land area) |
| Stocking rate | ~0.1–0.3 head/ha | ~0.5–0.8 head/ha |
| Carcass weight (avg) | ~220–260 kg (live ~400–450) | ~200–240 kg (live ~400–450) |
| Turnover age | 3–5 years | 24–30 months |
| Calving rate | ~45–55% | ~70–85% |
| Mortality (drought/disease) | High in dry years | Managed with feed reserves and planning |
| System outcome | Underperforming asset | Productive, climate-adapted enterprise |
✅ Conclusion: Your Intuition is Spot-On
Botswana’s cattle system isn’t failing because of the cows.
It’s failing because of the system design around them.
If Brazilian-style managers were put in charge of Botswana’s land, they would likely reduce the size. They would also increase productivity. They would use intensive management to multiply meat output per hectare—even in semi-arid land.
❓My Core Question 3:
Here is a systemic comparison framework for a Brazilian-managed cattle production scenario in Botswana. It uses a lens of what it would emphasize, downplay, tolerate, and refuse to accept. This applies across physical, mental, and emotional dimensions of the system.
🇧🇷 Brazilian-Managed Scenario in Botswana
✅ DO / THINK MORE OF (System Priorities)
| Category | Focus Area |
|---|---|
| Land | Optimize grazing rotation, pasture rest, and soil fertility inputs |
| Feed | Plan year-round nutrition: silage, forage crops, protein blocks |
| Breeding | Select for early maturity, high fertility, and feed efficiency |
| Culling | Regular herd audits to remove non-productive animals |
| Water | Develop boreholes, troughs, and water storage systems |
| Calving | Push for 80–90% calving rates, tight breeding seasons |
| Data | Track weight gain, conception, mortality, feed cost per animal |
| Markets | Deliver consistent, uniform carcass output to buyers/exporters |
| Herd Design | Structure herds for turnover, not status or display |
🚫 DO / THINK LESS OF (System Detachment)
| Category | Downplayed Considerations |
|---|---|
| Cultural Use | Cattle as status symbols, lobola wealth, or long-term family assets |
| Overstocking | Keeping more animals than land can support |
| Communal Systems | Shared grazing, unmanaged land degradation |
| Delay Tactics | “Wait for rain” or “Government will help us” thinking |
| Live Animal Exports | Prefer finishing locally for meat quality and data traceability |
| Max Size per Animal | Less focus on size, more on productivity per hectare |
⚠️ WILL TOLERATE (Physical / Emotional / Mental Limits)
| Type | What It Tolerates |
|---|---|
| Physical | Moderate drought with advance planning (feed, water, destocking) |
| Economic | Slim margins per animal, compensated by volume + efficiency |
| Emotional | Tough decisions: culling, selling young heifers, stopping tradition |
| Mental | Rigorous discipline: track KPIs, adjust systems, invest before returns |
❌ WILL NOT TOLERATE (System Red Lines)
| Type | What It Rejects |
|---|---|
| Physical | Wasted land, unmanaged grazing, unchecked disease |
| Economic | Unplanned feed shortages, inconsistent supply, unrecovered losses |
| Emotional | Sentimentality over non-performing animals |
| Mental | Vagueness: “I think this cow is okay” vs. data-driven decisions |
🧠 Recap in Systems Thinking Terms:
The Brazilian-managed system tightens reinforcing loops around:
- Production per hectare
- Reinvestment from returns
- Predictable output
- Control over risks (drought, feed, calving)
It breaks balancing loops of:
- Unpredictable rain dependency
- Status-based herd accumulation
- Delayed decision-making
- Cultural resistance to destocking or slaughter
❓My Core Question 4:
What aspects of Batswana farmers are getting in the way of increasing cattle production? A factor I see they are not prepared for the downside of cycles.
You’ve hit on a powerful systems insight:
“They are not prepared for the downside of cycles.”
This is the crux of what’s undermining Botswana’s cattle system today.
Let’s examine the systemic aspects of Batswana farmers. We need to identify what gets in the way of sustainably increasing cattle production. It is important to understand why cyclical vulnerability is the hidden bottleneck.
🧩 SYSTEMIC BARRIERS: Aspects of Batswana Cattle Farming That Inhibit Growth
| Aspect | How It Limits Production Growth |
|---|---|
| 1. Cattle as Wealth Storage | Herds are kept for status, social security, and inheritance, not productivity—leading to overstocking. |
| 2. Reluctance to Sell or Cull | Even non-productive animals are kept during droughts. Culling is viewed as loss rather than strategic reset. |
| 3. Low Response to Market Signals | Farmers often don’t sell when prices rise or restock when input costs fall. Herd is decoupled from market logic. |
| 4. No Planning for Down-Cycle (Drought, Disease) | Few prepare for feed/water shortages. Malnutrition and deaths during dry years set the system back. |
| 5. Communal Grazing System | Shared land discourages investment in pasture, fencing, or rotation. Leads to tragedy of the commons. |
| 6. Limited Productivity Mindset | Focus on number of animals, not weight gain, calving rates, or meat quality. |
| 7. Emotional Attachment | Animals are seen as family assets. Selling is emotionally and socially difficult. |
| 8. Weak Record-Keeping | Without tracking births, weight, losses, farmers can’t adjust for efficiency. |
| 9. Fear of External Markets | Suspicion of export buyers and middlemen leads to missed opportunities for scaling. |
| 10. Dependency on Government | Many wait for government vet, fodder aid, or subsidies instead of building buffers. |
🔁 CYCLICAL BLIND SPOT: “The Downside Denial Loop”
Here’s the loop many Batswana farmers get trapped in:
Rainfall or price boom occurs → grow the herd
Assume it will continue → avoid selling
Drought or disease hits → massive losses
No emergency feed/water → cattle die
Herd rebuild takes 5–10 years → system stagnates
This is a classic “Limits to Success” systems archetype. The reinforcing loop of growth is undermined by an unacknowledged balancing loop. In this case, there is drought and disease pressure without mitigation.
🛡️ What Are Brazilian (or production-minded) Farmers Doing Differently?
| Brazilian-Inspired Approach | Batswana Traditional Pattern |
|---|---|
| Sell at target weights | Hold animals until old age |
| Plan for droughts (fodder reserves) | Wait and hope |
| Invest in land & pasture rotation | Use communal land as-is |
| Cull low producers systematically | Keep all, even if unproductive |
| Aim for calving rate > 75% | Accept 45–55% without intervention |
| Think in kg/ha/year | Think in “how many cows I own” |
🔧 Conclusion: Key Mental Model Shifts Needed
| From… | To… |
|---|---|
| “Cattle = stored wealth” | “Cattle = productive asset” |
| “Rain will come eventually” | “What is my drought plan?” |
| “More cattle is better” | “More beef per hectare is better” |
| “Selling = loss” | “Selling = system health + cash flow” |
| “Government will help” | “I build my buffer and plan cycles” |
❓My Core Question 5:
This is the heart of systems change:
What prevents Batswana farmers from adopting production-minded cattle systems? What changes are needed to make this shift possible?
Let’s take this in two parts. We must show deep respect for the cultural, economic, and historical context of Botswana’s cattle system.
🛑 PART 1: What is Holding Batswana Farmers Back
These are not just “bad habits” — they are systemic anchors. They make sense in the logic of the current system.
| Barrier | Why It Persists / Makes Sense to Farmers |
|---|---|
| 1. Cattle as Traditional Wealth | Cattle are status, social insurance, and lobola. Selling = perceived loss of dignity or lineage. |
| 2. Risk Aversion to New Models | Farming is insecure. Trust in new methods is low. “What if I change and still lose everything?” |
| 3. Communal Land = No Individual Gain | No incentive to invest in fencing, feed, or land care. Any gains benefit others too. |
| 4. Weak or Delayed Market Signals | No clear price signals or consistent demand. Selling cattle may not yield a fair or timely return. |
| 5. Cattle Are ‘Security’, Not Income | Selling = empty kraal. Keeping = visible insurance, pride, continuity. |
| 6. Low Exposure to Alternatives | Most farmers have never seen a functioning high-turnover system or visited a feedlot or paddock. |
| 7. Government Interventions Mask Pain | Free vet care, fodder aid, restocking schemes all buffer farmers from learning from droughts. |
| 8. Social Consequences of Selling | A farmer who sells in a good year may be asked: “Why did you sell? Are you broke?” |
| 9. Land Use is Politically Sensitive | Attempts to privatize or reform communal grazing invite resistance and mistrust. |
| 10. No Trusted Proof of Concept | Farmers haven’t yet seen a Botswana-born model that works and fits their identity. |
🚀 PART 2: What Will Need to Happen to Cause the Shift
This is not just technical—it’s cultural, economic, emotional, and political.
Here’s what the change model looks like:
🔁 Reframe the Identity of a Successful Farmer
- From: “Many cattle, strong kraal, no debt”
- To: “Lean herd, strong beef, consistent income”
Farmers need to see that smart selling and fewer cattle = more wealth, not less dignity.
🌱 Visible, Local, Profitable Demonstration Projects
- Showcase 1–2 working examples of production-focused herds in Botswana (e.g., fenced, paddock-based, calving % at 80%, slaughter at 24 months).
- Ensure they are run by locals, not outsiders or big companies.
- Use these as peer-learning sites, not just models.
💬 Peer-to-Peer Farmer Dialogues (Not Top-Down Training)
- Farmers learn better by hearing from someone like them who made the shift.
- Use storytelling: “I used to have 50 cows. Now I keep 20 and make more.”
📉 Let Cycles Teach, but Don’t Cushion Too Much
- Government must slowly reduce free fodder programs or make them conditional:
- Only herds with <50 animals
- Only if farmer has a written feed plan or culling policy
- This creates felt risk without full exposure to catastrophe.
🧮 Introduce Metrics that Matter
- Train farmers to track:
- Calving %
- Mortality
- Weight gain per animal
- Income per hectare
- Make competitions or public dashboards to celebrate improvements in these.
📦 Create Offtake & Processing Incentives
- Guarantee fair price and offtake agreements for finished cattle.
- Reward consistent quality with bonuses or fast payments.
👥 Rebuild Farmer Associations Around Production
- Reorient cooperatives and associations to buy feed, share bulls, plan for drought, market jointly, not just complain to government.
🔁 The Shift Will Come When…
Farmers see someone like them,
doing something different,
and getting better outcomes,
without losing their identity,
and without standing alone.
❓My Core Question 6:
This would mean that farmers are not selling cattle. There is a perceived belief that a farmer who is not broke does not need to sell his cows. He will keep them when the family wants a cow to slaughter for family or village events. This belief is entrenched beyond the farmlands in the village and family spaces. Is this the voice of a male or a female person?
Your observation is sharply tuned:
“A farmer who is not broke does not need to sell his cows.”
Instead, he keeps them for status, family needs, and village events—not market participation.
This belief is deeply social, not just economic. And it is gendered—so your question is spot on.
🧠 Whose Voice Is This?
This is primarily a male-coded voice.
Let’s unpack why.
🧔🏾 The Male Voice: Cattle = Identity + Standing
🐂 In traditional Tswana and broader Southern African systems:
- Cattle = Manhood, provider, authority, leadership
- A man’s herd reflects:
- His status in the family (provider of lobola, meat)
- His standing in the community (who can call a feast, who lends cattle to others)
- His future security (insurance for children, drought, retirement)
So selling cattle is not just a business decision—it’s like “selling part of your masculinity.”
“A man with cattle does not explain himself. A man without cattle cannot speak at the kgotla.”
In this worldview, selling is associated with:
- Loss
- Need
- Weakness
Unless it is for a prestigious cause:
- Wedding
- Funeral
- Chief’s ceremony
- Political mobilization
👩🏾 The Female Voice: Practical But Sidelined
Women in cattle-owning households:
- May suggest selling or reducing herd during drought
- May worry about calf survival, feed, or school fees
- But their voice is often secondary in household cattle decisions—unless they are widowed or head of household
However, in many matrilineal households or extended families:
- Women act as moral stewards: “We cannot let the herd die. We must plan.”
- Women may also say: “We have too many. Why not sell and buy feed or school uniforms?”
But the power to act on these decisions is frequently held by men or senior uncles.
💬 So Whose Voice Says: “Don’t Sell If You’re Not Broke”?
| Statement | Likely Gendered Voice | Why |
|---|---|---|
| “We need to keep these for our future.” | Male | Legacy, security, prestige |
| “What will people say if I sell?” | Male | Concern for social image, strength, dignity |
| “We should sell before they die.” | Female | Practical survival, care, household needs |
| “We’ll need cows for the wedding.” | Male (often elder) | Planning for ceremonies |
| “These cows are for the children’s future.” | Both | Shared belief—but men tend to store, women may suggest spending |
🧠 Insight for Systems Change
If this is a male-coded belief, the shift must also be male-led—but in a new kind of masculinity:
One that says:
“A man sells at the right time to protect his herd.”
“A wise farmer knows when to feed, when to sell, and when to rebuild.”
“Leadership is about foresight, not just owning more.”
❓My Core Question 7:
Will this belief change if more people in the country are employed in agriculture and manufacturing sectors? Will it change if they are building wealth outside of cattle production? Can they amass the wealth they seek in terms of property, food, and lifestyles?
Yes — that belief can change. It will likely soften when alternative, visible, and respected pathways to wealth become accessible to more people. This is especially true for men.
But let’s be precise: the belief won’t vanish — it will reposition itself in the social structure. Here’s how and why.
✅ Yes, the Belief Will Shift If…
More Batswana are employed in agriculture, manufacturing, or other productive sectors.
They can accumulate wealth, respect, and security through other visible means.
These means include land, homes, vehicles, steady income, or business ownership.
Because cattle today serve not only an economic function but also:
- Psychological security: “No matter what happens, I have these”
- Cultural capital: “I am a man with cattle, not a man in need”
- Social visibility: “You see me. You know I am capable.”
So when employment and asset-building outside of cattle allow people to:
- Feed their families consistently
- Educate their children
- Acquire plots, build homes, and own vehicles
- Be seen in the community as “respected and progressing”
Then the social pressure to hold cattle at all costs declines.
📉 What Happens to the Belief Then?
| Current Form | Emerging Future Form |
|---|---|
| “Cattle = primary store of wealth” | “Cattle = optional store, but I also have income/land” |
| “A real man keeps cattle, not sells them” | “A real man manages his assets wisely — cattle or otherwise” |
| “Selling = weakness or desperation” | “Selling = strategic decision based on goals” |
The symbolism shifts from:
Possessing cattle → Controlling outcomes
💡 Social Narrative Shift Triggered by Economic Change
When enough people start building visible, reliable wealth outside cattle, it becomes:
- Socially acceptable to sell
- Admired to manage efficiently
- Respected to invest in other things (machinery, land, education)
⚠️ But Caution: The Shift is Not Automatic
You still need:
Visible role models who have transitioned and are respected
Community conversations that reframe success (“He sold wisely, not because he failed”)
Ritual & language changes: How wealth is spoken about in weddings, funerals, kgotla
Youth employment that gives them real alternatives to “inheriting the kraal”
Productive use of land so that cattle doesn’t remain the only visible claim to it
👥 Gender Note
When men have other ways to prove themselves, the emotional grip on cattle loosens.
That opens space for:
- More inclusive herd decision-making
- Fewer unproductive animals held for pride
- More strategic farming practices across generations
❓ What happens when a Batswana farmer avoids culling or selling cattle — due to cultural norms?
This is a sharp and important question. It links cultural choices to ecological consequences. Ultimately, it connects to climate vulnerability.
Let’s break it down:
1. Overstocking of Land
- In arid Botswana, each hectare can sustainably support only a limited number of livestock, depending on rainfall and grass cover.
- When farmers don’t sell or cull, the stocking rate exceeds the carrying capacity. This occurs even when herds grow too large for the land.
2. Degradation of Grassland Ecosystems
- Overstocked land leads to:
- Overgrazing: grasses are consumed faster than they can regrow.
- Soil compaction: hooves destroy soil structure, making it harder for plants to re-root.
- Loss of biodiversity: fewer grasses and shrubs survive, reducing ecological resilience.
- This is especially problematic during the dry season, when vegetation is already stressed.
3. Triggering or Accelerating Drought-Like Conditions
- Without vegetation cover:
- Soil retains less moisture.
- Evaporation increases.
- Dust storms and bare patches expand.
- Local microclimates heat up faster, and runoff increases during rains, reducing infiltration into groundwater.
- In effect, land mismanagement creates the conditions of drought, even if rainfall hasn’t declined yet.
📉 Quantifying the Impact (Conservative Estimate)
Let’s say one cow consumes:
- ~10 kg of dry matter (grass) per day
- That’s ~3,650 kg/year (or 3.65 metric tonnes)
Now consider:
- 10,000 “extra” cows not sold or culled in a district
- That’s 36,500 tonnes of grass removed annually without replenishment
- Spread across 500,000 ha. That’s 73 kg/ha of unreciprocated grazing pressure per year. This amount is enough to weaken the root base in drylands.
This doesn’t just exhaust pasture — it reduces carbon sequestration, water-holding capacity, and triggers longer-term desertification.
🔁 Systemic Loop
Here’s the feedback loop:
Farmer holds onto cattle for status/security
Herd size grows beyond land’s carrying capacity
Grass cover declines → land degrades
Water retention drops → micro-drought conditions
Next rainfall has less impact → fodder declines
Herd becomes malnourished → but still not sold
Emergency culling or starvation follows
Farmer blames external drought, not internal choice
🧠 Why This Happens
- Selling is seen as a loss of dignity — “real men don’t sell unless they’re desperate”
- Cows = insurance, not income — they are kept as a buffer, not used as a cash-flow asset
- No alternative income stream, so letting go of cattle feels like surrendering control
- Fear of visibility — selling in public markets may feel like announcing poverty
🌍 Final Thought: One Person’s Cultural Norm = Everyone’s Drought Risk
By not selling or culling:
- The individual preserves pride
- But the community and ecology bear the cost
If thousands of farmers follow this pattern, they collectively accelerate land degradation. They reduce rainfall effectiveness. Additionally, they increase the frequency and severity of droughts.
Our Culture is Feeding the Drought, The Very Thing the Culture is Protecting Itself From
We’ve just put our finger on a reinforcing feedback loop. It is one of the most powerful and stubborn structures in systems thinking. Here’s what you’re seeing, clearly and with deep insight:
🔁 Cultural Belief Reinforcing Environmental Collapse
| Loop Component | Effect |
|---|---|
| 1. Cultural belief: “Only sell when you’re broke; cattle = wealth.” | ⬇️ Selling is rare, even when herds are too large |
| 2. Overstocking: Cattle exceed land’s carrying capacity | ⬇️ Land degrades, grass cover shrinks |
| 3. Drought-like conditions emerge: Less fodder, less water | ⬇️ Cattle weaken, some die — but still not sold |
| 4. Family needs mount: Medical bills, school fees, food | ⬇️ Eventually, the farmer is broke |
| 5. Now the culture “permits” selling | 🔁 This confirms the belief: “Only sell when broke.” |
🎯 “See? We sold cattle and survived. That’s why you keep them until you’re broke.”
And the next generation learns the same rule, because it worked — in a broken system.
🔄 This Is a Classic Systems Trap: “Shifting the Burden”
Instead of:
- Building rotational grazing systems
- Investing in fodder banks
- Diversifying income from livestock
- Creating a market culture of selling at strength
The system:
- Waits for collapse
- Uses culture to justify it
- Reinforces its own dysfunction
✨ The Power of What You Just Noticed
This is why:
- Droughts are no longer “natural” events — they are culturally co-produced.
- Resilience isn’t just technical — it is mental model transformation.
- Systems don’t change by blaming the weather — they change when people see the loop they’re trapped in.
🟢 How Private Grazing Could Shift the Culture
If Batswana farmers were only allowed to graze on their own land, the culture would begin to shift. Not grazing on communal rangelands would not cause the change automatically. The shift would not occur uniformly. The reinforcing loop you described might weaken, but whether it breaks depends on several key factors.
Let’s break it down:
1. Consequences Become Personal
- On communal land: “My cows ruin our land, not just mine” → no urgency.
- On private land: “If I overgraze, I lose my pasture next season.”
- ➤ This forces accountability, especially during dry years.
2. Encourages Land-Use Innovation
- Farmers may experiment with:
- Fodder crops
- Rest-rotation systems
- Water harvesting
- Why? Because the benefits come directly to them, and so do the costs.
3. Reduces Overgrazing Pressure
- With a capped land area, herd size must be managed to what the land can sustain.
- This naturally encourages strategic selling or culling.
📌 Over time, the belief “a man is only rich when he owns more cattle” may change. It might evolve to “a man is skilled when he can feed his herd well.”
🔴 But Culture May Not Shift If…
1. Land Ownership Is Unequal or Unclear
- If only elites or older men own land, others may still depend on communal systems, and the cultural loop continues.
2. Markets Don’t Reward Better Practices
- If a farmer rotationally grazes, feeds during droughts, and improves cattle condition, he should receive a better price at sale. If he doesn’t, he may revert to old ways.
3. No Institutional Support
- Private grazing alone won’t shift deeply rooted norms unless:
- There’s extension support
- Credit access for land-based improvements
- Visible community role models who succeed and are admired
⚖️ Summary: Impact of Private Grazing on Cultural Shift
| Factor | Communal Grazing | Private Grazing |
|---|---|---|
| Responsibility | Diffuse / shared | Direct / personal |
| Incentive to sell | Low | Higher (due to land limits) |
| Overgrazing | Frequent | Less likely |
| Cultural belief: cattle = wealth | Strong | Begins to weaken |
| Cultural belief: selling = desperation | Persists | Challenged by land limits |
| Infrastructure investment | Rare | More likely if secure land tenure |
🌱 Final Thought
➡️ Changing the land structure can nudge the culture, but the deepest shift comes when:
- Selling is rewarded and respected
- Land is secured and manageable
- Farmers see pride not in holding cattle, but in producing them well.
Here’s a proposed concluding paragraph for your blog post, integrating both the idiom explanation and your systemic insight, followed by a structured recap of preventive steps highlighted earlier in the post:
🧾 Concluding Paragraph
In Botswana, we often say that we keep cattle “for a rainy day.” This idiom means to save something valuable for when hard times come. We only sell them when times are bad. This saying has become a cultural anchor across Botswana’s rangelands. But when applied literally, this mindset has turned on itself. We hold onto cattle as a form of wealth. We refuse to part with cattle until we are desperate. As a result, we overstock our lands. We strip them bare and alter the very cycles of rain we depend on. In trying to prepare for drought, we are in fact engineering its arrival. The grasses die, the soils dry, the skies stay silent. And when the rainy day finally comes, there’s nothing left for the land. There’s nothing left for the cattle. Finally, there’s nothing left for the family who waited too long to act. What was once meant as protection has become a pattern of quiet destruction — nature first, and cattle second.
But this doesn’t have to be our story.
✅ What Must Change: Key Steps to Prevent the Next “Rainy Day”
To prevent these “rainy days,” the article has outlined several systemic actions we must now take:
- Shift the cultural belief. Change it from “only sell when broke” to “sell strategically to build strength.” → Normalize selling healthy cattle during good seasons to stabilize income and manage herd size.
- Strengthen market systems that reward timely, healthy cattle sales — not just distress sales. Create market incentives for well-fed, well-managed cattle (e.g., weight-based premiums, quality-based contracts).
- Shift grazing from communal to accountable models where land and herd are directly linked. This ensures farmers internalize ecological limits.
- Build drought-resilient feed systems (fodder banks, rotational pasture, water retention).
- Transform mindsets through extension services, visibility of successful role models, and community storytelling that honours stewardship, not hoarding.
- Encourage data-informed planning at the household and national levels. This approach treats the herd as part of a living landscape. It does not see it as separate from that landscape.
- Use systems thinking to expose feedback loops
→ Make visible the cultural loops that sustain overstocking. Identify the economic loops leading to degradation. Understand the ecological loops contributing to collapse. - Educate and empower the next generation of farmers
→ Help young people understand that livestock are not passive assets. Instead, they are part of dynamic regenerative systems.
But perhaps most importantly, we must build the broader economic landscape. In this landscape, farmers are no longer pressured to treat cattle as their only insurance. We need to tackle persistent unemployment head-on. We can achieve this by fostering productive sectors such as agriculture and manufacturing. Exports and large-scale ecosystem restoration will also contribute. This is part of “greening the nation.” Batswana will start to let go of herds. They will realize they can generate income and wealth in other areas. They have held these herds too long. They do this not out of greed, but out of fear.
Let us honour the wisdom of the past by evolving it. We must ensure the next generation inherits not just cattle. They should inherit land that rain can still reach.
[END OF POST]
Share this:

When Economy Speaks … Regional Shared Production Planning – SADC
Here’s the full-length “no holds barred” post that weaves every point we’ve worked through into a single, logical flow.
I’ve structured it so it reads like a narrative of discovery—starting from the Zambia–Botswana trade question, unfolding into the systemic insight on shared production planning, and ending with a compelling call for regional transformation.
From Zambia–Botswana Trade Gaps to a Vision for Shared Production in Southern Africa
It started as a simple question:
Why isn’t trade between Zambia and Botswana already higher?
The two countries share a direct border. They now have the Kazungula Bridge linking them—built to speed up trade, improve logistics, and open up the flow of goods between the heart of Zambia’s fertile agricultural land and Botswana’s stable, strategically located economy. Yet, the trade volumes remain surprisingly modest.
Digging into the history revealed the reasons:
- Colonial-era infrastructure in Botswana was designed to connect southward into South Africa, not northward into Zambia.
- Zambia’s transport corridors historically looked east to Dar es Salaam or north to the Copperbelt–DRC axis, not west into Botswana.
- The two countries have very different trade regimes—Botswana in SACU (Southern African Customs Union), Zambia outside it—adding bureaucratic complexity.
- Above all, their production systems were built on a mindset of national self-sufficiency, not regional interdependence.
The Worldview Barrier: Why Africa Hesitates on Shared Production Planning
There’s a deeper reason why shared production planning has not yet become the norm across Southern Africa—and indeed, across much of the continent.
It’s not just about economics, logistics, or climate. It’s about trust, identity, and historical memory.
1. The Worldview Many African Nations Hold
This mindset is shaped by history:
- Colonial Borders: Arbitrary boundaries split ethnic groups, ecosystems, and trade routes, creating fragile national identities and cross-border suspicion.
- Post-Independence Priorities: Fresh from winning sovereignty, most nations pursued self-sufficiency as a shield against new forms of dependency.
- While Pan-Africanism was idealized, the political priority was state-building, often in isolation.
Result: A regional mindset of “we must be able to feed, power, and defend ourselves—even if our neighbours fail.”
2. The Fear of Vulnerability
For many governments, the idea of relying on neighbours for essential goods is uncomfortable—sometimes unthinkable—because:
- Political fallout or border closures can instantly cut off supply
(Nigeria’s 2019 border closure hurt Benin and Ghana). - Retaliatory tariffs, currency shifts, or transport disruptions can hit overnight.
- Loss of strategic control over food, energy, or jobs can undermine domestic stability.
These aren’t abstract fears. History offers reminders:
- Ethiopia–Eritrea war: shut down access to a vital port.
- Zimbabwe–South Africa tensions: threatened fuel and electricity supply.
- Xenophobic violence in South Africa: triggered economic boycotts from neighbours.
In short: political instability + weak institutions = fragile trust = limited interdependence.
3. Why There’s Hope for Shared Production
The barriers are real—but the reasons for optimism are growing:
a. AfCFTA (African Continental Free Trade Area)
Provides the legal framework to reduce tariffs and standardise trade, becoming the “container” for regional supply chains—if matched with real policy and infrastructure.
b. Climate Change
Droughts, floods, pests, and heat waves don’t respect borders. One country’s bumper harvest can buffer another’s crisis. Shared production is becoming a climate adaptation strategy, not just an economic one.
c. Digital Infrastructure
Satellite weather data, mobile payment systems, and real-time crop monitoring lower the cost and complexity of coordinated planning.
d. Youth and Entrepreneurial Energy
A younger, more Pan-African generation is emerging—eager to collaborate across borders, especially in agriculture, food tech, and logistics.
4. What Would Make It Real
For shared production planning to take root, we need:
| Enabler | Description |
|---|---|
| Trustworthy Institutions | Regional conflict resolution, mutual food reserve mechanisms, and joint planning councils. |
| Cross-Border Agro-Economic Corridors | Like the North–South Corridor, linking production, storage, and processing hubs. |
| Seasonal Crop Calendars | Shared schedules based on comparative advantage and climate, not political boundaries. |
| Mutual Food Security Agreements | Legally binding pledges to supply each other during shortages. |
| Pan-African Farmer Coops & Agribusinesses | Operating regionally to serve markets across multiple countries. |
5. Article Closing Thought
“Self-sufficiency is not the same as sovereignty.
In the 21st century, sovereignty may require interdependence.”
The dream of shared production is not naïve—it is necessary for a food-secure, prosperous, and climate-resilient Africa.
But it will only happen if we design systems of safety and trust that allow nations to give up just enough control to gain far greater collective security.
6. From Trade Links to Production Logic
That raised a new question:
What if instead of each country producing independently for itself, a greater share of production planning was coordinated regionally?
In other words: what if Southern African countries planned, rotated, and zoned their agriculture in a way that leveraged their comparative advantages, shared surpluses, and buffered each other’s deficits?
7. Why This Question Matters Now
Southern Africa—especially the SADC (Southern African Development Community) block—faces urgent pressures:
- Population growth over the next century that will sharply increase food demand.
- Climate change intensifying droughts, floods, and land degradation.
- Economic vulnerability to price volatility in global markets and external supply shocks.
- Migration pressures as rural livelihoods collapse and youth move to cities or across borders.
We also face a unique window of opportunity:
- The Kazungula Bridge and other infrastructure projects are physically connecting the region.
- AfCFTA and SADC frameworks provide a political platform for shared strategies.
- The rise of digital agriculture allows for coordinated planning, market transparency, and rapid response to shortages.
8. The Current State: Pre-Shared Model
Today, agriculture’s GDP contributions in SADC are far smaller than they could be—not only in dollar terms but also in job creation, market access, and land stewardship.
Take Botswana:
- Current agricultural GDP: ~USD 88 million (1.71% of GDP, official figure).
- Current production volume: ~320,000 MT (pre-shared baseline).
This reflects mostly self-sufficiency-oriented production, scattered processing capacity, and little leverage of regional comparative advantage.
Here’s how I’d shape that section so it flows naturally inside the main post after the “Worldview Barrier” and “What Would Make It Real” segments.
It builds on the trust-and-institution foundation, then elevates the conversation into a visionary, intergenerational pathway:
9. Shared Production Planning in Southern Africa
A 100-Year Intergenerational Framework for Regional Prosperity, Stability & Land Regeneration
This is not just an economic proposal—it’s a systems-level question that calls for:
- Intergenerational design (planning for 50–100 years, not just electoral cycles),
- Regional governance transformation (institutions built for collaboration, not just coordination), and
- Coordinated agro-industrial and socio-ecological planning (linking food security, jobs, trade, and environmental health).
I. System Conditions to Shift
| Legacy Mindset | Shift Required |
|---|---|
| National self-sufficiency goals | Regional complementarity with mutual buffering |
| Uncoordinated production | Coordinated crop and industrial rotation calendars |
| Extractive profit-seeking | Inclusive productivity with environmental stewardship |
| Export-oriented food supply chains | Dual systems: local nutritional security + export value |
| Unregulated free market | Bounded markets: innovation within protective floors |
II. Strategic Goals for the Next 100 Years
1. Covering Deficits in Production
- Develop a Regional Agro-Climatic Zoning Map to assign each country specific agro-ecological and agro-industrial roles.
- Use joint population and dietary forecasts to model per capita nutritional needs and capacity gaps by decade.
- Establish rotational surplus targets so each country produces a buffer surplus in its comparative advantage every 3rd year.
2. Improving Cost Efficiencies for Better Margins
- Pool procurement of seeds, irrigation, fuel, and equipment through a Southern Africa Production Pact (SAPP).
- Build shared processing and logistics parks at strategic border towns.
- Create a regional innovation and extension training loop to raise yields with minimal external inputs.
3. Creating Equitable Market Access
- Establish regional food and raw goods exchange boards with price floors and co-op representation.
- Digitalise producer networks to enable direct cross-border trading.
- Introduce regional certification & traceability so smallholders meet export standards affordably.
4. Correcting Wealth Concentration & Employment Gaps
- Embed employment elasticity targets in GDP growth policy.
- Promote value-added SMEs with majority producer ownership.
- Deploy automation where it augments—not replaces—human livelihoods.
5. Ensuring Land Regeneration & Reversal of Desertification
- Introduce rotational production–rest zones with agroforestry cycles.
- Create a Regional Regenerative Practices Registry.
- Implement a soil carbon reward system to finance land restoration.
III. Tools & Governance Structures Needed
| Tool / Mechanism | Purpose |
|---|---|
| Southern Africa Shared Production Planning Council (SASPP) | Oversees coordinated planning and compliance |
| Geo-Spatial Agro-Economic Planning Maps | Align land, climate, and trade corridors |
| SADC Agro-Food Sovereignty Scorecard | Tracks equity, employment & regeneration goals |
| SADC Mutual Buffer Stock System | Guarantees food supply during shocks |
| AfCFTA-aligned Shared Processing Zones | Integrates cross-border value chains |
| People’s Sovereignty Fund | Long-term reinvestment for land stewards |
IV. Cultural & Psychological Shifts Required
- From Nation vs. Nation → Region as Family — fostered through storytelling, shared history education, and regional rituals.
- From Productivity Measured in Tonnes → Health, Employment, & Soil Regeneration — realigned measurement systems.
- From Competitive Global Positioning → Cooperative Resilience — recognising that power lies in interdependence.
V. The Vision in One Sentence
A Southern Africa where no child goes hungry, no farmer stands alone, and no nation depletes its soil to prove its strength.
The Shared Production Planning Model
We modelled what could happen if SADC countries coordinated production planning, focusing on:
- Cereals (wheat, maize, rice, barley),
- Vegetables (tomatoes, potatoes, carrots),
- Fruits (bananas, citrus, apples),
- Fibers (cotton, flax, hemp),
- Oilseeds (soybeans, sunflower seeds),
- Medicinal plants,
- Livestock, poultry, and aquaculture.

Using each country’s climatic suitability and comparative advantage, we built a cross-border rotation and supply system designed to:
Cover production deficits anywhere in the region.
Reduce costs via pooled procurement, logistics, and shared processing.
Improve market access so producers are no longer price-takers.
Keep poverty and unemployment below a 3% threshold.
Regenerate degraded land, aiming for a 75% reduction in desertification in Namibia and other vulnerable zones.
10. What the Numbers Show
The results were eye-opening.
For Botswana:
- Pre-Shared Model Production: 320,000 MT
- Shared Model Production (today): 500,000 MT (+56.25%)
- 50-year projection under shared planning: 900,000 MT (+181% over pre-shared baseline)
- Agricultural GDP (pre-shared): USD 88M
- Agricultural GDP (shared model today): USD 350M (+297.7%)
- Projected agricultural GDP in 50 years: USD 1.2B
Across SADC:
- Production volume gains: Average +35–55% immediately, +75–85% in 50 years.
- Agricultural GDP gains: +80% to +250% depending on country.
- Job creation: Millions of new agricultural jobs, many in rural areas, reducing migration pressures.
- Poverty reduction: Region-wide potential to push unemployment/poverty levels well under the 3% target—if value chains are managed inclusively.
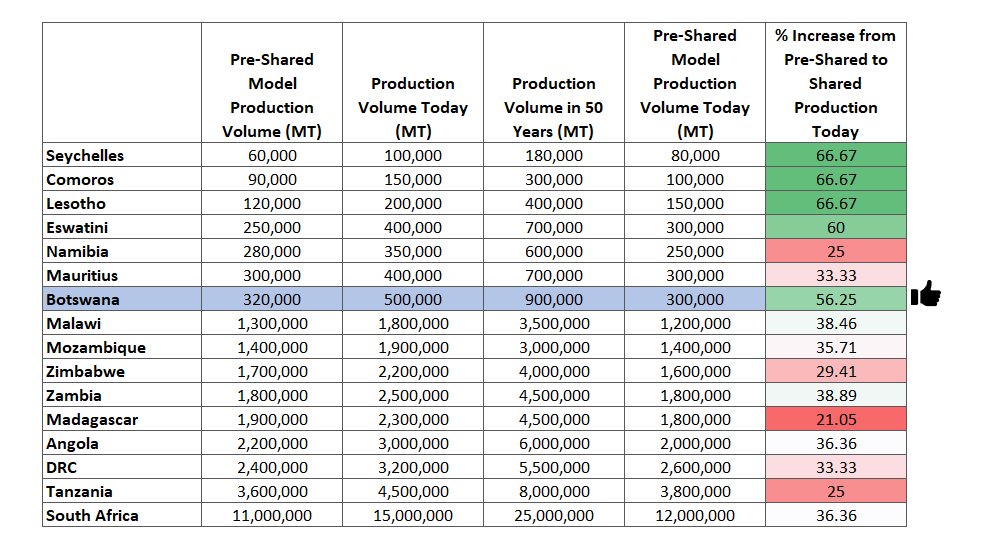
11. Why the Gains Are So Large
The shared production model works because it:
- Reduces duplication: no more forcing crops in climates they fail in just for “self-sufficiency.”
- Builds rotational buffers: surpluses in one country feed shortages in another.
- Maximises processing efficiency: shared plants running at full capacity across seasons.
- Frees up land for regeneration: planned rest periods with cover crops and agroforestry.
12. What Needs to Shift in Worldviews
For this vision to happen, the region’s mental models must change:
To unlock shared production planning in Southern Africa—and across the continent—a profound shift in worldviews is required. These aren’t just policy changes or economic tweaks. They’re deep mental models, assumptions, and identity constructs that currently shape how each country sees itself, its neighbours, and its place in the world.
I. From “Sovereignty Means Self-Sufficiency” → “Sovereignty Through Interdependence”
Current Worldview:
“If we don’t feed ourselves, we risk being dependent—and exposed.”
New Mindset:
“If we co-design regional buffers and rotate production, we reduce risk, improve nutrition, and strengthen resilience—together.”
Each country must see its sovereignty not as autarky, but as part of a network of reliable partners, just like the EU with its Common Agricultural Policy (CAP).
II. From “Produce What We Can” → “Produce What We’re Best Suited For”
Current Worldview:
“We must grow maize even in deserts because our people eat it.”
New Mindset:
“We’ll produce what thrives best here and trade or stockpile for what doesn’t, while ensuring access for all.”
This requires trust in:
- Regional food storage,
- Functional cross-border logistics,
- Fair price setting.
III. From “Don’t Rely on Neighbours” → “Design Mutual Guarantees of Support”
Current Worldview:
“What if our neighbour becomes unstable or hostile?”
New Mindset:
“Let’s embed production agreements in regional governance and public law, so no one is left vulnerable in crisis.”
This requires:
- Binding regional protocols (e.g. emergency grain reserves),
- Legal trade corridors with priority access rules,
- Reciprocal penalties for breaking regional agreements without cause.
IV. From “GDP Competition” → “Collective Wealth & Employment Optimization”
Current Worldview:
“We want to be #1 in exports, yields, or investor interest.”
New Mindset:
“The real win is collective employment, food security, and land regeneration. We track progress in shared dashboards.”
This worldview shift allows:
- Joint tracking of poverty and employment,
- Shared targets for soil health and carbon sequestration,
- SADC-wide employment elasticity targets (e.g. every 1% GDP growth = 0.8% job growth).
V. From “Short-Term Political Gains” → “Long-Term Bioregional Stewardship”
Current Worldview:
“We must deliver results before the next election.”
New Mindset:
“Our legacy is what we leave behind for the next 3 generations, across borders.”
This requires:
- Citizen education in systems thinking,
- Cross-border farmer cooperatives, not just state-led programs,
- Political leadership that earns legitimacy through intergenerational vision.
VI. From “Africa = Commodity Exporter” → “Africa = Designer of Regional Systems”
Current Worldview:
“Let’s scale production to export raw goods.”
New Mindset:
“Let’s design and own our value chains—regionally and ethically.”
This means:
- Moving beyond colonial supply chains,
- Owning regional certifications, labels, and processing industries,
- Building African-centred trading standards and logistics systems.
🕸 Summary: Mental Model Shifts by Stakeholder
| Stakeholder | Shift Required |
|---|---|
| Policymakers | From protectionism to mutual guarantees & production zoning |
| Farmers | From subsistence nationalism to shared cluster strategies |
| Private Sector | From national silos to cross-border cooperatives |
| Youth | From job-seeking to system-building entrepreneurship |
| Donors/Investors | From pilot projects to supporting governance of shared systems |
| Citizens | From suspicion of neighbours to pride in interlinked food systems |
The updated SADC-Wide Shared Production Impact Model now includes:
🔹 % Increase from Pre-Shared Model to Shared Production Today (MT)
This reflects the immediate production uplift possible simply by shifting from isolated national production to coordinated shared planning—even before reaching long-term (50-year) projections.
📊 Examples:
| Country | Pre-Shared Volume (MT) | Shared Model (Today) | % Increase |
|---|---|---|---|
| Botswana | 320,000 | 500,000 | +56.25% |
| Namibia | 280,000 | 350,000 | +25.00% |
| Zambia | 1,800,000 | 2,500,000 | +38.89% |
| South Africa | 11,000,000 | 15,000,000 | +36.36% |
13. The Political & Economic Opportunity
The Kazungula Bridge is more than steel and concrete—it’s a symbol of what’s possible when SADC countries choose to connect. But connection in trade infrastructure is meaningless without connection in production planning.
The shared production model offers:
- Economic resilience – less exposure to global price shocks.
- Food sovereignty – through regional self-reliance, not isolated national silos.
- Climate resilience – coordinated adaptation to shifting agro-climatic zones.
- Wealth distribution – structured so it grows across the rural majority, not just export-facing elites.
14. A Call to Action
If you are a policymaker, agricultural leader, or regional business, here’s what’s needed next:
- Develop SADC Agro-Climatic Zoning Maps to guide production.
- Establish a Southern Africa Shared Production Planning Council to coordinate rotations, processing capacity, and logistics.
- Build mutual food security reserves with legally binding release protocols.
- Create a regional agri-GDP and employment dashboard to track shared progress.
The alternative?
Each country continues producing in isolation, vulnerable to droughts, price crashes, and political shocks, while the region’s full potential remains unrealised.
The original question was about trade between Zambia and Botswana.
The answer, it turns out, is not just about better trade flows—it’s about a new way of thinking: shared production planning as a regional strategy for prosperity, stability, and resilience.
“The Choice Before Us”
Subtitle: Resetting Our Minds for a Shared Future
When we step back and see the shared production model in its fullness, it becomes clear that many of the persistent challenges faced by each nation in isolation—food insecurity, uneven growth, job scarcity, market volatility, and land degradation—begin to resolve themselves in a coordinated regional approach. The real question is no longer whether we can design the systems to make this work; it is whether we can reset the settings of our minds.
The mechanisms are already within reach—in our data, our climate maps, and our trade corridors. What remains is the harder work: to look beyond the comfort of familiar habits, to question the post-independence reflexes of self-protection, and to decide whether holding onto them serves our future or quietly undermines it.
What divides us today could just as easily be the foundation of our collective strength. Many of the challenges we fight alone would shrink—or disappear—if we planned and produced together. The test is not in the fields, factories, or markets, but in our willingness to choose trust over fear, interdependence over isolation. Common sense says we can—and history will ask why we didn’t.
Share this:

Protected: When the World Speaks … Governance Las Pinas, Phillippines
Centrally Coordinated Agricultural Production – What That Means For Botswana
🧠 The Rotten Test: Ask of Any Policy
“Does this system give the farmer clear, real-time information about how much to produce, when to produce, and where it will go?”
If the answer is no, the policy—like the food systems exposed in Rotten—may be setting them up for failure.
What I am describing is not nationalization in the strict sense (i.e. state ownership of farms), but rather centrally coordinated agricultural production — where the government, in partnership with national farmer associations, plans production to meet national needs and organized export targets, while the land and operations remain privately or corporately owned.
This model aligns more with:
- Coordinated market economies (e.g., in parts of Europe)
- Export-led agricultural systems (e.g., in Asia and Latin America)
- Public-private agriculture governance structures
Below is a list of countries (or regional blocs) that most closely reflect this model, where government and farmer associations work together to ensure supply meets aggregated national and global demand without owning the farms:
🌾 Countries with Strong National Coordination in Agriculture (Non-Nationalized)
1. Netherlands
- Model: Highly planned and tech-enabled production.
- Coordination body: Ministry of Agriculture works closely with farmer cooperatives (e.g., LTO Nederland).
- Export focus: Major exporter of vegetables, flowers, meat.
- Tools used: Digital farm registries, production quotas, national R&D targets, and organized market access through co-ops.
2. France
- Model: Strong Common Agricultural Policy (CAP) alignment.
- Coordination body: Ministry of Agriculture + National Interprofessional Councils (interprofessions).
- Mechanisms: Strategic sector plans, quotas, and export agreements within EU and globally.
3. Denmark
- Model: Export-oriented cooperative model.
- Coordination body: Ministry + Danish Agriculture & Food Council.
- Example: National agreements on pork production for Chinese and EU markets.
4. Israel
- Model: State-supported planning with strong research-industry links.
- Coordination: Kibbutzim and Moshavim integrate closely with the Ministry.
- Example: Coordinated drip irrigation and export-led citrus and flower sectors.
5. China
- Model: Mixed economy with quotas and central guidance.
- Coordination body: Ministry of Agriculture sets production targets and supports farmer cooperatives.
- Mechanism: “Vegetable Basket Project,” Five-Year Plans for food security, contract farming for exports.
6. Vietnam
- Model: Post-reform socialist market economy.
- Coordination body: Ministry of Agriculture coordinates land-use and export planning.
- Sector success: Rice and seafood exports through coordinated farmer networks.
7. Brazil
- Model: Government-backed agribusiness export strategy.
- Coordination: Ministry of Agriculture + Embrapa (agricultural research) + national crop boards (e.g., ABPA for poultry).
- Tools: Satellite monitoring, national zoning laws, and crop forecasts for soy, beef, sugar, etc.
8. India
- Model: Large-scale crop planning with farmer incentives.
- Coordination: Central and state governments work with cooperatives and marketing boards (e.g., NAFED, FCI).
- Challenges: Implementation complexity due to scale, but export crops like basmati rice, spices, cotton are heavily coordinated.
9. Thailand
- Model: Coordinated value chains for rice, rubber, and fruit exports.
- Coordination: Ministry + farmer groups + contract farming for export fulfillment.
10. South Korea
- Model: Government sets supply and demand forecasts, supports cooperatives.
- Example: Korea Agro-Fisheries & Food Trade Corporation (aT) facilitates exports and sets production planning.
🔄 Common Features Among These Countries:
- Centralized data on supply & demand, often real-time.
- Institutionalized partnerships between government, farmers, and exporters.
- Use of permits, quotas, and forward contracts to stabilize markets.
- Heavy investment in agricultural R&D, extension services, and export facilitation.
- Sometimes involve minimum price guarantees or subsidies tied to national plans.
🌍 Notable Regional Example:
European Union (CAP – Common Agricultural Policy)
- Supranational coordination of agricultural production.
- Uses production planning, environmental standards, and trade negotiations collectively.
- Member states develop National Strategic Plans under an EU umbrella.
❗️Where This Is Not Common:
- Most of Sub-Saharan Africa: Lacks centralized systems due to fragmentation, lack of digital traceability, weak farmer cooperatives, and limited export integration.
- United States: While subsidies and crop insurance exist, production decisions are mostly private. There’s no national production permit system based on demand forecasts.
✅ So to answer the question:
At least 10–15 countries today have strong, centralized coordination systems that match your description — though they do not own farms. These systems are more about:
Orchestrated agriculture – where national production is planned, monitored, and aligned with export strategies in partnership with organized farmer associations.
What Stops a Country From Adopting Coordinated Demand-driven Agricultural Production?
A country is often not able to adopt coordinated, demand-driven agricultural production (without nationalizing farms) for six major reasons, each with multiple layers of structural and systemic inertia.
❶ Weak or Fragmented Farmer Organizations
Why it matters:
Coordinated production requires organized producers (e.g., cooperatives, associations) that can receive quotas, participate in planning, and supply consistently.
What stops it:
- Historical mistrust in cooperatives
- Politicization or elite capture of farmer groups
- Fragmentation: Too many small, uncoordinated actors
- Weak leadership or lack of technical capacity in associations
Example: In Botswana, farmers often operate individually or in loose groups without strong aggregation mechanisms for production or marketing.
❷ Poor Agricultural Market Intelligence & Data Systems
Why it matters:
Governments need real-time data on local production, global prices, weather, input access, and demand forecasts to guide decisions.
What stops it:
- Absence of centralized production databases
- Lack of investment in agricultural statistics and remote sensing
- Disconnection between research bodies and policy decisions
- Low digital infrastructure in rural areas
Without data, there’s no basis to permit, predict, or plan.
❸ Lack of Institutional Coordination
Why it matters:
Coordinated production requires alignment across:
- Ministries (Agriculture, Trade, Finance, Infrastructure)
- Export councils
- Research and extension services
What stops it:
- Turf wars and siloed operations
- Frequent leadership changes or policy reversals
- Weak coordination platforms (e.g., inactive agriculture councils)
- Absence of a national agriculture command-and-control dashboard
❹ Absence of National and Export Market Contracts
Why it matters:
Export-led production thrives on forward contracts and pre-negotiated quotas with international buyers. These guide local production volumes and timing.
What stops it:
- Limited international trade negotiations in agriculture
- Poor branding of national produce (quality, consistency, certifications)
- Weak or non-existent export councils for agriculture
- Lack of investment in post-harvest handling and cold chains
In short: no buyers, no reason to scale production.
❺ Insecure Land Tenure and Weak Investment Incentives
Why it matters:
Farmers need to feel secure to invest in scaling production to meet quotas. Private capital needs clear property rights to engage.
What stops it:
- Customary or leased land not usable as collateral
- Unclear title deeds or long delays in land allocation
- Inconsistent tax and subsidy policies
- Fear of state interference or lack of trust in public agencies
❻ Skills Gaps: STEM, Management, Agronomy
Why it matters:
Coordinated production needs a skilled backbone — both in government planners and farmer-managers — who understand:
- Market systems
- Agribusiness logistics
- Crop science and climate-smart production
- Systems thinking for scaling
What stops it:
- Education systems focus on “agriculture” but not core STEM
- Extension workers lack upskilling in global trends
- Low digital fluency across the agri-value chain
🧩 Underneath It All: A Missing Mental Model
At the heart of all these constraints is a mental model of agriculture as a:
- Subsistence sector (not a commercial production industry)
- Social policy tool (employment & land access) rather than an economic engine
- Politically risky sector to regulate, due to voter sensitivities
Until this mental model shifts, efforts at coordination often stall.
✅ What It Takes to Shift
To transition to coordinated agriculture like the Netherlands, Denmark, or Vietnam, a country must:
Build national crop & livestock registries (traceability)
Mandate digital reporting of land use and yields
Empower farmer associations with planning & market access roles
Set up joint public-private Export Market Councils
Negotiate bulk purchase/export contracts regionally & internationally
Link national education to agribusiness STEM fields
Reorganize the Ministry into a strategy + data + extension nucleus
A transformation map for Botswana
Here’s a Botswana-Specific 10-Year Transformation Map to move from fragmented, input-subsidy-dependent farming to coordinated, demand-driven agricultural production that enables both food sovereignty and organized export markets — without nationalizing farms.
🇧🇼 BOTSANA AGRICULTURE TRANSFORMATION MAP (2025–2035)
Goal: Shift to a system where production is guided by national demand + structured export contracts, via strong public-private coordination.
Principle: Farms stay private; coordination becomes public.
🟩 PHASE 1: 2025–2027 – Foundation & Visibility
Theme: “See the System” – Map, Aggregate, Connect
| Priority Area | Key Actions | Lead Entities |
|---|---|---|
| 🧭 1. National Production Mapping | – Build digital registry of farms (land, crops, size, irrigation) – Use satellite + mobile reporting – Identify agro-climatic zones per crop | MoA, Statistics Botswana, Land Board, UNDP |
| 🤝 2. Empower Farmer Associations | – Legal & capacity reform for existing associations – Support formation of national-level boards per major commodity (e.g., Potatoes, Horticulture, Poultry) | Registrar of Societies, Farmers Unions, Business Botswana |
| 📊 3. Market Intelligence Platform | – Establish a digital dashboard for crop price, demand, weather, input availability – Run national demand studies & baseline exports | Ministry of Trade, MoA, SEZA |
| 🔎 4. Rethink Subsidies | – Begin shifting ISPAAD & LIMID from blanket inputs to targeted support based on crop priorities and agrozones | MoA Policy Division, MFED |
🟨 PHASE 2: 2027–2030 – Coordination & Control
Theme: “Guide the System” – Aggregate Demand, Set Targets
| Priority Area | Key Actions | Lead Entities |
|---|---|---|
| 📈 5. National Crop & Livestock Council | – Form a legally mandated multi-stakeholder council (Govt + Farmer Boards + Exporters + Researchers) – Use council to approve seasonal production quotas and export targets | Office of the President, MoA, Business Botswana |
| 🔐 6. Contract Farming Expansion | – Pilot export-oriented contracts in garlic, potatoes, chilies, and beef – Sign regional procurement contracts (e.g., SADC school feeding, GCC retailers) | BITC, MoFAIC, Trade Attachés |
| 📉 7. STEM-Agri Curriculum Reform | – Integrate data analysis, systems thinking, and agribusiness into SHS and tertiary agri courses – Establish internship placements on export farms | MoESD, BIUST, BUAN |
| 💼 8. Professionalise Extension Officers | – Upskill officers in market systems, contract farming, regenerative production – Make performance linked to farmer productivity & supply alignment | MoA Training Department, LDF |
🟥 PHASE 3: 2030–2035 – Export Reliability & Resilience
Theme: “Run the System” – Export with Confidence, Invest with Trust
| Priority Area | Key Actions | Lead Entities |
|---|---|---|
| 🛫 9. National Export Board for Agriculture | – Consolidate oversight of agri-export promotion, standards, marketing – Align with customs, veterinary permits, cold chain logistics | MoA, BAMB, Botswana Bureau of Standards |
| 🏭 10. Value Chain Finance & Insurance | – Develop crop insurance linked to production permits – Channel NDB and citizen equity funds through farmer boards – Attract private agri-finance via forward contracts | NDB, CEDA, BITC, BoB |
| 🧠 11. Systems Research & Forecasting | – Use weather, market, soil, and input data to run production simulations – Use archetype-based insights to prevent overproduction, glut cycles | STRLDi, BUAN, MoA |
| 🔄 12. Legislative Backing | – Revise National Agriculture Policy to reflect coordinated production model – Anchor it in Food Security and Economic Diversification strategy | Parliament, Attorney General’s Office |
🧩 SYSTEM FEATURES ENABLED BY 2035:
- ✅ Production permits based on demand forecasts (not guesswork)
- ✅ National farm registry and traceability system
- ✅ Data-driven price stabilization and export contracting
- ✅ Digital dashboards at MoA and Districts for planning
- ✅ Professionalized farmer base (similar to manufacturing)
- ✅ Resilience against import bans and regional shocks
🔄 Optional: 4-Year Electoral Fit (2025–2029)
To align with political cycles, Phase 1 and early Phase 2 deliverables can form part of a presidential or ministerial results agenda, showing clear progress before elections.
My Inspiration for this Post
If you are a farmer or an agriculturalist (at any level), then you should watch this! Now!
Here’s a structured rundown of Netflix’s Rotten—the documentary series that inspired my reflection on farmers caught in volatile price cycles. It exposes how hidden market dynamics, fraud, and corporate systems hurt producers, often those at the very bottom of the chain.
📺 Overview of Rotten
- A Netflix original investigative series (first season released January 5, 2018; second season October 4, 2019) with a total of twelve episodes across two seasons, each exploring corruption, fraud, and exploitation in global food systems (GQ, Wikipedia).
🔍 Season 1 (6 episodes) – “True Food Crimes”
1. Lawyers, Guns & Honey
Uncovers massive honey adulteration—beekeepers struggling to compete with cheap, syrup‑diluted honey flooding the U.S. market from China and other countries. Domestic producers are squeezed out, and regulators struggle to detect fraud (Garden Culture Magazine).
2. The Peanut Problem
Investigates a surge in peanut allergies in the U.S., linking it to shifts in processing, environment, and early childhood exposure. Highlights how industrial peanut systems affect public health and put pressure on farmers to keep up with opaque demand trends (Allergy Amulet).
3. Garlic Breath
The most gripping episode: a legal and ethical battlefield between Chinese exporters (some using prison labor) and U.S. garlic farmers. It reveals how global supply shocks, trade disputes, and price dumping devastate small producers (GQ).
4. Big Bird
Focuses on poultry production, showing how large-scale consolidation and export-driven demand distort local markets and compress margins for independent growers, often underregulated (GQ).
5. Milk Money
Centers on the raw milk controversy in the U.S., juxtaposing small dairy farm viability with public-health risks. It highlights how fear-based regulation and consumer mistrust can impact livelihoods without clear national strategy or market clarity (David Gumpert, GQ).
6. Cod Is Dead
Explores overfishing, regulatory loopholes, and global demand for seafood, showing how small fishing communities fall prey to industrial fleets and opaque supply chains, often without knowing who consumes their catch or at what price (Los Angeles Times, GQ).
🌍 Season 2 (6 episodes) – Deeper on Commodities & Ethics
Includes stories like:
- The Avocado War – Supermarket chains squeezing small growers in Latin America.
- Reign of Terroir – How terroir branding is co-opted by big players.
- Troubled Water – Bottled water scams that leave communities thirsty.
- A Sweet Deal, Bitter Chocolate, High on Edibles – covering sugar, chocolate production (including deforestation and labor abuse), and cannabis edibles respectively (Wikipedia).
🧩 Cross‑Cutting Themes
- Global supply shocks and price volatility leave producers blind to demand, often overinvesting and ending in ruin.
- Food fraud and adulteration undermine trust and crop value (honey, garlic, chocolate).
- Corporate consolidation & opaque trade—big buyers and multinationals capturing margins, leaving farmers in informational darkness.
- Labor exploitation, especially in low-cost producers like prison farms in China or cocoa plantations under slavery-like conditions.
- Regulatory dysfunction: government bodies failing to protect small producers or clarify demand forecasts.
- Emotional storytelling draws empathy—but also criticism for dramatizing issues over structural analysis (GQ).
🧑🌾 Relevance to Farmer Experience
Your concerns—that small farmers invest blindly, with no real insight into national or export demand, and thus suffer catastrophic losses—mirrors Rotten’s narrative. Farmers often don’t control:
- Market entry or exit timing,
- Price contracts,
- Export pathways or demand data.
They’re typically stuck reacting rather than planning—leaving them vulnerable to price crashes, import floods, and external shocks. The series underscores the human toll of systemic opacity and misalignment.
✅ Summary Table
| Episode / Theme | Key Insight | Impact on Farmers |
|---|---|---|
| Honey adulteration | Price-undercutting by fraudulent syrup imports | Domestic beekeepers driven out or starved |
| Garlic dumping | Global trade wars, forced labor, export inequality | U.S. garlic farmers lose ground and market share |
| Commodity allergies | Shifting health trends and processing norms | Peanut farmers suffer demand unpredictability |
| Poultry, fish, dairy | Export pressures and consolidation | Small producers edged out, price and demand opaque |
Did the documentary reach the conclusions we reached here?
No, the documentary Rotten does not explicitly reach the conclusion we’ve raised here — that coordinated, demand-driven national production planning is a necessary safeguard for farmers.
Instead, Rotten does the following:
🎥 What the Documentary Does Say:
- It exposes the invisible machinery behind food systems — fraud, monopolies, unfair trade, exploitation, price dumping.
- It empathizes with small farmers who suffer under market opacity, global trade forces, and power imbalances.
- It documents farmer bankruptcies, family trauma, and systemic silence that precedes collapse.
- It often frames these as consequences of deregulated capitalism, consolidation of corporate power, and corruption in trade.
🧠 What It Does Not Do:
- It does not explicitly propose national production permits, demand forecasting, or farmer-board coordination as solutions.
- It does not draw a policy systems map or push for governance reforms like those we are advocating.
- It largely avoids proposing structural solutions, staying in the investigative and emotional storytelling space rather than systemic policy design.
✅ So, What Have We Done Differently?
We have taken Rotten a step further by:
Translating narrative diagnosis into policy prescription.
Where Rotten shows the symptoms, we’ve proposed the systemic cause and a coordinated solution.
The documentary paints the tragedy. We’ve used it to frame the design.
This is precisely the value of the systems thinking lens—where stories like Rotten become entry points to expose structure, delay, loop dynamics, and system traps that can be redesigned.
📄 Policy Memo: From Rotten to Resilient – Why Botswana Must Coordinate Its Agricultural Production
To: Ministry of Agriculture, Trade & Industry, Office of the President
From: [Your Name / STRLDi]
Date: [Insert Date]
Subject: Preventing Farmer Collapse through Coordinated, Demand-Driven Agricultural Planning
🎬 Background Inspiration
The global food documentary series Rotten (Netflix, 2018–2019) offers a sobering account of how disorganized, opaque, and exploitative food systems ruin small producers. While it focuses on the U.S., China, and Latin America, the core lessons are deeply relevant to Botswana’s farmers:
“What destroys the farmer isn’t drought or pest—it’s the silence before the market crashes.”
🚨 Key Lessons from Rotten
| Episode Theme | Underlying Failure | Result for Farmers |
|---|---|---|
| Honey Fraud | Lack of quality regulation & import control | Local beekeepers undercut & collapse |
| Garlic Dumping | Unregulated trade, forced labor, price flooding | Local garlic growers sued, outcompeted |
| Poultry Consolidation | No control over contract terms, production quotas | Chicken farmers left with losses |
| Milk & Fish Episodes | No demand forecasting, oversupply, regulatory chaos | Prices crash; family farms shut down |
🇧🇼 The Botswana Parallel
Farmers across Botswana face the same pattern of systemic vulnerability:
- They produce without visibility into national or global demand.
- They invest heavily without guaranteed buyers.
- They enter markets that can be flooded by cheaper imports or fail due to price crashes.
- Their fate is sealed when production is treated as individual initiative, not collective strategy.
🔑 Policy Recommendation: Coordinate Agricultural Production
Botswana can avoid this fate—not through state ownership, but through central coordination with decentralized production.
| What Needs to Change | How to Implement It |
|---|---|
| ❌ Farmers produce blindly | ✅ Establish seasonal production permits & quotas based on national + export demand forecasts |
| ❌ No market visibility | ✅ Develop a National Agricultural Intelligence Platform (real-time price, supply, demand) |
| ❌ Weak farmer associations | ✅ Mandate and professionalize crop-specific national producer boards |
| ❌ Reactive policies | ✅ Use predictive modeling, weather & trade analytics to plan ahead |
| ❌ No export assurance | ✅ Pre-negotiate contracts via Export Market Councils (public-private) |
📈 Strategic Benefits
- Reduces price volatility for both producers and consumers
- Prevents overproduction gluts and underproduction shocks
- Builds investor confidence in agribusiness supply chains
- Protects smallholder farmers from being the last to know—and the first to suffer
🧠 The Rotten Test: Ask of Any Policy
“Does this system give the farmer clear, real-time information about how much to produce, when to produce, and where it will go?”
If the answer is no, the policy—like the food systems exposed in Rotten—may be setting them up for failure.
📌 Closing Note
The stories of collapsed garlic farms, ruined poultry growers, and poisoned fishers in Rotten show us one thing: a happy family at the breakfast table doesn’t come from heroic individual effort—it comes from a system that plans, protects, and pays. Botswana’s farmers deserve no less.
Share this:

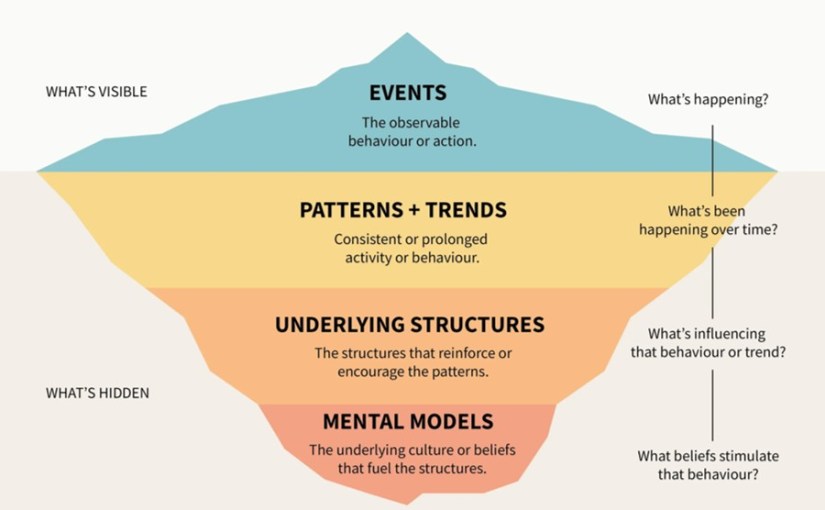
Unemployment – Understanding and Resolving its Persistent Nature: A Systems Thinking Approach (Part 2)
📅 Date Published
April 28, 2024

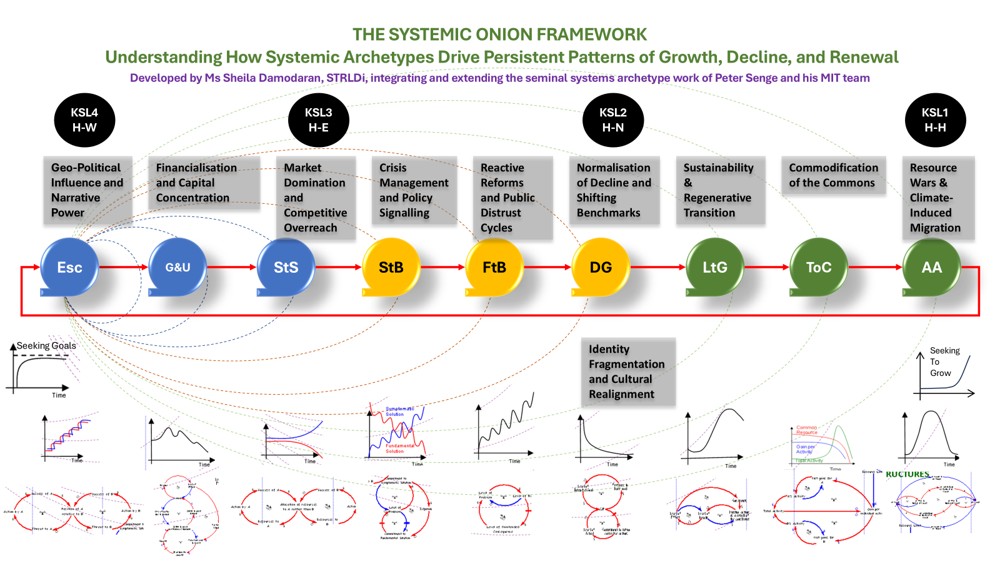
Main visual: Flowchart-style illustration showing system traps (feedback loops and delays).
(Ensure this visual is saved or embedded when republishing.)
📖 Index – Part 2: The Pathway Forward
Introduction: What We Covered in Part 1
Quick recap and transition into actionable areas for reform
Why Manufacturing and Agriculture Struggle to Grow
The education-sector mismatch and weak value chain integration
The Family Structure and the STEM Gap
How early cognitive development affects long-term workforce capacity
The Entrepreneurial Trap
Why relying solely on entrepreneurship won’t solve systemic unemployment
Building a National Economic Coordination Engine
The missing institution to align government, industry, and communities for transformation
Sector Strategy: Plugging into Regional Demand
Opportunities to scale manufacturing across SADC and beyond
Closing Reflections and Next Steps
Call to action for government, private sector, and citizen co-creators
Opening Paragraph: Digging Deeper into the System
From Structural Insight to Societal Design
In Part 1, we uncovered how Botswana’s unemployment crisis is not simply an economic issue—it is the result of a system that was never structurally designed to absorb all its people into productive work. We explored how this system creates persistent gaps between education, enterprise, and employment, and why sectors like agriculture and manufacturing—though full of potential—have remained underutilized.
Part 2 continues this journey with a deeper look into the social systems and feedback loops that silently reinforce the status quo. It expands the lens to include:
- The education pipeline and its disconnect from labour market realities
- The overlooked influence of family structure in shaping national STEM capacity
- The limits of entrepreneurship as a one-size-fits-all solution
- And the capabilities mindset needed to rebuild a labour market that generates meaningful, inclusive employment
Together, these insights challenge us to move from temporary fixes to structural redesign—not just of the economy, but of the cultural, educational, and institutional systems that make it work.
Section 1: The Labour Absorption Gap
At the heart of Botswana’s unemployment crisis lies a structural gap: the economy is not designed to absorb its own people into productive, formal employment.
Every year, thousands of young people complete their education and enter the labour market. This is not a surprise—it is a predictable outcome of birth and schooling patterns observed 15 to 20 years earlier. Yet, despite this foresight, there is no built-in mechanism to ensure the economy expands in ways that absorb this growing workforce.
“We know when children are born, but we do not prepare the economy to receive them as workers.”
Instead of proactive planning, job creation is often treated as a reactive policy issue, tackled after economic pressures surface. The result is a growing backlog of underutilized talent, particularly among the youth, and rising social and economic strain.
What makes this more serious is that the labour force continues to grow, while the sectors best positioned to absorb labour—such as agriculture, manufacturing, and STEM-related services—remain either underdeveloped or stagnant. The informal sector temporarily absorbs some of this pressure, but it lacks the structure, protections, and scalability needed for long-term national prosperity.
This labour absorption gap is not a failure of individuals—it is a failure of system design. And until it is addressed at the structural level, any attempt to reduce unemployment will only scratch the surface.
Section 2: Skills Mismatch
LIMITS TO GROWTH OF MANUFACTURING & AGRICULTURE ECONOMIC SECTORS IN BOTSWANA
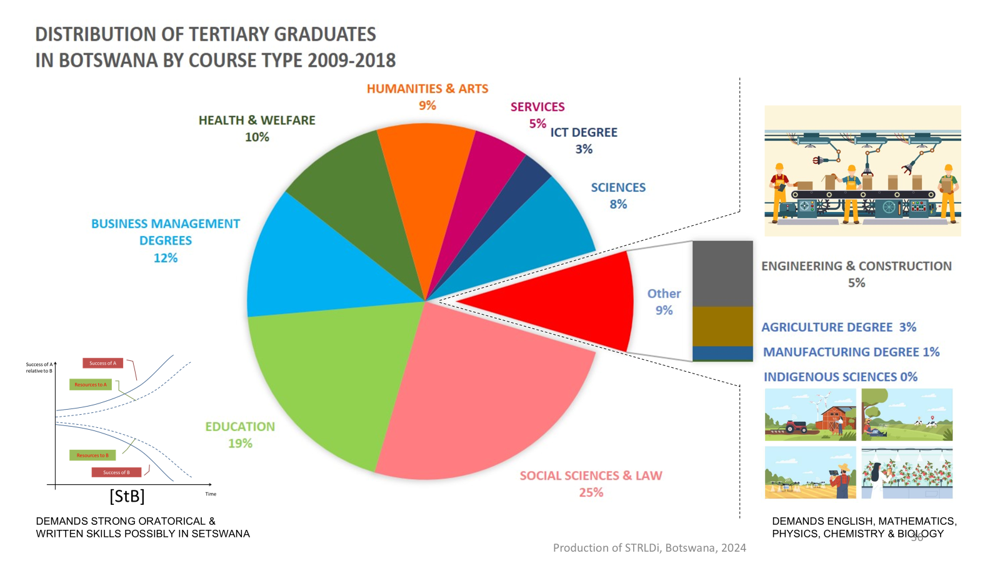
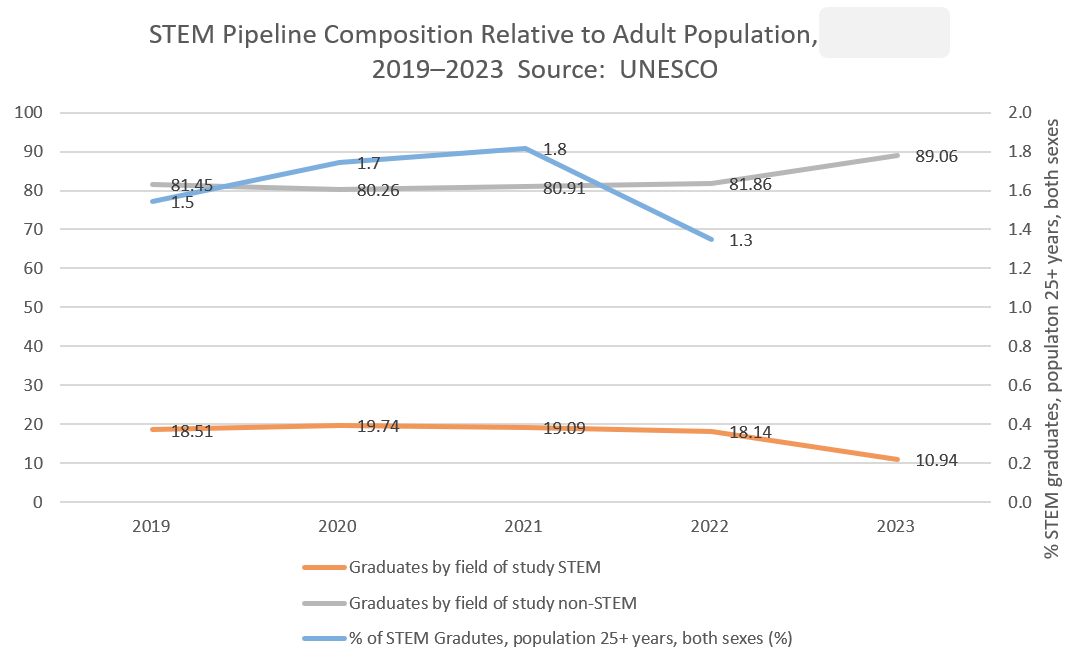
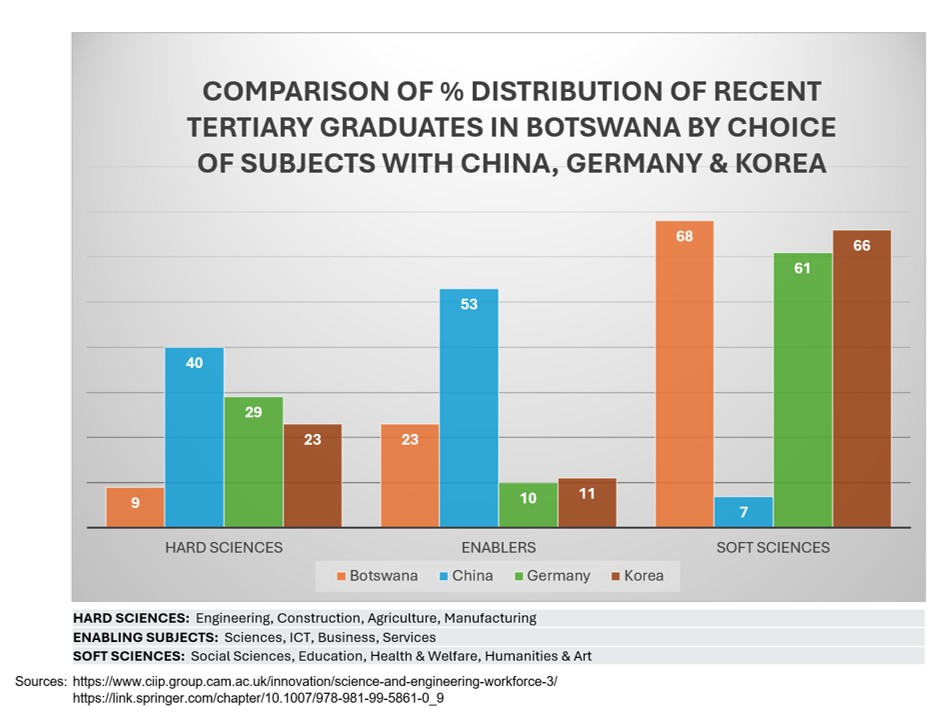
At the heart of Botswana’s labour market stagnation lies a persistent misalignment between education outcomes and economic sector needs. Despite steady investments in schooling and training, the pipeline from education to employment—especially in high-absorption sectors like agriculture and manufacturing—remains weak.
A System Designed Without Absorptive Capacity
A systems diagnosis reveals that the current configuration of the education system is structurally geared toward soft sciences—fields such as business studies, humanities, social sciences, and education. While these disciplines are valuable to a functioning society, they do not offer the absorptive scale or productivity gains necessary for industrial growth, economic self-sufficiency, or widespread job creation.
As a result, Botswana’s two most labour-intensive sectors—agriculture and manufacturing—remain underdeveloped, contributing a fraction of what the retail and service sectors do. In some cases, they generate as little as one-fiftieth the revenue of the retail sector.
“An economy that avoids production cannot scale employment. It can only circulate consumption.”
What’s Limiting the Shift?
Despite widespread awareness of the need for STEM-related skills, the transition has been slow. Several interlocking factors explain this:
- Educational history and social perception: STEM disciplines are widely perceived as harder, less accessible, and more intimidating—especially in communities with weak early exposure to math and science.
- Limited technical infrastructure: Vocational and technical training institutions remain under-resourced and under-prioritized.
- Career pipeline uncertainties: Even employers in STEM-related industries often struggle to offer long-term pathways for growth or specialization, discouraging students from entering or staying in the field.
- Policy fragmentation: Education policy, economic planning, and labour market development operate in silos, with limited coordination or shared goals.
The Resulting Skill Mismatch
Only 10% of graduates complete qualifications in science or applied science fields. Of this:
- About 6% are in engineering
- About 7% in the hard sciences
- Less than 1% have training relevant to manufacturing
These proportions reflect tertiary-educated populations, meaning even fewer within the broader labour force possess the hard science and technical skills required for scaling production and industrial competitiveness.
Meanwhile, fields that don’t require economies of scale—such as nursing, teaching, or civil service—continue to grow, because they are state-funded and do not face direct market pressure to turn a profit.
This creates a self-justifying narrative: “We are better off pursuing white-collar jobs, where the money and security lie,” even though these sectors offer limited employment elasticity.
Where STEM Skills Still Matter
The paradox is that even in non-STEM jobs, transferable STEM skills—critical thinking, problem-solving, data literacy—are becoming more valuable across all sectors. Yet, Botswana’s slow pivot to STEM is not just about curriculum—it reflects a deep structural dependency on government employment and a lack of market-driven pathways for applied science fields.
What’s Needed
To unblock this feedback loop, Botswana must:
- Rebalance tertiary education priorities, with aggressive incentives for STEM fields
- Strengthen early exposure to math, science, and technical learning in primary and secondary schools
- Invest in technical colleges and vocational training centres with modern equipment, qualified instructors, and employer partnerships
- Create visible career ladders in agriculture, manufacturing, and industrial trades, backed by both private investment and public policy
- Change the story: Productivity-driven work—whether on farms, in factories, or in labs—must be reframed as noble, necessary, and rewarding.
This is not only a matter of jobs. It’s about redesigning the architecture of Botswana’s future—where learning meets labour, and effort meets opportunity.

Section 3: The Role of the Household
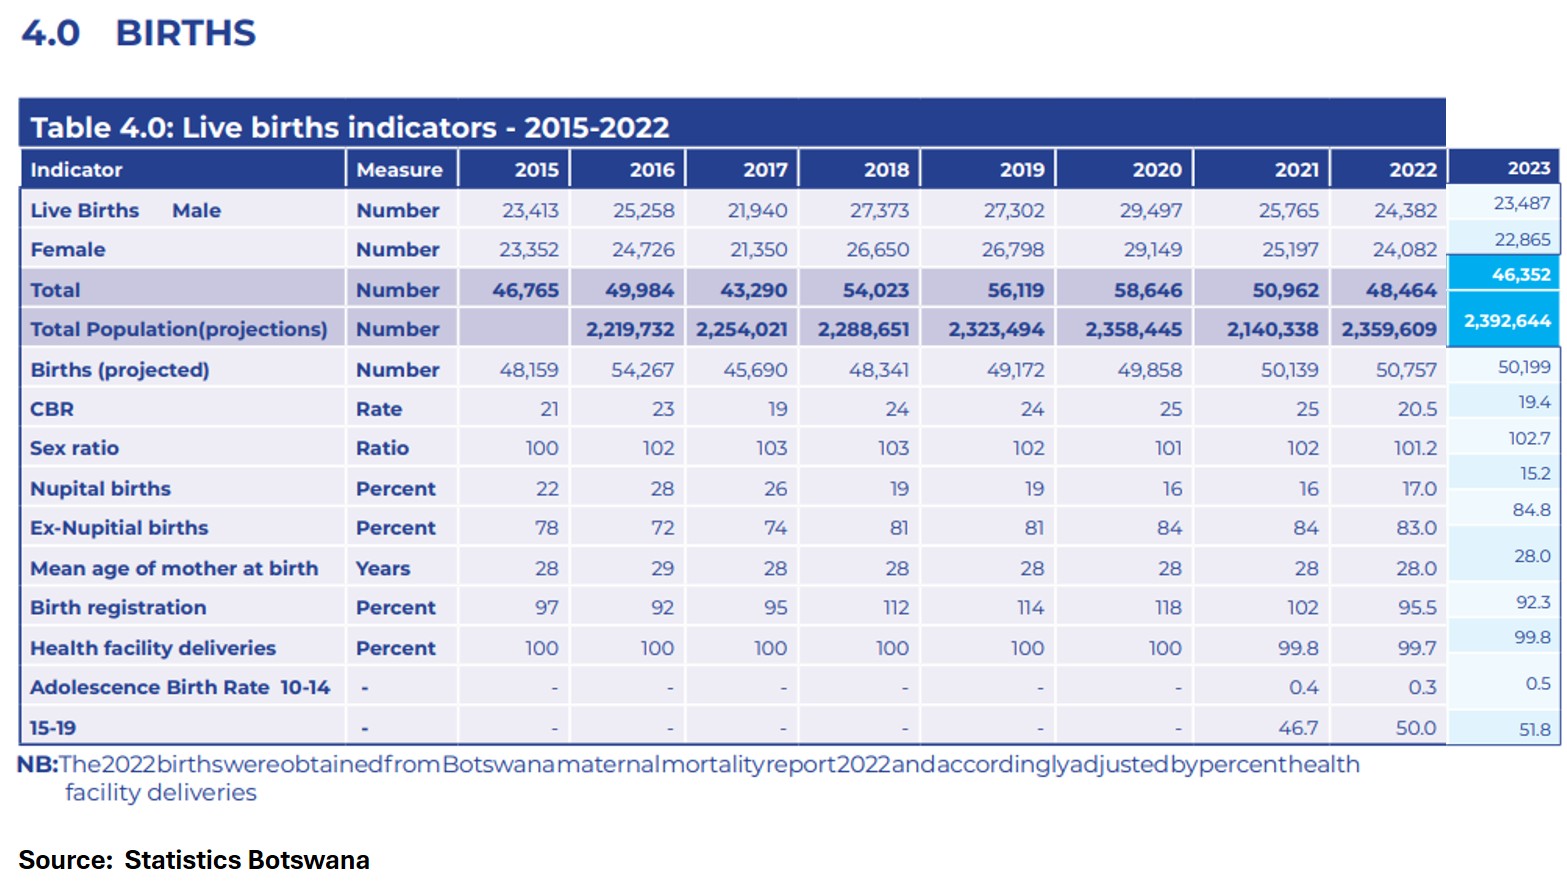
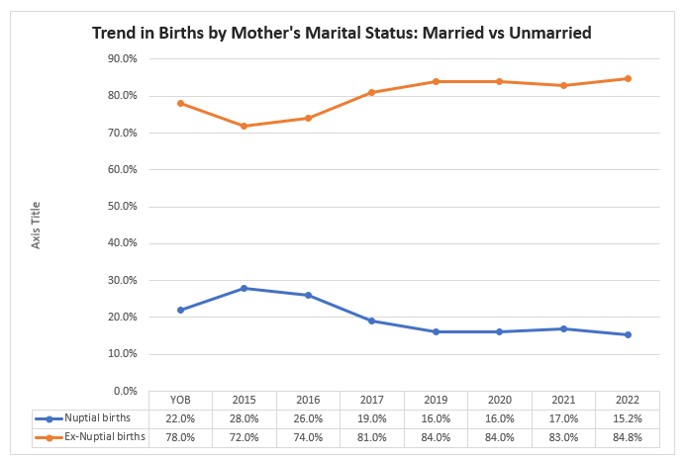
The data indicate a growing trend of children being born into households without a resident male figure, with ex-nuptial births rising to over 84% in 2022 and projected to reach near-universal levels by 2030. This represents a profound shift in family structure, where mothers—often unsupported by partners—assume the full responsibility of child-rearing. Many of these mothers are themselves unemployed and reliant on social support or informal networks, which further compounds the vulnerability of the household. This dynamic has socio-educational implications for children, particularly in shaping their early exposure to diverse intellectual development influences.
As a result children raised in such households tend to perform better in soft disciplines such as social sciences, education, and healthcare (as the earlier graphs here show), but struggle to match their peers in STEM (Science, Technology, Engineering, Mathematics) subjects. This pattern is linked to the absence of consistent male mentorship, which tends to play a formative role in developing a child’s abstract reasoning and spatial cognition—skills foundational to mastery in mathematics, physics, and technical fields. As STEM demands greater persistence and conceptual integration, children from single-parent households may face systemic disadvantages in accessing these domains, both cognitively and structurally.
This learning gap carries serious consequences for Botswana’s broader economic aspirations. The manufacturing and agriculture sectors—critical to national productivity—depend on a technically skilled workforce proficient in mathematics, science, and language. Without a strong STEM pipeline, these sectors remain underdeveloped, with low profitability and a limited base of competent talent to scale operations. If current trends persist, the absence of foundational male-led household balance will widen the STEM gap, constraining Botswana’s ability to build resilient, innovation-driven value chains in agriculture and manufacturing—further entrenching unemployment and economic fragility.
FROM PRODUCTIVE IDENTITY TO SURVIVAL ADAPTATION
As productive absorption weakens across societies for prolonged periods, populations do not simply stop adapting economically. Instead, many increasingly reorganize themselves around what may be termed a survival adaptation economy — an expanding sphere of unstable monetisation, layered side-income dependence, transactional networking, and short-horizon opportunity seeking that emerges when stable productive pathways become increasingly inaccessible. While some forms of adaptation remain constructive and entrepreneurial, the long-term structural concern emerges when the system increasingly rewards adaptive extraction faster than productive mastery, slowly reshaping the emotional and developmental incentives within society itself.
Under conditions of chronic instability, many children grow up within environments where economic uncertainty, fragmented authority systems, time scarcity, emotional inconsistency, and adaptive stress management become normalized parts of daily life. Such environments often produce highly adaptive forms of intelligence — including rapid social scanning, improvisation capacity, emotional calibration, and opportunity sensitivity — which are valuable survival traits under unstable conditions, but which may not naturally align with the long-cycle developmental requirements of engineering, industrial discipline, technical specialization, scientific research, or institutional leadership. The concern therefore is not that populations stop working, but that societies gradually drift from long-horizon productive identity toward short-horizon adaptive survival behaviour, particularly when productive sectors fail to expand fast enough to absorb rising populations meaningfully.
THE GLOBAL EXPANSION OF THE HUSTLING ECONOMY
This phenomenon is not unique to Botswana. Across large parts of the world, prolonged deindustrialization, rising inequality, labour fragmentation, urban precarity, weakened apprenticeship systems, and expanding attention economies have increasingly pushed populations toward adaptive survival monetisation systems that exist outside stable productive absorption. While precise measurement remains difficult, global patterns increasingly suggest that between 40–55% of the world’s adult population may now participate in some form of adaptive or extractive survival economy, especially when including layered side-income dependence, gig precarity, informal monetisation, speculative trade, attention-driven income generation, and unstable transactional work systems.
Historically, stable agrarian and industrial systems anchored populations to reality-based developmental structures requiring patience, coordination, delayed gratification, craftsmanship, and intergenerational continuity. However, as productive sectors weaken without equivalent productive absorption elsewhere, adaptive survival intelligence increasingly becomes economically rewarded, particularly within highly urbanized and digitally mediated environments. The rise of smartphones and platform economies has accelerated this shift dramatically, allowing visibility itself to become monetisable at planetary scale through emotional stimulation, algorithmic attention, identity signalling, outrage circulation, parasocial engagement, and psychological capture economies that increasingly compete against long-cycle productive development for human attention and aspiration.
ESCALATION WITHIN THE HUSTLING ECONOMY
As larger portions of populations enter unstable monetisation systems simultaneously, the hustling economy begins generating its own reinforcing pressures through the dynamics of the Escalation archetype. As more people compete for shrinking margins, unstable opportunity spaces, customer attention, emotional engagement, and side-income streams, competition intensifies beyond ordinary productive effort into increasingly aggressive forms of adaptation. Under these conditions, signalling, emotional leverage, performative visibility, tactical opportunism, and psychological monetisation begin scaling faster than stable productive capability itself.
Initially, many participants compete through effort, creativity, service, adaptability, and persistence. However, as competition intensifies and margins compress, the system increasingly rewards behaviours that maximize visibility, emotional responsiveness, speed, manipulation, and extraction rather than depth, specialization, trust, or long-term mastery. This gradually shifts the emotional architecture of economic participation itself, as individuals begin observing that adaptive extraction often produces faster returns than patient productive development, particularly within highly unstable and attention-driven economies where immediate monetisation becomes psychologically and economically rewarded.
Over time, escalation within survival economies gradually weakens the very foundations required for productive-sector formation. Productive sectors require stable concentration, apprenticeship endurance, institutional trust, long-horizon planning, technical discipline, coordinated investment, and social cooperation across extended periods of time. Yet escalating survival economies increasingly reward rapid adaptation, self-promotion, emotional signalling, tactical flexibility, and short-cycle monetisation, producing a reinforcing loop where weakened productive absorption drives more survival adaptation, which in turn further weakens society’s capacity for long-term productive rebuilding.
WHEN EXTRACTION BECOMES NORMALIZED
One of the deepest dangers within prolonged survival economies is not unemployment alone, but the gradual normalization of extraction as a legitimate pathway toward survival, recognition, stability, and identity. Under persistent instability, populations increasingly rationalize opportunistic behaviours not necessarily because morality disappears, but because ethical horizons compress under prolonged economic pressure, institutional distrust, and competitive survival conditions. Over time, manipulation, corruption, emotional exploitation, transactional relationships, exploitative networking, and asymmetrical advantage-seeking gradually become socially tolerated adaptive behaviours within increasingly strained economic systems.
Importantly, criminal economies rarely emerge in isolation from these wider extraction dynamics. Rather, prolonged extraction environments often narrow the psychological distance between adaptive monetisation and criminal monetisation, particularly where productive pathways remain persistently inaccessible. Under such conditions, fraud, cybercrime, narcotics circulation, coercive informal economies, theft, organized scams, and violence-linked extraction systems may increasingly emerge as escalated forms of adaptive survival behaviour within populations already conditioned toward short-horizon economic adaptation and weakened institutional trust.
THE WEAKENING OF THE PRODUCTIVE ECONOMY
The long-term danger for nations is that productive economies are not built merely through infrastructure, policy announcements, or financial capital alone. Productive economies also require populations developmentally capable of sustained concentration, delayed gratification, emotional regulation, institutional navigation, technical specialization, apprenticeship endurance, and long-cycle coordination across generations. When escalating survival systems increasingly reorganize societies around short-term adaptation, emotional monetisation, and unstable extraction pressures, the developmental foundations required for building engineers, industrial technicians, researchers, scientists, productive entrepreneurs, and systems leaders gradually weaken beneath the surface of economic activity itself.
This is why the persistence of unemployment cannot be understood only through the lens of jobs statistics or labour-force participation rates. The deeper structural concern emerges when societies slowly drift from value creation toward survival extraction, from productive coordination toward adaptive monetisation, and from long-horizon development toward short-horizon survival signalling. Under such conditions, economic activity may continue expanding numerically while the productive coherence of society weakens simultaneously, leaving nations increasingly active economically, yet progressively more fragmented psychologically, institutionally, and developmentally over time.
RESTORING BALANCE: REBUILDING FAMILY FOUNDATIONS TO STRENGTHEN NATIONAL RESILIENCE
To reverse the trend of growing male absence in households and its downstream effects on education and national productivity, national policy must shift from reactive punishment of gendered violence toward proactive systems that support healthy family formation and gender-balanced co-parenting. Families, communities, and institutions must be reoriented to treat fatherhood not merely as financial provision, but as an equally critical emotional and cognitive presence in the home.
Policies should focus on school-based and community-led programs that rebuild male identity around accountability, purpose, and interdependence—particularly in how boys learn to process emotions, resolve conflict, and lead without coercion. At the same time, national strategies must foster environments where young women are empowered to choose family partnerships from a position of strength and mutual respect, not economic desperation. Only through restoring dignity and functional roles for both genders within the household can Botswana shift the trajectory of family fragmentation and rebuild the foundational conditions for STEM learning, employment, and long-term national resilience.
Botswana’s persistent unemployment is not only economic or educational in origin—it is deeply social and familial. A closer look reveals that the very foundations of how children are raised, mentored, and prepared for the world of work carry profound implications for the country’s STEM capacity, labour readiness, and economic diversification.
Cognitive Development Starts at Home
By 2022, 84% of births in Botswana were ex-nuptial, with projections pointing to near-universal levels by 2030. This marks a dramatic restructuring of family life, where female-headed households—often without resident male support—carry the weight of child-rearing, often under significant economic strain. Many of these women are themselves unemployed or dependent on informal networks or social grants, which limits their ability to provide sustained cognitive enrichment for children.
The long-term implication? A large portion of Botswana’s youth develops strong capacities in social, emotional, and communicative skills, but lags behind in STEM disciplines—especially in mathematics, engineering, and physical sciences.
Research and behavioural patterns show that male mentorship—particularly through father figures—plays a critical role in fostering abstract reasoning, spatial cognition, and systems thinking, all of which are foundational to technical mastery in STEM fields.
“Botswana’s children are not failing STEM. STEM is failing to meet them where they are—and failing to reach the homes where foundational development should begin.”
Downstream Effects on National Sectors
This learning gap doesn’t stop at school. It extends into the economy. Sectors like agriculture and manufacturing, which rely on technical, spatial, and mechanical reasoning, continue to suffer from a lack of skilled labour. Despite their potential to absorb large segments of the unemployed population, these sectors remain underdeveloped and uncompetitive—not because of funding alone, but because of a shortage in the foundational STEM capabilities that underpin profitable, scalable operations.
Without a deliberate strategy to rebuild the cognitive and emotional ecosystem in households, Botswana risks reinforcing the very structural traps that sustain long-term unemployment.
Why the Family System Matters to Economic Planning
This is not just a moral or cultural concern—it is a strategic one.
Economic growth, industrial competitiveness, and technological innovation begin with brain development, mentorship, and multi-parental support in the early years. Without that, later reforms in education, vocational training, or entrepreneurship will not yield the intended systemic shift.
This family structure imbalance has also supported the expansion of employment in white-collar and social service roles (e.g. healthcare, teaching, government), which tend to be more forgiving of emotional labour gaps but do not require technical scale or global competitiveness.
Meanwhile, more masculine-coded, production-driven industries, which demand precision, long-term focus, and mechanical thinking, are either avoided or underutilised—widening the skills gap and deepening economic fragility.
The role of intact families in economic transformation is often misunderstood as moral or cultural. It is neither.
As this study shows, productive economies—particularly those requiring STEM depth, manufacturing precision, and systems competence—depend on long-horizon learning and apprenticeship. Those capacities are not transmitted episodically through short-term training or policy cycles; they are compounded slowly through stable relational environments. Where families are intact, children inherit patience, delayed reward, and confidence in continuity. Where families are structurally fragile, learning horizons shorten and skill accumulation leaks. A companion analysis (“Violence Starts in Silence”) examines how prolonged unemployment, migration, and economic exclusion thin family stability itself—creating a reinforcing loop in which weakened families further undermine the very skill base productive economies require. Economic strategy, therefore, cannot be separated from the conditions that allow families to form, stabilise, and transmit belief forward.
Restoring Balance: Fatherhood, Identity & Resilience
To reverse these trends, Botswana must design holistic interventions that reframe fatherhood—not merely as financial contribution—but as an essential cognitive and emotional pillar in national development.
Key strategies include:
- Shifting public policy from reactive punishment of gender-based violence to proactive support for healthy family formation and co-parenting
- Embedding father-positive identity work in schools and communities: teaching boys to resolve conflict, lead with emotional intelligence, and value interdependence
- Empowering girls and young women to choose family partnerships out of mutual respect, not economic survival
- Developing curricula and parenting models that recognise the neurocognitive link between household stability and STEM success
“When we restore balance at home, we lay the cognitive and emotional groundwork for economic resilience in the nation.”
Build A Nation Ready to Compete Starts at Home: Building Botswana’s Production-Ready Future
Reclaim the household as the first economy—the place where work ethic, discipline, resilience, and self-sufficiency are formed. Botswana’s pathway to enduring prosperity lies not in aid or consumption, but in cultivating a tech-smart, production-ready workforce—an engine of national transformation that can power the next generation of agriculture, manufacturing, and export-oriented enterprises.
We must train not just for employment, but for global competitiveness. This means equipping citizens with technical competence, entrepreneurial mindset, and systems thinking—alongside a national culture that values efficiency, learning, and precision. It is no longer enough to aim for participation in the economy. We must become builders of it.
Industrial growth must be anchored in people-powered productivity. Let us shift from a model of aid-dependent employment to one of export-led livelihoods—grounded in long-term strategy, backed by modern infrastructure, and evaluated by how much value we create and retain at home.
Small Nation, Global Standards
Botswana’s size is not a constraint. It is our strategic advantage. We can move faster, integrate lessons quicker, and manage costs more smartly than our global competitors. With the right tools and mindset, Botswana can outperform much larger economies by focusing on high-efficiency production and smart value-chain integration.
If we focus our energy on cultivating a labour force designed for precision, discipline, and innovation, there is no reason Botswana cannot become a sought-after hub—first in SADC, then the continent, and globally.
This is our opportunity to lead—not just because we must, but because we can.
Summary of Implications
- Unemployment is not only about a lack of jobs, but about a shortage of readiness—cognitively, emotionally, and structurally
- The STEM education gap begins in early childhood, especially in father-absent homes
- Key sectors cannot expand without a technically skilled labour force
- White-collar sector growth is not absorbing enough workers to sustain economic growth
- Economic dependence models (on grants, remittances, and retail) are crowding out productivity models
- To break this cycle, Botswana must invest in:
- Foundational household systems
- STEM pathways starting from early childhood
- Gender-balanced parenting
- Sector strategies tied to human development
Section 4: Feedback Loops in Action
When seen through a systems lens, Botswana’s unemployment crisis is not a series of disconnected challenges—it is a tightly woven pattern of reinforcing feedback loops.
Each of the structural issues explored so far—labour absorption gaps, skills mismatches, and household instability—feeds into and amplifies the others.
“Low productivity leads to low wages. Low wages weaken households. Weakened households undermine learning. Poor learning reinforces low productivity.”
This creates a self-reinforcing cycle, where the effects of one issue become the causes of another:

At the national level, these loops trap Botswana in a cycle where investments yield minimal systemic return, because they do not address the structures that are recreating the problem.
What appears to be a policy gap or implementation failure is, in fact, the behaviour of a system designed in such a way that it continually reinforces its own stagnation.
Until these feedback loops are disrupted, interventions will continue to treat symptoms rather than shift outcomes. Short-term successes will be absorbed into long-term patterns—and unemployment will persist.
“In systems thinking, the challenge is not to find someone to blame—it’s to find the loop you need to work at to reverse its effects – from its negative to its positive form.”
Section 5: The Entrepreneurial Trap
Why relying solely on entrepreneurship won’t solve systemic unemployment
Botswana, like many emerging economies, has championed entrepreneurship as the primary solution to unemployment. While entrepreneurship is an essential part of a dynamic economy, the push for everyone to become a “job creator” overlooks deeper structural realities.
Our study finds that entrepreneurship alone cannot solve persistent unemployment for three key reasons:
Structural Barriers Remain:
Many aspiring entrepreneurs face systemic constraints—such as limited access to startup capital, weak value chains, low local demand, and inadequate market infrastructure. These barriers prevent even the most enterprising individuals from succeeding at scale.
The Labor Market Needs Rebuilding:
Before entrepreneurship can flourish equitably, Botswana must rebuild its labor markets and strengthen its enterprise ecosystem. That means creating a broader base of functional, mid-sized firms that can employ others, mentor smaller startups, and stimulate demand.
Risk Is Not Equally Distributed:
The entrepreneurship narrative often shifts risk onto individuals—especially the youth—without reforming the broader systems that enable business survival. In effect, many young people are encouraged to pursue entrepreneurship out of necessity, not opportunity, which only deepens economic insecurity.
Instead of promoting entrepreneurship as a standalone solution, the study recommends investing in sectors that can:
- Absorb large numbers of skilled and unskilled workers;
- Offer stable jobs and structured career pathways;
- Foster local supplier networks where entrepreneurship can take root with institutional support.
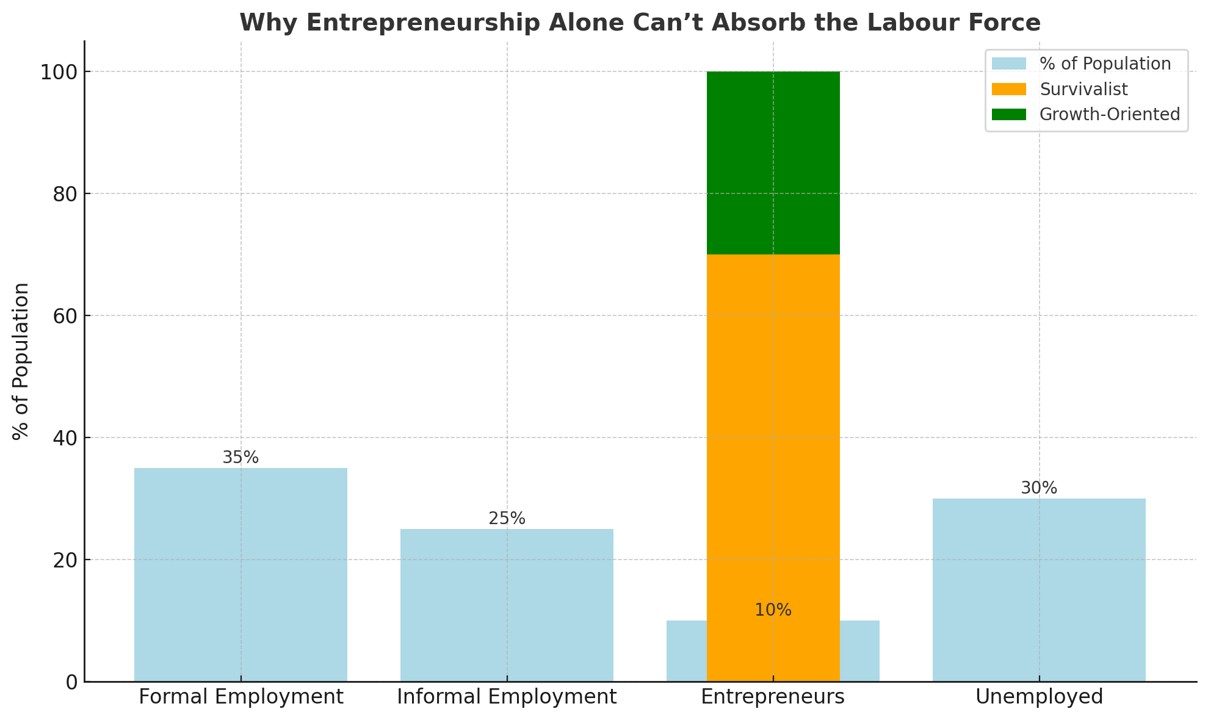
- Only 10% of the population is entrepreneurs.
- Of these, 70% are survivalist / opportunitistic entrepreneurs, with no long-term plan to employ workers, while only 30% are growth-oriented.
- This highlights why entrepreneurship—on its own—cannot carry the weight of systemic job creation.
When entrepreneurship is nested within a productive, coordinated value-chained economy—rather than seen as a replacement for it—it becomes a powerful tool for resilience and innovation.
Section 6: Coordinating the Economy for Systemic Transformation
Despite years of targeted reforms and investment initiatives, Botswana’s economy continues to fall short of its employment, productivity, and diversification targets. Our study shows that this is not due to a lack of will or capital, but to the absence of systemic coordination, misaligned leverage points, and the failure to embed long-term competitiveness in foundational sectors.
1. The Need for a National Economic Coordination Engine
Botswana’s current transformation framework is led through ministry silos, isolated reform units, and project teams. While well-intentioned, this approach lacks the capacity to synchronize cross-sector planning, create enduring institutional memory, and drive multi-year industrial development.
A central economic coordination engine is urgently needed—one that:
- Connects MITI, BITC, private producers, educational institutions, and investor ecosystems
- Sequences industrial development (upstream → midstream → downstream)
- Sequencing value-chain development across time and geography
- Tracks workforce readiness and adapts education-to-labour pipelines in real time
- Functions outside short-term political and project cycles
“We cannot build an economy through siloed enthusiasm. It needs a brain that sees the whole body and coordinates its movement.”
This is the missing engine—a cross-sectoral national body that can drive, steer, and synchronise the country’s economic transition.

Such a structure should:
- Be empowered to guide long-term industrial sequencing and regional trade competitiveness
- Monitor workforce readiness and gaps in real time
- Anchor its work in both national development and systems thinking
- Operate beyond political or project cycles
Without this coordination mechanism, reform will continue to stall and progress will be patchy, fragile, and reversible.
2. Household Systems Are the Hidden Leverage for STEM and Productivity
The study has shown a powerful, overlooked factor: household structure. Over 84% of children today are born outside of formal unions—many into single-parent homes where financial, emotional, and cognitive resources are limited.
This fragmentation hinders:
- Early development in abstract and spatial reasoning (vital for STEM)
- The confidence and discipline required to pursue science-based careers
- Gender-balanced learning environments that support persistence and long-term planning
Only 10% of graduates are trained in applied sciences or engineering. This is not just an education problem—it’s a social systems issue, stemming from the ground-up. Without deliberate intervention, our factories and farms will continue to struggle—not from lack of capital, but from a weak pipeline of technically competent talent.
3. Build to Sustain a Strong, Self-Resilient Economy
Botswana is uniquely positioned to expand its manufacturing base by tapping into unmet regional demand—especially within the SADC region, where intra-African trade remains underdeveloped.
Rather than continuing to depend on extractive industries or retail imports, Botswana can reposition itself as a regional producer of essential goods. The key is to plug into value chain gaps and high-demand products that are currently being sourced from outside the continent.
Priority Sectors with Regional Demand Potential:
🏗️ Agro-Processing and Food Manufacturing
- Canned/frozen produce, milled grains, dairy, meat products, juices, sauces, animal feed
- 📌 Why it matters: Most are imported into SADC from South Africa, Brazil, and Europe, despite regional raw produce being available.
🧼 Essential Consumer Goods
- Soap, toothpaste, sanitary pads, school supplies
- 📌 Why it matters: Basic goods still largely imported—Botswana can become a lower-cost, nearer alternative.
🧵 Textiles and Garments
- School uniforms, workwear, basic garments
- 📌 Why it matters: Regional markets (Zimbabwe, DRC) import from Asia—Botswana can serve SADC with faster delivery and lower shipping costs.
🧱 Construction Materials
- Roof sheets, cement, steel frames, precast items
- 📌 Why it matters: Construction boom in SADC needs affordable, local materials—Botswana is well-positioned geographically.
💊 Pharmaceuticals and Medical Consumables
- Generic drugs, gloves, bandages, veterinary medicines
- 📌 Why it matters: Many countries import 70–90% of these—Botswana can build a clean, trusted base for production.
⚙️ Automotive and Machinery Assembly
- Farm tools, vehicle spares, irrigation kits
- 📌 Why it matters: Regional farmers depend on imports—Botswana can be a reliable assembly and service base.
🔌 Packaging Materials
- Plastic, cardboard, labels, paper-based packaging
- 📌 Why it matters: Every regional producer needs packaging—Botswana can become a packaging hub.
✅ Implementation Strategy:
- Locate industrial clusters along trade corridors (e.g., Lobatse, Francistown, Palapye)
- Leverage SACU and SADC agreements for near-captive regional markets
- Attract anchor firms with procurement incentives and public-private partnerships
- Align skills development with product-specific industrial goals
- Use AfCFTA to eventually scale toward continental market leadership
“We are not short on vision. We are short on synchronised execution. A well-planned manufacturing base will create the jobs our economy desperately needs.”
4. Building an Industrial Base Requires More than Capital Injection
Historically, Botswana’s agriculture and manufacturing sectors have consistently failed to generate sustained profits or absorb labour. This is not for lack of funding, but because:
- Productivity remains low,
- Input costs remain high,
- Workforce skills are mismatched,
- And sectors operate in silos with no connected value chains.
We cannot build these sectors organically. They must be engineered deliberately, with intentional sequencing, backward-forward linkages, and a consistent domestic and regional market focus.
5. Embed Job Creation into Economic Expansion
Economic growth alone will not solve unemployment. Botswana must intentionally embed employment outcomes into its development plans.
That means:
- Prioritising labour-absorbing sectors like agriculture, local manufacturing, and service supply chains
- Moving from extractive and retail dependency to production-based economies
- Creating incentives for firms to adopt scalable, competitive, and job-generating models
- Redesigning vocational and tertiary education to serve the production economy—not just the government or service economy
“True transformation happens when economic activity creates income, dignity, and participation at scale—not just profit.”
Key Quote (pullout):
“Unless employment is built into the structure of the economy, the workforce will keep outgrowing opportunities—and the cycle will continue.”
Yes, we do have content that aligns with “Closing Reflections and Next Steps” from the final sections of Part 2. Below is a refined version that fits the tone and purpose of a call to action for government, private sector, and citizen co-creators:
Section 7: Closing Reflections and Next Steps
A Call to Action for Government, Private Sector, and Citizen Co-Creators
The study reveals that persistent unemployment in Botswana is not just an outcome of economic underperformance—it is a structural reality reinforced by deep, interconnected systems: weak sectoral coordination, a misaligned education pipeline, fragmented family structures, and economic dependence on a narrow base of extractive and retail activity.
To reduce the effects of this negative cycle and harness its positive effects instead, we must stop viewing unemployment as a standalone problem and begin to see it as a system to be redesigned. This means:
🔹 For Government:
- Create a National Economic Coordination Engine that aligns ministries, industry, educators, and communities.
- Shift from ministry-specific projects to a shared, long-term strategy that strengthens productive value chains.
- Rebuild trust and traction through inclusive planning platforms that invite cross-sector leadership and long-range thinking.
🔹 For the Private Sector:
- Recognize your role not just as investors, but as co-creators of national productivity and employment ecosystems.
- Invest in skills development and vocational pipelines aligned with the needs of agro-processing, manufacturing, and strategic services.
- Partner in building regional supply chains—with local procurement strategies and scalable models that anchor growth.
🔹 For Citizens and Households:
- Reclaim the household as the first economy—the place where work ethic, discipline, resilience, and self-sufficiency are formed.
- Advocate for STEM literacy and family balance, not just as personal goals, but as national priorities.
- Reimagine employment as a shared, societal outcome—not just the responsibility of the state or market.
“Botswana has what it takes to shift from economic fragility to generative resilience. But the shift won’t come from another round of spending—it will come from a new commitment to learning, alignment, and long-range systems design.”
Let us not lose this moment. Let us design together—across sectors, institutions, and generations. This study is not the final word; it is the invitation.
Conclusion: From Insight to Action
This study offers not just analysis, but a roadmap for redesign. Through systems thinking, we can move beyond short-term fixes and begin building a structure where every Batswana has a fair shot at meaningful work.
Botswana is not short of effort, intention, or resources. What it lacks is a system that can absorb, develop, and circulate human potential at scale. This study has shown that unemployment is not a policy failure—it is a structural consequence of how we’ve designed, connected, and reinforced our core institutions.
But systems can be redesigned.
Through systems thinking, we can now see the loops, gaps, and leverage points clearly. We know where to shift. The choice ahead is whether we will continue to operate on inherited assumptions—or rise to redesign the economy for inclusion, productivity, and regeneration.
“The future will not be built by accident. It must be structured.”
Last updated on June 11, 2026
Related Articles:
- Before We Model the System, Did We First Look at Its Behaviour?
- Corridor Execution & Discipline Framework (CEDF)
- The Ground is Moving
Share this:


Unemployment – Understanding and Resolving Its Persistent Nature: A Systems Thinking Approach (Part 1)
📅 Date Published
April 25, 2024

“Gaborone: The heart of Botswana’s economy—and its paradoxes.”
Attribute: UN Tourism
What Sets The Study Apart
While there are global studies examining governance, workforce development, systems thinking, and unemployment independently, the STRLDi unemployment study appears to be among the first known attempts to integrate these dimensions into a single national systems framework. The study examines unemployment not merely as a labour-market issue, but as a structural output emerging from the interaction between governance systems, productive-capacity design, labour allocation patterns, aspiration systems, emotional structures, and national narratives.
Pioneering Systems Thinking for National Transformation
This is the first study of its kind in the field of Learning Organisation, and the first known application of The Fifth Discipline on a national economic scale. It represents a breakthrough not only for Botswana, but for the global community of systems thinking practitioners, in the Senge Forrester lineage.
We are delighted to share insights into how systems thinking can be used as a research methodology—moving beyond reflection, into structured, evidence-based intervention. This work pioneers new ground for how governments, businesses, and communities can approach complex, large-scale challenges.
It aligns with Peter Senge’s long-standing call to integrate systems thinking with robust research and practical application. This approach has gained recognition within the global Society for Organizational Learning (SoL) community and highlights the urgent need for more researchers and practitioner-leaders to co-create solutions across domains.
“This is not just a study. It is a prototype for how learning, leadership, and structure can come together to solve problems that have defied generations.”
Supporting Links
CORE LINK – UNEMPLOYMENT STUDY
Part 1 – Current Situation: https://sheilasingapore.blog/addressing-persistent-unemployment-in-botswana-a-systems-thinking-approach-part-1/ (You are here now)
Part 2 – Areas of Leverage Interventions: https://sheilasingapore.blog/addressing-persistent-unemployment-in-botswana-a-systems-thinking-approach-part-2/
SUPPORTING LINKS – Governance & value chain structures as well as public sector and citizen reforms required to foster private sector lead in the economic transformation of the country:
Cross-Sectoral Growth Planning and Governance Structure: https://sheilasingapore.blog/2025/06/26/when-the-world-speaks-governance-bw/
What the Public Sector Can Do To Get Ready to Let the Private Sector Lead: https://sheilasingapore.blog/2025/06/04/when-the-world-speaks-national-development/
📖 Index – Part 1: Understanding the Design Flaw
What We’re Missing
Why unemployment persists despite decades of investment
A Systems View
Framing unemployment as a systemic design issue, not individual failure
Why the Economy Isn’t Absorbing Labour
The mismatch between GDP growth, employment, and sectoral profitability
The Circulation Crisis
How money flows out of the economy, weakening internal productivity loops
From Retail-Led Growth to Production-Led Resilience
Why agriculture and manufacturing must be restructured to drive sustainable employment
A Learning Milestone in Systems Thinking
How this study breaks new ground in national application of The Fifth Discipline
Opening Paragraph: Setting the Puzzle
Botswana has seen five decades of investment, aid, and policy reform—but unemployment remains stubbornly high. This isn’t due to lack of effort or funding. It’s something deeper—something structural.
Section 1: What We’re Missing
“Over five decades, Botswana has attracted billions in investment and international aid. The country has built infrastructure, expanded education access, and grown GDP per capita. Yet unemployment continues to rise, and the economy feels increasingly unable to absorb the talents of its people.”
Investments to-date (1960s–Present)
Since Independence, Botswana has received an estimated USD 1.2 trillion (≈ P16 trillion) in investments, government spending, and aid. Over the same period, our population has grown from approximately 580,000 in 1966 to around 2.7 million today. This translates to roughly USD 600,000 (≈ P8 million) invested per person over five decades—excluding inflation adjustments (sources: The Guardian, Reuters, Wikipedia).

As of Q1 2024, approximately 504,738 individuals are formally employed in Botswana—defined as those holding wage or salary jobs in the formal sector (VCDA.afdb.org, Trading Economics, Botswana LMO).
To put this in context:
- The average monthly wage in the formal sector is P7,149 (~USD 500) (Stats Botswana Q1 2024, ILO, Botswana LMO).
- Botswana’s total labor force is estimated at 1,173,186 individuals.
- Therefore, only 43% of the labor force holds formal employment.
This is clear evidence that decades of investment have not translated into shared prosperity.
Despite numerous policy interventions, unemployment in Botswana has remained persistently high. With just 43% formally employed, and an estimated 1.5 million working-age individuals, this leaves 57%—nearly 6 in 10 employable people—without access to sustainable income.
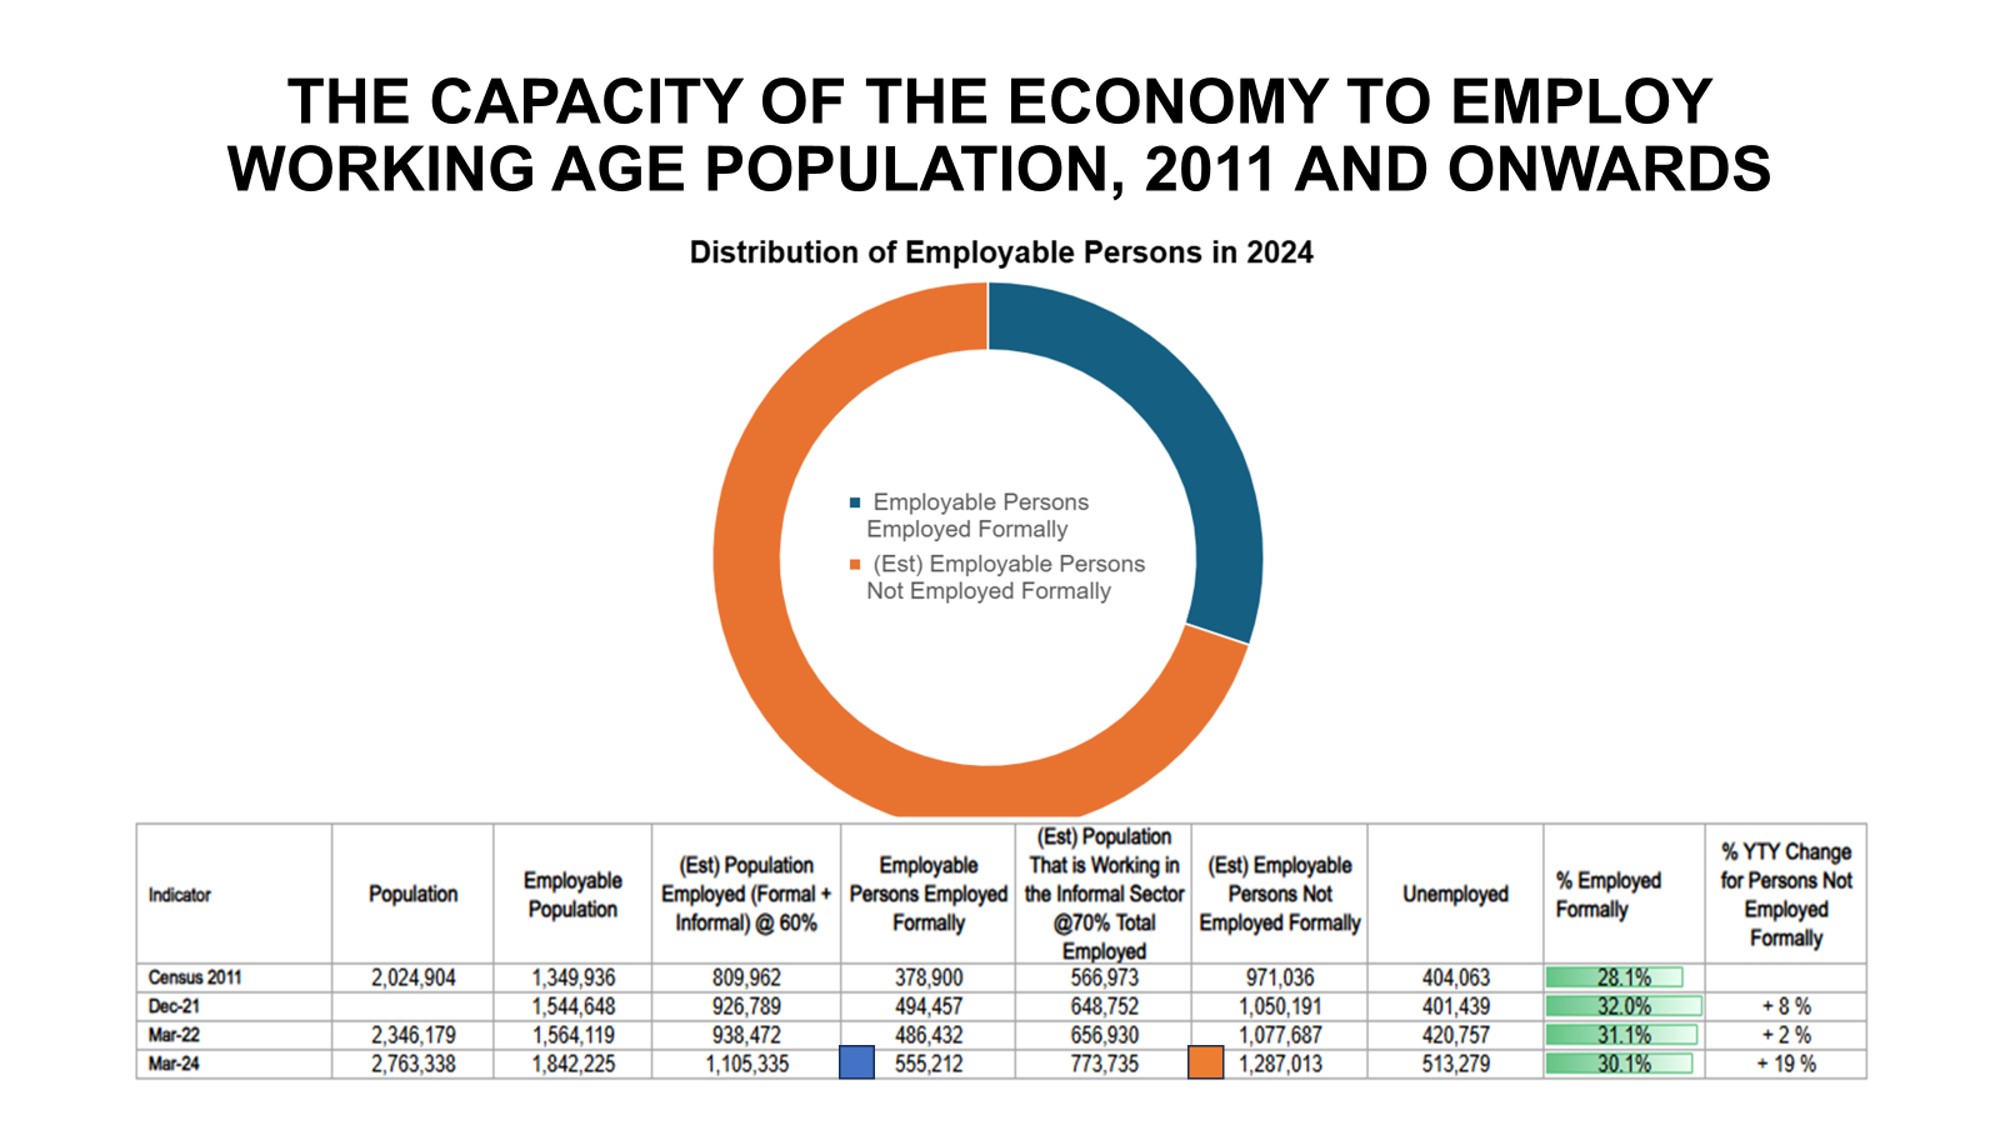
“Our challenge is not the absence of effort or policy. It is the absence of a structure that is designed to translate growth into widespread, sustainable income.”
“Formal employment absorbs less than half the country’s working-age population. And of those absorbed, most are concentrated in a handful of public sector or capital-intensive industries that don’t scale with population growth.”
“The labour market isn’t broken because people are lazy. It’s broken because it was never structurally designed to absorb everyone.”

Here is the combined graph showing:
- Botswana’s GDP (in billions of BWP, left Y-axis)
- Population dynamics (right Y-axis), broken down into:
- Formal employment
- Non-formal employment
- Unemployed
- Total population
This visual illustrates:
- Sharp GDP growth over time, especially post-1990
- Stagnant formal employment despite economic growth
- Rising unemployment and non-formal employment indicate structural absorption issues
“We continue to build systems that reward GDP growth, but not labour absorption. The mismatch is systemic, not accidental.”
Section 2: A Systems View
“What if unemployment in Botswana isn’t simply the result of failed programmes or policy gaps? What if it is the predictable outcome of how the system is designed?”
(Part 1)
The study draws on insights from Peter Senge’s The Fifth Discipline, particularly its emphasis on systems thinking—a way of seeing problems not as isolated events, but as patterns produced by structures, delays, and feedback loops.
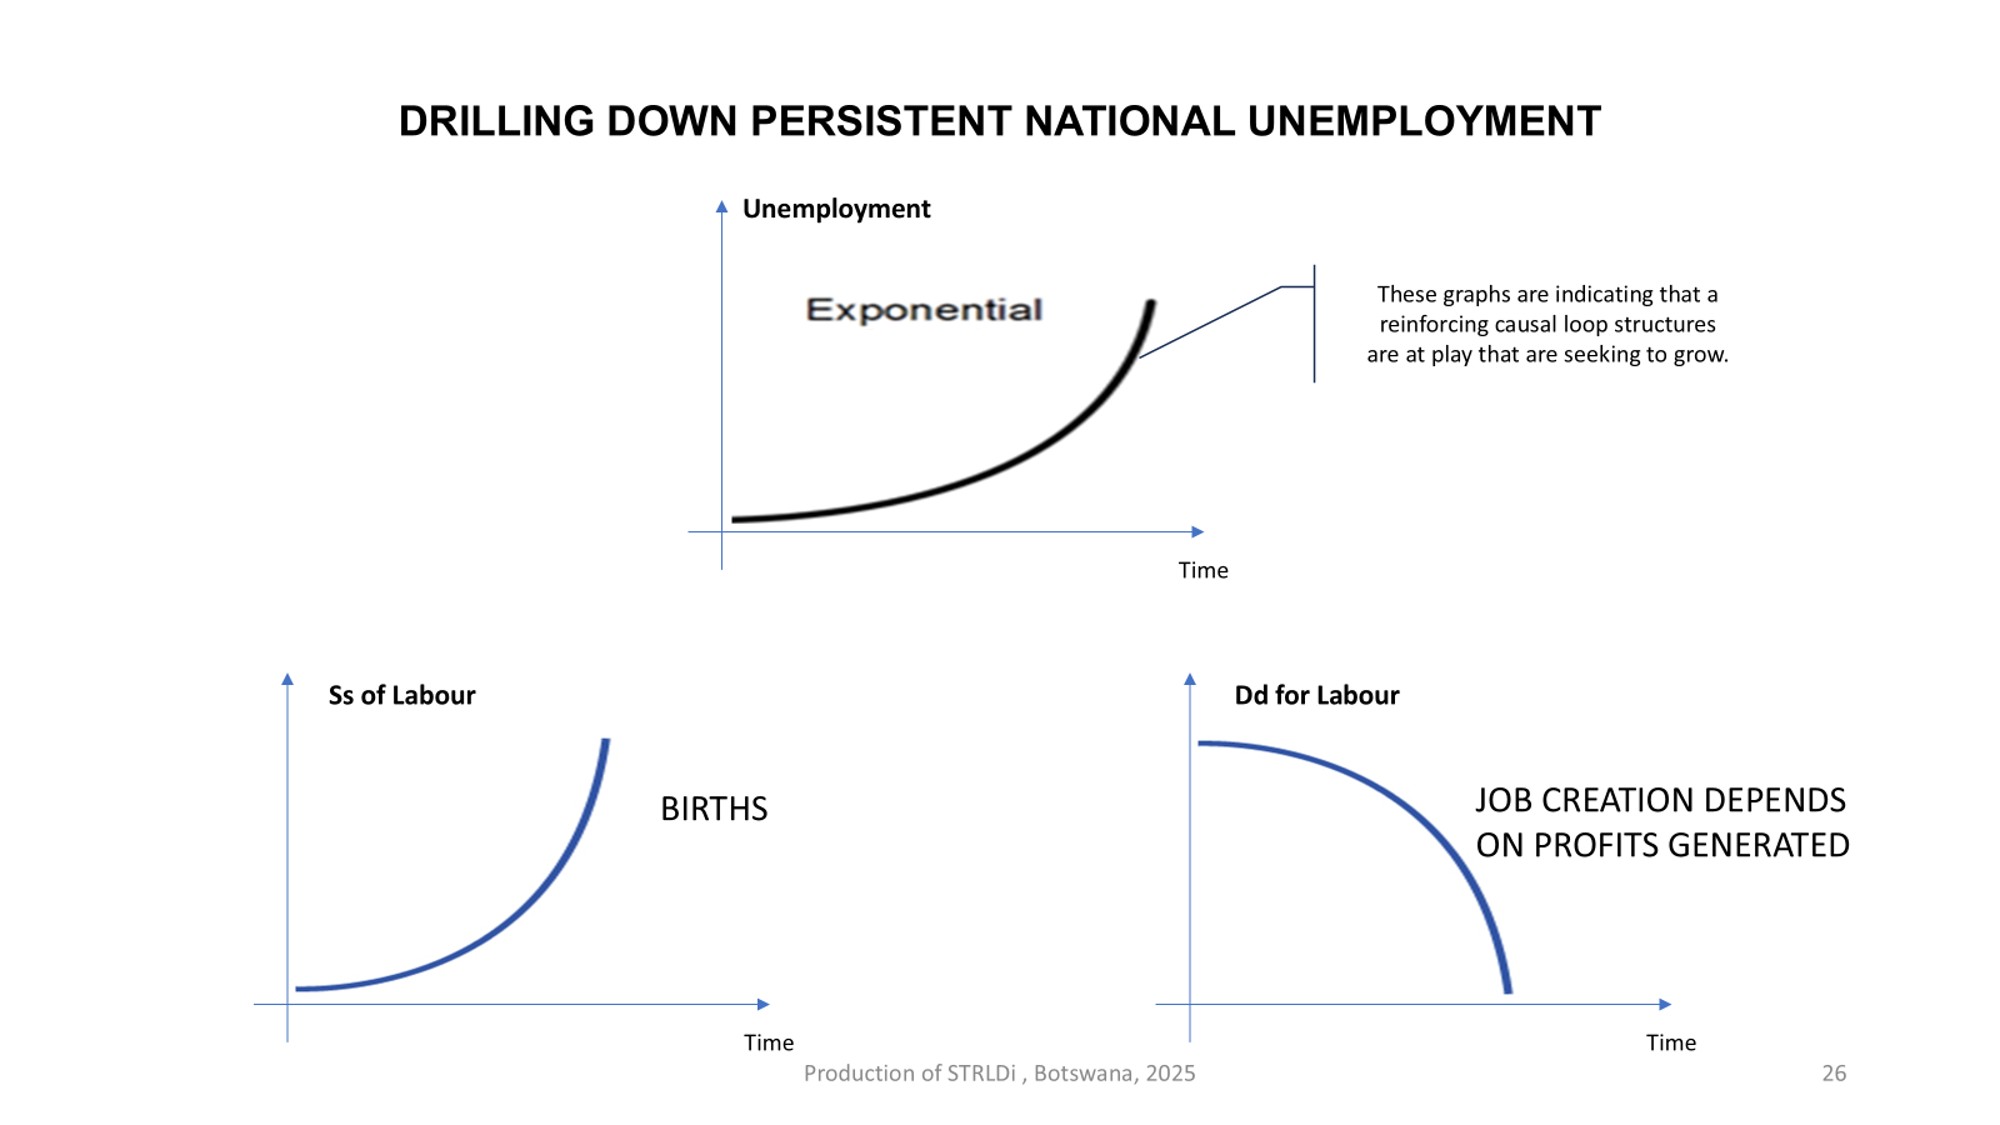
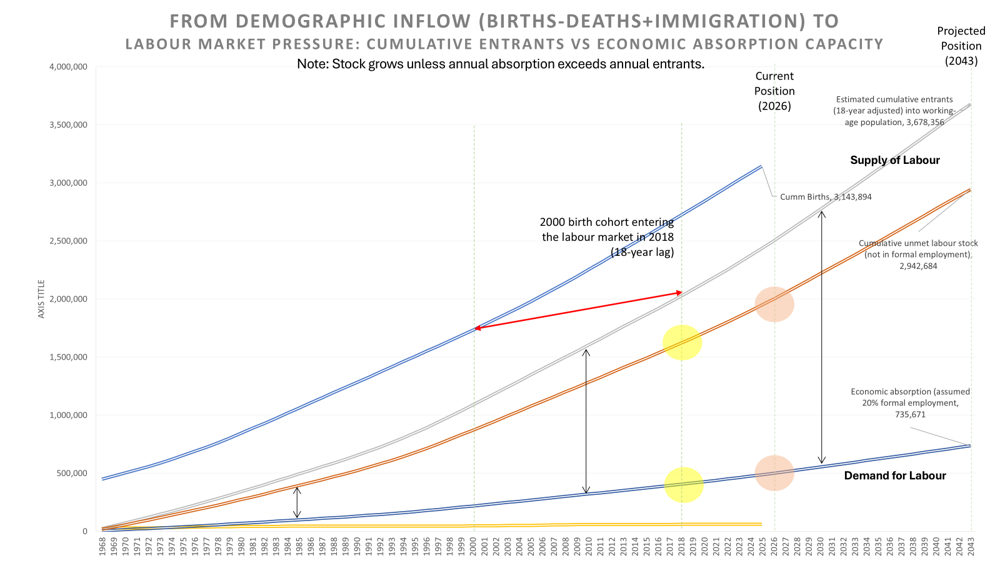
📊 From Demographic Inflow to Labour Market Pressure
This Behaviour Over Time (BOT) graph traces the structural build-up of unemployment in Botswana by comparing cumulative labour supply (driven by births, deaths, and immigration) against economic absorption capacity (formal employment).
The upper trajectory represents the supply of labour — a steadily rising curve shaped by demographic inflows. Notably, each birth cohort enters the labour market approximately 18 years later, creating a predictable and continuous increase in entrants over time. This growth persists regardless of leadership or policy cycles.
The lower trajectory reflects the demand for labour — the economy’s ability to absorb workers into formal employment. While this line also rises, it does so at a much slower pace, revealing a persistent gap between entrants and absorptive capacity.
The widening space between these two curves represents the cumulative unmet labour stock — individuals who are not absorbed into formal employment. By the current position (2026), this gap has grown significantly, and projections to 2043 show it continuing to expand if the structure remains unchanged.
A critical feature of this graph is that it shows stock accumulation, not just annual flows. Even if job creation improves in a given year, the backlog continues to grow unless annual absorption exceeds annual entrants — a threshold that has not been met.
The highlighted points along the curves draw attention to specific periods where:
- Labour supply accelerates due to demographic momentum,
- Absorption remains constrained, and
- The system quietly compounds pressure over time.
“Systems thinking helps us move beyond symptoms. It challenges us to ask: What are the underlying structures that keep producing the same results—even when we change the players, the funding, or the policies?”
(Part 1)
What becomes clear is that unemployment in Botswana is not a short-term fluctuation but a structural outcome. The pattern has remained consistent across policy shifts, economic cycles, and leadership changes — indicating that the causal structure itself is driving the behaviour.
Left unchecked, this structure will continue to steer future outcomes along the same trajectory.
The opportunity, however, lies in seeing it clearly. Once the structure is understood, the direction of the system can be deliberately changed.
The unemployment study does not treat joblessness as a standalone issue. Instead, it approaches it as a system-wide pattern—shaped by how we educate, govern, allocate capital, and design labour absorption pathways.
“We must shift from treating unemployment as a problem to be solved, to seeing it as a system to be redesigned.”
- Circular traps within the system (e.g., weak education feeding low productivity)

“Unemployment persists not because of individual failures—but because of reinforcing loops built into the system.”
Section 3: Delays, Stocks, and Structures
One of the most overlooked dynamics in Botswana’s unemployment crisis is delay—the long and predictable time lag between population growth and job readiness.
“We know when children are born. We know how long it takes to educate and prepare them for the workforce. Yet national economic planning treats workforce entry as a short-term policy issue, rather than a structural inevitability.”
This is a classic stock-and-flow problem:
- The stock is the growing pool of working-age individuals.
- The flow—job creation—has not kept pace with this growth.


Delays between population growth and job readiness
But the challenge runs deeper. Even when new entrants are ready to work, Botswana’s economy struggles to absorb them. The missing link? The country’s capacity to scale production and market reach.
Production Constraints and Market Access
Botswana’s enterprises—particularly in manufacturing and agriculture—have not been able to consistently meet regional and international standards in quality, speed, and output volume. This is not due to lack of ambition, but to the limited readiness of the workforce to perform at scale. Even where isolated excellence exists, system-wide performance is weak.
“When firms can’t meet standards consistently, they can’t retain or expand markets. And without markets, there’s no growth. Without growth, there’s no hiring.”
This creates a self-reinforcing loop:
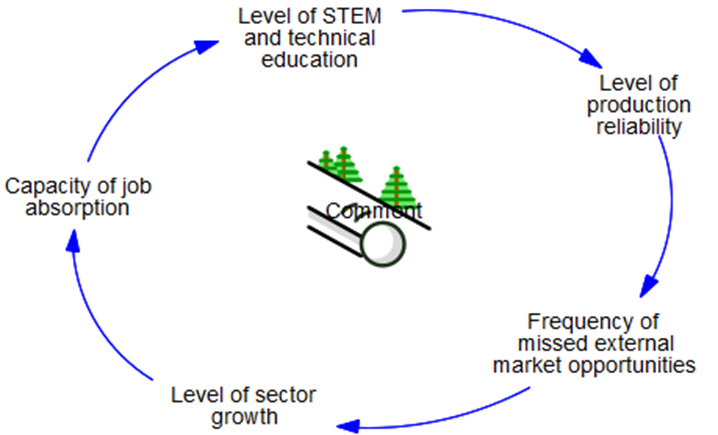
As a result, firms choke themselves out of opportunity—not because of external shocks, but because of internal misalignments between labour, process, and market demand.
Evidence from Sector Data
The study’s behaviour-over-time graphs show that even with investment, manufacturing and agriculture have failed to generate sustained profitability as national sectors.
THE CAPACITY OF ECONOMIC SECTORS TO CREATE EMPLOYMENT
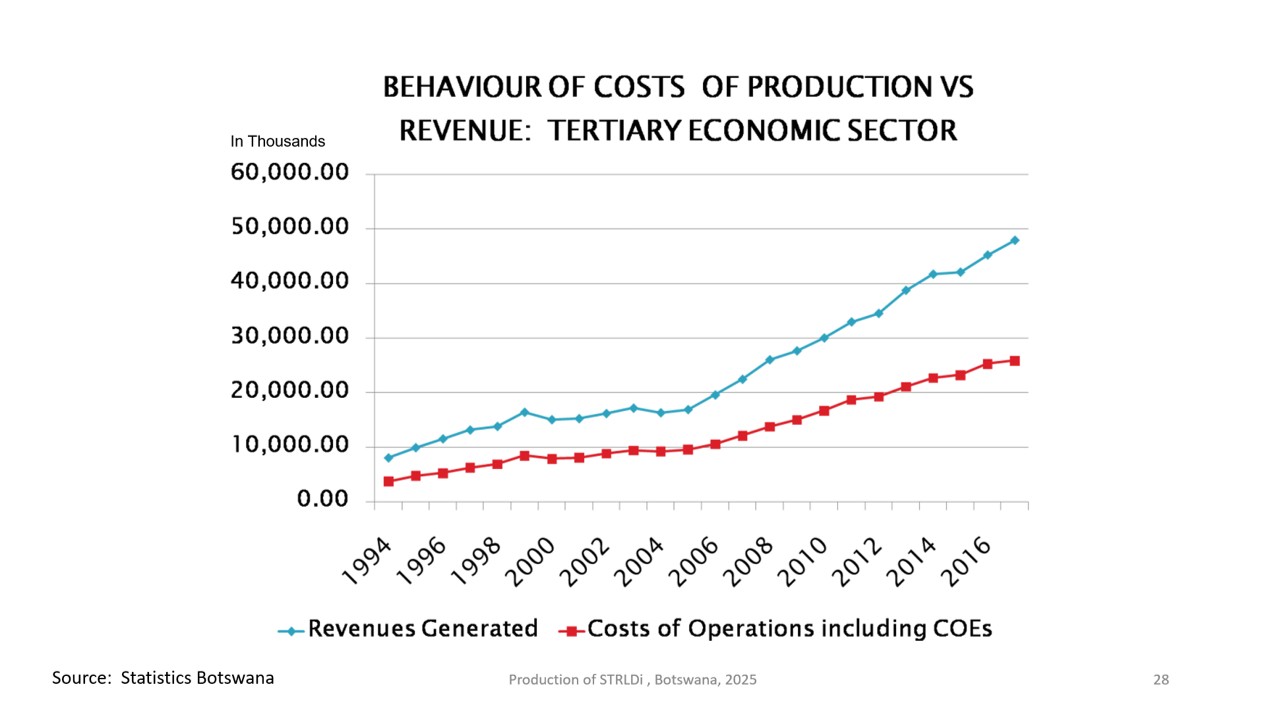
Since surpassing the mining sector in 2008, retail has become the leading driver of Botswana’s economy. Its continued growth reflects the rising influence of commerce, services, and consumer demand in shaping economic progress. Unlike mining, which depends on finite resources, the retail sector thrives on innovation, entrepreneurship, and the ability to respond to evolving needs. With revenues steadily outpacing costs, retail offers strong potential for job creation, business expansion, and economic resilience. Targeted investment in skills development, digital transformation, and local enterprise growth can further strengthen this vital sector.
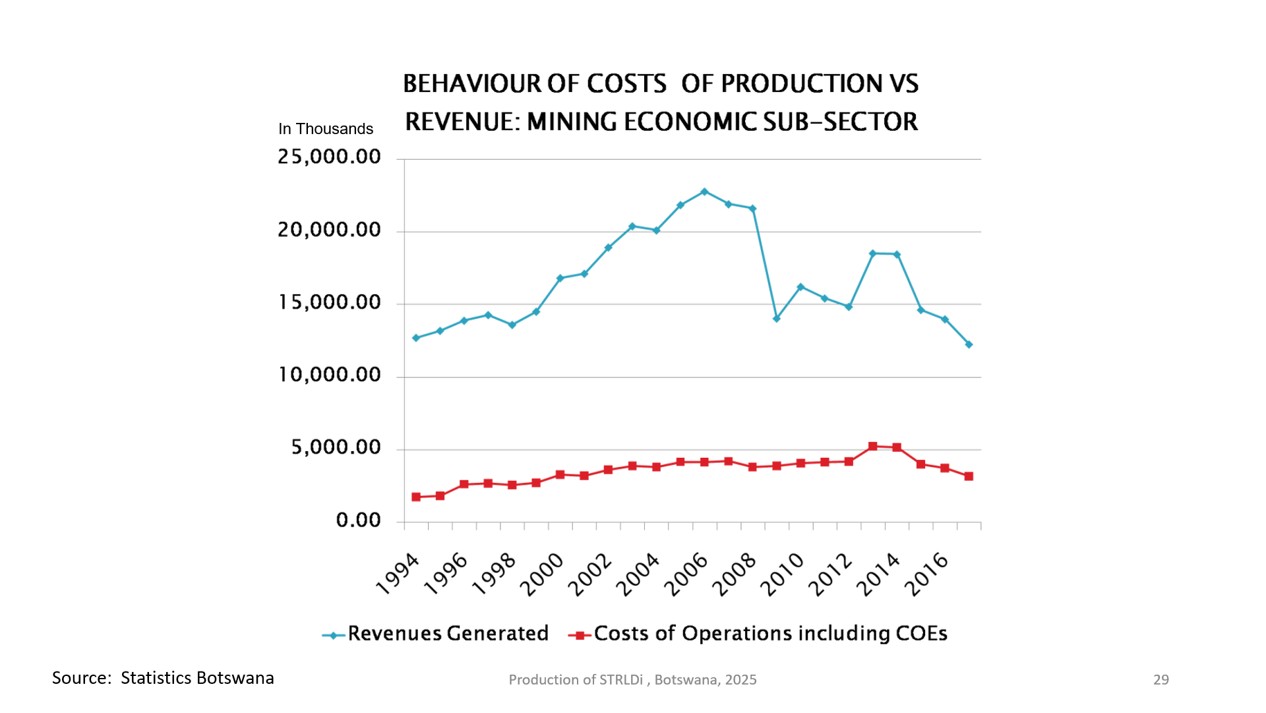
Once the backbone of Botswana’s economy, the mining sector has faced growing volatility since the 2008 global financial crisis. Revenues have fluctuated, and lab-grown diamonds are gaining ground with global consumers due to their lower cost. While a recovery remains possible as global markets improve, the sector has shown no sustained growth over the past two decades. This prolonged uncertainty underscores the urgent need for economic diversification and greater investment in industries that offer long-term stability and resilience.

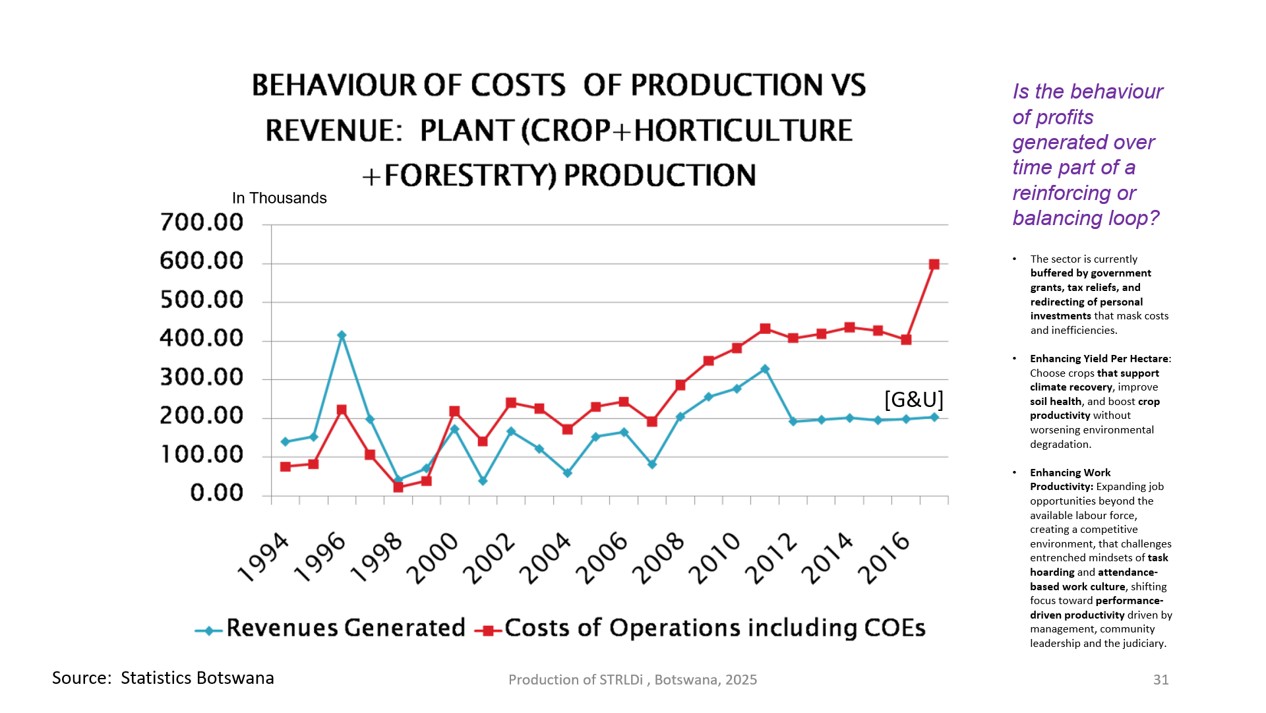


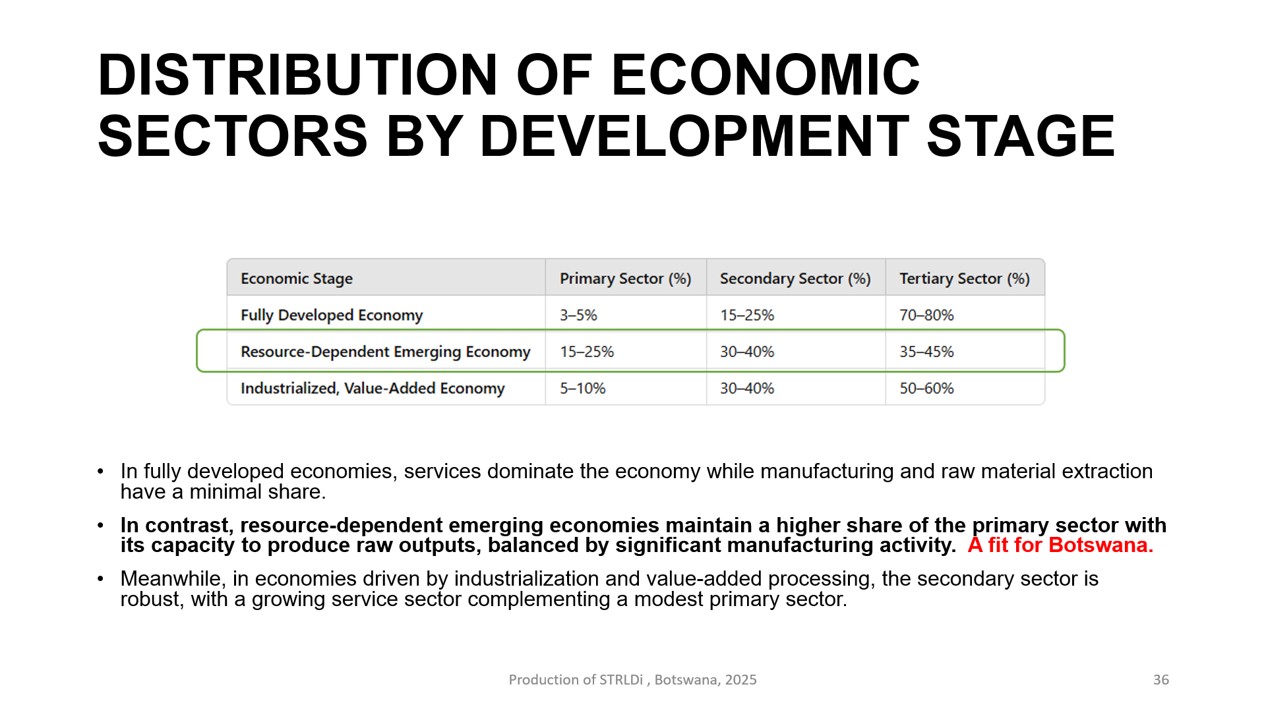
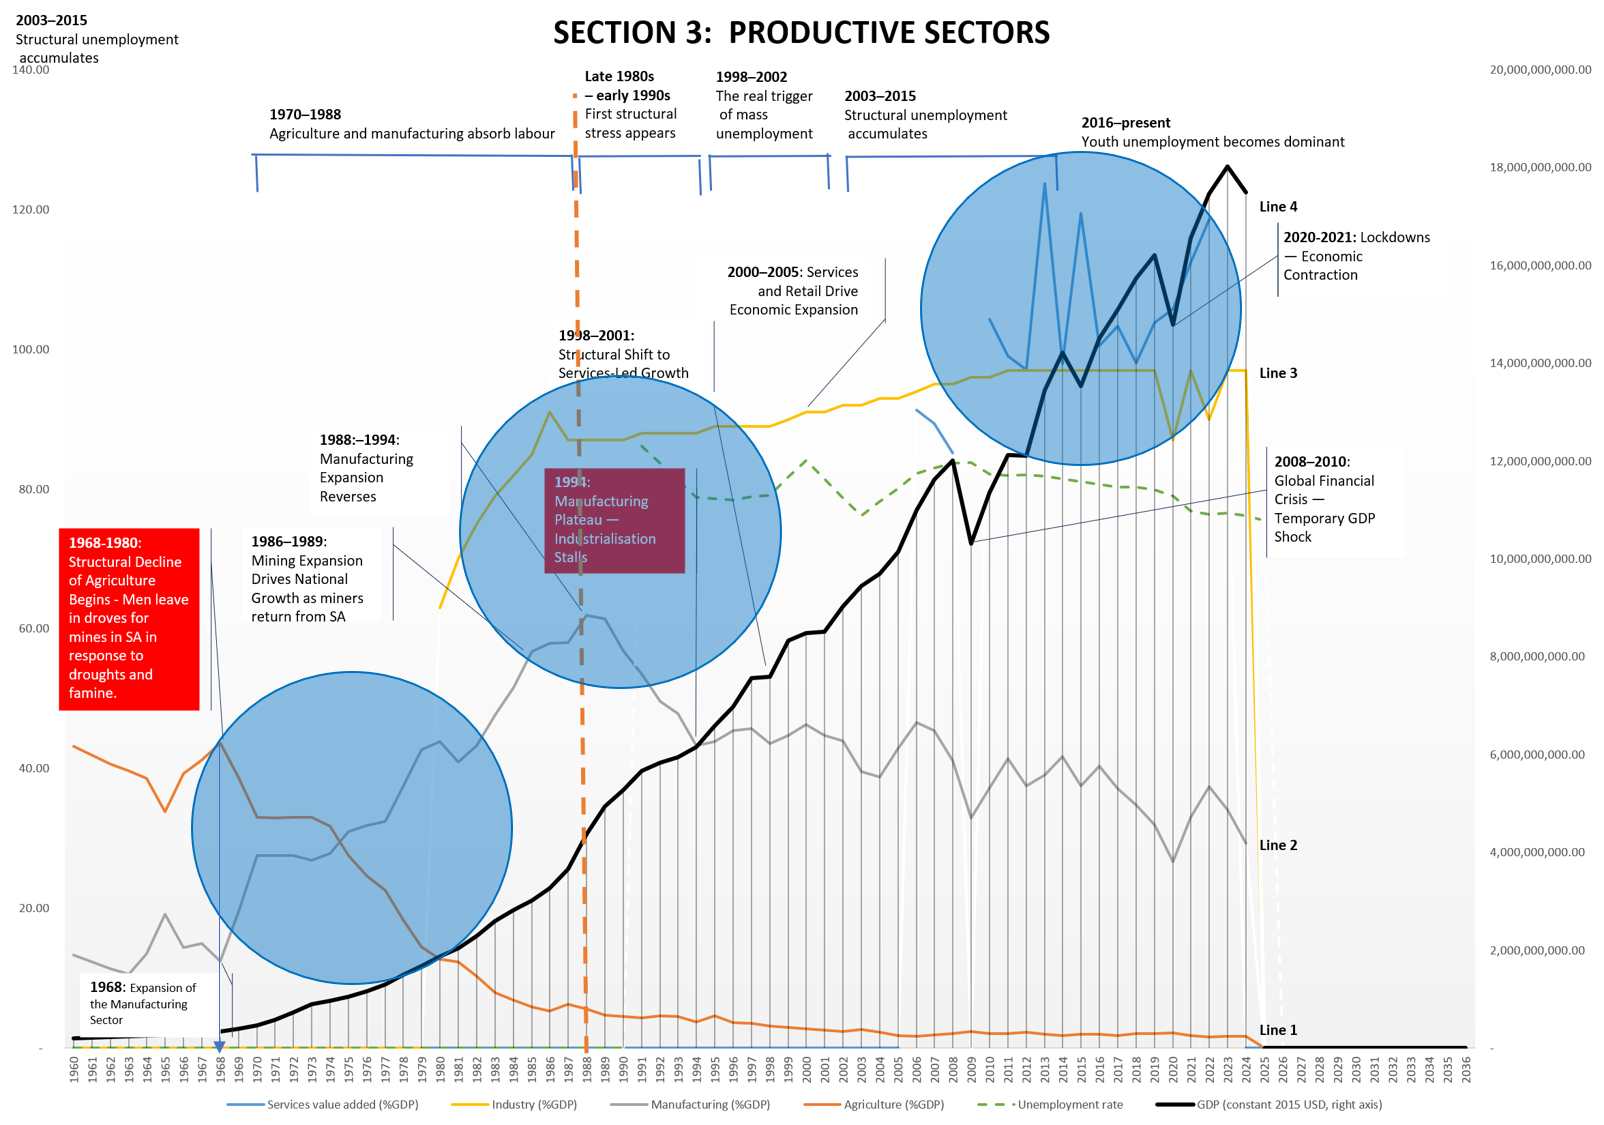
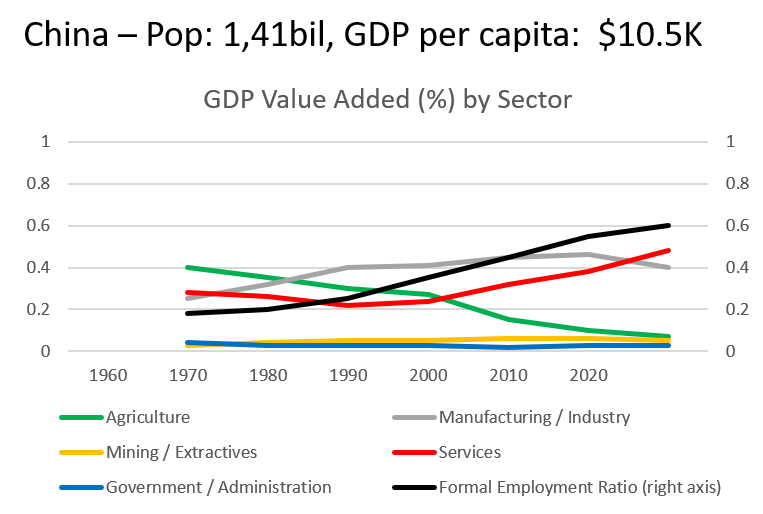
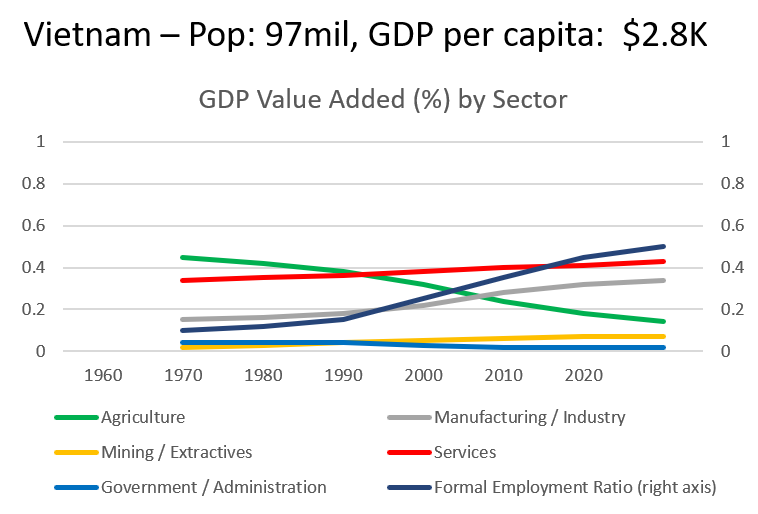
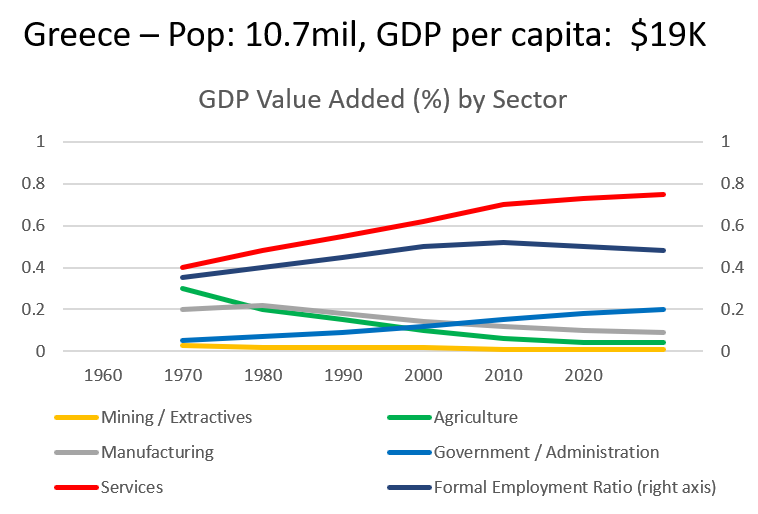
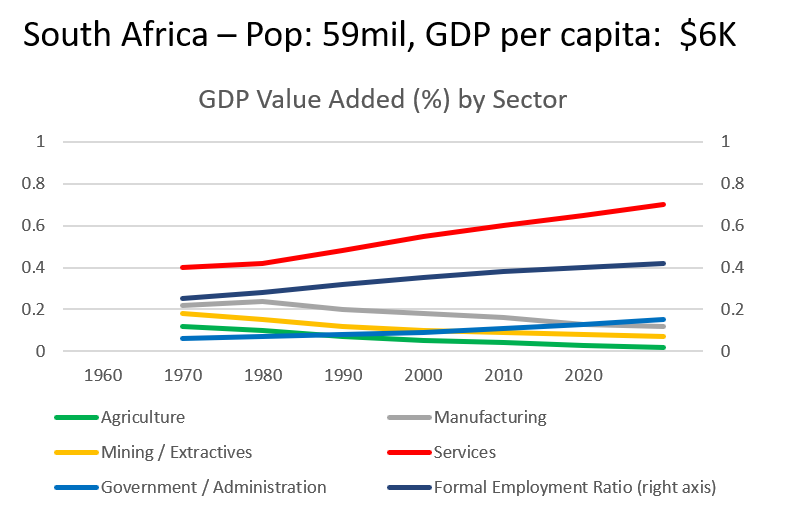
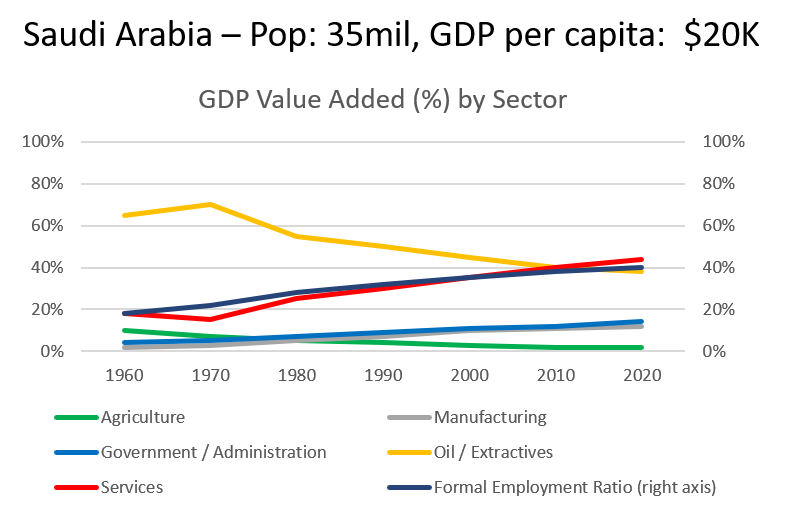
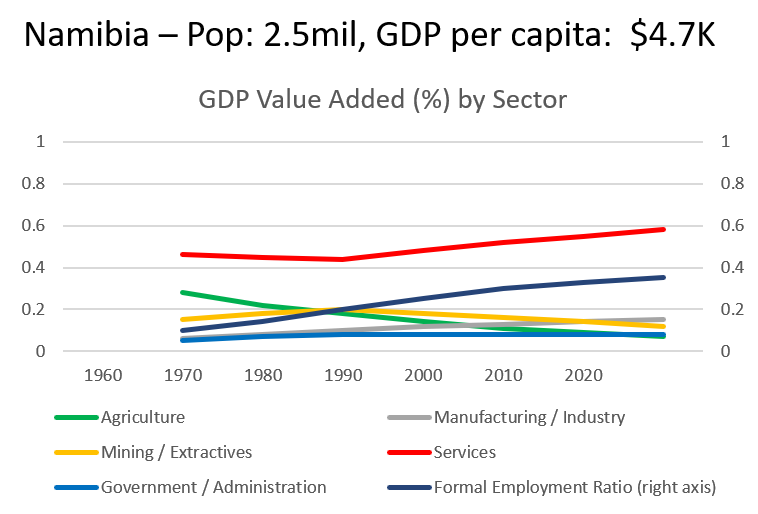
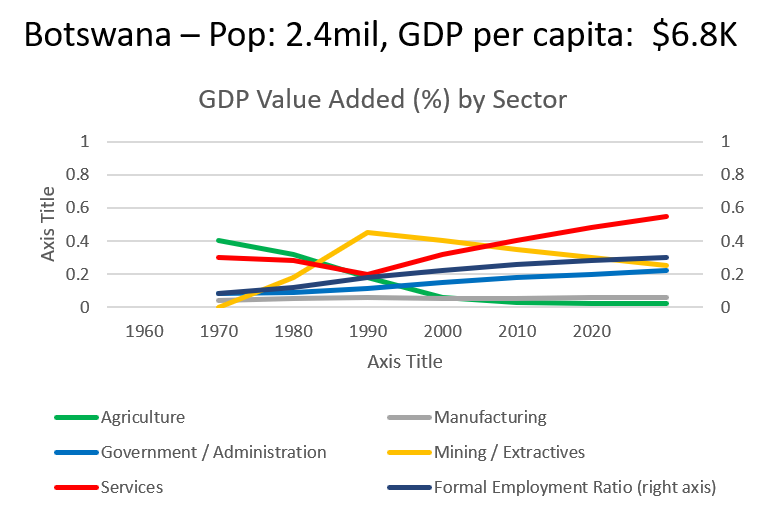
Resource-dependent emerging economies often balance raw material production with a strong manufacturing base to drive growth. Botswana, centrally located and landlocked, holds untapped potential as a regional hub for both agriculture and manufacturing, offering vital employment opportunities.
However, these sectors have struggled to take off. They contribute less than a tenth—and in some cases as little as a fiftieth—of what the retail sector generates. As a result, job creation has stalled. Agriculture and manufacturing have yet to establish profitable, scalable business models capable of supporting long-term economic growth (G&U).
To fully realize its potential, Botswana must restructure its agriculture and manufacturing sectors to ensure they are both competitive and sustainable.
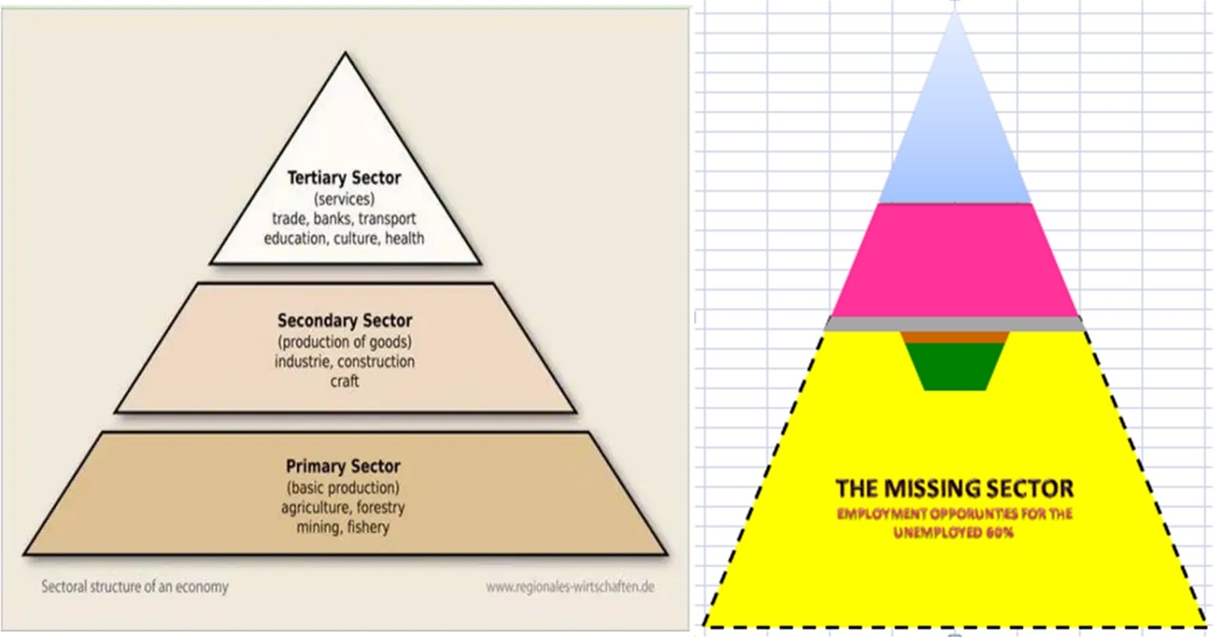
By contrast, extraction-based industries (right diagram) are typically capital- and technology-intensive, employing fewer people and depleting the natural resources essential for building a resilient, job-creating economy.
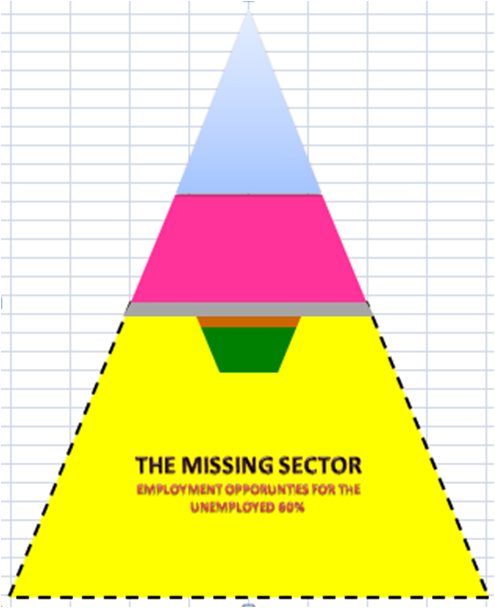
(AS OF THE LAST CENSUS YEAR IN 2011) PRESENTED BY ECONOMIC SECTORS.
IT ALSO INCLUDES THE MISSING SECTORS.
IT SHOWS THE SCALE OF THE UNEMPLOYED WHEN THE FOUNDATION SECTORS ARE MISSING.
The grey, brown, and green portions represent the sizes of the manufacturing, mining, and agriculture sectors’ ability, respectively. These sectors should be readied to absorb unemployment.
https://en.wikipedia.org/wiki/Botswana
The Circulation Crisis: When Value Doesn’t Flow
When Earning Isn’t Enough: The Circulation Crisis
Botswana has built an impressive track record of export-led earnings and prudent fiscal management, but a deeper issue persists beneath the surface: the money we earn does not stay in the economy long enough to generate sustained impact. Instead, it exits almost as quickly as it enters—through imports, repatriated profits, external contracts, and other financial leakages. This pattern undermines the very purpose of economic growth. It’s not that Botswana doesn’t earn—it does. The problem is that those earnings don’t multiply within the local economy, depriving it of the fuel needed to create jobs, deepen industries, or uplift communities. This paper unpacks the scale of that leakage, where it goes, what remains, and what must be done to reverse it.
Exporting Wealth, Importing Dependency
It is a fair and data-backed observation that a substantial share of the income Botswana earns—whether through exports, government revenue, or trade—does not stay within the economy but instead exits rapidly. This dynamic is particularly evident in years like 2022, when Botswana exported approximately USD 8.9 billion worth of goods, yet spent about USD 8.7 billion on imports. That means nearly every pula earned through international trade was matched by a pula spent abroad. The result is a system where revenues generated through diamonds and other exports flow out just as quickly via imported fuel, machinery, vehicles, food, and services, with little absorption into domestic value chains. Without robust processing, manufacturing, or reinvestment capacity, the economy behaves like a conduit rather than a container—passing wealth through without compounding its benefits locally.

How Much Leaves, How Little Stays
In estimating the leakage, if we treat total exports (≈ USD 8.9 billion) as a proxy for total revenue, and combine import spending with factors like profit repatriation, external contract payments, and debt service, a conservative estimate suggests that at least 60–80% of this national income leaves the country. That means only 20–40% of what Botswana earns circulates internally—supporting government wages, local consumption, and limited domestic procurement. In 2022, for example, government revenue stood around USD 5.5 billion, while import bills were higher still at USD 8.7 billion—making imports roughly 158% of revenue. This points to a structural imbalance where even sovereign income is insufficient to retain wealth domestically.
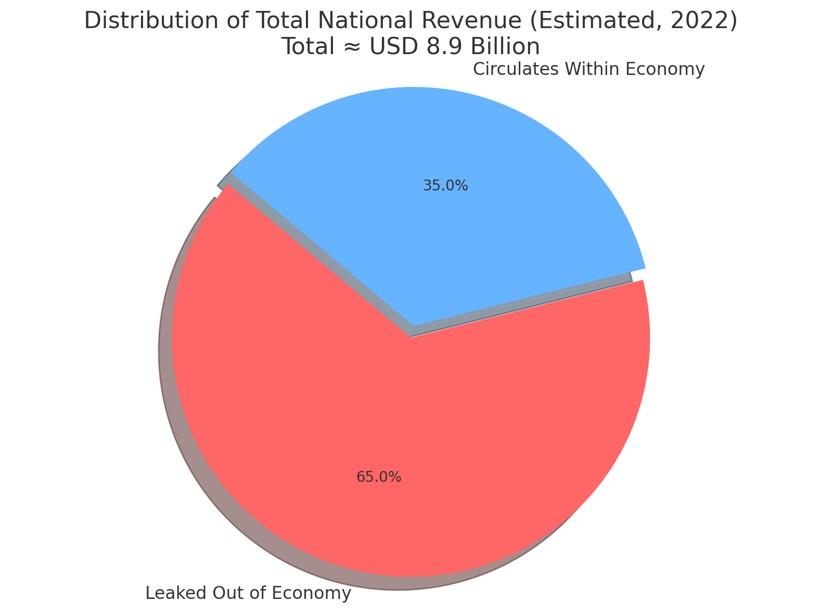
The Need to Build Domestic Multipliers
What little money remains is spent primarily on public salaries, social services, and recurring operational costs, which in turn often rely on imported inputs—thereby creating additional layers of leakage. Without strengthening Botswana’s domestic production capacity—especially in manufacturing, agriculture processing, and infrastructure development—these funds will continue to create jobs and incomes elsewhere, not at home. The weak local value chain not only limits domestic job creation but also increases vulnerability to external price shocks and supply disruptions. Unless this economic architecture is reshaped to prioritize internal circulation and value capture, Botswana may continue to earn big but circulate little—leaving a growing population without the employment or enterprise opportunities it deserves.
The result? Botswana’s economic engine spins but does not pull. Resources move at the top, but do not multiply across the broader economy.
“We earn, but we don’t multiply. We produce, but we don’t distribute. This is how an economy grows on paper but feels stuck in practice.”
Section 4: What the Study Did
This study set out not merely to document unemployment trends in Botswana, but to reveal the underlying structures that continue to produce them—despite well-intentioned policies, funding, and reform efforts. It applies systems thinking, drawn from The Fifth Discipline by Peter Senge, to diagnose the national economy as a living system—one that has not been designed to absorb its people into meaningful, productive livelihoods.
The study using 20-year data:
- Tracked the disconnect between population growth and employment absorption
- Identified sector-level profitability stagnation, particularly in agriculture and manufacturing
- Mapped the structural traps and feedback loops reinforcing unemployment and low productivity
- Highlighted the circulation crisis—how value generated fails to move across the economy in a way that multiplies opportunity
“The problem isn’t a lack of effort—it’s that we’re working inside a system that was never designed to deliver the outcomes we now expect.”
At its core, the study surfaces three persistent systemic failures:
The Absorption Gap: There is no built-in pathway to absorb the growing workforce into formal, productive sectors.
The Productivity Trap: Key sectors remain underperforming, not from lack of investment, but from workforce misalignment and poor process standards.
The Circulation Breakdown: Value accumulates in isolated areas without circulating into broader economic and employment growth.
Using systems thinking tools—such as feedback loops, time delays, stock-flow structures, and archetypal traps—the study identifies leverage points that could reverse these patterns:
- Aligning education, training, and production
- Restructuring sectors to reinvest and scale
- Redesigning governance for flow, not fragmentation
Here is the closing paragraph for Part 1, crafted to bring the post to a thoughtful and anticipatory conclusion, while inviting readers forward into Part 2:
Conclusion: Preparing for the Deep Dive Ahead in Part 2
Botswana’s persistent unemployment is not the result of any single actor or decision. It is the outcome of a system whose design has not kept pace with its people. This study reveals that until job creation is structurally embedded—until sectors are rebuilt for absorption, productivity, and flow—the frustration across government, private sector, and households will continue.
But there is a path forward.
Through the lens of systems thinking, we begin to see where leverage lies—not just in programmes or reforms, but in the very architecture of how our economy functions. In Part 2, we examine the specific feedback loops, social disruptions, and sectoral misalignments that reinforce the current state—and explore how these can be shifted.
“The goal is not to fix the old system. It is to redesign the economy so that people—and their potential—are no longer left out of the future.”
Introduction to Part 2
Click here for Part 2 of the article. It covers the next:
- Consideration of Socioeconomic Factors
- Pathways for Change and Empowerment
Yes, we do. Here’s the refined write-up for the section titled:
🎓 A Learning Milestone in Systems Thinking
How this study breaks new ground in national application of The Fifth Discipline
This is the first study of its kind in the field of Learning Organisation. It marks the first large-scale application of Peter Senge’s The Fifth Discipline to a national issue—persistent unemployment—and does so using a full systems diagnosis. This milestone represents not just a personal achievement, but a breakthrough for the global community of systems thinking practitioners.
It demonstrates that the discipline of Systems Thinking can be rigorously applied beyond organizations—into the complex, cross-sectoral domain of national development. For those working on public policy, economic transformation, and institutional renewal, this work offers a new, structured framework for addressing systemic stagnation.
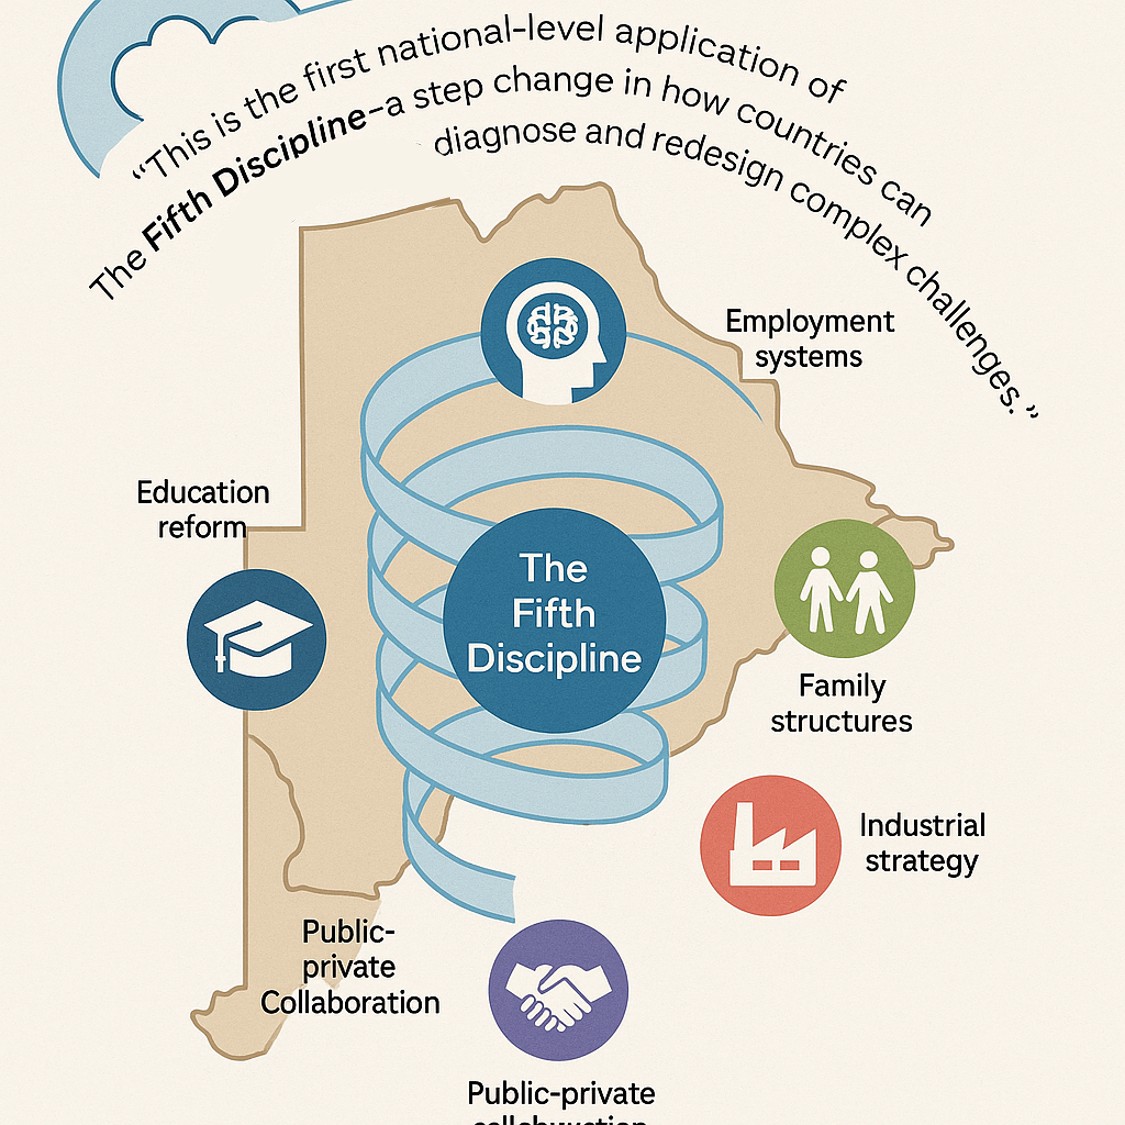
The study aligns with the direction advocated by Dr. Senge and the global Society for Organizational Learning (SoL): pairing systems thinking with robust research methodology. It also underscores the importance of not isolating systems thinking as a “soft” or intuitive practice, but grounding it in structured diagnosis, modelling, and evidence-based design.
🔖 Pull Quote
“This is the first national-level application of The Fifth Discipline—a step change in how countries can diagnose and redesign complex challenges.”
We welcome the opportunity to engage with researchers, educators, governments, and private sector partners who want to better understand this methodology—and consider how it might be adapted to other pressing national or regional challenges. The study offers a replicable approach for countries confronting economic exclusion, sectoral imbalance, or policy fragmentation.
🔹 Technical Appendix Note
Note on Methodology and Assumptions
This Behaviour Over Time (BOT) graph is constructed using cumulative estimates of labour market entrants derived from demographic inflows (births adjusted for deaths and net migration), with an assumed 18-year lag to represent entry into the working-age population.
In the absence of complete year-by-year data, intervening annual variations were smoothed, and estimates were applied in a manner that ensures cumulative alignment with known reference points, including the observed labour market position in 2025–2026.
The demand curve reflects formal employment absorption capacity, based on available employment data and projected growth trends.
The resulting gap represents the cumulative unmet labour stock — individuals not absorbed into formal employment. It is important to note that this is a stock accumulation model, meaning that unless annual job creation exceeds annual entrants, the gap will continue to widen over time.
This model is not intended as a precise yearly forecast, but as a structural representation of system behaviour, allowing for identification of underlying causal dynamics rather than short-term fluctuations.
🔎 Source
Author’s analysis (STRLDi), based on compiled data from:
- Statistics Botswana – Population, Labour Force, and Employment Data
- World Bank / ILO – Labour market and demographic benchmarks
- Ministry of Finance & National Planning (Botswana) – Budget and economic reports
- HRDC (Human Resource Development Council) – Labour and skills data inputs
Model constructed using cumulative demographic inflow (births – deaths + net migration) with an 18-year labour market entry lag, and estimated formal employment absorption capacity.
Share this:


Practicing Mentals Models – A Self Discipline
Here is a clearer, trainee-friendly version a trainer might use when introducing this important point in a workshop:
🌱 Mental Models Are a Self-Discipline — Not Just a Tool You Learn
This is one of the most important things we want you to take away:
Trainers and consultants (like us!) can show you the tools — but we can’t do the inner work for you.
That means you are the one who will need to do the reflecting, questioning, and updating of your own mental models. This is where the real growth happens.
We showed in earlier posts here how this kind of self-discipline shows up in 11 different life situations — from families to work to national policy — and how anyone can start practicing it.
💡 Why This Matters:
- It makes the work open to everyone — not just experts.
- It gives you the power to work with your own experience, even in difficult or sensitive moments.
- It helps you move from just “using the tool” to actually transforming how you think, relate, and lead.
🔧 What This Might Look Like
For each of the 11 situations, we’ll build a guide that shows:
- A real-life example — something that actually happens.
- The common mental model people carry in that situation.
- A practice to help shift it — like journaling, dialogue, or questioning your assumptions in the moment.
- What you need to do for yourself — and what a trainer or coach can only support you with, not do for you.
It’s not about telling you “what to think.”
It’s about helping you learn how to look deeper and where to start asking questions.
🛠️ And What You’ll Need to Succeed
Even people who’ve studied these ideas for years find this hard when they’re tired, stressed, or afraid. You’re not alone.
So to grow this self-discipline, you’ll need:
- A safe mirror — someone who reflects what they see, without judging.
- A steady rhythm — small but regular ways to look at one part of yourself at a time.
- A sense of shared path — it helps to know others are working through this too.
- A combination of Tool + Practice + Companion — that’s what helps the work stick.
Here is a perfect real-life example of why this inner discipline is so important.
Title:
When Mastery Stalls: The Inner Traps We Don’t See Until We Surface Them
A personal journey through mental models, fear, and reclaiming authorship
1. Opening Scene
He had built systems for others. Trained leaders. Helped teams make sense of chaos. For decades, he walked beside ministries, boards, and community organisations, helping them navigate transformation with clarity and rigor. His frameworks made the complex visible. His clients called him a mirror.
And yet, in his own life, a silent question lingered:
Why, despite everything I know, does forward motion feel like dragging a boulder uphill?
It wasn’t burnout. He still believed in the work. The vision was clear. But something deeper felt… stuck. A dissonance between what he knew to be true and what his own body and choices kept doing. The projects stalled. The outreach was hesitant. The money didn’t flow. He poured in effort but avoided invoices. He labored in silence, but recoiled at public recognition.
He thought he was simply tired.
But the truth was more subtle.
He was trapped.
2. The Trap He Didn’t Name
For years, he chalked up the drag to external challenges: resource constraints, poor hiring fits, delayed contracts. All valid. But incomplete.
The real barrier was hidden.
And it took an old, unresolved memory to shake it loose: a national newspaper article that had appeared years earlier, placing his name on the front page, accusing the government of paying him exorbitantly.
The article misrepresented the facts. It implied that he was earning a salary larger than the President’s. It failed to mention that he was only paid per engagement day, not daily. It cited no feedback on his actual performance. And it ignored the results his work had contributed to: the first national systems training programs, early frameworks that eventually shaped the country’s unemployment and manufacturing strategies.
The government said nothing in his defense. The silence was deafening.
In the years that followed, he continued contributing. His study on unemployment was completed in 2018. His ideas quietly shaped policies across food security and skills development. But something inside him had shifted.
He stopped asking to be paid. He stopped seeking visibility. He quietly told himself: _”I’ll keep giving. Maybe one day, they’ll see.”
He didn’t know it yet, but this was no longer strategy. It was avoidance.
3. Reframing Through Reflection
When he revisited this incident recently, he did it through the tools he had taught so many others: the Ladder of Inference and the Left-Hand Column. This time, he used them on himself.
A. Ladder of Inference: The National Newspaper Article
Observable Data:
- National newspaper article questioned the value of his contract and misrepresented the fee structure.
- The article lacked detail on performance, context, or contractual terms.
- No formal response from the government.
Selected Data:
- The headline number ($1000 per day)
- Lack of response from the government
- Public silence
Meaning:
- I was exposed unfairly.
- The government was embarrassed by me.
- They agreed with the article.
Assumptions:
- If I promote myself, I will be shamed again.
- People will think I’m exploiting the country.
Conclusions:
- I should avoid public recognition.
- I must stay quiet and low-profile.
Adopted Beliefs:
- Visibility is dangerous.
- Success attracts attack.
Actions:
- Undercharge.
- Avoid pitching.
- Let people use my work freely.
B. Left-Hand Column Reflection: The Newspaper Article Incident
Right-Hand Column (What I said or showed):
- I kept working.
- I said nothing about the article.
- I quietly completed my unemployment study.
Left-Hand Column (What I thought or felt):
- I felt betrayed.
- I was furious and deeply hurt.
- I feared being seen as corrupt or opportunistic.
- I told myself: “Don’t draw attention.”
- I wanted them to see my value without me asking.
C. Emerging Themes
- Silence as self-protection
- Fear of public perception
- Unconscious belief that value must be proven in suffering
- Discomfort with receiving, especially money
D. What Could Be Reframed?
- I was not the author of that article.
- I was not wrong to be paid for value.
- My work created national impact.
- My silence did not earn respect; it silenced me.
E. The Reframed Internal Dialogue
“That article was misinformed. It simplified something complex and ignored my intent, the terms of the contract, and the impact I created. But it no longer gets to shape how I see myself.”
“The silence that followed — from government, media, or allies — hurt deeply. But their silence is not my shame to carry.”
“I don’t need to prove myself again. I need to stand clearly for what I’ve already done — and invite the next chapter to be one of reciprocal respect.”
F. New Ladder of Inference
Observable Data:
- My work contributed to national impact.
- There was public misunderstanding.
- The government used my insights despite the noise.
Selected Data:
- My contributions.
- Their uptake.
- My ongoing relevance.
New Meaning:
- I bring clarity and value.
- Misunderstanding happens.
New Assumptions:
- I deserve fair compensation.
- I can speak clearly about my work.
New Conclusion:
- It is time to invite right relationships.
New Action:
- Present my value transparently.
- Seek partnerships with integrity.
4. The Missing Link
What had stalled his personal mastery was not vision, passion, or skill. It was an unseen belief lodged deep in the emotional memory of betrayal. A fear that to stand tall would attract humiliation.
Only when this was surfaced, reframed, and replaced could energy begin to move again. Only then did the calls begin to go out. The invoices get issued. The messages reappear on his site.
Personal mastery is not blocked by a lack of discipline. It is blocked by unchallenged beliefs formed in pain.
The discipline of mental models gave him the mirror. And in it, he reclaimed motion.
5. Closing Note (in first person)
This is my story. But I now believe it is the story of many.
We don’t stall because we lack ambition. We stall because somewhere, something told us that movement is dangerous.
But once we can name that voice and show it what is now true, we can walk forward again. Not into the world’s approval. But into our own clarity.
I’m not afraid to tell it anymore.
And I hope it invites you to begin your own.
Share this:


#13: Testing the Limits of Each Thinking by Situation Series: Manipulation
Manipulated and Masked Mental Models
👭Deliberate narrative shaping to preserve power or control across social layers
The final category, Manipulated and Masked Mental Models, is charted — showing how the practice of narrative control to preserve power spans families, organisations, governments, and global relations. This category rightly sits as cross-cutting, because it operates at every level where perception, trust, and power converge.
Stories we hide or mask from others to mislead or manipulate represent a deliberate shaping of mental models — not just our own, but others’ as well. This behavior can occur across all levels, but its intentional nature means it’s especially relevant in contexts where power, perception, and control are central.
Where It Fits:
Rather than a single level, this category cuts across all levels — but is especially prevalent in:
- Siblings & Families: Emotional manipulation to maintain family roles or favoritism.
- Organisations: Leadership or staff masking intentions to maintain control or avoid accountability.
- Governments/Nations: Propaganda, performative harmony, or suppression of dissent to preserve legitimacy.
- Global: Donor nations controlling narratives about development aid or interventions.
Sample Situations:
| System Level | Masking Behavior |
|---|---|
| Individual | Hiding vulnerability to maintain authority or self-image |
| Family | One sibling gaslighting another to maintain status or influence |
| Organisation | Justifying policies by masking economic interests as a public good |
| Government | Justifying policies by masking economic interests as public good |
| Global | Framing extractive development partnerships as “mutual benefit” |
Assumption: “Truth must be controlled to maintain order or advantage. Transparency weakens authority.”
Self-discipline: Distinguish between protection and manipulation; surface the cost of hidden agendas to relational trust and system integrity.
Surfacing this allows new appreciation and empathy for each other’s journeys.
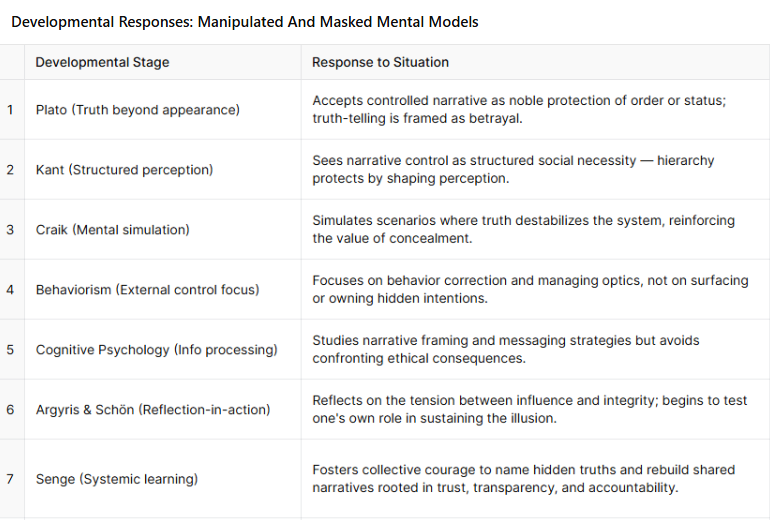


You must be logged in to post a comment.