A farmer hires a young hand. Each night, no matter the weather, the young man goes to bed early. When a storm finally breaks, the farmer panics. He runs to check the fields. However, he discovers that the barn doors are fastened. The tools are secured. The animals are sheltered. The hay is tied down. Everything had been prepared. The young man could sleep when the wind blew, because his work was already in order.
Budgets without backbone
Currently, I observe the following trends in the country. All governments, past and present, have focused mainly on budgeting and disbursing the funds they receive. The machinery is geared to release money and “create a conducive environment.” It monitors. But it does this without actually planning the industry itself.
That is a shame. Because when we avoid planning the industry, we trap ourselves in an endless cycle:
cash allocations that don’t yield repayment,
borrowers who appear to build assets with money that does not belong to them,
and a country that thickens its skin the next time it seeks funding — all without seeing real economic growth.
There is also an unspoken hope that we will be let off the hook because “we are Africans.” But finance does not forgive weak structures.
Dividing what should be united
Each cycle, allocations are trumpeted to youth, women, and farmers. But in reality, these three are not separate categories — they are a family. Women and youth are embedded in family farms. To slice them into compartments for the sake of budgeting is not only wasteful, it is divisive.
True industry planning does not start with who gets the allocation. It starts with building the backbone that ensures profitability for all: demand mapping, planting calendars, logistics, markets, and reinvestment. Once this spine is in place, the benefits naturally flow to every farmer — whether woman, youth, or elder.
Why the backbone is ignored
The deeper reason this backbone is overlooked is the dichotomy we live with as a nation. We underplay the role of STEM in our economy and agriculture. Yet agriculture is one of the industries that most demands a STEM-disciplined approach. This ranges from governance structures down to the farmer’s choice of seed.
When land and GDP are tended by hands guided by STEM discipline, they produce predictability, scaling, and growth. When managed without it, results fluctuate with the weather, pests, and luck.
One hectare, two futures
To make this real: take two farmers, each with 1 hectare.
The STEM-hardwired farmer runs soil tests and balances water precisely. She selects the right seed for climate and disease. She also manages pests with foresight. Over five years, her profits grow steadily from BWP 80,000 to over 100,000.
The non-STEM farmer plants by habit and intuition. Some seasons bring decent returns, others collapse under shocks. Over the same period, his profits swing wildly, sometimes as low as BWP 5,000.
One farmer can reinvest and scale. The other cannot.
STEM as the Backbone
Agriculture is not only about soil and seed — it is about systems, and systems require STEM discipline. From governance down to the individual farmer, STEM makes the difference between sustained growth and endless frustration.
On the farm — with STEM
Seed selection: Matching varieties to soil type, climate, and disease resistance using agronomic trials and data.
Water management: Irrigation calibrated to evapotranspiration rates, soil moisture sensors, and seasonal rainfall models.
Fertilisation: Nutrient application based on soil chemistry analysis, preventing both waste and depletion.
Pest management: Integrated pest management (IPM) using monitoring thresholds and biological controls rather than reacting late with chemicals.
Scaling: Precision data provides confidence to expand from 1 ha to 2, then 10 — with predictable margins.
On the farm — without STEM
Seeds chosen by habit or availability, vulnerable to climate shifts.
Irrigation by “eye” — too much or too little water.
Pests noticed too late, leading to crop loss or costly sprays.
Scaling is a gamble; banks are hesitant to lend.
The result? Inconsistent yields, poor profitability, and farmers dropping out of horticulture.
In the system — with STEM
Data pipelines: Retailers share weekly SKU-level demand, analysed and published as crop calendars.
Forecasting: National dashboards project shortfalls or surpluses, triggering clear import or storage policies.
Logistics design: Cold chain hubs placed using flow models of supply vs. demand, not guesswork.
Finance: Lenders and insurers trust the system because data reduces risk.
In the system — without STEM
Ministries working in silos — Agriculture with farmers, Trade with retailers, no shared demand–supply map.
Imports opened or closed arbitrarily, undercutting local farmers.
Collection centres built as afterthoughts, often underused because produce doesn’t match demand.
Credit extended, but repayment fails because profitability was never secured.
The absence of STEM discipline is what gets in the way of building the coordination systems horticulture requires. Without it, money flows — but growth stalls.
👉 This section shows concretely: STEM is not just a “nice-to-have” in farming. It is the backbone of both productivity and coordination.
Scaling to the nation
Now imagine horticulture taking 30% of Botswana’s crop land (≈3 million ha), with STEM adoption rising over time.
Year
STEM Area (ha)
Non-STEM Area (ha)
STEM Profit (BWP Bn)
Non-STEM Profit (BWP Bn)
Total Profit (BWP Bn)
3
600,000
2,400,000
54.0
72.0
126.0
5
1,200,000
1,800,000
108.0
54.0
162.0
10
1,800,000
1,200,000
162.0
36.0
198.0
20
2,400,000
600,000
216.0
18.0
234.0
With a STEM backbone, national profits rise steadily and reinvestment becomes possible. Without it, volatility, waste, and default persist.
What leadership requires
The leader who takes this on will not just fix horticulture. They will demonstrate that Botswana can move from funding to building industries that plan and re-fund themselves.
That leader will be remembered for building the industry spine. It was the system that allowed farmers, families, and the nation to reinvest. It let them scale and finally sleep when the wind blows.
Closing thought
Botswana does not lack hardworking farmers. It lacks the discipline of coordination and STEM-driven planning that secures the barns before the storm. If we build that spine, we can turn volatility into predictability, allocations into industries, and families into investors.
Bought the seeds. Paid for inputs. Hired labour. Measured every drop of water. Watched over her crop with the kind of personal care only farmers understand. After weeks of nurturing, her cherry tomatoes gleamed on the vines — plump, red, and ready.
She took them to the retailer who once told her, “When you have them, bring them.” But when she arrived with her harvest, the same buyer turned her away.
“Who placed an order for cherry tomatoes?” the retailer asked.
No order meant no sale. Hours of sweet labour, investment, and determination — side-stepped.
And here’s the bitter twist (and a true story). Those very tomatoes had just won first prize at the national agricultural show. The nation had applauded her produce, yet her local retail shelves never saw it. By the time the retail chain placed its order, it was for imported cherry tomatoes. They simply did not know that, in their own backyard, a farmer was already producing prize-winning fruit.
Why this matters
This is not just one farmer’s story. It is a mirror of the system we all work within.
Horticulture farmers plant blind, not knowing what demand will look like when the crop matures.
Retailers scramble, relying on imports because there is no coordinated calendar of who is growing what, where, and when.
Policymakers toggle between bans and openings, without a real-time picture of supply gaps or gluts.
The result? Crops are wasted in fields. Empty shelves in shops. Rising import bills. And declining confidence among the very farmers we need to carry this sector forward.
The bigger issue
This story is not about one farmer. It is about a system where demand lives with Trade. Supply oversight sits with Agriculture. The bridge in between is missing. Farmers plant in hope, retailers stock in panic, and national policy oscillates between bans and openings.
How did other countries solve this?
How other countries broke the cycle
Netherlands: transparent flower and vegetable auctions give growers and buyers the same daily data.
Spain’s Almería region: cooperatives coordinate planting schedules, logistics, and marketing so no farmer is left stranded.
Kenya: a single horticulture directorate oversees both production and marketing, ending the “split brain” between ministries.
India’s Operation Greens: real-time demand intelligence and price stabilization prevent wipeouts from gluts and shortages.
This picture (which shows the split between Ministry of Agriculture and Ministry of Trade, and the missing coordination in the middle):
Note: This picture highlights a critical gap in Botswana’s horticulture sector.
On one side of each vertical line, the Ministry of Agriculture oversees farmers, extension, and production.
On the other, the Ministry of Trade manages retail, imports, and demand data.
In the interim, there is no coordinating mechanism. It is unclear who grows what, where, and when to match the actual demand in shops and institutions.
The result is wasted crops, empty shelves, and farmers discouraged from investing further.
A National Horticulture Coordination Unit can bridge this gap. It links production to market demand. It publishes clear crop calendars. This unit ensures imports are guided by real data—not guesswork.
Without this bridge, farmers will continue to plant blind. With it, Botswana can move from meeting 70% of its demand to achieving 100% and beyond.
Each of these countries built what Botswana lacks. It is a coordination spine that maps demand to supply. This gives both farmers and retailers a reliable compass.
What Botswana can do
Establish a National Horticulture Coordination Unit – jointly housed by Trade and Agriculture, with clear legal authority.
Publish a Horticulture Market Observatory – weekly retailer data (sales, volumes, gaps) made visible to farmers and policymakers.
Issue crop calendars by district – so farmers know when and how much to plant.
Invest in packhouses and cold chain hubs – so produce doesn’t die at the farm gate.
Set transparent import triggers – clear rules on when imports open and close, avoiding last-minute surprises.
We found several existing or emerging initiatives in Botswana. They partly touch on what we’re describing. Some are close to the supply-demand pipeline we want to build. Others are still missing elements. These might be things you can link into or build upon.
Publish a Friday snapshot + 8-week rolling forecast by district/crop.
Use FAO HiH tooling for the analytics layer. (FAOHome)
District Crop Calendars & Planting Targets
Start with top 8–10 veg; publish sow/harvest windows + target tonnage per district (refresh monthly).
Base targets on the Observatory forecast + Letsema/Tokafala signals. (Letsemahm)
Transparent Import Trigger Bands
Example: if projected supply <85% of demand for 4–6 weeks, open imports; >110% triggers processing/price-stabilization measures.
Announce changes via the Observatory (predictability for farmers and retailers).
Finance/Grant Conditionality
NDB/other windows require an assigned market slot (pre-order or auction) or alignment to district targets. (NDB)
90-day stitching plan (practical)
Week 0–2: Form a small Working Cell (MoA, MoT, Letsema, Tokafala, two retailers, NDB, FAO HiH).
Week 2–6: Stand up v1 Market Observatory (Google Sheet → public webpage); collect first 4 weeks of retailer SKUs.
Week 4–8: Publish draft crop calendars for two corridors (Gaborone–South, Francistown–North); recruit 50 pilot farmers via PYEC/TVET.
Week 6–10: Pilot Friday pre-order window at Letsema (listing + minimum volumes); Tokafala farmers prioritize listed SKUs. (Letsemahm)
Week 10–12: Announce import-trigger bands for those SKUs; align NDB grant/loan approvals to calendar slots.
The prize-winning tomatoes that never reached the shelf
The farmer in our story is not unique. Across Botswana, farmers are working with grit, faith, and long hours. They produce quality food. This food too often fails to meet the market. It is not because of their shortcomings. It is because the system has no bridge between production and demand.
Her cherry tomatoes were good enough to win the nation’s top prize. Yet they could not win a spot on the nation’s dinner tables.
That gap is what a National Horticulture Production Management System is meant to close.
Closing thought
Farmers can’t plant blind. Retailers can’t stock empty shelves. Policymakers can’t steer an economy on partial data.
Botswana’s farmers have already reached about 70% of local demand under difficult conditions. With coordination, transparency, and investment in the missing middle, that 70% can become 100% — and beyond.
The prize-winning tomatoes are proof that quality is here. Now it’s time to build the system that ensures such produce doesn’t just win awards. It must also win its rightful place on our tables.
“Does this system give the farmer clear, real-time information about how much to produce, when to produce, and where it will go?”
If the answer is no, the policy—like the food systems exposed in Rotten—may be setting them up for failure.
What I am describing is not nationalization in the strict sense (i.e. state ownership of farms), but rather centrally coordinated agricultural production — where the government, in partnership with national farmer associations, plans production to meet national needs and organized export targets, while the land and operations remain privately or corporately owned.
This model aligns more with:
Coordinated market economies (e.g., in parts of Europe)
Export-led agricultural systems (e.g., in Asia and Latin America)
Public-private agriculture governance structures
Below is a list of countries (or regional blocs) that most closely reflect this model, where government and farmer associations work together to ensure supply meets aggregated national and global demand without owning the farms:
🌾 Countries with Strong National Coordination in Agriculture (Non-Nationalized)
1. Netherlands
Model: Highly planned and tech-enabled production.
Coordination body: Ministry of Agriculture works closely with farmer cooperatives (e.g., LTO Nederland).
Export focus: Major exporter of vegetables, flowers, meat.
Tools used: Digital farm registries, production quotas, national R&D targets, and organized market access through co-ops.
2. France
Model: Strong Common Agricultural Policy (CAP) alignment.
Coordination body: Ministry of Agriculture + National Interprofessional Councils (interprofessions).
Mechanisms: Strategic sector plans, quotas, and export agreements within EU and globally.
Coordination: Ministry of Agriculture + Embrapa (agricultural research) + national crop boards (e.g., ABPA for poultry).
Tools: Satellite monitoring, national zoning laws, and crop forecasts for soy, beef, sugar, etc.
8. India
Model: Large-scale crop planning with farmer incentives.
Coordination: Central and state governments work with cooperatives and marketing boards (e.g., NAFED, FCI).
Challenges: Implementation complexity due to scale, but export crops like basmati rice, spices, cotton are heavily coordinated.
9. Thailand
Model: Coordinated value chains for rice, rubber, and fruit exports.
Coordination: Ministry + farmer groups + contract farming for export fulfillment.
10. South Korea
Model: Government sets supply and demand forecasts, supports cooperatives.
Example: Korea Agro-Fisheries & Food Trade Corporation (aT) facilitates exports and sets production planning.
🔄 Common Features Among These Countries:
Centralized data on supply & demand, often real-time.
Institutionalized partnerships between government, farmers, and exporters.
Use of permits, quotas, and forward contracts to stabilize markets.
Heavy investment in agricultural R&D, extension services, and export facilitation.
Sometimes involve minimum price guarantees or subsidies tied to national plans.
🌍 Notable Regional Example:
European Union (CAP – Common Agricultural Policy)
Supranational coordination of agricultural production.
Uses production planning, environmental standards, and trade negotiations collectively.
Member states develop National Strategic Plans under an EU umbrella.
❗️Where This Is Not Common:
Most of Sub-Saharan Africa: Lacks centralized systems due to fragmentation, lack of digital traceability, weak farmer cooperatives, and limited export integration.
United States: While subsidies and crop insurance exist, production decisions are mostly private. There’s no national production permit system based on demand forecasts.
✅ So to answer the question:
At least 10–15 countries today have strong, centralized coordination systems that match your description — though they do not own farms. These systems are more about:
Orchestrated agriculture – where national production is planned, monitored, and aligned with export strategies in partnership with organized farmer associations.
What Stopsa Country From Adopting Coordinated Demand-driven Agricultural Production?
A country is often not able to adopt coordinated, demand-driven agricultural production (without nationalizing farms) for six major reasons, each with multiple layers of structural and systemic inertia.
❶ Weak or Fragmented Farmer Organizations
Why it matters: Coordinated production requires organized producers (e.g., cooperatives, associations) that can receive quotas, participate in planning, and supply consistently.
What stops it:
Historical mistrust in cooperatives
Politicization or elite capture of farmer groups
Fragmentation: Too many small, uncoordinated actors
Weak leadership or lack of technical capacity in associations
Example: In Botswana, farmers often operate individually or in loose groups without strong aggregation mechanisms for production or marketing.
❷ Poor Agricultural Market Intelligence & Data Systems
Why it matters: Governments need real-time data on local production, global prices, weather, input access, and demand forecasts to guide decisions.
What stops it:
Absence of centralized production databases
Lack of investment in agricultural statistics and remote sensing
Disconnection between research bodies and policy decisions
Low digital infrastructure in rural areas
Without data, there’s no basis to permit, predict, or plan.
❸ Lack of Institutional Coordination
Why it matters: Coordinated production requires alignment across:
Absence of a national agriculture command-and-control dashboard
❹ Absence of National and Export Market Contracts
Why it matters: Export-led production thrives on forward contracts and pre-negotiated quotas with international buyers. These guide local production volumes and timing.
What stops it:
Limited international trade negotiations in agriculture
Poor branding of national produce (quality, consistency, certifications)
Weak or non-existent export councils for agriculture
Lack of investment in post-harvest handling and cold chains
In short: no buyers, no reason to scale production.
❺ Insecure Land Tenure and Weak Investment Incentives
Why it matters: Farmers need to feel secure to invest in scaling production to meet quotas. Private capital needs clear property rights to engage.
What stops it:
Customary or leased land not usable as collateral
Unclear title deeds or long delays in land allocation
Inconsistent tax and subsidy policies
Fear of state interference or lack of trust in public agencies
❻ Skills Gaps: STEM, Management, Agronomy
Why it matters: Coordinated production needs a skilled backbone — both in government planners and farmer-managers — who understand:
Market systems
Agribusiness logistics
Crop science and climate-smart production
Systems thinking for scaling
What stops it:
Education systems focus on “agriculture” but not core STEM
Extension workers lack upskilling in global trends
Low digital fluency across the agri-value chain
🧩 Underneath It All: A Missing Mental Model
At the heart of all these constraints is a mental model of agriculture as a:
Subsistence sector (not a commercial production industry)
Social policy tool (employment & land access) rather than an economic engine
Politically risky sector to regulate, due to voter sensitivities
Until this mental model shifts, efforts at coordination often stall.
✅ What It Takes to Shift
To transition to coordinated agriculture like the Netherlands, Denmark, or Vietnam, a country must:
Build national crop & livestock registries (traceability)
Mandate digital reporting of land use and yields
Empower farmer associations with planning & market access roles
Set up joint public-private Export Market Councils
Link national education to agribusiness STEM fields
Reorganize the Ministry into a strategy + data + extension nucleus
A transformation map for Botswana
Here’s a Botswana-Specific 10-Year Transformation Map to move from fragmented, input-subsidy-dependent farming to coordinated, demand-driven agricultural production that enables both food sovereignty and organized export markets — without nationalizing farms.
Goal: Shift to a system where production is guided by national demand + structured export contracts, via strong public-private coordination. Principle:Farms stay private; coordination becomes public.
🟩 PHASE 1: 2025–2027 – Foundation & Visibility
Theme:“See the System” – Map, Aggregate, Connect
Priority Area
Key Actions
Lead Entities
🧭 1. National Production Mapping
– Build digital registry of farms (land, crops, size, irrigation) – Use satellite + mobile reporting – Identify agro-climatic zones per crop
MoA, Statistics Botswana, Land Board, UNDP
🤝 2. Empower Farmer Associations
– Legal & capacity reform for existing associations – Support formation of national-level boards per major commodity (e.g., Potatoes, Horticulture, Poultry)
Registrar of Societies, Farmers Unions, Business Botswana
📊 3. Market Intelligence Platform
– Establish a digital dashboard for crop price, demand, weather, input availability – Run national demand studies & baseline exports
Ministry of Trade, MoA, SEZA
🔎 4. Rethink Subsidies
– Begin shifting ISPAAD & LIMID from blanket inputs to targeted support based on crop priorities and agrozones
MoA Policy Division, MFED
🟨 PHASE 2: 2027–2030 – Coordination & Control
Theme:“Guide the System” – Aggregate Demand, Set Targets
Priority Area
Key Actions
Lead Entities
📈 5. National Crop & Livestock Council
– Form a legally mandated multi-stakeholder council (Govt + Farmer Boards + Exporters + Researchers) – Use council to approve seasonal production quotas and export targets
Office of the President, MoA, Business Botswana
🔐 6. Contract Farming Expansion
– Pilot export-oriented contracts in garlic, potatoes, chilies, and beef – Sign regional procurement contracts (e.g., SADC school feeding, GCC retailers)
BITC, MoFAIC, Trade Attachés
📉 7. STEM-Agri Curriculum Reform
– Integrate data analysis, systems thinking, and agribusiness into SHS and tertiary agri courses – Establish internship placements on export farms
MoESD, BIUST, BUAN
💼 8. Professionalise Extension Officers
– Upskill officers in market systems, contract farming, regenerative production – Make performance linked to farmer productivity & supply alignment
Theme:“Run the System” – Export with Confidence, Invest with Trust
Priority Area
Key Actions
Lead Entities
🛫 9. National Export Board for Agriculture
– Consolidate oversight of agri-export promotion, standards, marketing – Align with customs, veterinary permits, cold chain logistics
MoA, BAMB, Botswana Bureau of Standards
🏭 10. Value Chain Finance & Insurance
– Develop crop insurance linked to production permits – Channel NDB and citizen equity funds through farmer boards – Attract private agri-finance via forward contracts
NDB, CEDA, BITC, BoB
🧠 11. Systems Research & Forecasting
– Use weather, market, soil, and input data to run production simulations – Use archetype-based insights to prevent overproduction, glut cycles
STRLDi, BUAN, MoA
🔄 12. Legislative Backing
– Revise National Agriculture Policy to reflect coordinated production model – Anchor it in Food Security and Economic Diversification strategy
Parliament, Attorney General’s Office
🧩 SYSTEM FEATURES ENABLED BY 2035:
✅ Production permits based on demand forecasts (not guesswork)
✅ National farm registry and traceability system
✅ Data-driven price stabilization and export contracting
✅ Digital dashboards at MoA and Districts for planning
✅ Professionalized farmer base (similar to manufacturing)
✅ Resilience against import bans and regional shocks
🔄 Optional: 4-Year Electoral Fit (2025–2029)
To align with political cycles, Phase 1 and early Phase 2 deliverables can form part of a presidential or ministerial results agenda, showing clear progress before elections.
My Inspiration for this Post
If you are a farmer or an agriculturalist (at any level), then you should watch this! Now!
Here’s a structured rundown of Netflix’s Rotten—the documentary series that inspired my reflection on farmers caught in volatile price cycles. It exposes how hidden market dynamics, fraud, and corporate systems hurt producers, often those at the very bottom of the chain.
📺 Overview of Rotten
A Netflix original investigative series (first season released January 5, 2018; second season October 4, 2019) with a total of twelve episodes across two seasons, each exploring corruption, fraud, and exploitation in global food systems (GQ, Wikipedia).
🔍 Season 1 (6 episodes) – “True Food Crimes”
1. Lawyers, Guns & Honey
Uncovers massive honey adulteration—beekeepers struggling to compete with cheap, syrup‑diluted honey flooding the U.S. market from China and other countries. Domestic producers are squeezed out, and regulators struggle to detect fraud (Garden Culture Magazine).
2. The Peanut Problem
Investigates a surge in peanut allergies in the U.S., linking it to shifts in processing, environment, and early childhood exposure. Highlights how industrial peanut systems affect public health and put pressure on farmers to keep up with opaque demand trends (Allergy Amulet).
3. Garlic Breath
The most gripping episode: a legal and ethical battlefield between Chinese exporters (some using prison labor) and U.S. garlic farmers. It reveals how global supply shocks, trade disputes, and price dumping devastate small producers (GQ).
4. Big Bird
Focuses on poultry production, showing how large-scale consolidation and export-driven demand distort local markets and compress margins for independent growers, often underregulated (GQ).
5. Milk Money
Centers on the raw milk controversy in the U.S., juxtaposing small dairy farm viability with public-health risks. It highlights how fear-based regulation and consumer mistrust can impact livelihoods without clear national strategy or market clarity (David Gumpert, GQ).
6. Cod Is Dead
Explores overfishing, regulatory loopholes, and global demand for seafood, showing how small fishing communities fall prey to industrial fleets and opaque supply chains, often without knowing who consumes their catch or at what price (Los Angeles Times, GQ).
🌍 Season 2 (6 episodes) – Deeper on Commodities & Ethics
Includes stories like:
The Avocado War – Supermarket chains squeezing small growers in Latin America.
Reign of Terroir – How terroir branding is co-opted by big players.
Troubled Water – Bottled water scams that leave communities thirsty.
A Sweet Deal, Bitter Chocolate, High on Edibles – covering sugar, chocolate production (including deforestation and labor abuse), and cannabis edibles respectively (Wikipedia).
🧩 Cross‑Cutting Themes
Global supply shocks and price volatility leave producers blind to demand, often overinvesting and ending in ruin.
Food fraud and adulteration undermine trust and crop value (honey, garlic, chocolate).
Corporate consolidation & opaque trade—big buyers and multinationals capturing margins, leaving farmers in informational darkness.
Labor exploitation, especially in low-cost producers like prison farms in China or cocoa plantations under slavery-like conditions.
Regulatory dysfunction: government bodies failing to protect small producers or clarify demand forecasts.
Emotional storytelling draws empathy—but also criticism for dramatizing issues over structural analysis (GQ).
🧑🌾 Relevance to Farmer Experience
Your concerns—that small farmers invest blindly, with no real insight into national or export demand, and thus suffer catastrophic losses—mirrors Rotten’s narrative. Farmers often don’t control:
Market entry or exit timing,
Price contracts,
Export pathways or demand data.
They’re typically stuck reacting rather than planning—leaving them vulnerable to price crashes, import floods, and external shocks. The series underscores the human toll of systemic opacity and misalignment.
✅ Summary Table
Episode / Theme
Key Insight
Impact on Farmers
Honey adulteration
Price-undercutting by fraudulent syrup imports
Domestic beekeepers driven out or starved
Garlic dumping
Global trade wars, forced labor, export inequality
U.S. garlic farmers lose ground and market share
Commodity allergies
Shifting health trends and processing norms
Peanut farmers suffer demand unpredictability
Poultry, fish, dairy
Export pressures and consolidation
Small producers edged out, price and demand opaque
Did the documentary reach the conclusions we reached here?
No, the documentary Rottendoes not explicitly reach the conclusion we’ve raised here — that coordinated, demand-driven national production planning is a necessary safeguard for farmers.
Instead, Rotten does the following:
🎥 What the Documentary Does Say:
It exposes the invisible machinery behind food systems — fraud, monopolies, unfair trade, exploitation, price dumping.
It empathizes with small farmers who suffer under market opacity, global trade forces, and power imbalances.
It documents farmer bankruptcies, family trauma, and systemic silence that precedes collapse.
It often frames these as consequences of deregulated capitalism, consolidation of corporate power, and corruption in trade.
🧠 What It Does Not Do:
It does not explicitly propose national production permits, demand forecasting, or farmer-board coordination as solutions.
It does not draw a policy systems map or push for governance reforms like those we are advocating.
It largely avoids proposing structural solutions, staying in the investigative and emotional storytelling space rather than systemic policy design.
✅ So, What Have We Done Differently?
We have taken Rotten a step further by:
Translating narrative diagnosis into policy prescription.
Where Rotten shows the symptoms, we’ve proposed the systemic cause and a coordinated solution.
The documentary paints the tragedy. We’ve used it to frame the design.
This is precisely the value of the systems thinking lens—where stories like Rotten become entry points to expose structure, delay, loop dynamics, and system traps that can be redesigned.
📄 Policy Memo: From Rotten to Resilient – Why Botswana Must Coordinate Its Agricultural Production
To: Ministry of Agriculture, Trade & Industry, Office of the President From: [Your Name / STRLDi] Date: [Insert Date] Subject: Preventing Farmer Collapse through Coordinated, Demand-Driven Agricultural Planning
🎬 Background Inspiration
The global food documentary series Rotten (Netflix, 2018–2019) offers a sobering account of how disorganized, opaque, and exploitative food systems ruin small producers. While it focuses on the U.S., China, and Latin America, the core lessons are deeply relevant to Botswana’s farmers:
“What destroys the farmer isn’t drought or pest—it’s the silence before the market crashes.”
🚨 Key Lessons from Rotten
Episode Theme
Underlying Failure
Result for Farmers
Honey Fraud
Lack of quality regulation & import control
Local beekeepers undercut & collapse
Garlic Dumping
Unregulated trade, forced labor, price flooding
Local garlic growers sued, outcompeted
Poultry Consolidation
No control over contract terms, production quotas
Chicken farmers left with losses
Milk & Fish Episodes
No demand forecasting, oversupply, regulatory chaos
Prices crash; family farms shut down
🇧🇼 The Botswana Parallel
Farmers across Botswana face the same pattern of systemic vulnerability:
They produce without visibility into national or global demand.
They invest heavily without guaranteed buyers.
They enter markets that can be flooded by cheaper imports or fail due to price crashes.
Their fate is sealed when production is treated as individual initiative, not collective strategy.
🔑 Policy Recommendation: Coordinate Agricultural Production
Botswana can avoid this fate—not through state ownership, but through central coordination with decentralized production.
What Needs to Change
How to Implement It
❌ Farmers produce blindly
✅ Establish seasonal production permits & quotas based on national + export demand forecasts
❌ No market visibility
✅ Develop a National Agricultural Intelligence Platform (real-time price, supply, demand)
❌ Weak farmer associations
✅ Mandate and professionalize crop-specific national producer boards
❌ Reactive policies
✅ Use predictive modeling, weather & trade analytics to plan ahead
❌ No export assurance
✅ Pre-negotiate contracts via Export Market Councils (public-private)
📈 Strategic Benefits
Reduces price volatility for both producers and consumers
Prevents overproduction gluts and underproduction shocks
Builds investor confidence in agribusiness supply chains
Protects smallholder farmers from being the last to know—and the first to suffer
🧠 The Rotten Test: Ask of Any Policy
“Does this system give the farmer clear, real-time information about how much to produce, when to produce, and where it will go?”
If the answer is no, the policy—like the food systems exposed in Rotten—may be setting them up for failure.
📌 Closing Note
The stories of collapsed garlic farms, ruined poultry growers, and poisoned fishers in Rotten show us one thing: a happy family at the breakfast table doesn’t come from heroic individual effort—it comes from a system that plans, protects, and pays. Botswana’s farmers deserve no less.
We do not yet have access to the extensive national data collection that underpinned the unemployment study. However, we have identified substantive datasets for Botswana and the region through FAOStats, which form a solid initial foundation. Using these, we are currently developing a case study to examine these dynamics at a global scale.
That said, the work would benefit significantly from deeper, locally anchored data. I would strongly welcome the opportunity for the Ministry to co-lead in organizing the data infrastructure. The region, more broadly, could also participate in strengthening the infrastructure. This is needed to support a systems thinking inquiry of this kind. Such collaboration would bring greater analytical depth. It would also ensure national and regional ownership of the insights that emerge.
At this point, our thinking is guided by what is publicly available through internet-based searches. While this has allowed us to outline key directions, we are acutely aware of the limitations. For that reason, I ask that you handle this information with professional discretion. Please do so until we are in a position to confirm and consolidate findings more robustly.
A distinctive aspect of our approach to systemic mapping is its ability to trace causal influences. It does this both at a specific point in time, but importantly, also traces these influences across time. This allows us to surface structural patterns. These include feedback loops, delays, and reinforcing behaviors. Such patterns often underpin not just the problem, but its persistence. We can begin this work with 20-year datasets. However, having a longer time series makes the causal structure more robust. This long-view perspective is especially important for policymakers seeking interventions that are not only responsive but also transformative.
Introduction
If the stories and explanations we’ve been using haven’t helped solve the problem, it’s time to take a step back. We need to ask new questions. Sometimes, we need to look deeper—or in entirely new directions—to find what’s really going on. Only then can we start telling a new story, one that brings real and lasting change.
**“We may not control the weather with the press of a button—but we are already influencing it, profoundly. The systems we built to extract water have altered rainfall patterns. This includes deforestation, exposed-field farming, and over-irrigation. These actions have weakened the water cycle. The question isn’t whether human action affects weather; it’s how we choose to act.
When we start to treat water as a partner, we create landscapes that invite rain. It’s not just a resource. Moist soils, living roots, and transpiring plants cool the land, seed clouds, and stabilize local climates. It’s not about control—it’s about cooperation with the natural systems we depend on.”**
— Adapted for regenerative agriculture and water cycle resilience messaging
What Nature Speaks: Rethinking Water Use and Agriculture in Botswana – Summary
High water use, low returns: Botswana’s agriculture consumes large volumes of water but contributes minimally to GDP.
Cereal crops as a key outlier: While beef and horticulture align with global water-use norms, cereal crops are often drought-resistant. However, they use far more water and have lower productivity.
Not poor practice, but environmental exposure: The inefficiency stems from exposed-field farming in a semi-arid climate, leading to extreme evaporation.
Drought-resistance as a false solution: Over-reliance on drought-tolerant crops may suppress transpiration, disrupt rainfall cycles, and accelerate land degradation.
Yields and GDP suffer: Reduced rainfall and deteriorating soils weaken crop yields and reinforce the sector’s underperformance.
A call to ecological cooperation: The article urges a shift from controlling nature to partnering with it through regenerative practices.
Time to reintroduce water-cycle crops: Non-drought crops—especially horticultural varieties—can cool the land, restore rainfall patterns, and build resilience.
Toward a regenerative future: By designing agriculture to regenerate rather than extract, Botswana can improve climate stability. It can also boost productivity and enhance long-term economic contribution.
🔁 From Efficiency to Regeneration: Rethinking Water Use and Crop Strategy in Botswana
Dr. Rasbash’s analysis in “Thirsty Farms, Empty Returns” The Gazette, 28 May, 2025 (pg 24) highlights a critical issue. Botswana uses a lot of agricultural water. However, it experiences low economic returns.
We, like Dr Rasbash, noticed a significant deviation in water consumption per tonne of agricultural produce in Botswana. This is evident when compared to global benchmarks (for details refer to Part III below). The most striking difference, however, is in cereal production. Beef is the most water-intensive product. However, both beef and horticultural crops show water usage broadly comparable to international standards. Cereal crops, on the other hand, diverge sharply.
If so, this discrepancy may not be a reflection of poor farming practices, inefficient irrigation, or crop selection per se. Rather, it stems from the environmental context in which these crops are grown. Unlike horticultural crops, cereals in Botswana are typically cultivated in open fields without protective cover. The country’s semi-arid to arid climate causes a substantial loss of applied water due to evaporation. For details refer to: Comparison of Average Annual Evaporation by Climate Zones in Part III below. High solar radiation and ambient heat drive this evaporation process.
This insight now invites us to go beyond technical adjustments. It compels us to ask deeper questions:
What keeps the sector from understanding inefficiencies despite repeated episodes of the issue? The answer may lie in the assumptions we’ve internalized about what defines “productive” agriculture in dryland conditions.
Rainfall cycles and cooler climates are supported by vegetation that actively contributes to transpiration. These plants boost atmospheric moisture. These traits are less common in drought-resistant crops (for details, refer to Part I below). By designing agricultural systems that collaborate with natural water cycles, Botswana can enhance resilience. These systems work with nature. They do not resist it. (For details on the consequences of resisting it, refer to Part II below). This approach allows Botswana to move toward climate-resilient productivity and long-term food security.
Too often, agricultural solutions default to scaling up drought-resistant crops—an understandable and technically sound response to erratic rainfall. However, this approach risks masking a deeper systemic challenge. While drought-resistant crops will buy us time, they cannot reverse the underlying drivers of desertification. Nor can they rebuild climate resilience if soil health continues to decline and vegetation cover is reduced. These conditions weaken the land’s capacity to retain water. They disrupt critical feedback loops in the water cycle. This disruption ultimately contributes to declining yields. It also fosters the perception that agriculture underperforms in driving national GDP.
Crops that promote transpiration and atmospheric moisture, on the other hand, include many horticultural varieties. These crops will initially require time to re-establish after years of disuse. However, they offer long-term potential to help restore local rainfall cycles and moderate surface temperatures. When grown under protective systems and supported by regenerative practices, they:
Improve soil structure and organic matter to retain moisture,
Reduce surface temperatures through better vegetative cover,
Ultimately lead to fewer heatwaves and more stable growing conditions leading to better yields and more stable climates.
Enhance transpiration, which supports cloud formation and rainfall,
This is not just a shift in crop choice. It is a recalibration of agriculture’s role. The focus is changing from resisting climate change to regenerating the conditions that make farming viable in the first place.
Instead, we should view agriculture as a partner in the water cycle, not just a consumer of it.
It’s true—we cannot “control” the weather in the way we control machines or systems with switches and dials. But we’re already influencing it, profoundly—just not always with awareness or intention. The very technologies and land-use systems we designed to maximize extraction have altered rainfall patterns. This occurs through deforestation, large-scale irrigation, or monocropping. They have also increased surface temperatures and weakened the water cycle.
The question is not whether human action affects the weather—it clearly does. The question is how we choose to act.
Think of it like a forest. No single tree controls the climate, but together, their presence regulates humidity, encourages rainfall, moderates temperature, and stabilizes soil. Likewise, agriculture, land cover, and soil practices can act like an ecological switchboard.
We see measurable improvements when we treat water as a partner in productivity. It’s not just a resource to be extracted. Moist soils reduce land temperatures. Vegetation increases transpiration, which adds moisture to the air. This feedback is slow, subtle, and cumulative. They are real and supported by growing evidence in agroecology, climate science, and satellite data.
We may not press a button to make it rain tomorrow. However, we can build landscapes that invite rainfall over the seasons. In doing so, we move from technological control to ecological cooperation—from managing components to designing for outcomes.
Without this shift, efforts at water efficiency—however well-intentioned—may end up reinforcing the vulnerabilities they aim to fix.
“Efficiency without regeneration risks accelerating the very vulnerabilities we aim to overcome.”
Ultimately, this calls for a paradigm shift. We need to move from maximizing extraction to optimizing contribution. Land, water, and communities should be healthier each season than the last. Botswana’s agricultural strategy must evolve from technical reform to systemic redesign, aligning with ecological processes rather than resisting them.
PART I
The Impact of Crops That Transpire Less
Crops that transpire less can significantly alter the local and regional water cycle, especially when adopted widely across a landscape. Here’s a breakdown of the key impacts:
1. Reduced Moisture Recycling (Less Local Rainfall)
Transpiration contributes to atmospheric moisture, which can return as local or regional rainfall.
When crops transpire less, less water vapor enters the atmosphere, leading to:
Lower humidity
Reduced cloud formation
Decreased local rainfall, especially in semi-arid and continental interiors
🔹 Impact: This can contribute to longer dry spells and a feedback loop of aridification, especially in areas already vulnerable to desertification.
2. Lower Evapotranspiration = Slower Water Cycling
Evapotranspiration (ET) = evaporation from soil + transpiration from plants.
Lower ET = slower movement of water from soil to atmosphere.
This can:
Reduce cooling of the land surface (because ET consumes heat)
Potentially increase surface temperatures during the day
🔹 Impact: Hotter days, reduced rainfall, and possible heat stress for crops and livestock.
Less water is lost to the atmosphere. As a result, soils may stay moist longer. This initially improves drought resistance and reduces irrigation needs. This initially improves drought resistance and reduces irrigation needs.
🔹 Impact: In the short term, this supports water conservation. In the long term, if this leads to reduced rainfall, it can backfire.
4. Landscape-Level Hydrological Shifts
When drought-resistant, low-transpiration crops replace native vegetation or high-transpiration crops, they:
Disrupt ecosystem-level water cycling
Potentially lower groundwater recharge (fewer rain events = less infiltration)
Shift local climate patterns due to changes in surface albedo* and humidity
🔹 Example: Large-scale planting of low-transpiration crops across a savanna could reduce the frequency of convective afternoon rains.
Rainfall Levels for Botswana 1970 to 2020.
*Albedo is a scientific term. It refers to the reflectivity of a surface. Specifically, it describes how much sunlight (solar radiation) a surface reflects back into the atmosphere instead of absorbing it.
Simple Definition:
Albedo is the fraction of incoming solar energy that is reflected by a surface.
It is measured on a scale from 0 to 1:
0 = No reflection (total absorption, like black asphalt)
1 = Full reflection (perfectly reflective, like fresh snow)
Examples of Albedo in Nature and Land Use:
Surface Type
Typical Albedo
Fresh snow
0.8 – 0.9
Dry sand/desert
0.3 – 0.4
Grassland/crops
0.2 – 0.25
Forest (dark vegetation)
0.1 – 0.2
Water (angle-dependent)
0.05 – 0.1
Black soil/asphalt
0.04 – 0.1
Why It Matters in Agriculture and Climate:
Higher albedo = more solar radiation is reflected = cooler local temperatures.
Lower albedo = more solar radiation is absorbed = warmer local temperatures.
For example, deforestation lowers albedo because darker soil absorbs more heat, potentially intensifying local warming.
In agriculture, mulching, crop type, soil exposure, and canopy density each impact the albedo of a farming landscape. These factors influence microclimates and water loss.
Would you like a visual example or its role in climate feedback loops?
Summary Table
Effect
Low-Transpiration Crops Impact
Local Rainfall
↓ Decreases
Humidity
↓ Decreases
Soil Moisture (Short-term)
↑ Increases
Groundwater Recharge (Long-term)
↓ Decreases
Temperature Moderation
↓ Less evaporative cooling
Water Use Efficiency
↑ Increases
Implications for Agricultural Planning in Botswana
Drought-resistant, low-transpiration crops help in the short term. However, relying on them without reforesting, mulching, and soil regeneration can be risky. It’s important to balance these crops with plants that transpire more. Otherwise, it may lead to a drier, hotter, and less predictable climate.
Strategic planning must balance plant-level efficiency with landscape-level water cycle stability.
KEY INSIGHTS:
Declining Rainfall in Key Production Areas:
Rainfall levels in Botswana have declined in specific cereal- and livestock-producing regions over the past 15 years. Other areas have remained unaffected, according to historical data from the Botswana Meteorological Department. This challenges the idea of a uniform global warming effect. It suggests that localized environmental degradation may be happening. This degradation is likely linked to agricultural land use and possibly deforestation.
Limitations of Cereal Investment Narratives:
There is a common assumption that increasing investment in cereal production alone can reverse national declines. However, efforts to regenerate ecological conditions must occur in parallel. This includes maintaining moisture levels and soil structure. Otherwise, such strategies may prove unsustainable, even for drought-resistant crops.
Escalating Desertification Risks:
Desertification is not static—it is steadily progressing. Without systemic change, even crops bred for resilience will eventually become non-viable. Long-term adaptation strategies must go beyond input substitution and address root climatic trends.
Rationale for Regenerative and Horticulture Focus
In response, STRLDi advocates for a regenerative agriculture strategy, particularly through horticulture. Horticulture is initially vulnerable to erratic weather. However, it offers a critical advantage by actively contributing to atmospheric moisture and soil regeneration. Over time, this enhances local microclimates and can help reverse drying trends caused by extractive practices.
Balancing Competing Agricultural Priorities:
The solution is not to swing policy wholly toward one system or another. Instead, it lies in designing a balanced agricultural model. This model must meet food security targets and restore ecological function.
Data Gaps Undermine Strategic Action:
Preliminary FAOSTAT data indicate a countrywide decline in cereal production, aligning with producer concerns over inconsistent field data. This may limit the Ministry’s capacity to regulate imports effectively or justify increased sectoral investment. Delayed payments to producers could be symptomatic of this deeper structural imbalance.
Recommendation:
There is an urgent need for a national effort to collect and analyze disaggregated, region-specific production and climate data. Policymakers, investors, and farmers need a systems-based understanding of Botswana’s agricultural future. This understanding will help them co-create a more resilient and self-sustaining agricultural sector.
Subject: Reflections on National Cereal Production and Data Trends
Dear Mr. Tema,
I had thus far refrained from commenting on the country’s cereal and meat production landscape. I felt it important to first examine more recent and comprehensive data sets in both sectors.
Fifteen years ago, I had noted that rainfall patterns were declining in certain areas. This was based on historical data from the Botswana Meteorological Department. These localities were known for cereal and livestock production. Interestingly, this trend was not mirrored in all parts of the country. This suggests that the issue may not solely be the result of a uniform global warming effect. Rather, it indicated possible localised environmental degradation. This could be linked to agricultural practices and land use changes. Such changes may include or even lead to deforestation. With more robust and longitudinal datasets, these causal relationships can be better defined and understood.
This point may appear subtle, yet it carries significant weight and is often overlooked in discussions. It illustrates how we identify high-leverage interventions. Specifically, it concerns the observed correlation between drought-resistant cereals and declining rainfall. The common conclusion is to increase investment in cereal production to counteract the decline—an understandable response. However, without addressing the underlying climatic shifts driving these patterns, we risk falling short of achieving true resilience. Long-term productivity gains are unlikely without confronting these deeper systemic changes.
I recall saying at that time that even drought-resistant crops will eventually be phased out. The climatic conditions they are meant to survive will worsen. Even they cannot withstand these changes. Desertification is not a fixed point—it is dynamic and constantly expanding. We must change land use, water retention strategies, and soil regeneration practices. Otherwise, we risk pursuing production targets in environments that are no longer viable.
This may help you understand why I have taken a regenerative agriculture approach. I have also placed emphasis on boosting horticulture production levels. Horticulture might initially suffer from the same drying effects of climate variability. However, when approached regeneratively, it presents a potential solution. It contributes to atmospheric moisture and enhances local microclimates. Unlike conventional cereal farming, it can help reverse some drying conditions. These conditions are caused by widespread cultivation of crops that, while drought-resistant, do not release moisture into the atmosphere. This occurs in combination with other extractive agricultural practices. The key, I believe, is not to swing the pendulum entirely in one direction. Instead, a practical balance should be found. This balance is between systems that nourish the land and those that meet the country’s food needs.
I have compiled an initial set of figures from FAOSTAT to begin exploring these patterns. While the current dataset is limited, the preliminary trends suggest a sustained nationwide decline in cereal production. This situation may partly explain why producer associations feel caught between competing pressures. They are unable to rely on consistent field-level data to inform the Ministry’s regulatory decisions. This is particularly true concerning the timing and scale of import restrictions.
The Ministry itself may also be facing a difficult balancing act. Without clear evidence of import substitution, justifying increased allocations to the sector becomes challenging. There is no significant drop in the national import bill for cereals. This, in turn, likely affects its capacity to pay producers promptly, further exacerbating trust and viability within the sector.
A more coordinated effort is needed. We need to gather and analyze disaggregated, locality-specific production and climate data (see inbox below). This effort would shape responsive policies. These policies would strengthen national food security and protect the economic interests of our producers.
Warm regards, Sheila Damodaran Managing Director Systems Thinking Research & Leadership Development Institute (STRLDi) Botswana Tel: 75987534
May 14, 2025
PART II
GRAIN PRODUCTION, DEMAND AND CONSUMPTION TRENDS 1960S – 2020S
Comparing Botswana’s grain production and demand from the 1960s to the present shows a persistent gap. Domestic production consistently falls short of consumption needs. This disparity has necessitated substantial grain imports to meet the country’s food requirements.
📊 Grain Production Trends (1960s–2020s)
1960s–1980s: Grain production was generally low, with significant fluctuations due to droughts and limited agricultural infrastructure. For instance, in 1984, production dropped to a record low of 9,525 metric tons. (CEIC Data)
1990s–2000s: Efforts to improve agricultural output led to some increases in grain production. However, challenges such as inconsistent rainfall and limited agricultural infrastructure continued to hinder substantial growth.
2010s: Production levels varied, with some years witnessing improvements due to better rainfall and government support programs. For example, in 2017, the total grain production was 2,348 metric tons. However, by 2019, production had declined sharply to 583 metric tons, primarily due to drought conditions.
2020s: Recent data indicates a gradual increase in grain production. In 2022, cereal production was reported at 85,049 metric tons. By 2028, grain production could rise to 64,100 metric tons. This is an increase from 59,000 metric tons in 2023. It reflects an annual growth rate of 1.3%.
📈 Grain Demand and Consumption
While specific year-on-year consumption data is limited, it’s evident that Botswana’s grain demand has consistently outpaced domestic production. The country’s reliance on grain imports underscores this gap. For instance, in 2023, Botswana ranked 143rd globally in grain production, with Lesotho surpassing it by producing 59,000 metric tons. (Taylor & Francis Online, ReportLinker)
📉 Production vs. Demand Gap
The persistent shortfall in grain production relative to demand has led to a dependence on imports to ensure food security. Factors contributing to this gap include:
Crop Production Choices Exacerbating Climate Variability Botswana’s semi-arid climate and recurrent droughts have long posed challenges to agricultural productivity. Current crop production choices are adding to the problem. They limit the landscape’s ability to support moisture recycling. As a result, they decrease rainfall. In this way, agricultural decisions are not only shaped by climate variability but may also reinforce it.
📚 Data Sources for Detailed Analysis
For a more comprehensive year-by-year breakdown of grain production and consumption statistics in Botswana, the following resources are recommended:
FAO GIEWS Country Briefs: Offers insights into food security and agricultural trends. (FAOHome)
CEIC Data: Contains historical data on agricultural production and consumption. (CEIC Data)
To check the extent increases were the result of proceeds from sales or capital injections.
CEREALS PRODUCED IN PANDAMATENGA
Pandamatenga, situated in Botswana’s Chobe District, stands as the nation’s primary hub for cereal production. The area’s favorable conditions are ideal for large-scale, rainfed agriculture. These conditions include flat terrain, fertile Vertisol soils, and annual rainfall averaging around 600 mm. (Wikipedia, African Development Bank Group)
🌾 Major Cereals Produced in Pandamatenga
Sorghum: As Botswana’s staple grain, sorghum is extensively cultivated in Pandamatenga. In the 2022–23 season, the region produced approximately 42,100 tonnes of sorghum, marking an 11% increase from the previous year. This output significantly contributes to national self-sufficiency in sorghum production. (Mmegi Online)
Wheat: Traditionally a minor crop, wheat cultivation in Pandamatenga has expanded in recent years. During the 2022–23 season, there was a nearly 30% increase in wheat production. This indicates a growing importance in the region’s agricultural portfolio. (Facebook, Mmegi Online)
Maize: Maize is a significant cereal crop nationally. However, its cultivation in Pandamatenga is less prominent compared to sorghum and wheat. However, it remains an essential component of the region’s cereal production.
Millet: Grown on a smaller scale, millet contributes to the diversity of cereals produced in Pandamatenga. Its cultivation supports food security, especially in areas with variable rainfall.(chobedestination.co.bw)
🌱 Additional Crops
Beyond cereals, Pandamatenga’s farmers also cultivate various pulses and oilseeds, including cowpeas, chickpeas, mung beans, sunflower, and sugar beans. These crops not only diversify agricultural output but also enhance soil fertility through crop rotation practices. (Mmegi Online)
🏗️ Infrastructure and Development
To support and enhance agricultural productivity, significant investments have been made in infrastructure within the Pandamatenga region. Notably, 12 modern steel grain silos are being constructed. Each silo has a capacity of 5,000 metric tonnes. This aims to improve grain storage and management. This development is expected to motivate farmers to increase grain production, thereby promoting food security. (Guardian Sun, Daily News)
In summary, Pandamatenga’s strategic importance in Botswana’s agricultural sector is significant. It contributes substantially to cereal production, focusing on sorghum and wheat. These contributions are supported by favorable agro-climatic conditions and ongoing infrastructure development.
As it appeared in the Sunday Standard, Botswana on Sunday Dec 9, 2012 edition.
Actions have consequences
When we bring a bowser to a place that needs water, is that a solution to, or a relief from the problem?
The test will be, if that’s the only time we have had to do it. Then it is a solution. Otherwise, it is a measure to stop the gap. But the gap remains there.
To take care of recurrent (persistent) nature of water shortages of a nation, we would have to take care of the water cycle. The whole cycle. Not parts of it (as excerpted from Part IV of this series).
Except the truth is, most of us and organizations, be they units, departments, sometimes even whole Ministries are not designed to do so. We work at best in parts. And, as citizens, we have not mandated anyone to do so, otherwise. Not as yet.
This allows stubborn problems to slip away from our focus, but they return to haunt us (you and I) more deeply each year. It is a reminder of work to be done as yet.
The water cycle is one example of circles of causality, we have been ignoring for decades. There are many more.
Nature of cycles
The cycle can go two ways (see Picture 1).
They could either reinforce positively or negatively. When the cycle reinforces positively, we would see the world around us look more like the Amazons. When the same cycle reinforces the other way, we would see the Sahara unfold right in front of our eyes. The outcomes may be different. But the circular causality is the same. The difference is in knowing which way the cycle is reinforcing for us?
Causes of reality
In the last article, I left a question: What are the consequences of the following actions on the water cycle? Run a test against the cycle. (see Table 1)
Table 1: What are the impacts over time of the following actions on the water cycle?
Action Plan
Given and constraints
Consequence
Impact
Growing drought-resistant varieties of crops?
Given there are already large-scale existence of drought-resistant plants that we grow in our gardens, and as vegetation and forests on the land.
Persistent growth of such varieties cause persistent reduction of transpiration by plants and therefore the atmospheric moisture in the region
Negative. Would see reduced levels of rainfall and water tables over time
Producing livestock that depend on greens?
When number of livestock exceeds carrying capacity of the land, it leads animals (including wildlife) to consume greens at rates faster than at which they may rejuvenate.
Sees wipe outs of greens and humus in the topsoil needed to see sustained growth of vegetation leading to non-sustainable levels of transpiration.
Negative. Would see reduced levels of rainfall and water table over time
Production of brews?
It can take up to ten cans of water to produce one can of beer. When the consumption of water exceeds the water table recharge levels, it causes the distance between the topsoil and the water table to increase.
Sees wipe outs of greens and humus in the topsoil needed to see sustained growth of vegetation. The land appears drier, leading to non-sustainable levels of transpiration.
Negative. Would see reduced levels of rainfall and water table over time
Drilling or deepening of boreholes?
When the rate of extraction of water table exceeds recharge levels, it causes the gaps between topsoil and the water table to increase.
Sees wipe outs of greens and humus in the topsoil needed to see sustained growth of vegetation. The land appears drier, leading to non-sustainable levels of transpiration.
Negative. Would see reduced levels of rainfall and water table over time
Presence of dams?
One dam-full of water could see up to two-thirds of its water evaporate from its surfaces.
The rate of evaporation is too fast unlike the more organic pace of transpiration by plants. The land appears drier, leading to non- sustainable levels of transpiration.
Negative. Would see reduced levels of rainfall and water table over time
What do you notice? While our actions were intended to be a response to declining water tables, continuing to take these actions, actually deepens the decline even further!
And as we do so, rainfall levels pushes downwards further. On the surface, it would look like as if public and private sector initiatives and project implementation efforts are not taking off (see Table 2).
Table 2: What are the consequences (from over 20, 30, 40 year periods ago) of a negatively reinforcing water cycle on the following?
Growing of crops and raw materials (primary industries)
Negative
Food security
Negative
Sustained growth of secondary industries
Negative
Sustained growth of tertiary industries
Negative
Capacity to diversify and develop a manufacturing base
Negative
Competitiveness / Growth of profit margins of retail sector organizations
Negative
Growth of tax revenues from agriculture, manufacturing & retail sectors
Negative
Growth of wages
Negative
Growth of employment in the formal sectors
Negative
Growth of household incomes
Negative
The reality is not merely at the mercy of the terrains we live in. They are also the consequences of our actions.
What is happening?
While these cycles are natural systems, they are leading us (yes, even the humans within the system) to take decisions, that reinforce the direction the cycle is already heading into. It is the self-seeking nature of the cycle that causes that to us.
Unknown to us, our thinking is now becomingset within these cycles. It happens to the best of us.
It is easy to blame organizations out there. It is harder to blame our thinking here. Systemic Thinking offers a way to catch ourselves being trapped in such thinking.
So, should we take off from the next corporate retreat with a solution that we come up with, or would we need to first uncover together the circle of causality that keeps returning these problems to us?
You are right! We need to be mindful of the latter.
What would we need to do, to solve the problem of water shortages then? The clue is in the circle of causality (see Picture 2).
Take another look at the cycle the parts before “Level of Rainfall” (bottom right corner). What do you see is leading up to it? Does it say “Level of vegetation and (top right corner) and further up in the cycle, “levels of surface and underground moisture”?
That becomes a systemic solution. “Have more greens, will rain more”.
This is the final segment of this five part series of this article. In the New Year, we will work on understanding the persistent nature of HIV, its causes and its effects and how we may turn it around.
As it appeared in the Sunday Standard, Botswana on Sunday December 2, 2012 edition.
All is not what it seems
So was your answer similar to or different from that of your friends?
In last week’s discussion (Part III) we saw gradual increases in rainfall levels rose levels of vegetation as well. Vegetation begins to grow in sustained ways.
Still, this is linear thinking. Rainfalls cause vegetation. As farmers, most of us know this.
However, the key to understanding persistent or stubborn issues such as water shortages is when we see causality as a cycle (Part II). At this point, the thinking shifts from linear to being systemic.
So, I left you with a question to complete the process of thinking.
Should levels of vegetation (along with surface waters) increase, what do you think will be their consequence on rainfall levels?
Would we see declining levels of rainfall? Or could such levels increase (gradually) over time? Which types of vegetation would encourage rainfalls? And which ones don’t?
Check if you got the following answer. I am sure you did!
This is a story over time.
As more plants consume water and we see vegetation grow over time, we will begin to see a genre of plants that are broadleaved. As more of such plants thrive on the lands, such plants transpire water vapour into the atmosphere.
The more persistent are those levels, the higher the likelihood of levels of atmospheric moisture rising across the region. However, one plant, one hose-pipe or one dam does not make that change happen. Instead one would have to imagine, miles and miles of such vegetation happening across the region.
What do you think will be the result?
The higher atmospheric moisture now begins to encourage precipitation and eventually rainfall. Hence my title here, “have greens will rain”.
Positive Cycle
For rains to fall from above, it needs to figure a way to move from the earth’s surface to the atmosphere. Surface waters and vegetation when they come together facilitates that process. We as humans are parts of that instrument. The result will be more levels of rainfall over time.
Additionally, as more plants grow out their life cycle, at the end of their life, they decompose and add nutrients to the earth. This is key in helping the soil transform gradually from sandy to become loamy. The land learns to become greener. Potentially, we could even see the desert turn on its back.
As the supply of available water increases, cost of using it, will usually come down. The reverse (Part I) is also true. When the supply diminishes, the cost goes up. Unfortunately, we will not be able to push these prices down, till we figure a way to increase its supply. The answer can start in our backyards. Literally, for everyone.
So, increased levels of vegetation, raises the levels of rainfall. That’s your cycle (see Picture 2)! In this case we refer to them as virtuous cycles.
The reverse is also true.
Negative Cycle
When plants do not consume water (see also Picture 2), over time, they gradually learn to do the opposite of all of the above, as they fight or adapt to stay alive.
These adaptations may include developing layers of wax or hairs on the leaves and stems or shrinking the size of its leaves to become thorns. This is intended to prevent water losses so as to keep the water for themselves. This runs contrary to the nature of water, which is to flow. These plants have adapted the inherent nature of water for its survival. It does so at the expense of the system (or we say it has become individualistic).
The ultimate drought-resistant plant is cactus that grows in the hearts of most deserts of the world. Think what you see when you crack a cactus open. We see trapped water. The little water it takes in, it keeps it for itself.
When they begin to appear in our environment, it suggests that the soil on the surface has long lost its ability (to build loamy soil) to support sustained vegetation. Such variety of plants begin to thrive but causes rainfall levels to decline. This is since, they do not transpire. This causes the land to become even more dry which in turn encourages more of such plants. This latter view is often hidden from us until we surface this thinking as a cycle. Unlike earlier, these cycles are now becoming vicious in nature.
These vicious cycles do two things.
If we are not watching it, these cycles cause the issue to recur. They bring the problem back defying our efforts to correct it and do so with greater intensity in each iteration of the cycle. They typically throw our action plans off their courses. We see project implementation efforts as if they were failing.
These are what we see on the surface. That is the self-seeking nature of these cycles of causality. All is not what it seems.
Winning the Cycle
So how would we deal with such systemic directions and expect to win it?
To take care of the problem of water shortages, we would then have to take care of the water cycle. The whole cycle. Not parts of it.
What we saw here today is while your household may start greening your backyard, the combined effect of doing this collectively can be very powerful for a region on both the causes and consequences of rainfall for the region. This answer is not for just one country. We need to figure a way not to give up or be afraid to reach this out there in the region to everyone. I am sure you see that!
Given these, what would you say are the implications of some typical action plans that we make (and this happens to all countries), on such a cycle? Such as:
Recommending the growth of drought-resistant varieties of crops?
Producing livestock that depend on greens?
Production of brews?
Drilling or deepening of boreholes? Dam construction?
In each instance, would you see the rainfall levels increase or could it decrease over time? Would water table levels increase or decrease? What would be their consequences on growing of crops, on food security, growing of raw materials and in diversifying and developing a manufacturing base in the country? On employment?
Well, I am sure; you and your friends will figure these questions out!
This and their impact on the economy will be the subject of discussion next week in the final part of this series of the column on “Have Greens, Will Rain!” Till then have a lovely week discovering and learning!
This is the 4th segment of a five part series of this article. Each part will build on the earlier article to an eventual conclusion. We invite you to participate in the column as well as do your ‘own homework’ – searching and discussing the issue to build your own conclusions. Next month, we look at HIV, its causes and its effects.
As it appeared in the Sunday Standard, Botswana on Sunday November 25, 2012 edition.
What goes around comes around. The Good and Bad.
Today we move to the more exciting bits of this series!
We will uncover the vicious cycle causing water tables to decline and learn how they contribute to growing aridness to seeing the economy turn around.
The take-away from last week was if we take care of this long-term position, it will take care of the fast-changing short-term worlds for us (food security to household incomes). We ignore this; the cycle brings the problem back harder and faster. But such long-term positions do not happen by accident. There is a reason.
I left you with a question at the end of the article.
What is the circle of causality that is pushing the water table down?
What did you see? Perhaps you saw different versions of it. Looking carefully, they were not quite circles but were straight-line thinking. Linear thinking makes up parts of circular causal thinking.
So, let’s take a few examples.
Sometimes I get, the water table is down because our consumption levels have gone up. This is because population numbers and therefore its related activities have gone up. And this is because … and sometime we stop here. In half-jest I proceed by adding, that ‘while fertility rates are up we are not dying fast enough’. At this point, the class roars into laughter. Mostly at the ludicrous reasoning.
We also know this is so, because we know of countries, whose population numbers and life expectancy are way higher than ours, yet do not see declining water table levels (see Picture 1).
Tips
So, here’s yet another tip. Any causal factor used in a vicious cycle has to stand the tests of space and of time. The above reasoning has not withstood the test of space.
At other times I see, water tables are going down because the rainfall levels are going down, and rainfall levels are going down because global warming levels are up. Global warming levels are up because ….
Usually at this point, I would pause the group and question it. Does this line of reasoning suggest that before the advent of global warming, while the water tables may have been higher then, than it is today, were its levels rising with each year. Which means to say the water tables in 1960s or 70s were higher than it was in the 50s?
Stillness settles in the room. Sometimes, it is because we do not know if this is true, mostly because we have not seen the data. But again, it sounds like another ludicrous reasoning. The reason is not passing the test of time.
So, what have been your thoughts about the cycle? Had it looked like the above? Not to worry. It happens to the best of us.
So, what then is the circle of causality that is causing the water table to go down? To uncover the cycle, we would need to learn to watch reality like watching a movie – as if without shutting our eyes. Snapshots will not do. So here we go.
Watching the reality like watching a movie
Rainfall is a part of the story. Yes? As more rains fall on the earth’s surface, they run off into rivers and seas. And where they fall on land it sinks through the soil and seeps downwards. As they do so, they help to recharge underground aquifers which in turn help to cause the water tables to rise.
The reverse is also true.
The less rains fall, the less there are seepages and recharges the water tables fall instead. Here we have come back to last week’s question. But notice; be it whether it is good news or bad news, the causality is the same. So for now, we will continue watching the cycle as if it is positive.
Let’s go back to where we left off the cycle. When the water tables rise, what does that lead to happening next?
Here, imagine the water tables across the region rising through the underground soil. As they do so, we see more moisture in our soils and as they emerge through the surface, we would now have surface water. They could either become a pond or your dam. The more the underground water rises, the bigger the pond. And so is the reverse.
What happens when surface water rises? Just as when water levels drop in our dams, we impose water restrictions. Well, we may say, this time we allow consumption of water … by humans, animals and plants.
When we do not have enough water, notice who we take off the list first? Did you say plants? That’s usually true or we introduce plants that resist droughts. Then we try by as much as possible to share the available water resources between humans and animals.
To continue the thinking, we take it off from where we see plants consume water. Should we leave them out of the story; it will be less than about the whole. So, let us say plants consume water. What happens to the cycle next?
We are now more than half-way around the cycle. Remember we started with rising rainfall levels? And we have now reached partway around the cycle to increased vegetation (see Picture 2).
When the vegetation increases over time alongside with surface water, what do you think will be their impact on rainfall levels in the next cycle?
These will be the subject of discussion in Part IV of this series in next week’s column “Have Greens, Will Rain!” Well, I am sure; you and your friends will enjoy closing the cycle! You may notice different responses along gender or age lines. Try it out and notice.
Would rainfall levels decline? Or could they increase? What do you think?
Thinking ahead, what will be the impact of this causality on economic diversification?
Don’t forget the tips!
Till then have a lovely week discovering and learning!
This is the 3rdof a five part series of this article. Each part will build on the earlier article to an eventual conclusion. We invite you to participate in the column as well as do your ‘own homework’ – searching and discussing the issue to build your own conclusions.
As it appeared in the Sunday Standard, Botswana on Sunday Nov 18, 2012 edition
Cycle? What cycle?
In Part I last week, we were concluding that the water tables in the region were possibly declining.
This series of articles in November is a dedication to this subject.
It explores issues of primary industry (raw material) development to water consumption choices and their effects on families, the nature and the economies. In short, it underscores the story of diversification of any economy.
All of this will be discussed as we take a trip around the water cycle in this series of the column.
Water tables even if they are underground are part of the water cycle, originating when part of the rain that falls on the Earth’s surface sinks through the soil and seeps downward to become groundwater. Groundwater will eventually flow out of the ground, discharging into streams, springs, lakes, or the oceans, to complete the water cycle. (See Picture 1)
When asked how high is the water table and how it has behaved over time, most of us picked Pattern C (refer to last week’s article. See also red line here in Picture 1 below (refer to ‘Long-term depletion’, the line marked AB)).
That it has shown a general downward trend.
Such long-term trends become evident when we study past data spanning several decades. They usually escape the best of us when our attention is on what’s happening today (refer to the lines CD).
Here’s the implication of seeing such patterns over time.
The long-term depletion worsens the position of each short-term variation. We now have a persistent issue but is working its way to the levels of a crisis in the long-term. Such issues usually resist change and defy our best planning and implementation efforts beyond the short-term. It is a costly management process.
And if we imagined the water cycle, it would have begun to show signs of weakening intensity. The local weather conditions could see the likes of droughts or even floods. Of course, these conditions would reverse with long-term augmentation or increase.
In systemic thinking, we pay attention to these long-term positions rather than the short-term. This is because of the following reasons:
It is these long-term positions that determine what happens in our day-to-day realities. Ignore them and the realities get worse. These will help us become more realistic in our planning and implementation efforts;
The reasons that cause the long-term position are often very different from those that cause short-term positions; and so,
When we find those reasons, they will present areas that will allow us to turn the situation around. For good. It saves our resources.
Boiled Frog
To get there, it helps that the country as a whole learns to see and understand such patterns together, with the disciplined eye of a hawk. All of the time. Should we not, then like a boiled frog, it would lead us to deeper crisis unawares. We become the boiled frog instead.
And I left you with a question. How do we know for sure, that the water tables are indeed declining?
I am sure you have figured this one out.
You might say, well it is when we notice farmers dig their bore-holes deeper. And they do so, from time to time. You are right! This is an indication that the water table for his side of the land is behaving more like Pattern C and as the pattern continues to unfold the land becomes drier (a crisis is looming).
Does anyone know how deep some of the bore-holes in the Kgalagadi and possibly Namibia are? They did not start that way. They became that way.
The reverse, however, is true for the forests in the Amazon. Both are happening at the same time each with its deliberate direction and goal. This is what we, otherwise, call reality.
Uncovering the Cycle
However, most management concepts did not clarify that our straight-line goals are not designed to fight trends such as AB. They are designed to fight the shorter-term trends like CD. The latter, is an important view of the military and the fire-fighters. Crisis management.
Now, if the long-term position is true, i.e. if the water tables are going down, then we have a circular causality in our hands. This requires very different management tact. We would need to uncover the elements of the cycle to address these long-term positions.
Therefore, rather than ask what we should do about it, the next question here is what is causing the water tables to go down?
Meaning to say, if we say the water table is going down (in the long term), what is causing that? And in turn what is causing the cause? And so on. Think cycle. Get the idea?
And remember, even when you think you have got to the “root cause”, in this work, we say, even the root cause has a cause. Nothing exists without a reason. It is whether we see the reason or we don’t. In short, the 5Whys methodology does not work for persistent problems.
Do not forget to also go the other way in the cycle! Should the water table go down, there are consequences. Yes? And then what are the consequences of the consequences?
Here’s a tip. Should the circle not close in itself, then it is not the ‘right’ circle of causality. Start again but with a different set of reasons. This is a trick we use, before we understand more deeply the tools of this work.
Go ahead and try it! There is something inherent about wanting to see vicious circles, as hard as it feels like to get there; it captures our curiosity and intrigue.
So, … what is the circle of causality that is causing the water table to go down?
Well, I am sure, you and your friends will keep trying and enjoy getting there! This will be the subject of discussion next week in Part III of this series of the column on “Have Greens, Will Rain!”
Till then have a lovely week discovering and learning!
This is the 2nd of a five part series of this article. Each part will build on the earlier article to an eventual conclusion. We invite you to participate in the column as well as do your ‘own homework’ – searching and discussing the issue to build your own conclusions.
Ms Sheila Damodaran, an international Strategy Development Consultant in the use of systemic thinking for managing persistent issues at regional and sectoral levels, welcomes comments at sheila@loatwork.com. For upcoming programmes, refer to www.loatwork.com/Senior_Leadership_Introduction.html.
As it appeared in the Sunday Standard, Botswana on Sunday Oct 28, 2012 edition.
Supply of Labour
Industries (be they by locals or foreigners) do not exist for the sole purpose of employing citizens. Hard as it may be to accept this point, it really is not that difficult to see the reason.
What is harder to see is an unemployed economy will affect the growth of his industry. Not immediately. But eventually it will. Think most political revolutions. It is a sign of a vicious circle.
In last week’s edition of this column, we uncovered two factors that influence persistent unemployment in any country. These were:
The rates of growth of demand for labour (by employers) vs.
The rates of growth of supply of labour (by employees)
As the supply of labour (rising birth and migration rates) persistently exceeds demand, unemployment grows. This does not mean that our attempts at correcting the problem will not be successful. They will not be successful for the long-term.
On the other hand, as the demand for labour (number of new jobs created) persistently exceeds the supply, unemployment would decline (and literally disappear by itself).
This week, we explore the demand – a side commonly used by most of us when focussing on the problem of unemployment. In the next edition of this column, we will get around to supply.
But before we continue, what does the picture of growing demand for labour look like? We might say, well, that is obvious. We would see companies and industries recruit and persons as employees of their organizations. That’s where most of us would stop.
But that would not be quite enough here. We should see increasing numbers employed for the long-term. Possibly even for decades. And it happens primarily in the private sector. They are key. If these three conditions do not happen, then real and deliberate growth in demand for labour has not quite happened. Yet.
But what influences the demand for labour to grow consistently (rather than ad-hoc)?
It would require industries and the country to post a healthy growth of its income margins or profits. Year-on-year.
Margins / Profits = Level of Revenue Earned – Level of Costs Incurred
This difference needs to grow sustainably. Where revenues grow and costs decline, the industry is well positioned to create new jobs each year and pay for higher wages in other years. The reverse is also true. When the margins are negative, we would face sustained unemployment.
What would cause the margins to grow sustainably for any industry?
Asking this question is deliberate in helping the mind steer itself to the inevitabilities.
Does sustainable growth of margins happen because we are able to apply “do more with less” strategy, really well? Or, is it because sales have picked up for that industry. Well, yes, partly.
However, here’s the inevitable.
The extent to which we see sustained growth of margins depends on the extent margins or profits grow across ALL the three levels of industries in any economy, i.e. primary, secondary and tertiary industries. These three share a very tight systemic relationship!
As we take care of the whole, not parts of the economy, the nation grows. We all know that. AndI know we can turn this knowledge around with our hands and feet.
So what causes sustained systemic growth of all three types of industries?
Think tomato sauce. The cost of manufacturing and eventually retailing that sauce would depend on the cost of the transport and distribution systems (secondary industries) needed to transport the raw materials to the factory or retail sites as well as the cost of producing the raw material itself (i.e. from seed to fruit by the farming industry).
The transport industry, in this regard is secondary to manufacturing while farming of tomatoes is primary to both transport and manufacturing.
Should however, the costs of the primary and secondary industries for each unit of product produced increase over time, the tertiary industries would not be able to reverse those costs, much less grow without incurring further costs and will have their work cut out for them to stay afloat, much less see their margins grow in sustained ways. That is the reality. The experience will otherwise be like juggling balls. It will be hard to take our eyes off them because we do not know when they will fall.
When these costs are passed on to the customers or citizens, it makes it harder for them to find ways to fund continued private sector development efforts. Here we have now come full circle.
In most cases, the primary industry refers to raw material production, in particular crop production. As we grow our raw materials (as we have achieved with sorghum production), its secondary (farm and brew trucks) and tertiary (brew production and retail) industries will begin to grow as well.
Just as the white farmers in South Africa in the primary industries (vegetables, fruits, dairy and livestock production) have done for the Chinese and the Indians in the secondary and tertiary industries there (as well as here in major supermarket chains). This relationship, however, did not happen overnight. It took almost one hundred and fifty years in the making in South Africa (and not forgetting two centuries before that in India).
So for a nation to thrive (not survive), think the root of a plant. When the root thrives, so does the plant. When it dies, so will it and the other healthy roots around it will suffocate the plant out. Removing the top of the plant will not cause it to go away. The root will bring it back.
I am sure you see it! When the profit margins do not grow for all of the three industries, the number of new jobs created does not grow. Instead, unemployment grows.What is the implication of these to employment, you ask?
Where are we today as a nation on this graph?
Which industries are dominant for the nation? Which ones are not? Which industry do you see as driving the others? Would you like to be a part of or lead from that seat? I am sure you can!
What would cause the health of primary industry or production of raw materials to grow over time? This will be the subject of another column. But till then, I wish you, happy thinking and discussing.
So is unemployment the real problem or could it just be the tip of another problem? The iceberg. How do you see this issue? Go forward another twenty years from now. What could these trends look like then? Could this possibly affect the sovereignty of a nation? For any nation?
The 3rd instalment in this three part series of this article will appear in the next edition of this column. It will explore the supply side of the equation of labour and unemployment. Watch this space.
The Ministry of Agriculture is noticing the following situation (Case 1, Case 2, Case 3).
We pray for the rains to come. And they do, eventually. Often when we are at our most desperate. Sometimes they do not. It is possible someone out there is praying for rains not to come. There are inconveniences the weather brings with it. The floods, waters enter homes, the mud, the humidity, the sheer wetness, the leaking roofs, laundrys do not dry up, the house feels musty, lost businesses on the street, and so on. Of course, those who plant crops want to see rains.
What if it drizzled everyday? What would we say?
The nature of water cycles is such that the less we rains we receive over time, the less the rains that come back to us with time and space.
We learned in school about the water cycle. What we did not realize is, these cycles have a tendency to grow either positively or negatively with each iteration. They do not remain the same over time. This point was not made clear to us in our science and geography classrooms.
History and the reality today:
For the past forty years, the country finds it is not easy to meet its food production targets much less shake off its dependency on importing food from our neighbors. This is particularly so in areas where raw materials produced in the country (e.g. milk, vegetables, grains, potatoes) for the processing of foods (e.g. for tomato sauce, cheese, pesto) continues to face production shortages.
Current Strategy:
Each year, the government assists the population gear up to produce so that farmers may place food on their tables (food security which included having enough food for guests at funerals and weddings when the village descended on the events) as well as cash money from the sales of their produce in their pockets. Despite these efforts, we are not able to produce enough to meet the national consumption needs. Consumption (the hands that eat) has been and continues to exceed the level of the country’s ability to produce (the hands that produce). This story resonates for production of most raw materials across the country.
Seeing Complexity:
In my effort to understand the behaviour of agricultural production in the country, we examined historical annualized data that would allow us to see the behavior of production patterns of crops across the country. To do so, the Ministry, collected a twelve-year data of typical variety of crops produced within the country.
When the data came through, we noticed a rather unusual behavior over time of the graphs. This was something most people had not noticed previously.
There was a tendency for one type of crop to show a distinct increase in production levels over the years. The graph showed the crop resisted droughts better and was increasingly successful over time at doing so. Over time the peaks peaked higher.
This suggested that today compared to ten or thirty years ago, the levels of the crop produced had risen, sometimes by as much as six to ten folds high even if that included farmers finding alternative lands to produce the corps. This meant the crop had found new lands and hands even as old lands and hands had become barren; often at commercial levels and driven and supported by research efforts to use seeds that had even higher levels of resistance to droughts.
Conversely, we noticed another type of crop produced in the country showed a steady decline. It required more water for its survival. It was becoming less successful over time. The troughs in the pattern digged deeper troughs each time.
So which one in your view was rising and which one was declining?
The one that was rising was sorghum and the one that was declining was maize.
I was concurrently observing data on rainfall levels recorded for the past fifty years for the country. In general, rainfall levels declined steadily across many parts of the country, particularly in the western, central, northern and southern parts of the country. Where the pattern showed a distinct difference was in the extreme eastern parts of the country.
Do the results surprise you? We say in this work, statistics may lie. But trends do not know how to lie.
As these trends were unfolding, the Ministry was also resorting to choosing variants of maize that were hardier and more resistant to survive bouts of lower rainfall. This would mean, the seeds were able to grow into plants in the likes of sorghum, wheat, oats, barley and hybrid versions of maize without requiring a lot of water for its survival and at a shorter maturing period.
Are these patterns and outcomes a coincident? Is there a reason behind the behaviour of these graphs?
Think cactus. Cactus is the ultimate form of a drought-resistant plant. Yet, when we crack open a cactus what do you see? Water. Right? The nature of water is to flow rather than stagnate.
The more there are deserts, the more there are cacti. This is what strikes us when we first drive past a desert. Seeing cactus survive in a desert is a part of the story. They are sometimes held up as stories of our triumphs against odds. The reverse is also true. The more the cacti survive (just like when we as humans believe that we can beat the odds and overcome the challenges of desert living and that gives us a sense of achievement in) the deserts, the more the deserts are likely to also grow further.
Eventually the cacti (and us) may not survive the desert. At first the deserts would look like they are semi-arid. Over time, they become a true desert. And then ravines and canyons. How did that change happen?
So what could happen next should we continue to increase sorghum production?
What’s leading that thinking?
Think the word ‘food security’. Is the thought based on a sense of belief in oneself (as a farmer) and the land or is a thought or belief based on our fears of failure and survival of the self? Can a farmer who fears his hands may not grow enough food for all, be able to grow them in abundance? Or is he likely to produce just enough for himself?
What should the nation do?
Which nations in the world share a similar story to this? Where are they located? What percentage of the world do they make up across the globe? In what ways, do you think they may have an impact on the behavior of the weather over time? So are our efforts at agriculture production really thwarted by global warming or is it the making of our own actions in our own backyards?
Harsh Landscape
Lush landscape
Do these patterns occur by accident or could they be systemic? Given they have remained persistent for the past thirty years over wide spans of land, they assume a systemic nature!
Question:
What do these patterns mean? What is causing such patterns to behave the way they do? The peaks to peak higher and the troughs to dig deeper?
What are the implications should these patterns continue the way they do ten, twenty, thirty years into the future?
What would need to happen to reverse the situation? The choice depends on you!
Course Work:
If we could use the above to understand the story of poverty, what would we see?
How would one draw that systemic archetype?
What continues to happen or build for the long-term should the archetype not be healed and continued to persist?
What would need to happen to reverse the situation?


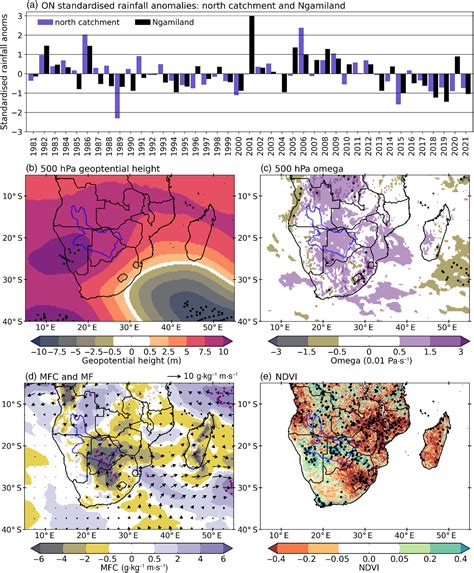

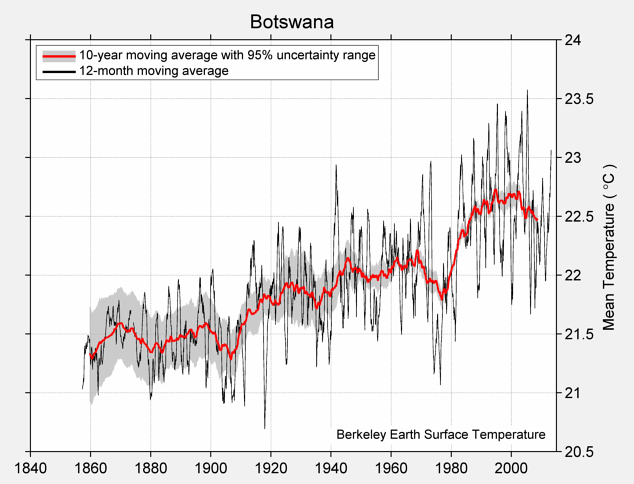


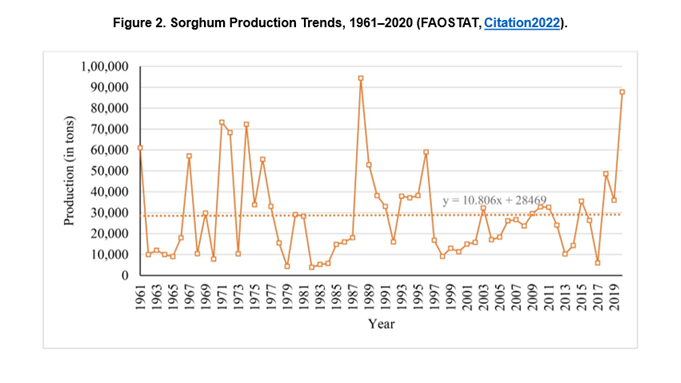
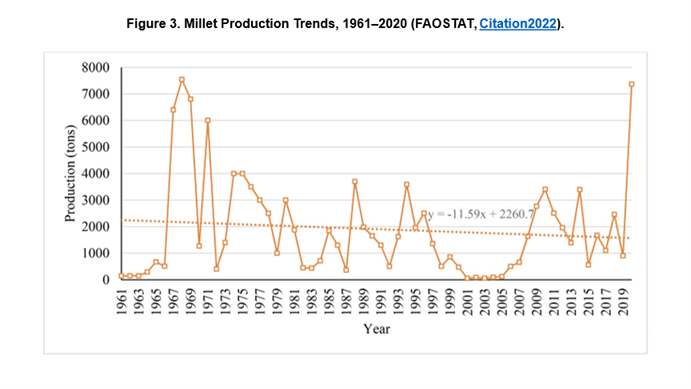


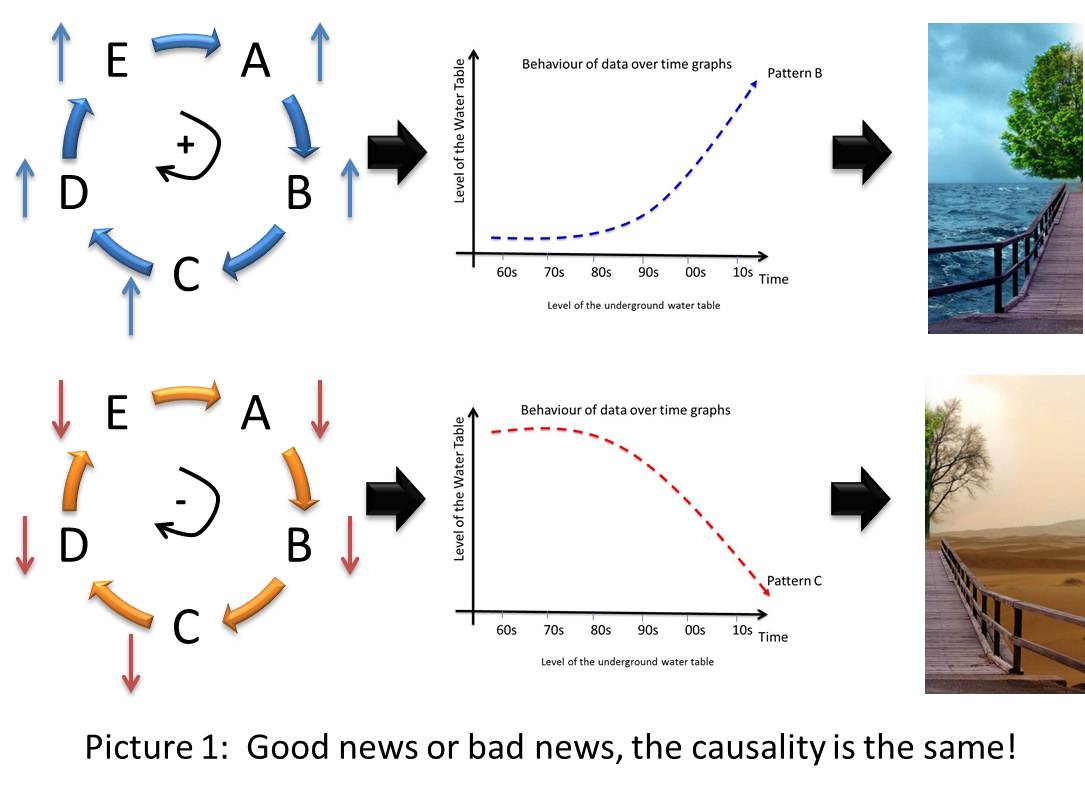
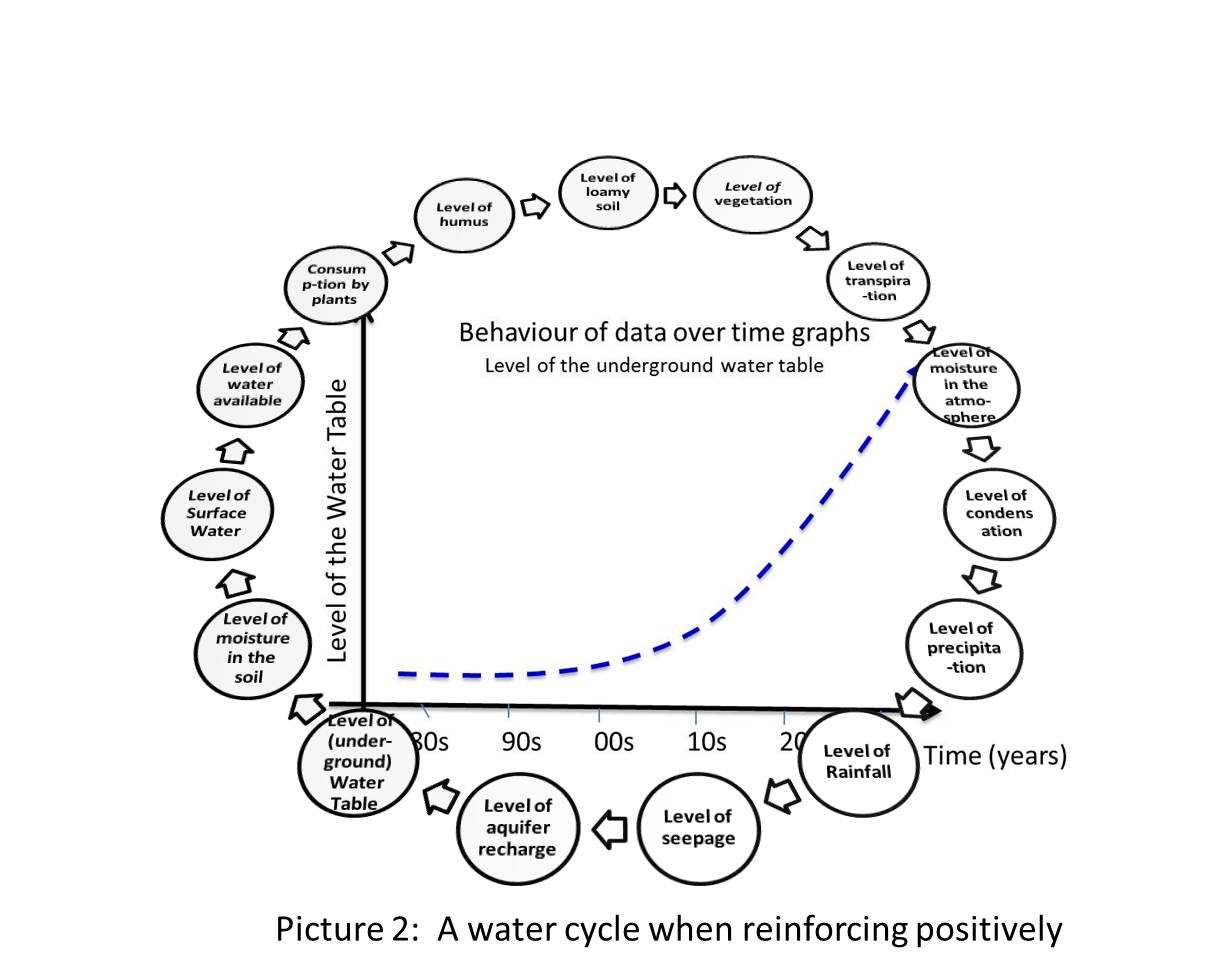


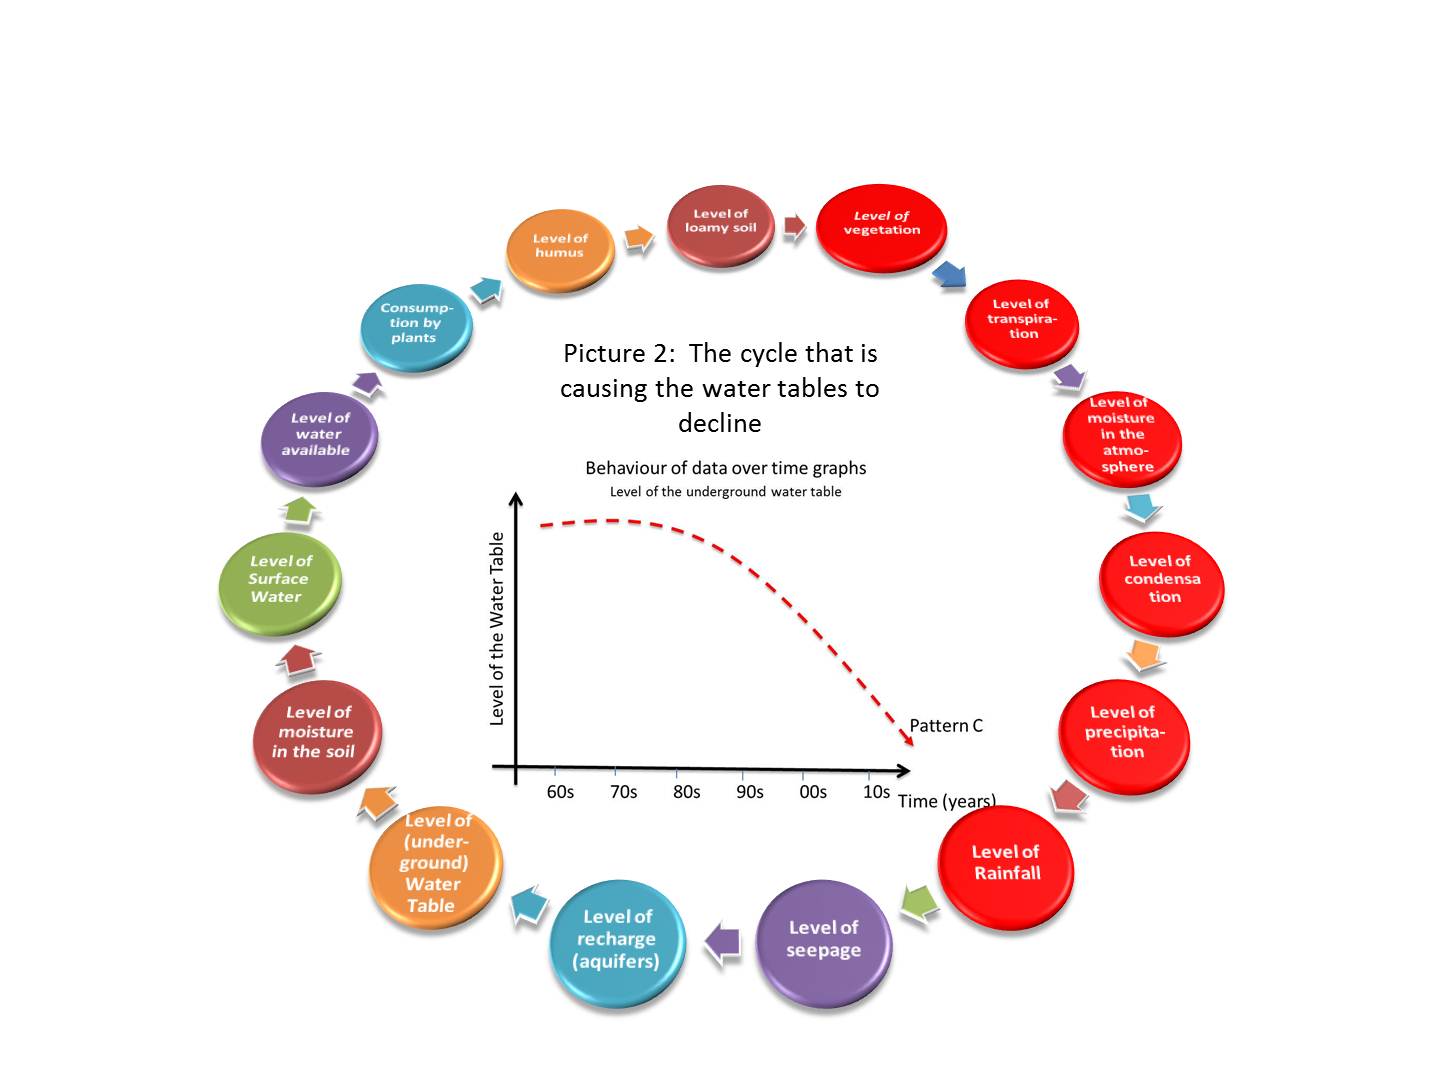


You must be logged in to post a comment.