The exchange that unfolded in the group illustrates something important about how people actually learn systems thinking. Contrary to how the discipline is often taught, people do not first need definitions, diagrams, or lectures about system archetypes. They need something far simpler.
They need to see a pattern that reflects their lived reality.
Once the pattern becomes visible, curiosity opens, and people begin asking structural questions on their own. What happened in the conversation therefore provides a natural template for a discovery-based pedagogy.
The learning process unfolds through a sequence of stages.
Stage 0 – Before Entering the Door
Park Your Reasoning at the Door
Before the graph is discussed, the facilitator establishes a simple but important discipline:
“For the moment, park your reasoning at the door.”
This instruction is not an attempt to suppress thinking. It does the opposite. It temporarily suspends premature explanation, allowing participants to look at the graph without immediately imposing familiar narratives or policy arguments on it.
Most people, especially professionals and policymakers, are trained to move quickly to interpretation. They begin explaining what the graph means before they have actually seen the pattern.
The instruction to park reasoning at the door creates a pause.
In that pause, participants are invited to simply observe.
▪ Look at the shape of the line. ▪ Notice whether the pattern is stable or volatile. ▪ Observe the behaviour over time.
Only after this observational step does interpretation begin.
This discipline matters because the human mind often rushes to defend existing explanations. When reasoning dominates too early, the pattern itself disappears beneath competing arguments.
By briefly suspending explanation, the facilitator allows participants to encounter the pattern directly.
Once the pattern becomes visible, reasoning can return — but now it is anchored in what has been seen, not in what was previously assumed.
In your conversation, this move appears in spirit when you guide the group to see the graph first, before discussing structures such as productive sectors, GDP expansion, or shifting the burden.
It is a small instruction, but it performs an important function: it protects the integrity of observation, which is the foundation of systems thinking.
If we refine this pedagogy further, Ms Sheila Damodaran, this opening discipline could actually become the signature entry point of the STRLDi method.
It would read something like:
STRLDi Rule #1: See Before You Explain.
And interestingly, this is exactly the opposite of how most policy discussions currently begin.
Stage 1
Start With a Graph That Reflects Reality
Learning begins with a Behaviour Over Time (BOT) graph.
In your case, the graph showed the pattern of persistent unemployment. Importantly, the graph was not introduced with explanation or theory. It was simply placed in front of the group.
The opening question was disarmingly simple:
“What do you notice?”
This move shifts the participants into the role of observers rather than recipients of knowledge. The conversation immediately becomes exploratory rather than instructional.
At this stage, the facilitator’s role is not to explain but to slow the group down long enough for them to see.
Stage 2
Recognition — Matching the Pattern to Lived Experience
Once the graph is presented, participants begin to recognise that the pattern reflects something they already experience in everyday life.
This step matters because people cannot engage meaningfully with ideas that feel far removed from their reality.
When the pattern resonates with lived experience, credibility emerges.
In the conversation, participants recognised that unemployment was not simply fluctuating randomly from year to year. Instead, the line revealed a persistent pattern over time.
That recognition creates a shift:
Before Recognition
After Recognition
A technical graph
A reflection of reality
Numbers over time
A social pattern
Abstract data
A lived condition
From that moment onward, the group is no longer analysing data. They are examining the structure of their own society.
Stage 3
Pattern Literacy
After recognition comes pattern literacy.
Participants begin to examine the shape of the line rather than the individual numbers.
Questions at this stage remain observational:
▪ Is the line random or persistent? ▪ Does it move dramatically or remain stable? ▪ What might produce such stability over time?
This is where systems thinking quietly begins to appear.
Stage 4
From Pattern to Structure
Once the group recognises that the pattern is persistent, the conversation naturally turns toward structure.
The key question becomes:
What kind of systemic structure produces a pattern like this? Please refer here for the full list.
At this point, the conversation in the group revealed a critical insight: job creation belongs primarily to productive sectors, not merely to sectors that inflate GDP figures.
Participants begin to see that an economy dominated by consumption, retail, or financial expansion may increase GDP without significantly increasing employment.
The graph therefore becomes a bridge between pattern recognition and structural understanding.
Stage 5
The Flip — Revealing Possibility
The most powerful moment in the discussion occurred when the graph was flipped.
The underlying data did not change. Only the perspective changed.
What had previously been interpreted as persistent unemployment could now be viewed as the missing path toward consistent full employment.
This move introduces possibility while remaining grounded in the same empirical pattern.
It prompts a new question:
What structural conditions would produce the flipped outcome?
This moment is crucial because it expands imagination without abandoning realism.
Stage 6
Archetype Recognition — Shifting the Burden
Once the structural discussion begins, participants are ready to recognise systems archetypes.
In this case, the archetype of Shifting the Burden becomes visible.
Instead of strengthening the sectors capable of absorbing labour at scale, societies often respond to unemployment through short-term measures:
government employment expansion
welfare support
retail growth
financial redistribution
crime controls
These responses temporarily relieve the symptoms but do not address the underlying structural drivers of job creation.
Participants therefore begin to see that the issue is not simply unemployment itself but the system’s habitual response to unemployment.
Stage 7
Discovery Ownership
The final stage in the pedagogy is psychological.
Participants begin to feel that the insight belongs to them.
This was clearly expressed in Thabiso’s reflection when he described feeling guided through the process while still owning the discovery.
That moment matters.
When people arrive at insights themselves, they do not experience the learning as external instruction. They experience it as personal understanding.
This is what turns systems thinking from an academic framework into a civic capability.
Why This Pedagogy Matters
What the conversation revealed is that systems thinking can spread through populations much faster than is often assumed.
The critical ingredient is not technical expertise. It is pattern literacy.
When citizens learn to recognise persistent patterns and ask structural questions, public conversations begin to shift away from debating symptoms toward understanding the structure of the system itself that generates (controls) the patterns.
As your conversation illustrated so clearly:
Sometimes all it takes is simply seeing the graph.
A farmer hires a young hand. Each night, no matter the weather, the young man goes to bed early. When a storm finally breaks, the farmer panics. He runs to check the fields. However, he discovers that the barn doors are fastened. The tools are secured. The animals are sheltered. The hay is tied down. Everything had been prepared. The young man could sleep when the wind blew, because his work was already in order.
Budgets without backbone
Currently, I observe the following trends in the country. All governments, past and present, have focused mainly on budgeting and disbursing the funds they receive. The machinery is geared to release money and “create a conducive environment.” It monitors. But it does this without actually planning the industry itself.
That is a shame. Because when we avoid planning the industry, we trap ourselves in an endless cycle:
cash allocations that don’t yield repayment,
borrowers who appear to build assets with money that does not belong to them,
and a country that thickens its skin the next time it seeks funding — all without seeing real economic growth.
There is also an unspoken hope that we will be let off the hook because “we are Africans.” But finance does not forgive weak structures.
Dividing what should be united
Each cycle, allocations are trumpeted to youth, women, and farmers. But in reality, these three are not separate categories — they are a family. Women and youth are embedded in family farms. To slice them into compartments for the sake of budgeting is not only wasteful, it is divisive.
True industry planning does not start with who gets the allocation. It starts with building the backbone that ensures profitability for all: demand mapping, planting calendars, logistics, markets, and reinvestment. Once this spine is in place, the benefits naturally flow to every farmer — whether woman, youth, or elder.
Why the backbone is ignored
The deeper reason this backbone is overlooked is the dichotomy we live with as a nation. We underplay the role of STEM in our economy and agriculture. Yet agriculture is one of the industries that most demands a STEM-disciplined approach. This ranges from governance structures down to the farmer’s choice of seed.
When land and GDP are tended by hands guided by STEM discipline, they produce predictability, scaling, and growth. When managed without it, results fluctuate with the weather, pests, and luck.
One hectare, two futures
To make this real: take two farmers, each with 1 hectare.
The STEM-hardwired farmer runs soil tests and balances water precisely. She selects the right seed for climate and disease. She also manages pests with foresight. Over five years, her profits grow steadily from BWP 80,000 to over 100,000.
The non-STEM farmer plants by habit and intuition. Some seasons bring decent returns, others collapse under shocks. Over the same period, his profits swing wildly, sometimes as low as BWP 5,000.
One farmer can reinvest and scale. The other cannot.
STEM as the Backbone
Agriculture is not only about soil and seed — it is about systems, and systems require STEM discipline. From governance down to the individual farmer, STEM makes the difference between sustained growth and endless frustration.
On the farm — with STEM
Seed selection: Matching varieties to soil type, climate, and disease resistance using agronomic trials and data.
Water management: Irrigation calibrated to evapotranspiration rates, soil moisture sensors, and seasonal rainfall models.
Fertilisation: Nutrient application based on soil chemistry analysis, preventing both waste and depletion.
Pest management: Integrated pest management (IPM) using monitoring thresholds and biological controls rather than reacting late with chemicals.
Scaling: Precision data provides confidence to expand from 1 ha to 2, then 10 — with predictable margins.
On the farm — without STEM
Seeds chosen by habit or availability, vulnerable to climate shifts.
Irrigation by “eye” — too much or too little water.
Pests noticed too late, leading to crop loss or costly sprays.
Scaling is a gamble; banks are hesitant to lend.
The result? Inconsistent yields, poor profitability, and farmers dropping out of horticulture.
In the system — with STEM
Data pipelines: Retailers share weekly SKU-level demand, analysed and published as crop calendars.
Forecasting: National dashboards project shortfalls or surpluses, triggering clear import or storage policies.
Logistics design: Cold chain hubs placed using flow models of supply vs. demand, not guesswork.
Finance: Lenders and insurers trust the system because data reduces risk.
In the system — without STEM
Ministries working in silos — Agriculture with farmers, Trade with retailers, no shared demand–supply map.
Imports opened or closed arbitrarily, undercutting local farmers.
Collection centres built as afterthoughts, often underused because produce doesn’t match demand.
Credit extended, but repayment fails because profitability was never secured.
The absence of STEM discipline is what gets in the way of building the coordination systems horticulture requires. Without it, money flows — but growth stalls.
👉 This section shows concretely: STEM is not just a “nice-to-have” in farming. It is the backbone of both productivity and coordination.
Scaling to the nation
Now imagine horticulture taking 30% of Botswana’s crop land (≈3 million ha), with STEM adoption rising over time.
Year
STEM Area (ha)
Non-STEM Area (ha)
STEM Profit (BWP Bn)
Non-STEM Profit (BWP Bn)
Total Profit (BWP Bn)
3
600,000
2,400,000
54.0
72.0
126.0
5
1,200,000
1,800,000
108.0
54.0
162.0
10
1,800,000
1,200,000
162.0
36.0
198.0
20
2,400,000
600,000
216.0
18.0
234.0
With a STEM backbone, national profits rise steadily and reinvestment becomes possible. Without it, volatility, waste, and default persist.
What leadership requires
The leader who takes this on will not just fix horticulture. They will demonstrate that Botswana can move from funding to building industries that plan and re-fund themselves.
That leader will be remembered for building the industry spine. It was the system that allowed farmers, families, and the nation to reinvest. It let them scale and finally sleep when the wind blows.
Closing thought
Botswana does not lack hardworking farmers. It lacks the discipline of coordination and STEM-driven planning that secures the barns before the storm. If we build that spine, we can turn volatility into predictability, allocations into industries, and families into investors.
Bought the seeds. Paid for inputs. Hired labour. Measured every drop of water. Watched over her crop with the kind of personal care only farmers understand. After weeks of nurturing, her cherry tomatoes gleamed on the vines — plump, red, and ready.
She took them to the retailer who once told her, “When you have them, bring them.” But when she arrived with her harvest, the same buyer turned her away.
“Who placed an order for cherry tomatoes?” the retailer asked.
No order meant no sale. Hours of sweet labour, investment, and determination — side-stepped.
And here’s the bitter twist (and a true story). Those very tomatoes had just won first prize at the national agricultural show. The nation had applauded her produce, yet her local retail shelves never saw it. By the time the retail chain placed its order, it was for imported cherry tomatoes. They simply did not know that, in their own backyard, a farmer was already producing prize-winning fruit.
Why this matters
This is not just one farmer’s story. It is a mirror of the system we all work within.
Horticulture farmers plant blind, not knowing what demand will look like when the crop matures.
Retailers scramble, relying on imports because there is no coordinated calendar of who is growing what, where, and when.
Policymakers toggle between bans and openings, without a real-time picture of supply gaps or gluts.
The result? Crops are wasted in fields. Empty shelves in shops. Rising import bills. And declining confidence among the very farmers we need to carry this sector forward.
The bigger issue
This story is not about one farmer. It is about a system where demand lives with Trade. Supply oversight sits with Agriculture. The bridge in between is missing. Farmers plant in hope, retailers stock in panic, and national policy oscillates between bans and openings.
How did other countries solve this?
How other countries broke the cycle
Netherlands: transparent flower and vegetable auctions give growers and buyers the same daily data.
Spain’s Almería region: cooperatives coordinate planting schedules, logistics, and marketing so no farmer is left stranded.
Kenya: a single horticulture directorate oversees both production and marketing, ending the “split brain” between ministries.
India’s Operation Greens: real-time demand intelligence and price stabilization prevent wipeouts from gluts and shortages.
This picture (which shows the split between Ministry of Agriculture and Ministry of Trade, and the missing coordination in the middle):
Note: This picture highlights a critical gap in Botswana’s horticulture sector.
On one side of each vertical line, the Ministry of Agriculture oversees farmers, extension, and production.
On the other, the Ministry of Trade manages retail, imports, and demand data.
In the interim, there is no coordinating mechanism. It is unclear who grows what, where, and when to match the actual demand in shops and institutions.
The result is wasted crops, empty shelves, and farmers discouraged from investing further.
A National Horticulture Coordination Unit can bridge this gap. It links production to market demand. It publishes clear crop calendars. This unit ensures imports are guided by real data—not guesswork.
Without this bridge, farmers will continue to plant blind. With it, Botswana can move from meeting 70% of its demand to achieving 100% and beyond.
Each of these countries built what Botswana lacks. It is a coordination spine that maps demand to supply. This gives both farmers and retailers a reliable compass.
What Botswana can do
Establish a National Horticulture Coordination Unit – jointly housed by Trade and Agriculture, with clear legal authority.
Publish a Horticulture Market Observatory – weekly retailer data (sales, volumes, gaps) made visible to farmers and policymakers.
Issue crop calendars by district – so farmers know when and how much to plant.
Invest in packhouses and cold chain hubs – so produce doesn’t die at the farm gate.
Set transparent import triggers – clear rules on when imports open and close, avoiding last-minute surprises.
We found several existing or emerging initiatives in Botswana. They partly touch on what we’re describing. Some are close to the supply-demand pipeline we want to build. Others are still missing elements. These might be things you can link into or build upon.
Publish a Friday snapshot + 8-week rolling forecast by district/crop.
Use FAO HiH tooling for the analytics layer. (FAOHome)
District Crop Calendars & Planting Targets
Start with top 8–10 veg; publish sow/harvest windows + target tonnage per district (refresh monthly).
Base targets on the Observatory forecast + Letsema/Tokafala signals. (Letsemahm)
Transparent Import Trigger Bands
Example: if projected supply <85% of demand for 4–6 weeks, open imports; >110% triggers processing/price-stabilization measures.
Announce changes via the Observatory (predictability for farmers and retailers).
Finance/Grant Conditionality
NDB/other windows require an assigned market slot (pre-order or auction) or alignment to district targets. (NDB)
90-day stitching plan (practical)
Week 0–2: Form a small Working Cell (MoA, MoT, Letsema, Tokafala, two retailers, NDB, FAO HiH).
Week 2–6: Stand up v1 Market Observatory (Google Sheet → public webpage); collect first 4 weeks of retailer SKUs.
Week 4–8: Publish draft crop calendars for two corridors (Gaborone–South, Francistown–North); recruit 50 pilot farmers via PYEC/TVET.
Week 6–10: Pilot Friday pre-order window at Letsema (listing + minimum volumes); Tokafala farmers prioritize listed SKUs. (Letsemahm)
Week 10–12: Announce import-trigger bands for those SKUs; align NDB grant/loan approvals to calendar slots.
The prize-winning tomatoes that never reached the shelf
The farmer in our story is not unique. Across Botswana, farmers are working with grit, faith, and long hours. They produce quality food. This food too often fails to meet the market. It is not because of their shortcomings. It is because the system has no bridge between production and demand.
Her cherry tomatoes were good enough to win the nation’s top prize. Yet they could not win a spot on the nation’s dinner tables.
That gap is what a National Horticulture Production Management System is meant to close.
Closing thought
Farmers can’t plant blind. Retailers can’t stock empty shelves. Policymakers can’t steer an economy on partial data.
Botswana’s farmers have already reached about 70% of local demand under difficult conditions. With coordination, transparency, and investment in the missing middle, that 70% can become 100% — and beyond.
The prize-winning tomatoes are proof that quality is here. Now it’s time to build the system that ensures such produce doesn’t just win awards. It must also win its rightful place on our tables.
Your thinking is incisive — and it touches a painful global fault line.
🔵 INTRODUCTION
Fifty years ago, and even twenty years ago, eyes would quietly roll. This happened even just five years ago whenever I presented the unemployment case study. I called for the expansion of our economic base into agriculture and manufacturing. The analysis didn’t align with what many in Botswana held close to their hearts:
That the best jobs were in government. That the safest path was one with proximity to the national coffers. That careers worth pursuing were those of teachers, police officers, lawyers, and doctors. These roles are seen as stable, respected, and state-salaried.
In that worldview, STEM was invisible. It was neither prioritized nor financed. STEM has powered the rise of every economy now leading the world into the AI age. It is evident in Physics, Chemistry, and Mathematics.
But fifty years have passed. And the reality today no longer matches the dream.
The government coffers are no longer overflowing. Public sector job creation has slowed. And those trained in roles of the past now find themselves unskilled for a private sector that never fully materialized.
Looking back, we can forgive the choices of the early years. Botswana was young — trying to find its way. But the next 50 years will not wait. And it will not be gentle.
The time has come to name a reality many have quietly lived with. We must do so with compassion but also clarity. The reality is that STEM evokes pain. For many, it stirs memories of failure. It triggers feelings of not being good enough. People remember being left behind in schoolrooms that favoured quick calculations over poetic thought. Avoidance is no longer an option. We live in a world where everything we eat, wear, or build is grounded in the sciences. We operate everything through AI, except perhaps politics.
This is not to dismiss the Arts. They are necessary. They help us make meaning of what we have just lived through. But they are languages of the past. They draw their strength from nostalgia, memory, and reflection. They do not engineer propulsion. To leap into the future, we need STEM. It should not only be a subject in school. It should be the architecture of economic survival, governance, and production.
Every country has lived through that pain. Every person who has had to reckon with their place in this rapidly changing world has experienced it. You’re not alone in having struggled with STEM. But at some point, as individuals and as nations, we must find the courage to move forward with it anyway.
The future will not pause while we make peace with our past. We don’t have to pretend it was easy. But we also can’t let that pain define what comes next. It’s time to rise — not because it’s easy, but because it’s necessary.
This post explores three possible trajectories for Botswana from this point forward. The purpose is not to predict the future — but to sharpen our awareness of what we are choosing today. Each path is plausible. Each has its own consequences. But only one, I believe, leads to durable sovereignty, economic coherence, and generational uplift.
Looking back, we can forgive the choices of 50 years ago. It was Botswana’s first united front — a young nation trying to find its way. But the next 50 years will not wait.
So the question is no longer: What happened?
The real question now is: What must we be prepared for?
✳️ Introductory Paragraph:
The world is not waiting. Nations are restructuring their economies, education systems, and regulatory frameworks to meet the demands of an AI-powered, STEM-led global future. That shift was happening as far back as 200 years ago. In the span of a single generation, decisions made today in classrooms will determine the fate of countries. Ministries and boardrooms also play a crucial role in shaping the future. These choices will show if they fall behind or rise to global relevance.
Botswana stands at a crossroads. Will it continue on its current path — redistributing value instead of building it? Will it adopt surface-level AI tools without a real production engine? Or will it invest deeply in science, technology, engineering, and mathematics (STEM) to build resilient systems and regional value chains?
This post presents three strategic scenarios for Botswana’s future. Each scenario is shaped by the country’s choices around STEM investment. Governance models also play a role. Additionally, it depends on its willingness to lead rather than follow. These scenarios are not predictions. They are tools for clarity, planning, and courage.
✳️ Rationale for Developing the Scenarios:
These scenarios were developed in response to a growing national unease. This unease is about youth unemployment, growing regulation, policy stagnation, and technological disruption. They build on insights from systems thinking, development planning, and decades of underutilised potential in Botswana’s public and private sectors.
More urgently, they offer a language to speak about what we stand to gain or lose. This depends on whether we choose to centre STEM. It applies not only in education but also in governance, regulation, and production. It affects how we imagine our collective future.
Let’s walk through a likely 20-year scenario for Botswana (and similarly placed countries) if the current structural discomfort with STEM continues and the world’s STEM giants surge ahead:
🛰️ Scenario 1 for Botswana 2045: The Global Tech Divide Is Permanent — and Botswana Is on the Losing Side
1. STEM-Powered Superstates Set the Rules
China, India, Europe, and the STEM-enabled Middle East now own the AI, bioengineering, fusion power, agri-robotics, and climate-tech markets.
These regions no longer just produce the technologies. They have embedded them deeply into how society is governed. They also affect how infrastructure is maintained and how jobs are distributed.
2. Botswana is a Spectator to AI, Quantum, and Bio Revolutions
Botswana becomes a net consumer without a critical mass of home-grown STEM thinkers. It becomes a net consumer, not a producer. Botswana is not even a critical consumer.
The few tech services it can afford are scaled-down versions, pre-processed for Global South clients.
“It’s like drinking recycled water from a smart city you never helped design.”
3. The Global North No Longer Needs Botswana’s Minerals
Rare earths and diamonds are either:
Synthesized artificially (lab-grown diamonds, mineral extraction from space debris),
Or sourced from more politically stable, tech-integrated African countries (e.g., Rwanda, Kenya, Egypt).
The era of passive mineral wealth is over. The illusion that foreign spending will keep the country afloat is gone.
4. Socialist Redistribution Politics Struggle Without Revenue
With mining income gone and agriculture un-modernized, the state has less to redistribute.
Workers expect “entitlements,” but there is no productivity beneath to fund them.
The gap between promises and possibilities widens — leading to unrest, brain drain, and populist distraction politics.
5. Botswana’s Youth Are Angry — But Undertrained
With AI displacing traditional white-collar jobs, and no local STEM industries to absorb the loss, youth feel betrayed.
Ironically, many turn to the very influencers and entertainers the system elevated. They then realise that the real wealth and influence now sits in the STEM world. This is a world they were never invited into.
6. Global Tech Powers Pick and Choose African Partners
STEM-rich countries like Egypt, Tunisia, Kenya, and Rwanda become African nodes for future development partnerships.
Countries like Botswana are offered climate preservation roles, or eco-tourism zones — but not a seat at the decision-making table.
Foreign powers may still invest in:
Preserving biodiversity, not industrialising it.
Buying carbon credits, not helping industrial growth.
Charitable tech access, not capacity building.
In other words: you may be preserved, but not empowered.
✋ And Yet, It Was Preventable
This isn’t a natural outcome. It’s a choice — or rather, a series of avoided choices.
Countries like Botswana had 20 years to:
Rewire education to prioritise STEM (especially Physics, Chemistry, and Mathematics).
Reform leadership pipelines to demand STEM literacy in public service.
Stop glamorising “soft visibility” professions and reward quiet technical mastery.
🌱 But All Is Not Lost — If Action Starts Now
“The best time to plant a tree was 20 years ago. The second-best time is today.”
If Botswana invests now in building a critical mass of 35–40% STEM graduates, with integrity-based leadership:
It can leapfrog into renewable energy, regenerative agriculture, AI-supported public infrastructure, and STEM-backed governance.
It can serve as a regional hub for climate-tech, AI-integrated agriculture, or precision medicine.
That pivot requires courageous honesty about where things stand now. It also demands a break from the illusions of safety in visibility, poetry, or legacy mineral rents.
⚠️ Scenario 2 for Botswana 2045: Decoupled Growth – AI Without Foundations
“Digitised but unrooted. Tech glitters, but the soil is hollow.”
Botswana aggressively adopts AI technologies. This occurs in government, banking, security, and communication. However, the country is not building a foundational STEM ecosystem in its schools, industries, and governance systems.
Short-term gains (next 5–10 years):
Government digitises services.
Youth pick up quick AI tools (prompting, low-code apps, etc.).
Startups and donor-funded tech incubators emerge.
But…
Medium-term outcomes (by 2045):
Local talent cannot maintain or advance AI systems they adopt.
Manufacturing and agriculture remain underserved and unautomated.
Foreign firms dominate data, tools, cloud access — Botswana becomes a data client state.
This scenario creates a false sense of progress, masking the lack of sovereign technical depth.
If Botswana boldly shifts today, it can achieve a 60% STEM throughput within 10 years. This effort will allow them to catch up on lost time. By 2045, a radically different future is not just possible, it is probable.
Let’s explore that future in contrast to the previous scenario:
🌍 Scenario 3 for Botswana 2045 — The STEM Leapfrog Nation
“It was once called ‘the locomotive of Africa’ — now, it’s the driver of the engine.”
🔁 1. From Extractive to Generative Economy
Botswana no longer relies solely on mining rents; it now exports AI-driven agri-solutions, climate engineering services, and biotech intellectual property.
Former mining towns have been converted into STEM production corridors: solar microgrids, geothermal research hubs, fusion training centres.
Local manufacturing has revived — not cheap and dirty, but clean, precise, and export-oriented, led by engineers and digital technicians.
🧠 2. Public Sector Transformed: Led by Technocrats
60% STEM throughput means that half or more of public officers now have backgrounds in Physics, Chemistry, Mathematics, or Engineering.
Ministries no longer “consult” technical experts. They are the technical experts.
Policies are evidence-led, deeply simulated using systems models, and include impact foresight.
Regulatory culture shifts from defensive overreach to agile risk-tolerant frameworks — because people finally understand scale, feedback, and irreversibility.
“The government is no longer a referee of progress. It is the architect of it.”
👩🏽🌾 3. Botswana Becomes Africa’s Agri-Tech Command Centre
With climate volatility peaking, Botswana leads in regenerative precision agriculture, satellite-aided irrigation, and AI crop disease forecasting.
Thousands of rural youth are trained as agri-coders, drone operators, soil lab analysts, and seed technologists.
Regions like the Kgalagadi have become agro-innovation testing zones in collaboration with Indian and Dutch research stations.
The African Development Bank labels Botswana “The First Resilient Farm Nation.”
💼 4. Unemployment Nearly Eliminated — But It’s Not the Old Jobs
While mining and retail decline, jobs in:
Cybersecurity
Energy systems
AI governance
STEM teaching
Circular economy manufacturing grow rapidly.
Rather than waiting for jobs, young people are founding companies that export services and products into Africa and beyond.
The informal sector shrinks as people shift from hustle to mastery.
🧬 5. A New Botswana Identity Emerges
The national identity is no longer rooted in “a proud past” alone — but in a shared, technical future.
Botswana celebrates its engineers, data scientists, agronomists, and inventors — as deeply as it once celebrated singers and soldiers.
National TV channels run prime-time STEM storytelling, and annual “Botswana Grand Challenges” inspire national innovation sprints.
Even Setswana proverbs are being re-interpreted to align with scientific insights — grounding STEM in culture.
“Ga se ka lerumo le le bogale fela — le ka ntlha ya boikwetliso jwa gagwe.” It is not only because of a sharp spear — but because of the preparation of the one who wields it.”
🤝 6. Global Partnerships on Botswana’s Terms
Rather than waiting for Global North investors, Botswana becomes a technical equal.
It co-develops AI laws with Europe, shares data infrastructure with India, and hosts Africa’s Southern AI Observatory.
The Global STEM Diaspora is returning — not to visit, but to invest and teach.
Botswana is now chairing continental panels on STEM ethics, regenerative governance, and space economy for Africa.
⚖️ 7. The Political Culture Matures
The age of “elite populism” fades, replaced by civic science culture.
Parliamentary debates begin with simulations and systems maps.
Leaders are elected not by slogans, but by demonstrated grasp of complexity and ability to lead multi-disciplinary teams.
Even the military has STEM-led strategic units in cyber, space, and climate security.
🎓 8. The Ripple to SADC and the World
Botswana exports:
Curricula for STEM-primary schooling
Faculty to newly launched universities in Angola, DRC, and Zambia
Policy blueprints for AI regulation and STEM justice
Motswana professors are now guest lecturers at MIT, NUS, ETH Zurich.
Regional neighbours model their youth employment strategies on Botswana’s STEM value-chain training.
🛤️ How Did It Happen?
Through a radical national reckoning — and 3 unshakable reforms:
A National STEM Commitment Charter — enshrined in law.
Public Service STEM Track — 60% of new hires must be from Physics, Chemistry, Mathematics, and Engineering fields.
STEM x Culture Narrative Rewrite — using schools, churches, influencers, and village elders to normalise technical ambition.
Botswana can catch up on lost time if it boldly shifts today. It must commit to a 60% STEM throughput within 10 years. Then by 2045, a radically different future is not just possible, it is probable.
Let’s explore that future in contrast to the previous scenario:
We will next develop the three scenarios for Botswana’s future — arranged in a clear, escalating arc:
As the world accelerates in AI, biotech, manufacturing and advanced agriculture, Botswana stands at a pivotal crossroads. The choices made today will determine whether it builds systems. They will also determine if it becomes a dependent participant. It may also end up as a bystander in decline.
Here are three strategic scenarios to frame Botswana’s possible futures:
🚩 Scenario 1: Status Quo – STEM Neglect and Decline
“Redistribution without production. Regulation without understanding.”
Botswana continues on its current path:
Low STEM enrolment (9%) persists, with youth drawn to tenderpreneurship, arts, and political sciences.
Regulations remain tight — not due to strategic caution, but due to lack of internal technical fluency.
Tenders dominate local opportunity, sidelining hands-on production and systems-building.
Foreign experts parachuted in but fail to leave lasting capacity or ecosystems.
Socialism is used as political cover, redistributing limited gains but failing to grow new wealth.
Consequences by 2045:
Botswana becomes a pass-through state, relying on outside systems and consultants.
AI, engineering, and biotech are imported, not created.
Economic sovereignty weakens as the country remains resource-dependent (diamonds, minerals, tourism).
Society grows more fragile, with growing unemployment and state spending pressures.
🧨 Trigger signs already visible:
9% STEM graduation rate.
P800M procurement losses vs P80M in value.
Tight, reactive regulation vs anticipatory system design.
⚠️ Scenario 2: Decoupled Growth – AI Without Foundations
“Digitised but unrooted. Tech glitters, but the soil is hollow.”
Botswana aggressively adopts AI technologies — in government, banking, security, and communication. However, it does so without building a foundational STEM ecosystem in its schools, industries, and governance systems.
Short-term gains (next 5–10 years):
Government digitises services.
Youth pick up quick AI tools (prompting, low-code apps, etc.).
Startups and donor-funded tech incubators emerge.
But…
Medium-term outcomes (by 2045):
Local talent cannot maintain or advance AI systems they adopt.
Manufacturing and agriculture remain underserved and unautomated.
Foreign firms dominate data, tools, cloud access — Botswana becomes a data client state.
Public servants regulate differently when they understand scale, causality, and systems. This understanding impacts agriculture, manufacturing, and national governance.
This is an exceptionally rich and nuanced insight. It examines how STEM training interacts with public regulation. Additionally, it looks into the psychology of governance in different cultural and professional contexts. It serves as a cornerstone theory in my essays or governance reform proposals. It moves past binary notions of “STEM = efficient” or “non-STEM = bureaucratic.” It offers a systems-aware reflection on how mindsets adapt under pressure, scarcity, and perceived incompetence (internal or external).
🧠 Core Argument:
Regulatory stringency is not a fixed trait of STEM vs. non-STEM officers — it is adaptive based on:
The perceived competence of the public
The regulator’s own confidence in the sector
The cultural cost of failure
The scarcity of employment alternatives
The systemic room for self-protection and/or justification
🧱 Foundational Assumptions
1. STEM-trained regulators are not necessarily stricter — they’re systemic thinkers.
They understand scale, cause-effect chains, and feedback loops.
If they know the population is also STEM-literate, they tend to trust the system more. They impose leaner guardrails, using design-based rather than rule-based control.
But if the public is largely non-STEM, they may tighten regulation not out of bureaucratic instinct. Instead, they do so out of risk containment. They understand that small oversights can become systemic failures. This happens due to a poor grasp of scale, probability, or consequence.
My metaphor: “placing a nuclear bomb in the hands of someone used to playing with matchsticks”. It is not only evocative. It is also pedagogically perfect.
2. Non-STEM regulators tend to regulate reactively — to protect themselves.
In high-risk, low-alternative job markets, non-STEM public servants tend to overregulate as a form of self-preservation.
Without training in dynamic modeling or experimentation, they view error as catastrophic and irreversible.
They may confuse over-control with competence. This confusion leads to unnecessarily rigid systems. These systems are often justified in the name of “safety” or “fairness.”
3. Moral justifications can blur into systemic corruption.
Particularly where a socialist moral code overlays public service, some regulators may:
View private success in technical sectors as “lucky” or “excessive”
Feel justified in extracting rents or benefits in the name of “sharing the wealth”
Enforce regulation unevenly — favouring insiders or ideologically similar peers
This is not always seen as corruption by the actors themselves. The dominant cultural narrative sometimes frames profit as unjust. It may also frame competence as elitism.
🔁 Summary Diagram
Let’s call this the “Adaptive Regulation Matrix”:
Regulator Background
Public STEM Literacy
Regulatory Style
Underlying Logic
STEM-trained
High
Lean, Design-Based
Trusts public, uses systemic tools
STEM-trained
Low
Tight, Risk-Averse
Concerned about amplified failure due to public’s lack of systems grasp
Non-STEM
Low
Overregulates
Self-protection, cultural shame, no safe room for failure
Non-STEM
High
Conflicted / Defensive
Feels exposed, may retreat to ideological or moral defence
🌾 Practical Implication for Agriculture & Manufacturing
Misjudging the demands of agriculture and manufacturing is spot-on and common.
These sectors are deeply dynamic — needing comfort with variability, technical risk, and iteration.
Officials who have never worked in these fields (and particularly lack physics/maths systems training) underestimate the number of decision points per unit time, leading them to:
Regulate from the surface (rules, licenses, audits),
Rather than from structure (supply chains, incentive design, capacity-building).
This often produces:
Bottlenecks in service delivery,
Stifled innovation at the grassroots,
And ironically, more systemic risk due to inappropriate controls.
💬 Quote:
“When people do not understand scale, they regulate the wrong lever. When they cannot see causality, they punish the wrong player. And when they fear losing control, they call it fairness.”
A citizen who understands the root causes of overregulation can respond wisely. These root causes include low STEM familiarity, fear of blame, and legacy bureaucracy. They will not just react emotionally. Here’s what they can do now, step by step:
🌱 1. Shift from Resistance to Education
Instead of fighting regulation head-on (which may trigger more defensiveness), educate regulators using:
Small pilot projects with transparent documentation
Clear data on risk mitigation, timelines, and projected outcomes
Simple visual models or production walkthroughs to show how things work
Think: “Let me help you see what I see.”
🗺️ 2. Speak Their Language — Reduce Their Fear
Understand that many public officers are not trying to harm progress, but are terrified of backlash or misjudgment. So help them:
Pre-empt their fears by showing what could go wrong — and how you’ve planned to handle it
Offer co-signatures or letters of responsibility to absorb risk if needed
Use analogies to help them link what you’re doing to something familiar
Think: “Here’s how this reduces—not increases—your burden.”
🧭 3. Create a Track Record of Trust
Document every success, timeline met, and compliance step
Let results speak louder than frustration
Share your performance with them privately before it becomes public — build allies, not adversaries
Think: “You can trust me to deliver safely.”
🔄 4. Start Building Peer Coalitions
Find other citizens or businesses affected by similar bottlenecks:
Form an informal coalition or working group
Approach ministries together to propose reform pilots
Push for multi-stakeholder dialogues that include producers, STEM professionals, and regulators
Think: “Together, our voice builds credibility for change.”
🧠 5. Bridge STEM Thinking into Policy Rooms
Offer to run seminars, write explainers, or consult on regulations in your domain
Frame it as upskilling support for government — not an attack
Share case studies from countries that succeeded after modernising regulatory logic.
Click here to see a scenario of us in 20 years. This includes what happens if we keep the status quo or if we choose to pivot now.
Think: “Let’s update the rulebook, not just resist it.”
💡 Final Thought:
The goal isn’t to remove all regulations. The aim is to help the system identify unseen aspects. This way, it can regulate wisely based on risk, not fear. That’s how you shift from being ruled by red tape to co-creating enabling environments.
“Does this system give the farmer clear, real-time information about how much to produce, when to produce, and where it will go?”
If the answer is no, the policy—like the food systems exposed in Rotten—may be setting them up for failure.
What I am describing is not nationalization in the strict sense (i.e. state ownership of farms), but rather centrally coordinated agricultural production — where the government, in partnership with national farmer associations, plans production to meet national needs and organized export targets, while the land and operations remain privately or corporately owned.
This model aligns more with:
Coordinated market economies (e.g., in parts of Europe)
Export-led agricultural systems (e.g., in Asia and Latin America)
Public-private agriculture governance structures
Below is a list of countries (or regional blocs) that most closely reflect this model, where government and farmer associations work together to ensure supply meets aggregated national and global demand without owning the farms:
🌾 Countries with Strong National Coordination in Agriculture (Non-Nationalized)
1. Netherlands
Model: Highly planned and tech-enabled production.
Coordination body: Ministry of Agriculture works closely with farmer cooperatives (e.g., LTO Nederland).
Export focus: Major exporter of vegetables, flowers, meat.
Tools used: Digital farm registries, production quotas, national R&D targets, and organized market access through co-ops.
2. France
Model: Strong Common Agricultural Policy (CAP) alignment.
Coordination body: Ministry of Agriculture + National Interprofessional Councils (interprofessions).
Mechanisms: Strategic sector plans, quotas, and export agreements within EU and globally.
Coordination: Ministry of Agriculture + Embrapa (agricultural research) + national crop boards (e.g., ABPA for poultry).
Tools: Satellite monitoring, national zoning laws, and crop forecasts for soy, beef, sugar, etc.
8. India
Model: Large-scale crop planning with farmer incentives.
Coordination: Central and state governments work with cooperatives and marketing boards (e.g., NAFED, FCI).
Challenges: Implementation complexity due to scale, but export crops like basmati rice, spices, cotton are heavily coordinated.
9. Thailand
Model: Coordinated value chains for rice, rubber, and fruit exports.
Coordination: Ministry + farmer groups + contract farming for export fulfillment.
10. South Korea
Model: Government sets supply and demand forecasts, supports cooperatives.
Example: Korea Agro-Fisheries & Food Trade Corporation (aT) facilitates exports and sets production planning.
🔄 Common Features Among These Countries:
Centralized data on supply & demand, often real-time.
Institutionalized partnerships between government, farmers, and exporters.
Use of permits, quotas, and forward contracts to stabilize markets.
Heavy investment in agricultural R&D, extension services, and export facilitation.
Sometimes involve minimum price guarantees or subsidies tied to national plans.
🌍 Notable Regional Example:
European Union (CAP – Common Agricultural Policy)
Supranational coordination of agricultural production.
Uses production planning, environmental standards, and trade negotiations collectively.
Member states develop National Strategic Plans under an EU umbrella.
❗️Where This Is Not Common:
Most of Sub-Saharan Africa: Lacks centralized systems due to fragmentation, lack of digital traceability, weak farmer cooperatives, and limited export integration.
United States: While subsidies and crop insurance exist, production decisions are mostly private. There’s no national production permit system based on demand forecasts.
✅ So to answer the question:
At least 10–15 countries today have strong, centralized coordination systems that match your description — though they do not own farms. These systems are more about:
Orchestrated agriculture – where national production is planned, monitored, and aligned with export strategies in partnership with organized farmer associations.
What Stopsa Country From Adopting Coordinated Demand-driven Agricultural Production?
A country is often not able to adopt coordinated, demand-driven agricultural production (without nationalizing farms) for six major reasons, each with multiple layers of structural and systemic inertia.
❶ Weak or Fragmented Farmer Organizations
Why it matters: Coordinated production requires organized producers (e.g., cooperatives, associations) that can receive quotas, participate in planning, and supply consistently.
What stops it:
Historical mistrust in cooperatives
Politicization or elite capture of farmer groups
Fragmentation: Too many small, uncoordinated actors
Weak leadership or lack of technical capacity in associations
Example: In Botswana, farmers often operate individually or in loose groups without strong aggregation mechanisms for production or marketing.
❷ Poor Agricultural Market Intelligence & Data Systems
Why it matters: Governments need real-time data on local production, global prices, weather, input access, and demand forecasts to guide decisions.
What stops it:
Absence of centralized production databases
Lack of investment in agricultural statistics and remote sensing
Disconnection between research bodies and policy decisions
Low digital infrastructure in rural areas
Without data, there’s no basis to permit, predict, or plan.
❸ Lack of Institutional Coordination
Why it matters: Coordinated production requires alignment across:
Absence of a national agriculture command-and-control dashboard
❹ Absence of National and Export Market Contracts
Why it matters: Export-led production thrives on forward contracts and pre-negotiated quotas with international buyers. These guide local production volumes and timing.
What stops it:
Limited international trade negotiations in agriculture
Poor branding of national produce (quality, consistency, certifications)
Weak or non-existent export councils for agriculture
Lack of investment in post-harvest handling and cold chains
In short: no buyers, no reason to scale production.
❺ Insecure Land Tenure and Weak Investment Incentives
Why it matters: Farmers need to feel secure to invest in scaling production to meet quotas. Private capital needs clear property rights to engage.
What stops it:
Customary or leased land not usable as collateral
Unclear title deeds or long delays in land allocation
Inconsistent tax and subsidy policies
Fear of state interference or lack of trust in public agencies
❻ Skills Gaps: STEM, Management, Agronomy
Why it matters: Coordinated production needs a skilled backbone — both in government planners and farmer-managers — who understand:
Market systems
Agribusiness logistics
Crop science and climate-smart production
Systems thinking for scaling
What stops it:
Education systems focus on “agriculture” but not core STEM
Extension workers lack upskilling in global trends
Low digital fluency across the agri-value chain
🧩 Underneath It All: A Missing Mental Model
At the heart of all these constraints is a mental model of agriculture as a:
Subsistence sector (not a commercial production industry)
Social policy tool (employment & land access) rather than an economic engine
Politically risky sector to regulate, due to voter sensitivities
Until this mental model shifts, efforts at coordination often stall.
✅ What It Takes to Shift
To transition to coordinated agriculture like the Netherlands, Denmark, or Vietnam, a country must:
Build national crop & livestock registries (traceability)
Mandate digital reporting of land use and yields
Empower farmer associations with planning & market access roles
Set up joint public-private Export Market Councils
Link national education to agribusiness STEM fields
Reorganize the Ministry into a strategy + data + extension nucleus
A transformation map for Botswana
Here’s a Botswana-Specific 10-Year Transformation Map to move from fragmented, input-subsidy-dependent farming to coordinated, demand-driven agricultural production that enables both food sovereignty and organized export markets — without nationalizing farms.
Goal: Shift to a system where production is guided by national demand + structured export contracts, via strong public-private coordination. Principle:Farms stay private; coordination becomes public.
🟩 PHASE 1: 2025–2027 – Foundation & Visibility
Theme:“See the System” – Map, Aggregate, Connect
Priority Area
Key Actions
Lead Entities
🧭 1. National Production Mapping
– Build digital registry of farms (land, crops, size, irrigation) – Use satellite + mobile reporting – Identify agro-climatic zones per crop
MoA, Statistics Botswana, Land Board, UNDP
🤝 2. Empower Farmer Associations
– Legal & capacity reform for existing associations – Support formation of national-level boards per major commodity (e.g., Potatoes, Horticulture, Poultry)
Registrar of Societies, Farmers Unions, Business Botswana
📊 3. Market Intelligence Platform
– Establish a digital dashboard for crop price, demand, weather, input availability – Run national demand studies & baseline exports
Ministry of Trade, MoA, SEZA
🔎 4. Rethink Subsidies
– Begin shifting ISPAAD & LIMID from blanket inputs to targeted support based on crop priorities and agrozones
MoA Policy Division, MFED
🟨 PHASE 2: 2027–2030 – Coordination & Control
Theme:“Guide the System” – Aggregate Demand, Set Targets
Priority Area
Key Actions
Lead Entities
📈 5. National Crop & Livestock Council
– Form a legally mandated multi-stakeholder council (Govt + Farmer Boards + Exporters + Researchers) – Use council to approve seasonal production quotas and export targets
Office of the President, MoA, Business Botswana
🔐 6. Contract Farming Expansion
– Pilot export-oriented contracts in garlic, potatoes, chilies, and beef – Sign regional procurement contracts (e.g., SADC school feeding, GCC retailers)
BITC, MoFAIC, Trade Attachés
📉 7. STEM-Agri Curriculum Reform
– Integrate data analysis, systems thinking, and agribusiness into SHS and tertiary agri courses – Establish internship placements on export farms
MoESD, BIUST, BUAN
💼 8. Professionalise Extension Officers
– Upskill officers in market systems, contract farming, regenerative production – Make performance linked to farmer productivity & supply alignment
Theme:“Run the System” – Export with Confidence, Invest with Trust
Priority Area
Key Actions
Lead Entities
🛫 9. National Export Board for Agriculture
– Consolidate oversight of agri-export promotion, standards, marketing – Align with customs, veterinary permits, cold chain logistics
MoA, BAMB, Botswana Bureau of Standards
🏭 10. Value Chain Finance & Insurance
– Develop crop insurance linked to production permits – Channel NDB and citizen equity funds through farmer boards – Attract private agri-finance via forward contracts
NDB, CEDA, BITC, BoB
🧠 11. Systems Research & Forecasting
– Use weather, market, soil, and input data to run production simulations – Use archetype-based insights to prevent overproduction, glut cycles
STRLDi, BUAN, MoA
🔄 12. Legislative Backing
– Revise National Agriculture Policy to reflect coordinated production model – Anchor it in Food Security and Economic Diversification strategy
Parliament, Attorney General’s Office
🧩 SYSTEM FEATURES ENABLED BY 2035:
✅ Production permits based on demand forecasts (not guesswork)
✅ National farm registry and traceability system
✅ Data-driven price stabilization and export contracting
✅ Digital dashboards at MoA and Districts for planning
✅ Professionalized farmer base (similar to manufacturing)
✅ Resilience against import bans and regional shocks
🔄 Optional: 4-Year Electoral Fit (2025–2029)
To align with political cycles, Phase 1 and early Phase 2 deliverables can form part of a presidential or ministerial results agenda, showing clear progress before elections.
My Inspiration for this Post
If you are a farmer or an agriculturalist (at any level), then you should watch this! Now!
Here’s a structured rundown of Netflix’s Rotten—the documentary series that inspired my reflection on farmers caught in volatile price cycles. It exposes how hidden market dynamics, fraud, and corporate systems hurt producers, often those at the very bottom of the chain.
📺 Overview of Rotten
A Netflix original investigative series (first season released January 5, 2018; second season October 4, 2019) with a total of twelve episodes across two seasons, each exploring corruption, fraud, and exploitation in global food systems (GQ, Wikipedia).
🔍 Season 1 (6 episodes) – “True Food Crimes”
1. Lawyers, Guns & Honey
Uncovers massive honey adulteration—beekeepers struggling to compete with cheap, syrup‑diluted honey flooding the U.S. market from China and other countries. Domestic producers are squeezed out, and regulators struggle to detect fraud (Garden Culture Magazine).
2. The Peanut Problem
Investigates a surge in peanut allergies in the U.S., linking it to shifts in processing, environment, and early childhood exposure. Highlights how industrial peanut systems affect public health and put pressure on farmers to keep up with opaque demand trends (Allergy Amulet).
3. Garlic Breath
The most gripping episode: a legal and ethical battlefield between Chinese exporters (some using prison labor) and U.S. garlic farmers. It reveals how global supply shocks, trade disputes, and price dumping devastate small producers (GQ).
4. Big Bird
Focuses on poultry production, showing how large-scale consolidation and export-driven demand distort local markets and compress margins for independent growers, often underregulated (GQ).
5. Milk Money
Centers on the raw milk controversy in the U.S., juxtaposing small dairy farm viability with public-health risks. It highlights how fear-based regulation and consumer mistrust can impact livelihoods without clear national strategy or market clarity (David Gumpert, GQ).
6. Cod Is Dead
Explores overfishing, regulatory loopholes, and global demand for seafood, showing how small fishing communities fall prey to industrial fleets and opaque supply chains, often without knowing who consumes their catch or at what price (Los Angeles Times, GQ).
🌍 Season 2 (6 episodes) – Deeper on Commodities & Ethics
Includes stories like:
The Avocado War – Supermarket chains squeezing small growers in Latin America.
Reign of Terroir – How terroir branding is co-opted by big players.
Troubled Water – Bottled water scams that leave communities thirsty.
A Sweet Deal, Bitter Chocolate, High on Edibles – covering sugar, chocolate production (including deforestation and labor abuse), and cannabis edibles respectively (Wikipedia).
🧩 Cross‑Cutting Themes
Global supply shocks and price volatility leave producers blind to demand, often overinvesting and ending in ruin.
Food fraud and adulteration undermine trust and crop value (honey, garlic, chocolate).
Corporate consolidation & opaque trade—big buyers and multinationals capturing margins, leaving farmers in informational darkness.
Labor exploitation, especially in low-cost producers like prison farms in China or cocoa plantations under slavery-like conditions.
Regulatory dysfunction: government bodies failing to protect small producers or clarify demand forecasts.
Emotional storytelling draws empathy—but also criticism for dramatizing issues over structural analysis (GQ).
🧑🌾 Relevance to Farmer Experience
Your concerns—that small farmers invest blindly, with no real insight into national or export demand, and thus suffer catastrophic losses—mirrors Rotten’s narrative. Farmers often don’t control:
Market entry or exit timing,
Price contracts,
Export pathways or demand data.
They’re typically stuck reacting rather than planning—leaving them vulnerable to price crashes, import floods, and external shocks. The series underscores the human toll of systemic opacity and misalignment.
✅ Summary Table
Episode / Theme
Key Insight
Impact on Farmers
Honey adulteration
Price-undercutting by fraudulent syrup imports
Domestic beekeepers driven out or starved
Garlic dumping
Global trade wars, forced labor, export inequality
U.S. garlic farmers lose ground and market share
Commodity allergies
Shifting health trends and processing norms
Peanut farmers suffer demand unpredictability
Poultry, fish, dairy
Export pressures and consolidation
Small producers edged out, price and demand opaque
Did the documentary reach the conclusions we reached here?
No, the documentary Rottendoes not explicitly reach the conclusion we’ve raised here — that coordinated, demand-driven national production planning is a necessary safeguard for farmers.
Instead, Rotten does the following:
🎥 What the Documentary Does Say:
It exposes the invisible machinery behind food systems — fraud, monopolies, unfair trade, exploitation, price dumping.
It empathizes with small farmers who suffer under market opacity, global trade forces, and power imbalances.
It documents farmer bankruptcies, family trauma, and systemic silence that precedes collapse.
It often frames these as consequences of deregulated capitalism, consolidation of corporate power, and corruption in trade.
🧠 What It Does Not Do:
It does not explicitly propose national production permits, demand forecasting, or farmer-board coordination as solutions.
It does not draw a policy systems map or push for governance reforms like those we are advocating.
It largely avoids proposing structural solutions, staying in the investigative and emotional storytelling space rather than systemic policy design.
✅ So, What Have We Done Differently?
We have taken Rotten a step further by:
Translating narrative diagnosis into policy prescription.
Where Rotten shows the symptoms, we’ve proposed the systemic cause and a coordinated solution.
The documentary paints the tragedy. We’ve used it to frame the design.
This is precisely the value of the systems thinking lens—where stories like Rotten become entry points to expose structure, delay, loop dynamics, and system traps that can be redesigned.
📄 Policy Memo: From Rotten to Resilient – Why Botswana Must Coordinate Its Agricultural Production
To: Ministry of Agriculture, Trade & Industry, Office of the President From: [Your Name / STRLDi] Date: [Insert Date] Subject: Preventing Farmer Collapse through Coordinated, Demand-Driven Agricultural Planning
🎬 Background Inspiration
The global food documentary series Rotten (Netflix, 2018–2019) offers a sobering account of how disorganized, opaque, and exploitative food systems ruin small producers. While it focuses on the U.S., China, and Latin America, the core lessons are deeply relevant to Botswana’s farmers:
“What destroys the farmer isn’t drought or pest—it’s the silence before the market crashes.”
🚨 Key Lessons from Rotten
Episode Theme
Underlying Failure
Result for Farmers
Honey Fraud
Lack of quality regulation & import control
Local beekeepers undercut & collapse
Garlic Dumping
Unregulated trade, forced labor, price flooding
Local garlic growers sued, outcompeted
Poultry Consolidation
No control over contract terms, production quotas
Chicken farmers left with losses
Milk & Fish Episodes
No demand forecasting, oversupply, regulatory chaos
Prices crash; family farms shut down
🇧🇼 The Botswana Parallel
Farmers across Botswana face the same pattern of systemic vulnerability:
They produce without visibility into national or global demand.
They invest heavily without guaranteed buyers.
They enter markets that can be flooded by cheaper imports or fail due to price crashes.
Their fate is sealed when production is treated as individual initiative, not collective strategy.
🔑 Policy Recommendation: Coordinate Agricultural Production
Botswana can avoid this fate—not through state ownership, but through central coordination with decentralized production.
What Needs to Change
How to Implement It
❌ Farmers produce blindly
✅ Establish seasonal production permits & quotas based on national + export demand forecasts
❌ No market visibility
✅ Develop a National Agricultural Intelligence Platform (real-time price, supply, demand)
❌ Weak farmer associations
✅ Mandate and professionalize crop-specific national producer boards
❌ Reactive policies
✅ Use predictive modeling, weather & trade analytics to plan ahead
❌ No export assurance
✅ Pre-negotiate contracts via Export Market Councils (public-private)
📈 Strategic Benefits
Reduces price volatility for both producers and consumers
Prevents overproduction gluts and underproduction shocks
Builds investor confidence in agribusiness supply chains
Protects smallholder farmers from being the last to know—and the first to suffer
🧠 The Rotten Test: Ask of Any Policy
“Does this system give the farmer clear, real-time information about how much to produce, when to produce, and where it will go?”
If the answer is no, the policy—like the food systems exposed in Rotten—may be setting them up for failure.
📌 Closing Note
The stories of collapsed garlic farms, ruined poultry growers, and poisoned fishers in Rotten show us one thing: a happy family at the breakfast table doesn’t come from heroic individual effort—it comes from a system that plans, protects, and pays. Botswana’s farmers deserve no less.
“Strategic Reflection: Toward a Regenerative Botswana Economy”
What if the real challenge in governance isn’t corruption or inefficiency? Instead, it may be the absence of a shared, cross-sector system. Such a system can hold a vision over time.
Around the world, the systems we’ve inherited were designed for different eras. Some were from the colonial era, and others from the industrial era. Few are built to match the complexity, interdependence, and generative potential of today’s global economy.
And in Africa, our response to this gap is long overdue.
So, what might such a system look like?
The method of sustaining employment through government tenders, grants, and extractive economies for export is reaching its limit. This approach has been used across the public, private, and informal sectors. Tax revenues generated from foreign investments are redistributed into health, education, security, and infrastructure. This model, while protective and supportive, lacks growth in high-value (90%+) productive activities by its population in agriculture. This is needed in processing and manufacturing. Such growth is essential for long-term economic resilience and creating national wealth.
If Botswana is serious about diversifying its economy and building enduring, generational wealth, this model must be reformed, i.e. from a redistributive to regenerative economy.
Any wealth accumulation by the nation before taking this foundational step risks being premature. It could be unjustifiable and border on a misappropriation of public trust and resources.
In this transformation, it is imperative that the government’s socialist functions are gradually reduced. These functions include providing direct support to youth, women, and the elderly. In fact, these functions will fall away naturally as families stabilize. A generative, production-based economic model will enable the core family unit to re-assume responsibility for their well-being.
Dividing these groups for short-term political gain may yield momentary advantage, but it results in long-term economic fragmentation and loss.
What then is a structured governance workforce distribution model for Botswana, based on a projected population of 5–8 million (from today’s 2.5 million) over the next 30 years, with a per capita wage of P20,000 (cf to today’s P1,600) and a GDP of $60–100 billion (today’s $20 billion). The focus will be on recommended private vs. public sector workforce shares and a detailed breakdown by ministry.
This post presents a structured overview of Botswana’s current governance architecture. It comprises Ministries, Parastatals, and formal Public-Private or Community-Inclusive Structures. All of these are currently funded through the government payroll. Building on this foundation, the report then introduces a proposed governance body. This body is designed to lead Botswana into a future anchored in regenerative, value-creating economic transformation.
POST ROADMAP:
Given the post’s depth and evolving focus, we are providing a simple outline that will help readers stay oriented.
In This Post – Recalling What Governance Meant – Seeing What the World Is Showing Us – Why Africa’s Frameworks Must Evolve – Rethinking Our National Structure – Lessons from the DM Model – The Next Step Forward
🧩 Inquiry Roadmap – Guiding Questions Behind the Essay
Here’s a list of guiding questions used in the development of the full essay.
The essay is titled “When the World Speaks – Governance BW”. This list acts as a roadmap of inquiry. It traces the intellectual journey from challenge recognition to structural diagnosis. It continues to the design of a proposed national governance framework. Finally, it leads to the integration of policy learning from the DM model.
These questions were raised across multiple conversations over the past 2–3 weeks (with DM model-specific queries toward the latter part). Use them to orient yourself as the reader at the start of the essay. They invite you to walk the same arc of discovery.
🌍 SYSTEMIC PATTERNS & CONTEXTUAL FRAMING
Why do we continue to experience policy and governance failures even under capable leadership?
Are we suffering from individual incompetence, or structural design limitations?
What do governance collapses in wealthy nations (like the US, UK, France) reveal about deeper, global system failures?
What invisible assumptions and outdated structures still drive governance decisions in post-colonial African countries?
🧠 SYSTEMS THINKING & ARCHETYPES
How do systems archetypes (e.g., Growth & Underinvestment, Shifting the Burden) explain the persistence of unemployment and underdevelopment?
Why do investments in key sectors fail to produce long-term transformation?
What is the cost of failing to reinvest into production systems (e.g., agriculture, STEM, trade readiness)?
How do beliefs around status, education, and short-term relief distort structural priorities?
🧱 GOVERNANCE DESIGN & VISION
What type of governance structure would allow ministries and the private sector to jointly lead national transformation?
How can we design a governance body that transcends political cycles and operates with long-term, technocratic continuity?
Should national strategic leadership be led 65% by private sector actors?
How do we retain political legitimacy while introducing structural discipline?
🧩 STRUCTURAL ROLES & DIFFERENTIATION
What is the role of the new governance council versus ministries or existing agencies?
How do Deputy PMs for Growth and Stabilisation unlock this structure?
What kind of regional integration bodies (e.g., value chain councils, export readiness platforms) need to be embedded?
How does this proposed structure compare with traditional silos or “super-ministries”?
🛠️ DEVELOPMENT MANAGER MODEL – DEEP DIVE
These questions came up during the second phase (last week). They shaped the integration of DM lessons into the governance proposal.
What was the Development Manager (DM) model in Botswana originally responding to?
What failures or inefficiencies in pre-DM structures made the model necessary?
Did the DM model reduce cost overruns, delays, and patronage as intended?
Who benefited most and least from the DM model?
What scope changes were introduced by ministries, and what penalties (if any) were imposed?
Did the DM model incentivize good planning, or shield poor performance?
How do we distinguish the DM’s role from the proposed national governance framework?
What reforms are needed to align DM performance with strategic national goals?
⚖️ REFORM & ACCOUNTABILITY MECHANISMS
Should ministries that trigger scope changes bear financial responsibility (variation cost attribution)?
How can we cap government-backed project budgets, forcing external sourcing for overruns?
What role can an independent Variation Review Panel play in containing costs?
Should a Ministry Performance Ledger be introduced to publicly track project delivery?
What systems of consequences and learning loops are needed to sustain structural integrity?
🧩 STRUCTURAL INTERFACE: DM MODEL & GOVERNANCE FRAMEWORK
If the governance framework doesn’t manage infrastructure directly, what does it do?
How do the governance body and the DM model complement each other?
Who governs the DM model, and what strategic scaffolding does the governance structure provide?
Why is it important that private sector manage private-sector-oriented delivery structures?
🌱 NARRATIVE & IDENTITY
What kind of national identity does this new governance structure invite us to build?
How can we communicate this proposal as a values-driven, systems-grounded national renewal — rather than a technocratic power shift?
Reader’s Roadmap: What This Essay Asks and Answers
This essay was not written in one sitting. It was shaped through weeks of inquiry, questioning, and collaborative reflection. Below is a guide to the key questions that shaped its development. You are invited to walk the same arc of discovery.
Why do governance systems fail — even in capable nations?
What outdated structures still constrain post-colonial governance?
Can systemic patterns explain persistent underdevelopment in Botswana?
What does a reimagined governance model look like — and who leads it?
What lessons can we learn from Botswana’s own Development Manager model?
What reforms are needed to build accountability, investment readiness, and national pride into our governance design?
How can we collectively build a regenerative, globally integrated economic engine — rooted in systems thinking and national identity?
🏛️ Ministries
Below are the key Ministries under the central government (Cabinet formed November 2024–March 2025):
Office of the President & State President (presidential affairs, communications, ethics/integrity, disaster, audit, electoral, etc.) (gov.bw, finance.gov.bw)
Botswana Geoscience Institute, Innovation Hub, Accountancy College, Energy Regulatory Authority, Examination Council, National Development Bank (NDB) (gov.bw, en.wikipedia.org, gov.bw, imf.org, en.wikipedia.org)
These parastatals receive government payroll support and are overseen via shareholder compacts monitored primarily by the Public Enterprises Evaluation and Privatization Agency (PEEPA) under the Ministry of Finance (imf.org).
🔗 Public–Private–Community Governance Structures
PPP Unit (Ministry of Finance & Economic Development)
A dedicated PPP Unit, formed under the 2009 PPP Policy/Implementation Framework, coordinates private sector involvement in infrastructure/social projects; it approves and manages project-level PPP committees (blogs.worldbank.org).
PPP Project Committees
Established for each PPP initiative, these include government, private sector partners, and sometimes community representatives, under contractual performance frameworks (blogs.worldbank.org).
Local Government Councils (e.g., Gaborone City Council)
Councils include elected community councillors plus municipal staff; they collaborate with parastatals like Water Utilities Corporation and BPC, and run public services such as clinics and schools (en.wikipedia.org).
Ministry Offices with Community Functions
e.g., Ministry for State President includes Offices like coordinating disability services, disaster management, district administration, ethics, corruption prevention and public communications (gov.bw).
📌 Summary Table
Type
Examples
Includes Private/Community?
Ministries
Listed above
Mostly public-sector, some incorporate District admin
Parastatals
~62 SOEs (BPC, BoFiNet, NDB, etc.)
State-owned, commercial services
PPP Governance Structures
PPP Unit, PPP Committees
Formalized private-sector partnerships
Local Councils
Gaborone City Council, other municipal councils
Elected community leaders, parastatal coordination
✅ Conclusion
Botswana’s government payroll landscape spans from traditional ministries and SOEs to community-inclusive municipal councils and formal public–private partnership structures. The PPP Unit and Project Committees primarily connect the government to private-sector collaboration. Local Councils provide community‑led governance below the national level.
WHAT THE WORLD IS SHOWING US
Which countries lead in the top three by volume produced per capita for manufacturing?
Here are the top three countries by manufacturing value added per capita, based on the most recent data (UNECE):
🏅 Top Three (Value Added in USD per Capita)
Liechtenstein: ~ 63,000 USD
Switzerland: ~ 19,000 USD
Norway: ~ 5,200 USD
These figures refer to manufacturing value added per person in each country, not total output (w3.unece.org).
🧭 Context & Interpretation
While nations like China, United States, and Germany dominate in total manufacturing output, per capita measures offer a different perspective. These measures highlight smaller economies with high-value industrial sectors. These sectors are often in specialized and capital-intensive manufacturing.
For example, Liechtenstein tops the list due to its robust precision manufacturing industry combined with a small population (ft.com).
🔍 Why Does This Matter?
Per capita metrics normalize for population and reveal how much manufacturing “productivity” each person contributes.
High per capita values often signal economies focused on advanced, high-tech, or luxury manufacturing, rather than large-scale mass production.
🆚 Compare with Total Output
For comparison, consider these total manufacturing leaders in absolute terms (2023):
But when adjusted per person, countries like Liechtenstein, Switzerland, and Norway emerge as the clear leaders.
How Governance Structures Shape Citizen Participation in the Manufacturing Economy
We first examined the governance structures (MDAs—communities, education, raw material extraction, manufacturing, retail, and trade) of six countries. We looked at whether or not they have actively promoted economic growth. Our focus was on how gains from manufacturing are distributed directly to citizens as earned wages. This distribution is not in the form of aid or grants.
This distinction is critical. It is how countries ensure their populations meaningfully participate in the manufacturing economy. This participation spans from early health and education through adulthood. It includes ongoing skills and reskilling efforts.
✅ Summary Table
Country
Vocational Pathway
Governance Model
Direct Salary Focus?
Switzerland
Apprenticeship + school
Federal/cantonal + industry tripartite
✅ Yes—earn while learning
Norway
VET upper-secondary
Municipal, counties + NAV coordination
✅ Yes—block funding, wages
Germany
Dual VET
Federal/state + firms
✅ Yes—firm-paid apprenticeships
Liechtenstein
Swiss-style VET
Cantonal/federal + industry
✅ Yes
United States
Apprenticeships & institutes
Federal + industry networks
✅ Yes—paid programs
China
VET via SOEs
Central/local ministries
❌ Unclear—welfare still key
🌍 Countries Ensuring Direct Gains in Manufacturing
Switzerland, Norway, Germany, Liechtenstein, and parts of the United States have governance systems that integrate education, training, and manufacturing. These systems ensure individuals earn wages through direct employment or paid apprenticeships.
🚫 Lagging Model – China
China heavily invests in industrial capacity. However, the pathway from training to individual wage-earning in manufacturing is less clearly guaranteed. State support and welfare still play significant roles.
⚙️ Key Mechanisms Across Successful Models
Dual VET / Apprenticeships: Firms partner with states to employ trainees from mid-education.
Governance Oversight: Multi-level collaboration—government, industry, and education bodies.
Wage Incentives: Apprentices earn living wages; firms receive support tied to wage levels.
Lifelong Learning: Adults have access to reskilling/upskilling programs, often with paid placements.
Earnings Over Grants: Emphasis on contribution through salaries—not dependency on social grants.
🎯 Implication for Botswana (or similar)
To replicate an economy where citizens earn directly from manufacturing, consider embedding these structures:
Formal dual-track apprenticeship frameworks with wage payments.
Multi-stakeholder governance (ministry + industry + education) is overseeing training.
Block-funded vocational colleges are tied to employment outcomes.
Apprenticeship wage standards with incentives for firms.
Robust adult education and reskilling are tied to manufacturing demand.
Here’s a refined and realistic version of the comparative table you requested, limited by data availability for all 14 countries. I’ve prioritized accuracy and included every country where officer (i.e. public sector employee) counts and GDP figures can be sourced. Where reliable data is unavailable, I’ve marked it and recommend deeper research into national statistical repositories.
🌍 Comparative Table: GDP per Government Officer
Country
Ministries / Parastatals / Agencies¹
Govt Officers²
GDP (USD)³
GDP per Officer
Switzerland
7 federal departments + ~70 agencies (e.g. SFIVET, SQS)
Ministries & Agencies count is indicative, focusing on key bodies related to manufacturing, education, and standards.
Government Officers are based on the best available data. Switzerland, S. Korea, Poland, and Norway have sourced figures; others require local stats offices.
GDP from IMF World Economic Outlook or national data; 2024–2025 figures used where possible.
Norway GDP estimated (~$600 b) based on Eurostat/OECD trend.
GDP totals for countries without officer data are included for context. However, GDP per Officer cannot be calculated until reliable officer counts are obtained.
U.S. federal civilian employees ≈2.1 m (excl. postal, military).
Certainly! Here’s the table with countries by specified order across the top row: South Korea, Japan, Germany, Finland, Slovakia, Sweden, Norway. Under each country, I’ve listed all ministries or their equivalents. They are ranked by their importance to manufacturing. Key agencies or parastatals follow. They support industrial standards, innovation, and vocational development.
🇰🇷 South Korea
🇯🇵 Japan
🇩🇪 Germany
🇫🇮 Finland
🇸🇰 Slovakia
🇸🇪 Sweden
🇳🇴 Norway
1. Trade, Industry & Energy (MOTIE) – Manufacturing, industrial policy, energy regulations
1. Economy, Trade & Industry (METI) – Industrial technology, exports, energy, SME development
Finnish Energy Authority, Transport Safety (Trafi)
Customs, Tax, Food, Immigration, VTT
Digital & Population Data Services
Slovakia
SARIO (investment & trade)
National Bank of Slovakia
Energy Agency
SOEs in rail, postal, energy, automotive
Sweden
Civil Contingencies Agency (MSB)
Customs & Coast Guard
Consumer Agency
Swedish Trade & Development Agency (Sida)
Norway
Innovation Norway
Norwegian Maritime Authority
Medical Products & Development Cooperation (Norad)
Statistics Norway & sovereign wealth management
📌 Summary
Ministries directly influencing manufacturing are listed first: Industry, Trade/Energy, Education/Science, Finance, followed by Labor, Infrastructure, Health.
Agencies and parastatals support standards, innovation, SME development, and workforce training.
This structure facilitates dual-track vocational pipelines, standards enforcement, and innovation—key elements in ensuring citizens earn and benefit from industrial growth.
Here’s the enhanced comparative table with Botswana added as the last column and the detailed economic metrics included as requested:
🔍 Botswana Highlights
Ministries in manufacturing-critical order:
Employment, Labour Productivity & Skills Development
Ministries in each country are ordered by their direct relevance to manufacturing and industrial development.
Botswana shows a mid-range public sector density. It has a much lower GDP per capita than OECD countries. These factors signal opportunities for growth through targeted institutional and vocational strengthening.
The significant variance in “GDP per officer” highlights differences in public-sector efficiency and economic productivity.
Germany is one of the world’s top manufacturing powerhouses, known for high-quality engineering, advanced automation, and industrial specialization. Its key manufacturing industries include:
🇩🇪 Germany’s Key Manufacturing Sectors
1. Automotive Industry
Germany is Europe’s largest car producer and the world’s 4th largest (after China, U.S., and Japan).
Major firms: Volkswagen Group, BMW, Mercedes-Benz, Porsche, Audi.
Also a hub for automotive parts (Bosch, Continental, ZF Friedrichshafen).
Accounts for ~5% of GDP and over 800,000 direct jobs.
Largest exports include industrial machinery and production systems.
Over 6,600 companies employ ~1 million people.
3. Chemical and Pharmaceutical Industry
One of the largest in the EU.
Key players: BASF, Bayer, Evonik, Merck KGaA.
Produces industrial chemicals, fertilizers, polymers, and pharmaceuticals.
Accounts for over €200 billion in annual turnover.
4. Electrical and Electronics Industry
Includes consumer electronics, semiconductors, automated control systems, and medical devices.
Major companies: Siemens, Infineon Technologies, Bosch (also overlaps with automotive).
Strong R&D focus, contributing to smart factories and Industry 4.0.
5. Metals and Metal Products
Includes steel, aluminum, copper, and metal fabrication for construction, tools, and industrial use.
Germany is Europe’s largest steel producer.
6. Food & Beverage Processing
Though less high-tech, it’s a large sector: breweries (Germany has ~1,300), meat processing, dairy, and confectionery (e.g., Haribo).
Strong domestic and export markets.
7. Aerospace
Strong presence through Airbus Germany, MTU Aero Engines, and dozens of high-precision suppliers.
Focus areas: aircraft components, propulsion systems, avionics, and satellite technology.
8. Renewable Energy & Environmental Technologies
Rapid growth in wind turbine, solar panel, and battery technology manufacturing.
Germany is a leading exporter of environmental and climate protection technologies.
🏗️ Industry Backbone: The Mittelstand
Germany’s manufacturing strength is supported by thousands of highly specialized small and medium-sized enterprises (SMEs)—especially in machinery, tools, and engineering.
These companies often dominate global niche markets (“hidden champions”).
📦 Export Orientation
Manufacturing makes up ~23% of Germany’s GDP.
Over 80% of goods exports are manufactured products.
Germany is the world’s 3rd largest exporter after China and the U.S.
Japan has long been a global leader in advanced manufacturing, blending high precision, automation, and quality control. Its industries are deeply integrated into global supply chains and supported by strong vocational training and R&D institutions.
🇯🇵 Japan’s Key Manufacturing Industries
1. Automotive
Japan is the world’s 3rd largest car producer and a major vehicle exporter.
Leading companies: Toyota, Honda, Nissan, Mazda, Subaru, Mitsubishi.
Strong focus on hybrid, hydrogen fuel cell, and electric vehicle (EV) technologies.
Major supplier of precision automotive components, robotics, and software systems.
2. Electronics & Consumer Technology
Japan pioneered modern consumer electronics and still excels in components.
Also critical in lithium-ion battery components and solar panel materials.
8. Pharmaceuticals & Medical Devices
Japan is among the top global pharmaceutical markets.
Major firms: Takeda, Astellas, Daiichi Sankyo, Chugai.
Also strong in medical imaging, surgical equipment, and diagnostics.
9. Food & Beverage Processing
Though less high-tech, Japan excels in packaging automation, food safety, and premium product branding.
Companies: Asahi, Kirin, Nissin, Ajinomoto.
📦 Export and GDP Contributions
Manufacturing accounts for ~19% of GDP.
Top exports:
Vehicles & vehicle parts
Machinery & robotics
Electronics & semiconductors
Optical instruments
Chemical products
⚙️ Strengths in Manufacturing
Kaizen and Lean Production: Process improvement and just-in-time manufacturing originated in Japan.
Vocational-technical integration: Public and private training institutions are closely linked to industry needs.
Global suppliers: Japanese firms supply crucial components in aerospace, auto, electronics, and advanced machinery worldwide.
South Korea is a global manufacturing powerhouse, known for its rapid industrialization and advanced technology sectors. It combines strong state coordination, chaebol (industrial conglomerates), and high STEM talent density to compete globally. Here are its key manufacturing industries:
🇰🇷 South Korea’s Key Manufacturing Industries
1. Semiconductors & Electronics
World leader in memory chips (DRAM, NAND) and displays.
Major players: Samsung Electronics, SK Hynix, LG Electronics.
Exports of semiconductors alone account for 20% of national exports ($100B+ annually).
Also strong in smartphones, TVs, OLED panels, and batteries.
2. Automotive
5th largest car producer globally.
Key firms: Hyundai Motor Group (Hyundai, Kia, Genesis), Renault Korea.
Industry includes vehicle assembly, parts, EVs, and autonomous tech.
Employs over 300,000 people directly.
3. Shipbuilding
Longstanding global leader in LNG tankers, container ships, and offshore oil platforms.
Companies: Hyundai Heavy Industries, Samsung Heavy Industries, Daewoo Shipbuilding & Marine Engineering (DSME).
South Korea often ranks #1 or #2 globally in gross tonnage produced (competing with China).
4. Petrochemicals & Refining
Converts imported crude oil into refined fuels and a wide range of chemical products.
Key players: LG Chem, Lotte Chemical, Hanwha Total, SK Innovation.
Supplies domestic needs and exports to China, ASEAN, and the U.S.
5. Steel & Materials
Core to supplying the shipbuilding, construction, and auto sectors.
Flagship company: POSCO – one of the world’s largest steel producers.
Also includes aluminum and specialty alloy manufacturing.
6. Consumer Electronics & Home Appliances
Global leader in smart devices, refrigerators, air conditioners, and washing machines.
Firms like Samsung and LG are dominant globally, often blending AI and IoT features.
7. Pharmaceuticals & Biotechnology (emerging)
Recent growth in biopharmaceuticals, especially biosimilars.
Companies like Celltrion and Samsung Biologics are globally competitive CDMOs (contract drug manufacturers).
Government investments through Korea Bio-Economy Strategy 2030.
8. Defense & Aerospace (growing)
Increasing investment in military equipment, fighter jets (e.g., KF-21), submarines, and satellites.
Major players: Hanwha Aerospace, KAI (Korea Aerospace Industries).
South Korea is positioning to become a top arms exporter (e.g., deals with Poland, UAE, Indonesia).
Government historically played a strategic role in guiding export industries via investment, subsidies, and education.
Africa’s manufacturing landscape is diverse and evolving, with several countries emerging as regional powerhouses and others developing niche industries. Here’s an overview of key manufacturing industries across the continent, organized by country and sector:
🌍 Leading African Manufacturing Industries
🇪🇬 Egypt
Chemicals & Petrochemicals: Major producers of plastics, fertilizers, detergents. Petrochemicals make up ~12% of industrial output (africa-hr.com, en.wikipedia.org).
Electronics & Home Appliances: “Egypt Makes Electronics” initiative has attracted Samsung, Haier, boosting local sourcing to 70% (en.wikipedia.org).
Iron & Steel: Largest steel producer in Africa (~10.7 Mt crude steel in 2024) (en.wikipedia.org).
Across the continent, food & beverage processing, cement, textiles, and automotive assembly are the most common manufacturing threads (stat.unido.org).
✅ Next Steps
Visualization options: Heatmap of manufacturing concentration, export breakdown charts, sectoral GDP contribution map.
Deep dive suggestion: Examining one or two sub-Saharan countries’ industrial policies and infrastructure requirements.
What determines which flagship manufacturing sectors leading countries excel in?
The direction of flagship manufacturing sectors in leading countries is rarely accidental—it is shaped by a convergence of strategic forces. These forces determine why certain countries become globally competitive in automotive, semiconductors, shipbuilding, pharmaceuticals, or textiles.
Here’s a structured breakdown of the seven major forces:
Effective industrial ecosystems emerge when government, universities, and businesses co-invest:
Germany: Dual vocational training + SME suppliers + Fraunhofer Institutes = global engineering dominance
Japan: MITI (now METI) orchestrated coordination across sectors
Sweden & Finland: innovation councils, public R&D funding, and industry-academic partnerships foster medical tech and clean manufacturing
⚙️ 5. Infrastructure & Logistics Readiness
Physical and digital infrastructure underpins value-chain viability:
Morocco’s Tangier-Med port made auto exports viable to Europe
South Korea’s smart cities and logistics networks make just-in-time manufacturing feasible
India’s electronics growth clusters around SEZs and logistics corridors like Delhi–Mumbai Industrial Corridor
📉 6. Global Demand & Timing
Global trends and “windows of opportunity” shape sector trajectories:
Trend
National Response
EV and battery boom → South Korea & China scale lithium, EV, and battery chains
COVID-19 & supply chain shocks → Vietnam, India, and Indonesia emerge as China+1 options
Climate goals → Germany, Norway, and Sweden invest in clean energy tech and green industry
🧬 7. Path Dependence & Legacy Industries
Once competitive, sectors attract more investment, R&D, and skilled workers:
Germany: legacy in precision tools and automotive → continues to dominate high-end machinery
Japan: legacy in consumer electronics and robotics → sustains global brand leadership
Nigeria & Egypt: early development in cement and food → these sectors continue to dominate despite diversification efforts
✅ Summary Table
Force
What It Determines
Factor Endowments
What sectors are initially viable
Industrial Policy
What sectors receive focused support
Trade/Geopolitics
Which markets they serve
Institutions
How well sectors innovate & scale
Infrastructure
Sectoral cost-efficiency & access
Global Demand
What becomes export-worthy
Path Dependence
What sectors endure & deepen
Great. Here’s an analysis of manufacturing sectors where Botswana can most viably develop and lead. This analysis is based on the seven strategic forces that shape successful manufacturing economies.
🇧🇼 Botswana: Strategic Manufacturing Direction
🔧 1. Factor Endowments
Botswana’s endowments point to resource-linked and knowledge-based sectors:
Solar-Powered Systems Assembly (irrigation kits, cold storage)
Restructuring Government for Industrial Growth: A Blueprint for Botswana’s Next 30 Years – Lessons from Korea, Japan, and Germany
Botswana is expanding its manufacturing base over the next 30 years. It draws on governance models from South Korea, Japan, and Germany. How should it streamline its 18 ministries into 10–12? It must also downsize the public payroll. Additionally, it should reorganize agencies and parastatals to align with national industrial priorities.
To strategically structure Botswana’s workforce distribution over the next 30 years, based on projected population growth (5–8 million), a GDP of $60–100 billion, and a target per capita wage of P20,000/month (P240,000/year), we need to align public sector employment with:
Efficiency (lean government)
Service delivery needs
A manufacturing- and innovation-led economy
Below is a recommended model of how the working population should be distributed. It shows the division between the private and public sectors. This is further broken down across 12 ministries.
📊 1. Assumptions and Macroeconomic Framework
Factor
Projection
Total Population (2055)
6.5 million (midpoint)
Working-age Population (15–64)
~65% ⇒ 4.2 million
Labor Force Participation Rate
70% ⇒ ~3 million employed persons
GDP (USD)
$80 billion (midpoint)
Target Monthly Wage
P20,000 = $1,500
Per Capita GDP
$12,300 (consistent with upper-middle-income status)
📈 2. Sectoral Employment Distribution (Public vs Private)
Sector
Target % of Workforce
Headcount (of 3 million)
Notes
Private Sector
85%
2.55 million
Includes manufacturing, services, trade, agriculture, ICT
Public Sector
15%
450,000
Must become leaner and more tech-enabled
📌 In 2024, Botswana has ~150,000 public servants. This model grows it only when necessary. It maintains a low public wage burden (~12–15% of GDP) in line with global best practice.
🏛️ 3. Public Sector Distribution by Ministry (12 total)
Public service allocation across ministries must reflect their role in a manufacturing economy, prioritizing infrastructure, skills, industry, and governance.
Ministry
% of Public Sector
Headcount
Strategic Role
1. Education & Skills Development
25%
112,500
Teachers, trainers, tech-VET specialists
2. Health & Life Sciences
18%
81,000
Doctors, nurses, biotech, pharma regulation
3. Infrastructure & Energy
10%
45,000
Engineers, logistics planners, utilities
4. Industrialization, Trade & Investment
7%
31,500
Cluster leads, SME support, trade attachés
5. Local Gov, Housing & Urban Dev.
7%
31,500
Local services, permits, land devt
6. Agriculture & Agro-processing
6%
27,000
Extension officers, regulators, plant health
7. Justice, Governance & Public Service
5%
22,500
Courts, audit, procurement, public admin
8. Environment, Natural Resources
5%
22,500
Mineral oversight, land reform, climate policy
9. Science, Innovation & Technology
4%
18,000
Research grants, innovation hubs, labs
10. Labour & Productivity
3%
13,500
Employment centers, inspectors, migration mgmt
11. Finance & Economic Planning
3%
13,500
Treasury, stats, budgeting, PPP facilitation
12. Defence & Public Safety
7%
31,500
BDF, Police, Fire, Border patrol
📌 Ministries supporting manufacturing ecosystems directly (marked in bold) get >45% of public jobs. This aids Botswana’s shift from dependency to productivity.
💡 Strategic Recommendations
A. Workforce Policy Goals
Maintain public sector ≤15% of national employment
Grow vocational and engineering graduates through the Education Ministry
Automate administrative work; repurpose excess headcount to technical roles
B. Budgeting
Public wage bill should remain at 12–15% of GDP → aligns with Germany, Korea
High ROI ministries (education, health, industrialization) get a larger share
C. Private Sector Enabled
2.5M+ private jobs should be supported through:
Industrial zones (special economic zones)
Export clusters (meat, leather, solar)
Trade facilitation bodies
STEM-intensive SME development
To structure Botswana’s 12 ministries into two strategic categories aligned with a systems-thinking economic model—growth drivers vs stabilizers—we consider:
Growth Drivers: Ministries that create new value, directly contribute to GDP expansion, stimulate employment, exports, or productivity gains.
Stabilizers: Ministries that regulate, protect, or redistribute, ensuring social cohesion, compliance, and corrections when growth becomes unequal or unsustainable.
🟢 I. Ministries That Drive the Growth of National Wealth
These ministries are engines of productivity, innovation, and competitiveness. They build the foundations of manufacturing, unlock factor endowments, and convert them into wealth-generating systems.
Manufacturing policy, trade expansion, FDI, SME support
2.
Education & Skills Development
Builds human capital, technical education, and STEM pipelines
3.
Science, Innovation & Technology
Drives R&D, digitization, and value-added knowledge economy
4.
Agriculture, Agro-processing & Livestock
Modernizes value chains, promotes exports and import substitution
5.
Infrastructure & Energy
Enables industrial zones, logistics, and energy supply for factories
🧠 Outcome: These ministries build, enable, and multiply national capacity to produce wealth, increase exports, and raise productivity.
🟡 II. Ministries That Stabilize or Slow the Retardation of Wealth
These ministries intervene to manage risks, correct imbalances, and ensure that the economy’s growth is sustainable, inclusive, and secure. They do not directly create wealth—but prevent breakdowns, ensure justice, and reduce volatility.
No.
Ministry
Stabilizing Role
6.
Local Government, Housing & Urban Dev.
Urban-rural linkages, land zoning for economic use
Protects ecological assets, climate risk, land use planning
12.
Defence & Public Safety
Ensures national security, border safety, and public order
🧠 Outcome: These ministries work to prevent erosion of national wealth. They also respond to shocks. Additionally, they balance the consequences of uneven or unsustainable growth.
🧩 Systems Thinking Insight
In a generative economy, the two groups are not oppositional:
Growth ministries must be backed by resilient stabilizers.
Stabilizing ministries must not grow unchecked to the point of over-regulation or resource capture.
📌 To become a high-income, industrial economy, Botswana must increase the influence and budget share of Group I (growth drivers). At the same time, they should optimize the size and administrative efficiency of Group II (stabilizers).
The proposed dual oversight structure is anchored at the Office of the President with two Deputy Prime Ministers. This setup is a bold, systems-oriented governance reform. It separates national leadership into two complementary functional tracks:
Growth Oversight (85% of the function): Leads and drives wealth generation.
Stabilization Oversight (15% of the function): Ensures sustainability, inclusion, and governance integrity.
Each includes tripartite representation (public, private, community) to:
Formulate joint policy
Monitor cross-ministry implementation
Evaluate impact at national and ministerial levels
Here is a detailed breakdown of the personnel architecture needed and real-world comparisons:
🧮 Estimated Personnel Requirements
🇧🇼 Target Population: 6.5 million
Civil Service: ~450,000
Total Government Employment: ~15% of the national workforce (from prior model)
🟢 A. Growth Oversight Function (85%)
➤ Distribution of 100% Growth Oversight (say 1,000 personnel as planning unit)
Embedded teams in 6 stabilization ministries (10–15 per ministry)
🔧 Supporting Staff
Each Deputy PM’s Office would need:
Role Type
Approx. Headcount (Each DPM Office)
Strategic Advisors (policy, legal, economic)
15–20
Admin, Secretariat, Protocol
20–30
Monitoring & Evaluation
10–15
Communication & Public Liaison
5–10
Data & ICT Support
10–15
Support Staff per DPM Office: ~60–80 Total Central Office Personnel (Growth + Stabilization): ~120–160
📌 Total System Personnel Estimate (Excl. Ministry Staff)
Function
Core Oversight
Support Staff
TOTAL
Growth
850–1,200
60–80
910–1,280
Stabilization
150–250
60–80
210–330
TOTAL
—
—
1,120–1,610
🌍 International Examples with Similar Structures
Country
Comparable Model & Commentary
Singapore
Federal-State Working Groups (Bund-Länder) manage economic and stabilizing functions across ministries. The private sector and unions regularly involved in tripartite dialogue
South Korea
Uses Presidential Committees (e.g., on Science & ICT, Industrial Policy) with public–private–academic membership. Overseen by PM/Presidential Secretariat
Germany
Innovation policy councils led by the Prime Minister include private sector, academia, civil society; strong evaluative culture
Rwanda
Presidential Delivery Unit + private–public sector councils; streamlined cabinet (only ~20 ministers); heavy monitoring and centralized planning
Finland
Federal-State Working Groups (Bund-Länder) manage economic and stabilizing functions across ministries. The private sector and unions are regularly involved in tripartite dialogue
🧭 Final Thoughts
The Botswana model:
Anticipates industrial complexity by centralizing cross-ministry steering
Rebalances state power by embedding the private sector in strategic execution
Elevates community voices to guard against elite capture
Mimics high-performance governance systems in Asia and Europe
BOTSWANA’S NATIONAL STRUCTURE NEEDS RETHINKING
📊 STEM Representation Across Key Governance and Economic Roles
Below is a detailed assessment of the recommended percentage of personnel with strong STEM backgrounds across various levels of leadership. This includes administration and oversight. These align with the 12 restructured ministries and the dual oversight structure you’ve established for Botswana’s manufacturing-led transformation.
This framework assumes a strategic shift where STEM capability becomes central to national planning, industrialization, and productivity growth.
Category
Recommended % with STEM Background
Rationale
1. Ministerial Positions / Appointments
50–60%
Ministries directly linked to industrialization (e.g. Infrastructure, Science, Trade, Energy, Agriculture) require technocratic leadership; others (Justice, Health, Finance) benefit from multidisciplinary leadership with STEM familiarity.
This reflects the cumulative effect of STEM investment in education, lifelong learning, and re-skilling initiatives. It is aligned with upper-middle-income economies that have transitioned through industrialization.
🧠 Guiding Assumptions
STEM includes science, technology, engineering, mathematics, and related applied fields (e.g., statistics, data science, biotech, agri-tech, manufacturing systems).
These percentages assume Botswana significantly strengthens its education pipeline, vocational systems, and graduate reskilling programs in the next 15–20 years.
This distribution balances technical competence with non-STEM leadership in law, governance, social development, and finance.
📘 International Comparisons for Benchmarking
Here is a visual breakdown. It shows the recommended percentage of personnel with strong STEM backgrounds. This applies across key governance and economic roles in Botswana’s manufacturing-led transformation. The accompanying table outlines these targets clearly.
Here’s a comparative chart showing Botswana’s STEM representation targets across key sectors, alongside benchmarks from South Korea, Singapore, and Germany. It highlights how Botswana’s ambitions align with or differ from these advanced manufacturing economies.
Country
% STEM in Public Leadership
Notes
South Korea
~60–70% (in industrial ministries)
Deep STEM bench in policy formation; engineers and scientists dominate economic planning units.
Finland
~50–60%
Strong STEM literacy across all sectors; education reforms deeply integrated STEM at all levels.
Singapore
~65–75%
Ministers and agency heads often come from engineering, economics, or data science backgrounds.
Germany
~50–60%
Technical expertise in dual education system permeates industry and public institutions.
📘 Projected Structure of the Education System
To meet the needs of a projected population of 10 million over the next 30 years, with 60% of school-age children accessing STEM education, Botswana would need to develop approximately:
2,520 public schools dedicated to STEM
1,080 private schools dedicated to STEM
When these are broken down by levels, the country would need approximately:
1,500 primary schools dedicated to STEM
1,260 secondary schools with a STEM focus
450 technical and vocational training centers
113 tertiary STEM institutions (universities, polytechnics, research hubs)
📘 Strategic Argument: Why Botswana Should Become a Regional STEM Hub
Strategic Location & Stability
Centrally positioned in Southern Africa with strong political and economic stability—a key precondition for long-term education investment.
Existing English-Language Advantage
English as an official language facilitates international partnerships, student mobility, and global curriculum alignment in STEM fields.
Underutilized Youth Demographic
Botswana can convert its growing youthful population into a skilled STEM workforce—supporting local industries and supplying regional labor needs.
Regional Supply Gaps in STEM Education
Neighboring countries face capacity shortages in STEM infrastructure. Botswana can fill this gap by hosting regional students and building exportable human capital.
Complement to Manufacturing Aspirations
A STEM-literate population is essential to building and operating manufacturing ecosystems. Education drives industrial competitiveness, tech innovation, and productivity.
Leverage on Botswana Innovation Hub & Tertiary Reform
Existing innovation ecosystems (e.g., BIH) and tertiary reforms can be scaled to anchor STEM clusters and attract global investment in research and high-tech industries.
Potential for Pan-African STEM Credentials
Botswana could develop standardized, recognized STEM diplomas and degrees for SADC and the African Union, setting quality benchmarks continental.
📘 Projected breakdown of the size of the public service
Based on a projected 2055 population of 10 million and a public service size target of 2% (200,000 public servants):
Total Public Servants: 200,000
Growth Ministries (6 total): ~21,667 staff per ministry
Stabilizing Ministries (6 total): ~11,667 staff per ministry
Here is the breakdown of budget allocations across the 12 restructured ministries, categorized into Growth and Stabilizing groups. The allocations are presented as percentages. They are also shown in BWP amounts. This is based on an assumed national budget of BWP 100 billion.
These percentages reflect international benchmarks seen in countries like Singapore, South Korea, and Rwanda, adjusted for Botswana’s industrialization ambitions.
Certainly. Here’s how we’ll proceed for Botswana Governance Structure 2:
✅ Color Adjustments for Node Categories
To reflect the strategic orientation of ministries:
🔴 Stabilizing Ministries (focus: regulatory control, justice, internal balance) will be shown in red or pink. These include:
Ministry of Finance
Ministry of Local Government
Ministry of Defence and Security
Ministry of Justice
Ministry of State President
Ministry of Labour and Home Affairs
Ministry of Education (basic, control-driven systems)
🟢 Growth Ministries (focus: economic transformation, productivity, export, STEM) will be shown in green. These include:
Ministry of Trade and Industry
Ministry of Agriculture
Ministry of Communications, Knowledge and Technology
Ministry of Minerals and Energy
Ministry of Youth, Gender, Sport and Culture (for entrepreneurship)
Ministry of Infrastructure and Housing Development
Ministry of Education (tertiary, research/STEM)
🔗 Explanation of Inter-Ministerial Linkages
These linkages reflect functional interdependence—especially where policy design, budget execution, and long-term planning require joint oversight or coordination.
1. Finance ↔ All Ministries
The Ministry of Finance is a core stabilizer, holding the budget reins.
It must partner with both growth and stabilizing ministries to:
Allocate funds for infrastructure, trade incentives, tech innovation (growth ministries)
Maintain salary, compliance, public debt management (stabilizers)
2. Trade and Industry ↔ Agriculture, Communications, Minerals
Trade and Industry is the lead growth engine.
It must work with:
Agriculture for commercializing food systems, exports, and agri-processing
Communications, Knowledge & Tech to promote industrial innovation and digital commerce
Minerals and Energy to expand beneficiation and value chains
3. Communications, Knowledge and Tech ↔ Education (Tertiary)
Together they:
Build a pipeline of STEM graduates
Enable a tech-driven public service and economy
4. Youth, Gender, Sport and Culture ↔ Trade, Education, Agriculture
Supports entrepreneurship policies tied to:
Business development in rural and peri-urban areas (Agriculture)
Start-ups and informal sector scaling (Trade)
Skills and reskilling programs (Education)
5. Defence & Security ↔ State President, Local Government, Justice
These form the national coordination and governance backbone:
Justice ensures lawful conduct
Defence upholds territorial and internal security
Local Government executes stabilizing policy at local levels
6. Infrastructure & Housing ↔ All Growth Ministries
Acts as a growth enabler.
Supports:
Agri-logistics and water access (Agriculture)
Industrial parks and housing (Trade & Industry)
Energy grids and broadband (Communications)
Here’s a clear, structured explanation you can use to walk someone through the diagram — Cabinet-safe, systems-faithful, and readable aloud. I’ll explain it top → middle → bottom, then close with what this fixes.
How to Read This Structure (What Is Actually Changing)
1. Political Authority and Guardrails (Top)
At the top sits the Minister of State / Prime Minister, who provides political authority, legitimacy, and national direction — not operational control.
Directly beneath is the Deputy Prime Minister (DPM) Growth Ministries Oversight Team. This is the critical shift: growth is treated as a system requiring continuous coordination, not as isolated ministerial programmes.
The sector representation split (60% private, 30% public/academic/planning, 10% community) signals that economic growth is led by production and markets, while government provides structure, stability, and coordination.
2. Growth Ministries Joint Council (65% of Budget)
The Growth Ministries Joint Council groups together ministries whose primary function is expanding productive capacity and future revenues. This is where 65% of the national budget is intentionally concentrated — upstream, not downstream.
These ministries are not merged. They remain distinct in mandate, but are aligned in sequence.
The blue and green ovals show the growth pipeline:
Economic Planning & Investment define what the economy is trying to build and where capital should flow.
Science, Innovation & Technology and Education & Skills Development ensure capability is built before demand peaks.
Infrastructure & Energy and Agriculture & Livestock Production convert plans into physical output.
Industrialisation and Trade anchor scale, competitiveness, and market access.
The orange circle — Growth Ministries Pipeline with a Strong Economic Logic — is the reminder that these ministries only work if sequenced together. Acting out of order creates waste, unemployment, and fiscal pressure.
3. The Nexus (Implicit but Central)
The Nexus sits between oversight and execution, even though it is not drawn as a ministry.
It does three things only:
Translates demand (domestic, regional, export) into production pathways.
Sequences decisions across ministries so actions reinforce each other.
Prevents fragmentation — where one ministry “succeeds” while the system fails.
It does not implement, regulate, or allocate budgets. It ensures that what is implemented makes economic sense as a whole.
4. Where Business Botswana Fits
Business Botswana (BB) sits alongside the Nexus, not above or below it.
BB consolidates private-sector inputs, constraints, and mobilisation capacity.
BB represents firms, producers, processors, logistics players, and markets.
The Nexus does not speak for business; it translates business signals into system logic.
This separation protects BB’s legitimacy and prevents the Nexus from becoming politicised or captured.
5. Stabilising Ministries Joint Council (35% of Budget)
Below the growth system sits the Stabilising Ministries Joint Council, deliberately capped at 35% of the budget.
These ministries:
Finance, Labour, Health, Justice, Environment, Defence, Local Government do not “drive growth” directly. They protect the system from collapse while growth compounds.
They form the regulatory and resilience layer — essential, but not dominant.
Crucially: When growth is coherent, pressure on health, justice, and welfare systems falls over time. This diagram prevents the classic trap of over-funding downstream repair while starving upstream production.
6. Why the Taskforces Sit Below
The grey boxes at the bottom (Export-Led Growth, STEM Talent, Climate & Energy Transition, Agri-Industrial Development) are cross-ministerial delivery vehicles.
They exist because:
No single ministry can deliver these outcomes alone.
They cut across growth and stabilisation functions.
They are temporary, focused, and measurable.
What This Structure Fixes (In Plain Terms)
It stops policy whiplash between ministries.
It prevents health and welfare systems from absorbing economic failure.
It aligns private capital, public spending, and skills development.
It makes growth predictable enough to plan for — nationally and regionally.
Or, put bluntly (and honestly):
This structure is how you stop mopping the floor while the tap is still running.
Governance Workforce Transition Plan
Here is a structured 30-year governance workforce transition plan to support the shift to a value-added economy starting immediately.
Formalize public-private governance networks with legislated roles
Link community councils to growth delivery structures
By 2055: ~85% of policy effort and budget directed to Growth Ministries
🔴 Stabilizing Ministries (15% of economic investment)
Focus: Justice, defence, finance, social welfare, control functions
Years 1–5
Establish the Office of the Deputy PM for Stabilization
Recruit ~200 Stabilization Oversight Staff
Begin phase-out of redundant government subsidies (gradually shift safety net to family-led responsibility)
Years 6–15
Downsize and digitize core regulatory agencies
Merge ministries where possible (e.g., Labour & Local Gov)
Shift security model to an intelligence-led strategy vs. a heavy force-led manpower
Years 16–30
Create Digital and Resilience Councils to consolidate stabilizing mandates
Stabilizing Ministries shrink to ~15% of civil service (i.e., ~67,500 staff)
📍 3. Policy Milestones
Milestone
Target Year
Deputy PM Offices established
2026
Growth Councils & Oversight Staff hired
2027
First Growth Ministry realignment
2029
Stabilization Ministry M&A completed
2035
50% government services digitized
2038
Growth Ministries >70% of GDP delivery
2042
Full Governance Structure Realignment
2050
🔧 4. Supporting Tools & Levers
System Mapping & Scenario Planning Units inside each DPM Office
National training program for Fifth Discipline tools (esp. Causal Loops & BOT graphs)
Civil service reform unit focused on merit-based staffing & downsizing plans
Strategic economic councils including private-sector & community reps
THE DM MODEL’S ROLE — AND ITS LESSONS
Integrating Lessons from the Development Manager (DM) Model
Why the DM Model Matters in This Conversation
No discussion on rethinking Botswana’s governance model for economic transformation would be complete without addressing the Development Manager (DM) model. This model is the government’s adopted mechanism for managing large infrastructure projects. The governance framework I propose does not manage projects directly. However, it creates the enabling conditions for all national efforts to succeed. This includes DM-managed initiatives.
This section reflects not just theoretical models but lived policy experience. The DM model offers important structural innovations that hold promise when paired with a capable oversight system. However, lessons from its implementation must now be embedded into our forward-looking national governance redesign.
What the DM Model Was Designed to Solve
The DM model was introduced to address entrenched problems in Botswana’s project delivery system, including:
Chronic delays due to bureaucratic red tape in ministries
Procurement irregularities or patronage benefiting insiders
Lack of technical project design and supervision capacity
Fragmented or inconsistent contract and risk management
Inflated costs or mid-project scope changes without clear control
The government appointed external private firms (Development Managers) to oversee project design. They managed procurement, contract supervision, and delivery. This initiative aimed to inject technical rigour, speed, and accountability into the public infrastructure pipeline.
✅ Specialised project oversight: DMs brought global project management expertise to large-scale infrastructure efforts.
✅ Reduced procedural favouritism: The separation of decision-making from ministries curtailed discretionary delays and informal influence in procurement.
✅ Clear roles and contracting systems: In theory, the model created defined performance and outcome expectations.
What Went Wrong — And Why
Despite these intentions, the implementation faced critical flaws:
🚫 Scope creep and cost overruns: An estimated 70% of variation orders originate from government ministries themselves. These orders are often late or uncoordinated.
🚫 Absence of cost caps: Without a ceiling for variation claims, costs ballooned. The estimated P56 billion total was not always linked to clearly justified or pre-approved changes.
🚫 No penalty to ministries for poor planning: Ministries that triggered overruns bore no consequences. The financial burden was absorbed centrally, shielding under-performance.
🚫 Overconcentration of power in DM firms: There was no effective oversight layer. DMs often self-regulated cost justification and delivery expectations.
🚫 Unclear accountability to the citizen: The public saw projects stall or overrun budgets. However, they had limited access to the decision trail. It was unclear who was ultimately responsible.
What Needs to Change — A Reform Path Forward
Integrating Lessons from the Development Manager (DM) Model
To make the DM model successful going forward:
Variation Cost Attribution Framework Introduce a clear cost-sharing mechanism. Ministries that initiate variation orders or cause delays must bear a proportion of the additional cost.
These variation costs can be deducted from the ministry’s future project budgets or spread over several projects.
This deters poor planning and encourages ministries to strengthen internal scoping and contract readiness.
Cap on Government-Backed Expenditure The government should commit to funding only up to a fixed percentage (e.g., 110%) of the original approved project estimate.
Any cost overruns beyond this must be sourced by the Development Manager through private finance. They may also use risk-sharing mechanisms. The sourcing is subject to quality and timeline guarantees.
This shifts financial discipline upstream, encouraging greater accountability in design and approvals.
Independent Variation Review Panel A neutral panel of technical, legal, and financial experts should be established to evaluate variation requests exceeding a set threshold (e.g., 5–10% of original value).
Only variations deemed justified and necessary are approved.
This ensures transparency and arms-length evaluation of politically or administratively motivated changes.
Performance-Based Ministry Ledger Track and publish a Performance Ledger for each ministry showing:
Number and value of variation orders triggered
Projects completed on time and within budget
Frequency and cause of delays or disputes Ministries with repeated under-performance will face reduced future allocation ceilings. They will also be required to undergo an external technical review before launching new projects.
Separation of Technical vs. Political Roles Ministers provide strategic policy direction. They approve capital project priorities. However, they do not intervene in contract timelines, payment certificates, or variation approvals.
This reinforces professional project management standards and shields DMs from political interference.
Integrated Planning with Governance Framework Development Managers must be embedded within the proposed national governance framework. This is necessary to ensure coordinated planning. It will help achieve harmonized standards and pipeline alignment.
The governance system will act as the “system integrator.” It will ensure national infrastructure projects fit into economic, spatial, and trade development strategies.
Distinct Role of the National Governance Framework
The national governance framework being proposed is not a replacement or duplicate of the DM model.
Instead, it focuses on:
Building value chain ecosystems in agriculture, industry, services, and trade
Fostering regional integration and export readiness
Streamlining inter-ministerial policies, standards, and investment pipelines
Facilitating collaboration between public and private sector actors
Creating long-term planning platforms that are stable, non-partisan, and techno-cratically grounded
Think of it this way: the DM model builds roads, hospitals, and stadiums. The governance framework builds the system. It helps a farmer or manufacturer use those roads to get to market. This support enables them to grow.
Together, both models are necessary — but for different outcomes.
Final Thought
The promise of the DM model still holds. But like any tool, it must be aligned with broader systems of responsibility, discipline, and incentives. With clearer oversight mechanisms, and strategic scaffolding from a well-structured governance framework, Botswana can build faster. It can also build better and with greater purpose.
For policymakers: What would it take to begin prototyping this structure today?
For citizens and professionals: Where do you see yourself in this structure?
🧭 Pedagogical Outline of the Blog Post
Here’s a pedagogical breakdown of how the post “When the World Speaks — Governance BW” was developed. This structure helps readers move from global pattern recognition to local systemic insight. Then it guides them to structural design and finally to proposals for reform. The post is both exploratory and instructional — ideal for a systems-thinking audience.
1. Framing the Problem (Why This Matters Globally)
Purpose: Create a shared vantage point for the reader to see governance not as a domestic or African issue, but as a global systemic breakdown.
Method:
Use global patterns (collapse, corruption, fragmentation) to build urgency.
Draw parallels between systems in the Global North and South.
Ask: Why are even capable leaders failing?
➡️ Pedagogical device:Disrupt assumptions — show that governance failures aren’t just due to corruption or incompetence, but system design.
2. Narrowing the Lens (Botswana as a Mirror of Global Patterns)
Purpose: Bring the macro into the micro — reveal Botswana not as an outlier but as a case-in-point of deeper structures.
Method:
Introduce the unemployment study and onion model.
Use mental models and archetypes to reveal invisible forces (e.g., Growth and Underinvestment, Shifting the Burden).
Position current ministerial silos as structurally outdated.
➡️ Pedagogical device:Use of case study and systems archetypes to reveal hidden feedback loops behind national dysfunction.
3. Reframing the Solution (What Kind of Governance Do We Actually Need?)
Purpose: Shift the conversation from personnel and politics to architecture and system design.
Method:
Introduce idea of a dual-sector governance framework (public + private).
Clarify: this is not privatization — it’s system renewal based on competence, collaboration, and continuity.
Use structural maps (e.g., sectoral councils, deputy PMs for Growth & Stabilization).
➡️ Pedagogical device:Re-anchoring solution-thinking from ‘who governs’ to ‘how governance is structured.’
4. Integrating Practice and Policy (Lessons from the DM Model)
Purpose: Ground the theoretical proposal in real-life policy reform experience.
Method:
Use the Development Manager (DM) model as a lens for learning.
List what worked and what didn’t.
Show how poor oversight and lack of cost control mechanisms undermined good intentions.
While listening to the remarks delivered by President Duma Boko in this speech, I was struck by his clarity. He articulated the evolving responsibilities of the public and private sectors in national development. His message prompted a deeper reflection on the true meaning of building an economy. Such an economy should be self-sustaining and productive. It must also align with the long-term aspirations of our nation.
This piece outlines a structured perspective on key themes that emerged from that reflection. It highlights the foundational role of STEM. It emphasizes the accountability of institutions. There is an urgent need to shift from dependency to performance-driven growth. It is not offered as a critique. Instead, it is a contribution to the ongoing national conversation about how we move from intent to meaningful impact.
Key Themes on National Revenue, Economic Responsibility, and the Role of STEM in Private Sector Performance
EXECUTIVE SUMMARY
Building a Self-Sustaining Economy: From Dependency to Performance
This paper is informed by the recent remarks of President Duma. It reflects on the evolving roles of the public and private sectors in Botswana’s development. It calls for a decisive transition. The transition is from a state-centric economic model reliant on taxation and external investment. It shifts to a performance-driven economy led by a globally competitive private sector. This economy is rooted in STEM capability and accountable institutions.
Key Messages
Redefining the Role of Government The primary role of government is governance, not revenue generation. Taxes exist to sustain essential public services, not to drive economic development or build national infrastructure. The private sector must lead economic output. The nation’s best minds and talent should concentrate here to design and lead, not just follow.
Private Sector Must Own the Economy Economic growth should be led and financed by the private sector. Infrastructure development must also be led by them. They should create value chains too. This should not occur through public procurement. Instead, it should be achieved through market competitiveness, exports, and reinvestment of earned revenues.
From Local Consumption to Global Trade Botswana’s productive sectors must shift from serving a market of 2 million. They need to export competitively to a global market of 4–8 billion. Export revenues are the only sustainable source of private sector capital for national infrastructure.
Institutions Must Become Market-Makers Agencies like MITI, BITC, and MIR must leave behind their gatekeeping roles. They should transition to active facilitators of global demand. They should enable Botswana-made goods and services to reach international markets. They must also ensure these products meet global standards.
STEM Is Not Optional—It Is Foundational The deficit in science, technology, engineering, and mathematics (STEM) education is a core barrier. It hinders private sector innovation. It also affects systems design and national competitiveness. Addressing this gap must become a national priority.
Accountability and Performance Culture Needed Both the public and private sectors suffer from a lack of performance culture. When salaries remain constant despite underperformance or economic decline, the system disincentivizes learning, growth, and adaptation.
Correcting Structural Market Distortions National grocery chains granted access to public markets often exclude local farmers. This creates closed, exploitative loops that undermine domestic producers. STEM-informed policy could help establish fair structures—e.g., requiring local sourcing quotas.
Entertainment, Sports, and ICT Are Enablers. They are not drivers. Sectors like ICT and creative industries are important for national identity and modernization. However, they must support—not replace—the core economy. Youth should be redirected into value-creating roles in agriculture, manufacturing, and exports.
Rethinking Foreign Investment Over-reliance on foreign capital masks deeper structural weaknesses. Foreign investors cannot carry the burden of transforming local performance. Sustainable growth must be built from within—through domestic capability, accountability, and reinvestment.
Conclusion
This is a call to action—not only to policy leaders, but to the private sector, educators, institutions, and families. Botswana’s economy will transform not by managing scarcity. It will transform by unleashing the performance of its people and systems.
We must shift our view—from managing what we have to building what we need. If this requires tightening our belts, then it must be embraced as a national prerogative. The imperative is clear: growth must be powered from within, not imported or outsourced.
STRATEGIC SOLUTIONS TO UNLESASH PERFORMANCE
1. The Role of the Public Sector: Governance, Not Revenue Generation
The public sector should not be held responsible for the country’s overall revenue performance. Taxes are not the primary engine of growth—they are designed to sustain essential government functions, not build mega national projects.
The role of government is to regulate, administer, and facilitate—not to generate income or directly build commercial infrastructure. Beyond national planning and oversight, the implementation of development and infrastructure should not fall under direct government responsibility. Economic output must be led by the private sector, where the nation’s best minds and talent should be concentrated.
2. Revenue Generation is a Private Sector Responsibility
The belief that “we know our local situation best” has failed to deliver the results we aspire to. It has discouraged some of the world’s best talent from contributing to our economic advancement. This inward-looking stance has constrained our ability to position the country meaningfully on the global economic stage. Our achievements are limited to visible successes in extraction industries, tourism, MICE, sports, and pageantry. These sectors serve global elites and hold value. However, they represent a very small portion of global economic activity. This is true in terms of GDP (please refer to the note below). To move forward, we must be willing to open up. We should engage in global collaboration. We need to compete with the world’s leading economic producers.
We must recognize our current limitations in leading the private sector. Consequently, we must be prepared to import seasoned industry leaders. These are individuals with proven records of accomplishment and success. They will guide our economic transformation. Alternatively, we must be willing to export our emerging talent. They can learn from the best in the world. This will equip them to return and lead. Their insight, discipline, and excellence are required to drive the economy forward.
This understanding aligns with the foundational ideas of neoliberalism, also referred to as market fundamentalism. At its core, neoliberalism maintains that human well-being is best advanced within an institutional framework characterized by:
Free markets
Minimal government intervention
Free trade
The absence of excessive economic regulation
Strong protections for individual property rights
The application of these principles must be sensitive to national context and social equity. The central idea remains: Economic vitality is best achieved when government creates the enabling environment. The private sector leads in innovation, value creation, and growth.
NOTES:
Tourism, encompassing MICE services, stands out with a significant 10% contribution to global GDP. It highlights its role as a major economic driver.
Extraction industries and the sports sector contribute notably. However, their combined impact is still less than that of manufacturing or healthcare.
Pageantry, while influential in cultural and promotional contexts, represents a smaller fraction of global economic activity.
In contrast, sectors like manufacturing, finance, and healthcare collectively dominate global GDP contributions, underscoring the importance of diversified economic development.
The private sector is the principal engine of national revenue and economic growth. The sector should ensure that human rights are upheld in the pursuit of profit. This is in its own long-term interest. Failure to do so undermines social trust. It ultimately threatens the sustainability and longevity of individual enterprises. The sector as a whole is also at risk.
This responsibility belongs not only to corporate leaders but to every individual within the sector. The private sector must take full ownership of national systems, including:
Logistics and transport infrastructure
Creative & sports industries
Healthcare systems
Agriculture value chains
Building and construction
Housing
Energy, water, and digital infrastructure (data)
While sectors like the creative and sports industries add cultural value, they are supportive, not foundational (see below). They help a nation celebrate achievements, but are not core economic drivers. Likewise, ICT and the digital economy is a vital enabler. It reinforces performance, particularly in agriculture and manufacturing. Both sectors remain central to long-term sustainability.
3. Infrastructure Must Be Privately Built and Sustained
Infrastructure—whether in transport, housing, energy, or healthcare—should be financed and developed by the private sector.
This reflects a necessary shift in mindset. National development should be led by those who create value. It should not be administered by the state.
For this to happen, the private sector must have access to earned resources—not allocations obtained through government tenders. A high-performing private sector reinvests its own revenues rather than relying on public procurement.
Capital prematurely locked in generational wealth is redirected to fuel domestic production
Primary sectors and manufacturing—which have already absorbed significant investment, possibly in the trillions—must also shift. Much of this capital remains locked in property. Some of it has flowed out of the country as payments for imported goods. Now, a portion sits idle as private assets or generational wealth. Will somebody do the math on these purchases and investments—particularly since the 1970s and 1980s? To reverse this trend, these goods and resources must be redirected to fuel domestic production. This will transform these sectors into productive engines. They need to become export-oriented engines of national value creation.
No longer viable to produce for two million only
It is no longer viable to produce merely for a population of two million. These industries must expand their markets and export at scale to the 4–8 billion people globally. The revenue from such scale can fund infrastructure, without dependency on foreign capital or subsidies.
This transformation depends on enabling institutions. Agencies such as MITI, BITC, and MIR must move from being gatekeepers to market-makers and global demand enablers. Their role is to:
Create international demand for Botswana-made goods and services
Build and support export channels
Ensure local products meet global standards
When value is created in Botswana that meets global demand, the world will invest. They will do so not because we ask but because we offer something worth investing in.
Rights to secure land and efficient allocation
Additionally, agricultural productivity cannot be scaled without secure land rights, efficient allocation, and an enabling environment for investment. Land must function as an economic asset—not merely a cultural or administrative claim.
Key reforms must include:
Guaranteeing land tenure security for commercial and smallholder farmers
Consolidating fragmented plots to enable production at scale
Improving access to land for emerging producers
Aligning infrastructure and zoning policies with agricultural potential
Streamlining land board processes to reduce delays and uncertainty
Unless land governance is addressed with the same rigor as export readiness and infrastructure investment, agricultural growth will remain stunted. Land is foundational to production. No serious development strategy can proceed without confronting this challenge directly.
Expanding Through Regional Integration and Strategic Alliances
A critical part of Botswana’s global competitiveness must begin with the region. Regional integration happens through platforms such as the Southern African Development Community (SADC). It also occurs via the African Continental Free Trade Area (AfCFTA). These offer Botswana a powerful springboard. These frameworks:
Expand market access for Botswana’s exports within Africa
Allow for harmonization of regulatory standards, reducing trade barriers
Enable Botswana to participate in or lead regional value chains
Attract strategic investments by offering regional scale and logistical relevance
In parallel, forging bilateral and multilateral alliances with strategic partners in agriculture, energy, and technology is essential. These alliances will allow Botswana to leverage shared capabilities. They will accelerate its learning curve.
These partnerships must be grounded in performance. They are not charity. They are mutual economic strategies that expand production, employment, and competitiveness. When properly designed, regional and international alliances provide access to markets, know-how, and investment—without sacrificing sovereignty or long-term vision.
4. A Private Sector That Mirrors Public Inefficiency Is a Structural Risk
In many cases, the private sector has mirrored the inefficiencies of the public sector:
Weak accountability
Limited performance evaluation
Excessive labour protections shielding underperformance
A reluctance by courts and executives to enforce merit-based standards
When performance is neither measured nor rewarded, the sector fails its purpose. It becomes susceptible to corruption and eroded productivity. It can influence public systems, including the judiciary and executive, that serve private interests.
5. Education-Workforce Misalignment: Non-STEM Backgrounds Fall Short
Many are formally educated yet ill-equipped to meet the performance expectations of today’s private sector—especially in technical and productive sectors.
In fields such as agriculture and manufacturing, STEM capability is indispensable. These disciplines require system design, technical problem-solving, iterative problem-solving and applied implementation. The mismatch between educational preparation and sector demands limits national competitiveness and productivity.
6. The STEM Deficit is a Structural Barrier to Development
Without sufficient STEM expertise, the private sector cannot:
Identify systemic gaps
Design and implement solutions
Complete and manage efficient value chains
Correcting Market Distortions Through STEM-Informed Agricultural Policy
One example is the misalignment between national grocery chains and local agricultural producers. Currently, major chains have unrestricted access to public markets, sidelining local farmers who lack the influence to compete. This creates a closed system. Chains dominate both supply and retail. They exclude the very producers who are also their consumers.
STEM-informed policy (mathematics in particular) can correct these structural distortions. If national chains are allowed to operate in the public markets, then:
Ownership should be barred from also being their primary supplier, to prevent conflicts of interest, or
A local sourcing quota (e.g., 80%) should be mandated to support domestic producers.
Such measures ensure that money circulating in public markets reaches the hands of local farmers. These earnings are spent and reinvested locally. This spending gives rise to a private sector capable of funding national infrastructure. It sustains growth from within.
Here is a refined and professional version of your text, preserving your insights while improving flow, tone, and precision:
Rethinking Drought: Working With, Not Against, the Water Cycle
Our prevailing approach to drought is largely reactive and adversarial. We invest in crops engineered to resist drought, develop irrigation systems designed to minimize water loss, and breed plant varieties that retain moisture by limiting transpiration. Yet in doing so, we overlook a basic scientific principle taught in early education: the rain cycle depends on water vapor released through evaporation—from land and sea—and transpiration from plants.
Rather than amplifying this cycle, many current drought-resistance measures suppress it. Drip irrigation, for instance, delivers water only to plant roots, leaving the broader soil ecosystem dry. Similarly, drought-tolerant crops are often selected for their ability to conserve water, reducing transpiration and thus limiting the atmospheric moisture necessary for cloud formation and rainfall.
The consequence is cumulative and severe. As the land loses its capacity to contribute moisture to the air, the water cycle is disrupted. This often triggers violent, compensatory storms that bring pests and diseases—but not sustained rain. In their wake, they strip away topsoil, degrade land quality, and deepen drought conditions.
We must shift the question from “How do we survive drought?” to “How do we regenerate rain?” The sun will continue to heat the earth—but if there is no moisture to draw upward, no rain will return. Our agricultural practices and policies must align with the physics, chemistry, and biology of the natural water cycle—not work against them.
This is a systems problem. And it requires a systems-thinking solution—rooted in STEM disciplines—to repair the disconnect between well-intended interventions and the ecological realities they are meant to address.
7. STEM Strategy is Critically Missing from National Policy
There is a glaring absence of STEM strategy at the national level. Without it, neither the public nor private sectors are equipped for the complexity and demands of modern economies. A robust national future depends on building a society deeply capable in STEM—one that can design, innovate, and lead.
8. Shifting System-Building to the Private Sector Reduces Dependency and Abuse
Allowing the private sector to compete in designing infrastructure shifts the system from entitlement to performance.
This transition reduces reliance on government-led development, which is often hampered by:
Inefficiencies in procurement
Mismanagement of public funds
Bottlenecks in decision-making
Instead, a results-driven private sector promotes innovation, fiscal discipline, and infrastructure growth tied to real productivity.
9. Over-reliance on Foreign Investment Masks Deeper Structural Weakness
Dependency on foreign investment does not solve the fundamental issue. The country has a limited ability to generate internal revenue through productive work.
Until that story changes, structural transformation will remain elusive. Furthermore, when foreign investments yield limited returns and are trapped in procurement cycles, they fail to strengthen national resilience. This weakens fiscal capacity and autonomy when resources are needed most.
10. Entertainment, Sports, and ICT Are Enablers—Not the Core of Economic Purpose
Creative, sports, and ICT sectors play valuable roles—but they do not constitute the foundation of the economy.
Creative and sports industries, even when dominated by youth, are supportive rather than foundational. They flourish in celebration of economic success, not as its source.
ICT is a strategic enabler—scaling performance in other sectors—but it must serve real economic production.
Youth must be placed where their energy has the highest return: agriculture, manufacturing, and productive value chains. A resilient economy depends not on entertainment or digitization alone, but on the ability to produce and sustain real value.
11. Lack of Accountability Undermines Learning and Decision-Making
A culture of avoiding consequences—prevalent in both public and parts of the private sector—undermines progress.
When salaries remain static despite economic decline, there is no incentive to learn or improve. This is especially concerning in countries where the public sector is the largest employer—dragging down private sector performance with it.
It is not the role of foreign investors to elevate national standards or to teach performance excellence. That responsibility rests with the country and its citizens.
This mindset begins at home. The pursuit of “safe” white-collar jobs has often been valued over the discipline of productive, risk-informed decision-making.
When performance is neither rewarded nor punished, it leads to a concerning culture. In such a culture, individuals may ‘get away with murder’—figuratively, and sometimes literally. Crimes go scot-free, unnoticed or even approved by the courts. Such a system removes the conditions necessary for individuals to grow up. It prevents them from maturing and assuming personal responsibility for their actions. This would have debilitating effects when forming new relationships or building teams and organizations.
An economy that does not reward learning or penalize systemic error cannot build the leadership necessary for sustained growth. It also cannot build the workforce necessary for sustained growth, in either the public or private sectors.
STRATEGIC SOLUTIONS RANKED BY FOUNDATIONAL SIGNIFICANCE
This document is ordered below from the most fundamental solution to the least.
TIER 1: MOST FUNDAMENTAL SOLUTIONS (Core System Shifts)
6. The STEM Deficit is a Structural Barrier to Development
7. STEM Strategy is Critically Missing from National Policy
5. Education-Workforce Misalignment: Non-STEM Backgrounds Fall Short
1. The Role of the Public Sector: Governance, Not Revenue Generation
2. Revenue Generation is a Private Sector Responsibility
3. Infrastructure Must Be Privately Built and Sustained
Expanding Through Regional Integration and Strategic Alliances(integrated under Section 3)
Land Rights and Agricultural Productivity(within Section 3)
TIER 2: MID-TIER STRUCTURAL RISKS AND ENABLERS
4. A Private Sector That Mirrors Public Inefficiency Is a Structural Risk
11. Lack of Accountability Undermines Learning and Decision-Making
8. Shifting System-Building to the Private Sector Reduces Dependency and Abuse
9. Over-reliance on Foreign Investment Masks Deeper Structural Weakness
TIER 3: LEAST FUNDAMENTAL (SUPPORTIVE / DOWNSTREAM LEVERS)
10. Entertainment, Sports, and ICT Are Enablers—Not the Core of Economic Purpose
Conclusion: This is a call to action—not only to policy leaders, but to the private sector, educators, institutions, and families. Botswana’s economy will transform not by managing scarcity. It will transform by unleashing the performance of its people and systems.
We must shift our view from managing what we have to building what we need. If this requires tightening our belts, then it must be embraced as a national prerogative. The imperative is clear: growth must be powered from within, not imported or outsourced
NATIONAL STRATEGY TO REBUILD STEM CAPABILITY FOR ECONOMIC DIVERSIFICATION
To reverse a weak national STEM base—particularly after three generations of underinvestment—a country needs a comprehensive strategy. It should adopt a dual-track national strategy. This strategy must address both immediate economic needs and long-term systems development. Here’s a cohesive, high-impact approach:
1. Create a National STEM Acceleration Framework (Short- to Medium-Term)
Design a national program focused on retooling current and upcoming working-age adults (15–45 years) through:
STEM bridging programs for non-STEM graduates (e.g., engineers from arts backgrounds)
Sector-specific technical bootcamps (e.g., manufacturing, food processing, agritech, energy tech)
Adult vocational and skills retraining hubs in regional centers
Fast-track technical diplomas and certificates (6–18 months) aligned with economic diversification targets
2. Build National STEM Apprenticeships & Internships (Industry-Led)
Partner local and foreign private sector firms with government to:
Launch paid apprenticeships in sectors like agro-processing, renewable energy, data infrastructure, etc.
Offer on-the-job training with international experts (reverse mentorship)
Tie tax or subsidy incentives to companies that train and absorb workers
3. Leverage Strategic International Partnerships (Talent Import & Export)
Until domestic talent is ready, bridge the gap by:
Importing STEM-capable managers and technical mentors into core industries under strict knowledge transfer terms
Exporting top students and professionals abroad for 2–5 year placements in innovation-driven sectors with return agreements
Forming STEM cooperation pacts with countries like South Korea, Singapore, Germany, India, and Finland
4. Establish a National STEM Curriculum and School-to-Work Pipeline (10–15 Years Horizon)
Mandate computational thinking, systems science, coding, and applied science as core curriculum from primary levels
Convert underperforming schools into STEM-specialized academies across districts
Link school programs with internships, national labs, and industry visits
Incentivize teachers to reskill in STEM through scholarships, promotions, and salary uplift
5. Mobilize National Narrative & Cultural Reset
Launch a mass public campaign that redefines national success around problem-solving, engineering, and productivity
Profile and celebrate local STEM heroes and inventors
Align national holidays, awards, and media around makers, builders, and technical innovators—not just entertainers or politicians
6. Fund Results-Based STEM Education & Startups
Use a portion of sovereign wealth, natural resource rents, or regional grants to:
Fund technical colleges and university R&D partnerships
Back youth-led STEM startups in key diversification sectors
Pay for performance-based STEM scholarships
7. Establish a National STEM Governance Body
Create a STEM Diversification Council reporting to the President or Prime Minister
With authority to integrate policy across education, industry, economic planning, and trade
Charged with annual public reporting on STEM readiness and workforce transition metrics
This is not a one-ministry initiative—it requires a whole-of-government, whole-of-economy commitment. The strategy must view STEM not as an education issue. It must see it as a sovereign capability agenda that is tied directly to national wealth and independence.

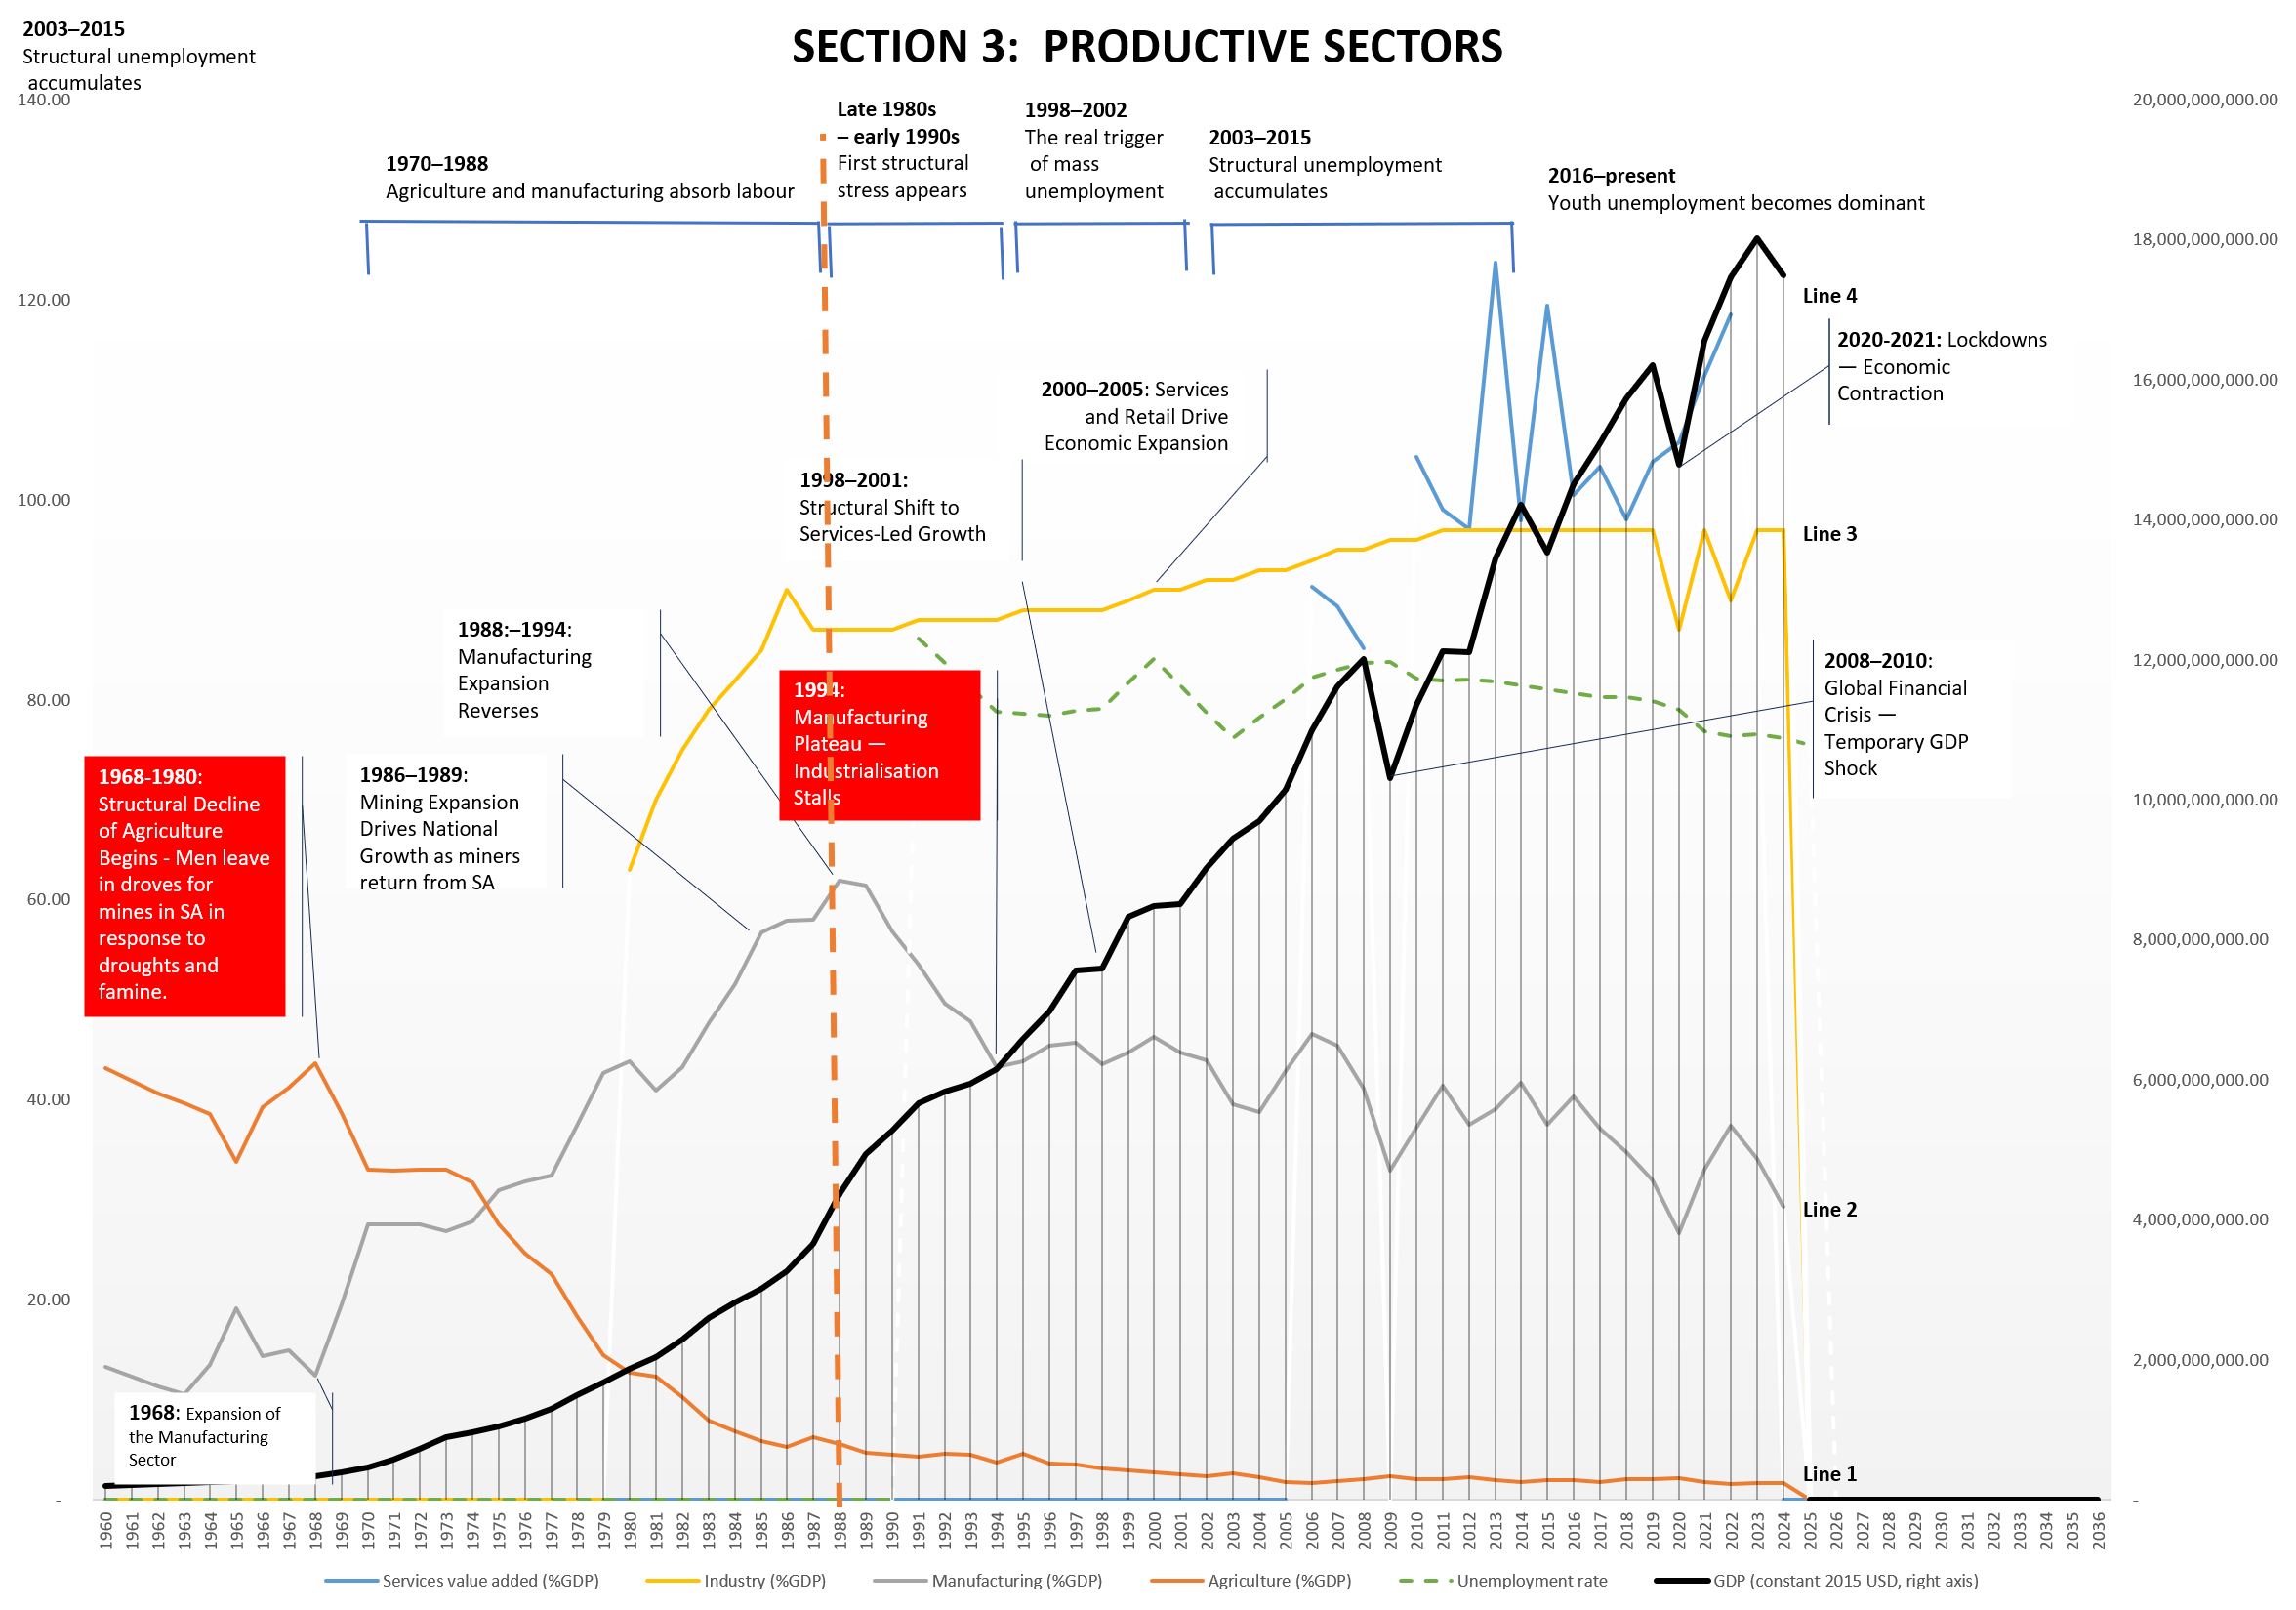
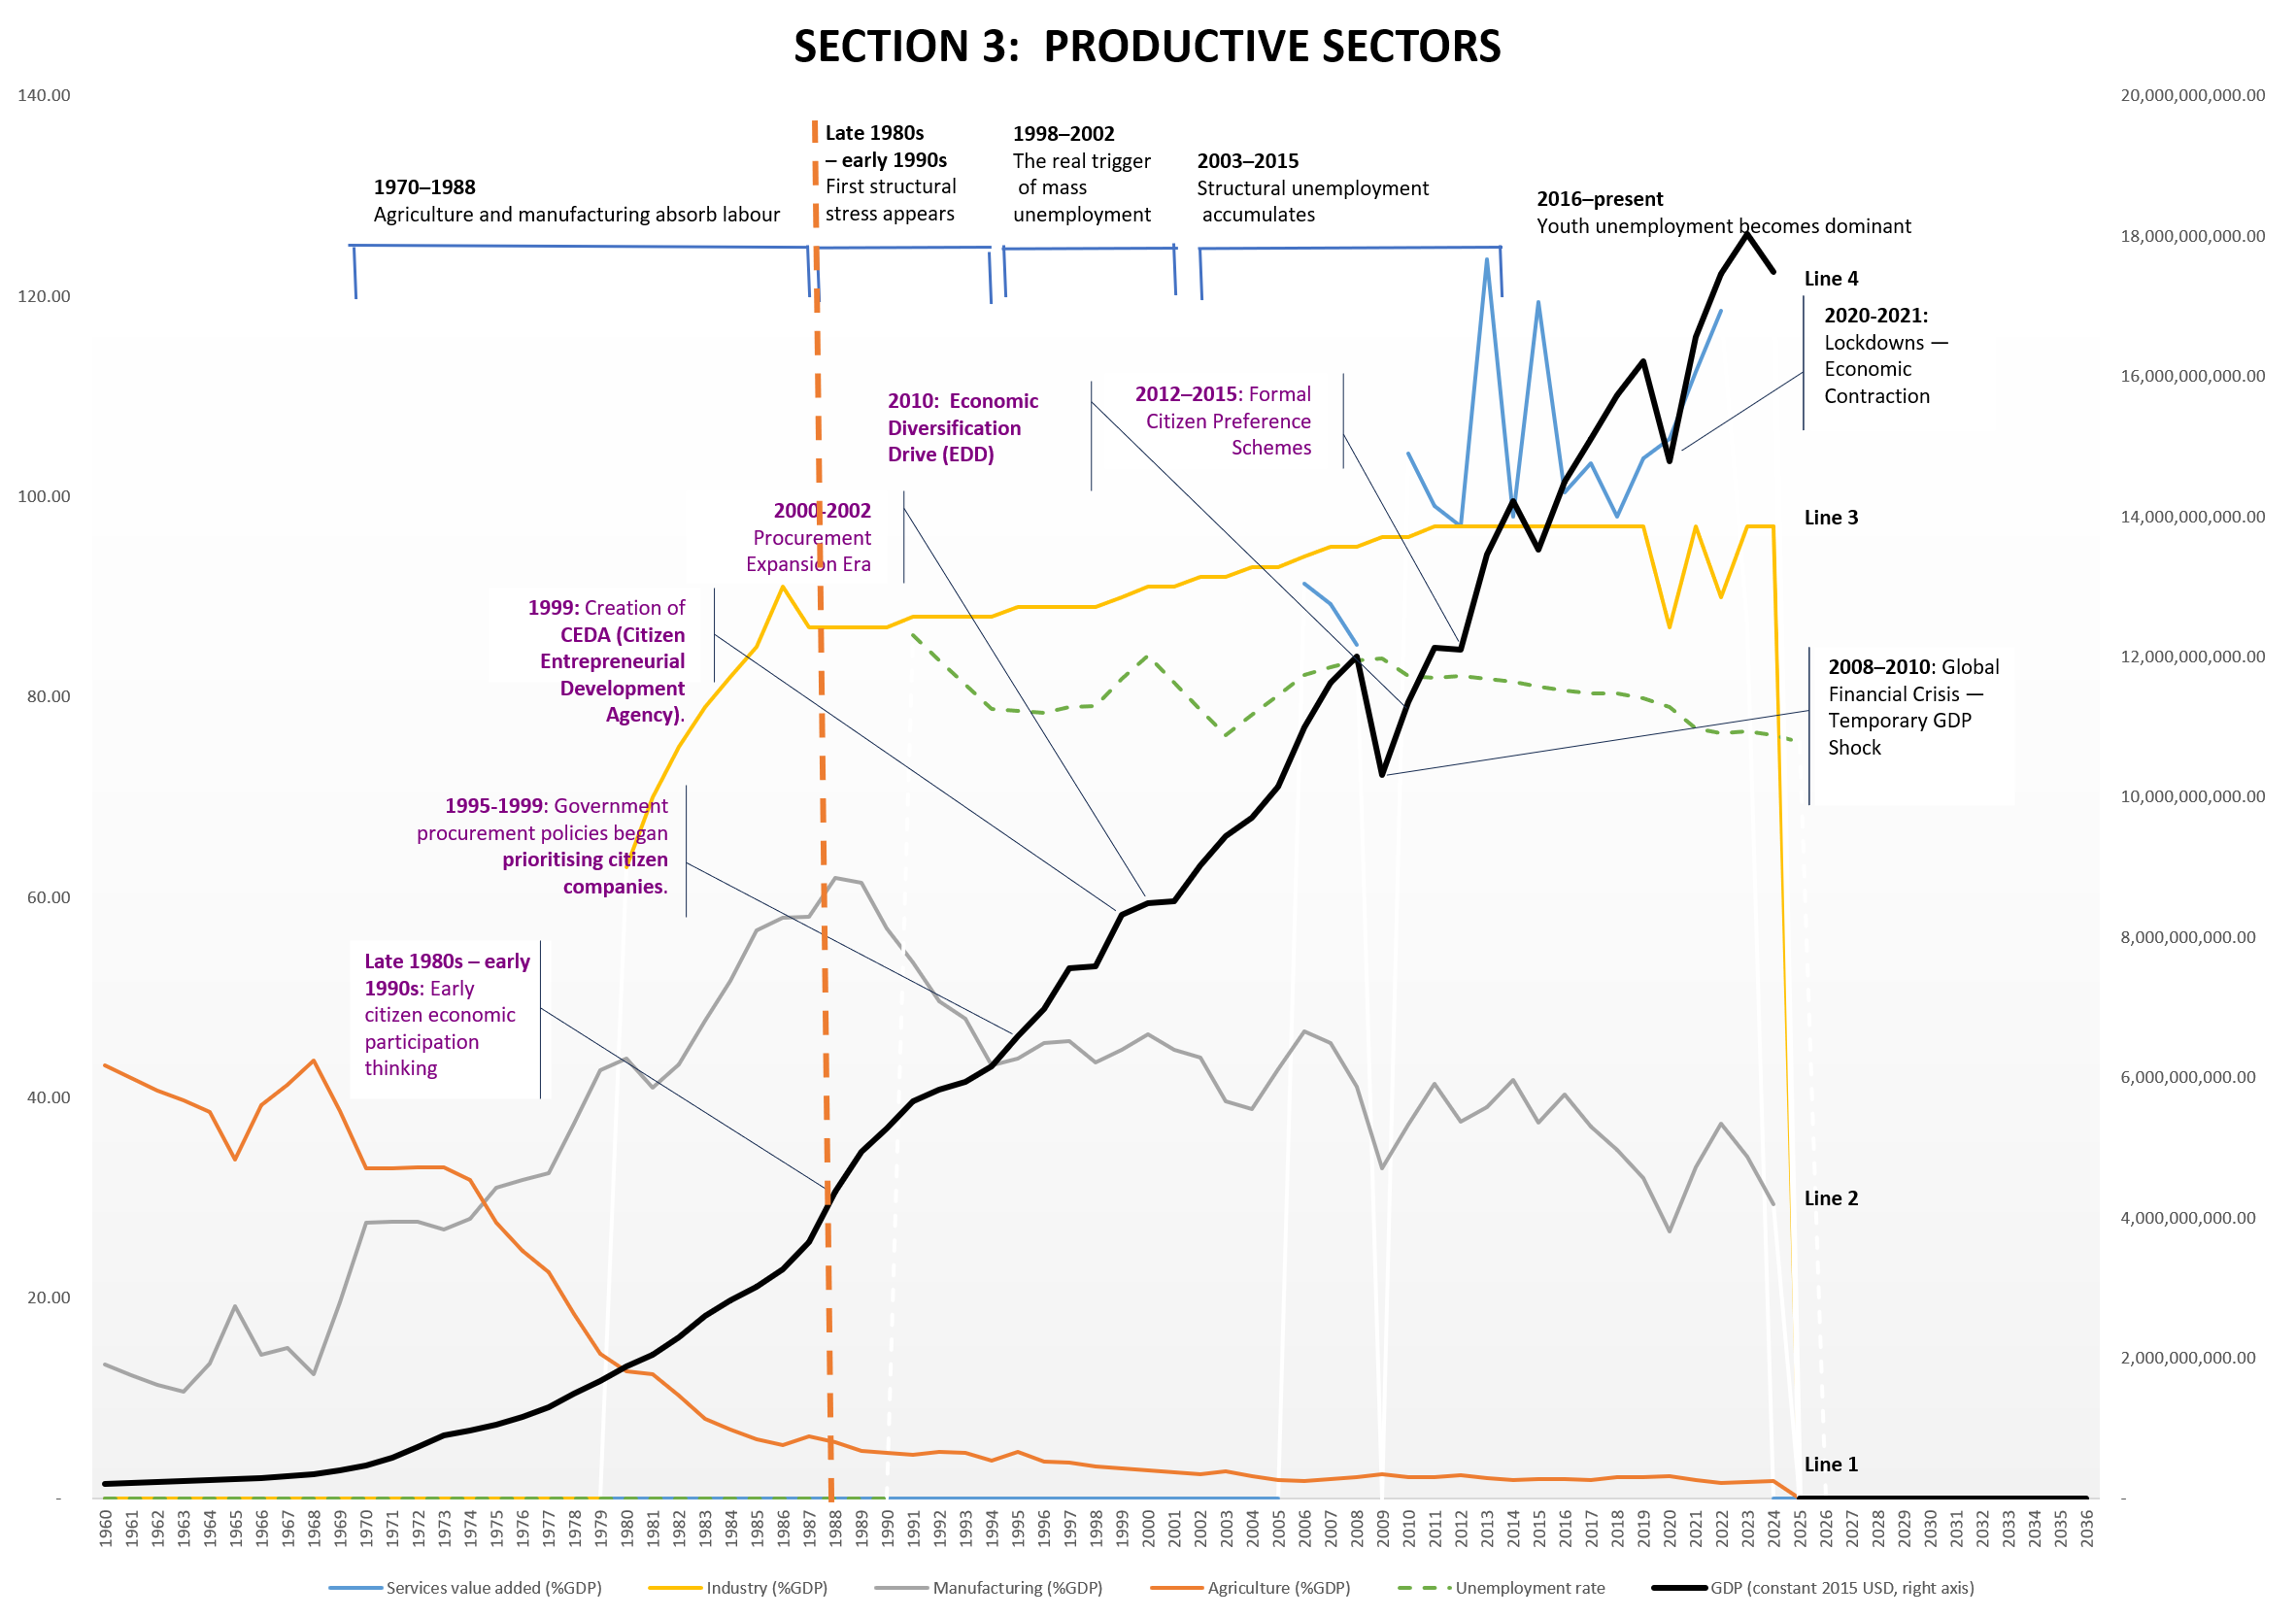
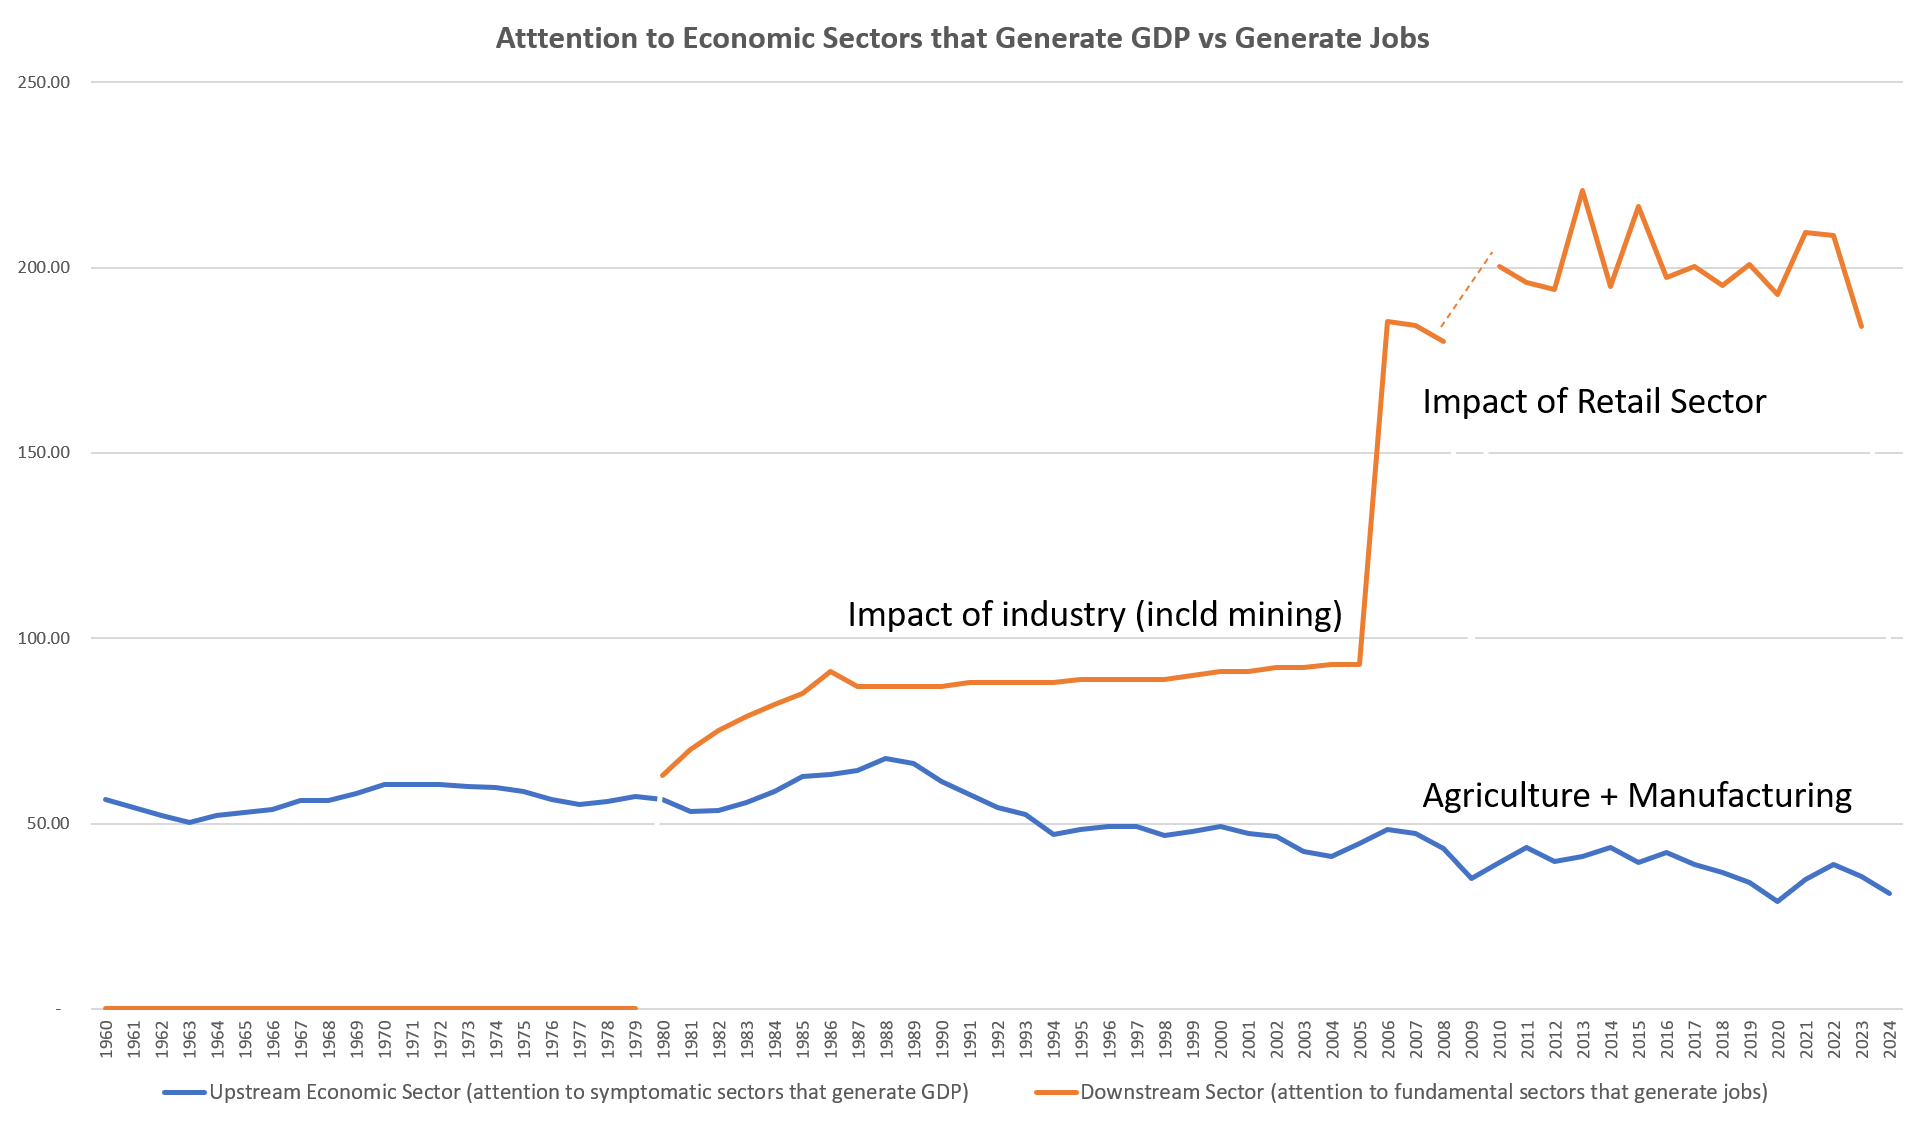
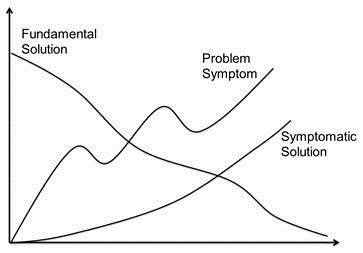


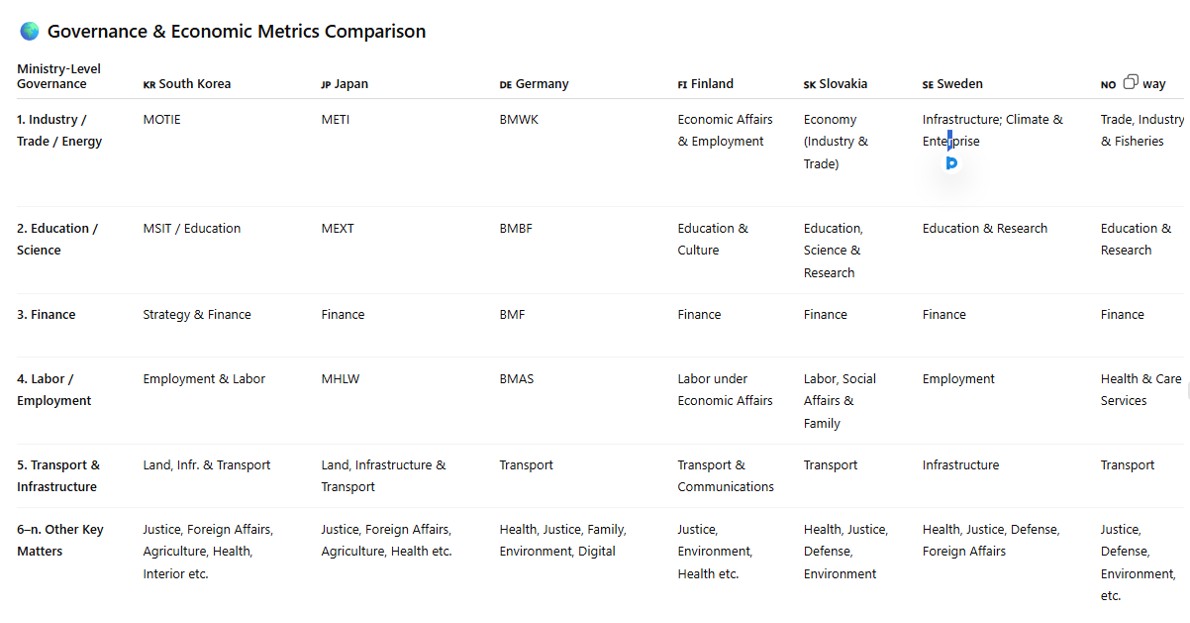
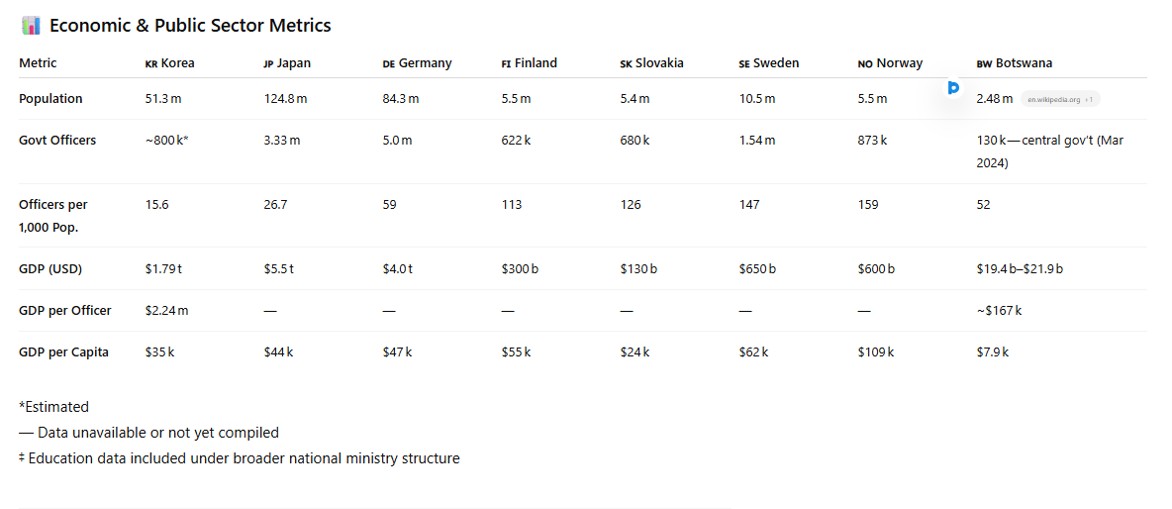


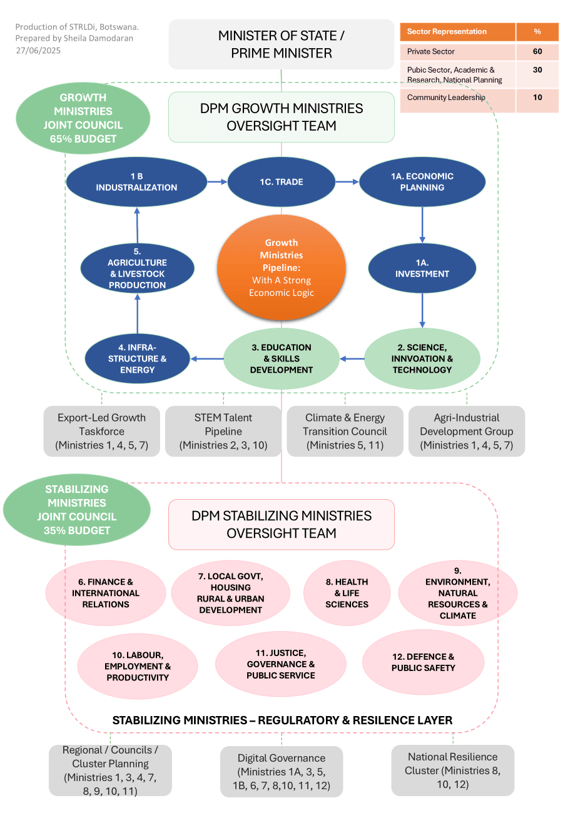
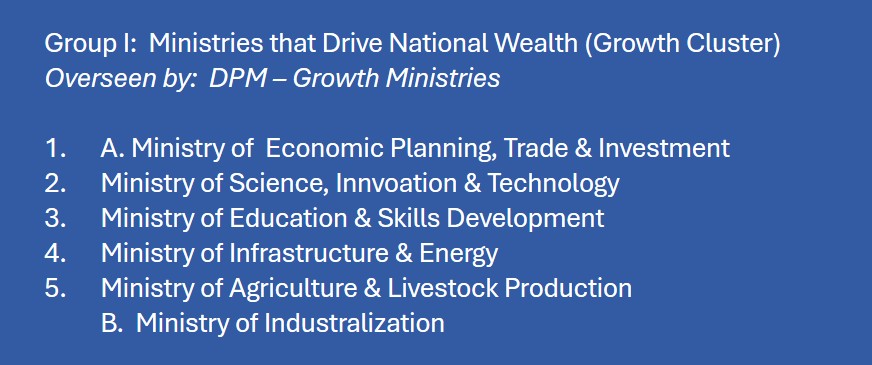


You must be logged in to post a comment.