Based on the provided sources, the table for the geography of Southern Africa is detailed below, followed by an analysis of the region’s production relative to its land share.
Indicator
Southern Africa (SADC)
Africa
World
Share of Africa
Share of World
Countries
16
54
195
29.6%
8.2%
Land Area (km²)
9.87 million
30.37 million
148.94 million
32.5%
6.6%
Coastline (km)
Stretches thousands of km
—
—
—
—
Arable Land
~76.9 million ha (Potential)*
—
—
—
—
Irrigated Land
3.4 million hectares
—
—
—
—
*Calculated based on projections that increasing irrigation to 10 million hectares would reach 13% of the region’s potential. Currently, less than 5% of cultivated land in the SADC region is equipped for irrigation.
Immediately this raises a structural question:
One-third of Africa’s land sits in Southern Africa. Is one-third of Africa’s production located here?
The sources indicate a complex and paradoxical economic landscape that suggests the region’s share of production does not currently match its massive land share:
Under-indexing in Growth: Southern Africa is currently recorded as the slowest-growing region on the continent. While the continent’s average real GDP growth was estimated at 4.2% in 2025, Southern Africa’s growth was estimated at only 2.0%.
Concentration of GDP: Africa’s GDP is heavily concentrated in four major economies—Egypt, Kenya, Nigeria, and South Africa—which together account for 52% of the continent’s total production. Because three of these four “giants” (Nigeria, Egypt, and Kenya) are located outside of Southern Africa, the SADC region likely contributes less than one-third of the total continental production despite its land area.
Poverty and Imbalance: The region is characterized by significant economic imbalances and high poverty levels, with nearly 45% of the total population living on less than one US dollar per day. Many economies in the region remain small, little-diversified, and hindered by structural constraints like electricity shortages and logistics bottlenecks.
Resource Wealth vs. Realized Output: Despite the slow growth, the region holds immense unrealized potential. It is described as one of the wealthiest regions of Africa in terms of minerals, holding significant portions of the world’s platinum, cobalt, and chromium. Furthermore, South Africa alone produces 17% of all maize in Africa and the region contains four of the five most-forested countries on the continent (DRC, Angola, Zambia, and Mozambique).
Summary: While Southern Africa possesses a vast portion of the continent’s natural capital and more developed infrastructure than other sub-regions, its actual economic output is currently held back by slow growth rates and structural dependencies, leaving it short of a one-third share of Africa’s total production.
B. Population
The following table has been constructed using statistics found within the sources where available (primarily for 2010–2020) and supplemented by standard historical estimates for earlier periods.
Year
Southern Africa (SADC)
Africa
World
% Africa
% World
1900*
~33 million
~100 million
~1.6 billion
~33%
~2.1%
1910*
~38 million
~110 million
~1.75 billion
~34%
~2.2%
1920*
~43 million
~120 million
~1.86 billion
~36%
~2.3%
1930*
~51 million
~140 million
~2.0 billion
~36%
~2.5%
1940*
~61 million
~165 million
~2.3 billion
~37%
~2.6%
1950*
~75 million
~227 million
~2.5 billion
~33%
~3.0%
1960*
~94 million
~285 million
~3.0 billion
~33%
~3.1%
1970*
~120 million
~365 million
~3.7 billion
~33%
~3.2%
1980*
~158 million
~480 million
~4.4 billion
~33%
~3.6%
1990*
~208 million
~630 million
~5.3 billion
~33%
~3.9%
2000*
~267 million
~810 million
~6.1 billion
~33%
~4.4%
2010
≈277 million
≈1.05 billion
≈6.9 billion
≈26.4%
≈4.0%
2020
≈420 million
≈1.55 billion
≈8.2 billion
≈27%
≈5.1%
*Data for 1900–2000 and certain global/continental totals are not explicitly provided in the source material and are based on standard historical demographic records; you may want to independently verify these specific historical figures.
Questions:
Is the population growing faster than productive capacity?Yes. The sources indicate a significant gap between demographic growth and the expansion of productive capacity:
Capital-Shallowing: While public and private investments have increased, they have lagged behind the rapid expansion of the labor force. This has led to “capital-shallowing”—a decline in capital per worker—meaning economic activities have become less capital-intensive over time.
Productivity Gap: Africa’s productive capacity index (31.7) remains well below the world average (47.3), and labor productivity has diverged sharply from regions like East Asia.
Food Security Constraints: The region must increase food production by 1–2% annually just to keep pace with population growth, yet it currently fails to produce enough to feed its current 277 million inhabitants.
Is labour absorption keeping pace?No. The structural transformation of regional economies has not matched the pace of population growth and urbanization:
Urbanization Without Development: Urban populations have surged (from 15% in 1960 to 40% in 2010), but this growth occurred with little change in economic structure, a process the United Nations describes as “urbanisation without development”.
High Unemployment: Youth unemployment and informal employment have become “everyday features” of the region’s cities. In South Africa, unemployment reached a staggering 34.9% in late 2021.
Growth of Slums: Because formal employment creation is insufficient, rapid urban growth has been absorbed by unplanned informal settlements and urban slums. In some SADC nations like Madagascar and Malawi, nearly 70% or more of urban dwellers live in slums.
C. Natural Resource Base
The following table details the Natural Resource Base of Southern Africa (SADC) based on the sources. This is followed by an analysis of the region’s resource wealth compared to its current economic outcomes.
Resource
Southern Africa (SADC) Share / Status
Platinum
Holds the world’s largest resources of platinum and platinum group elements.
Diamonds
Extensive deposits; major production hubs in Botswana and Namibia.
Gold
Widespread deposits; a key driver of current growth in Zimbabwe and commissioning of new mines in the region.
Copper
Home to the “Copper Belt” in Zambia and the Democratic Republic of Congo (DRC).
Coal
Major deposits in South Africa, Zimbabwe, and Mozambique; coal accounts for 59% of the region’s electricity generation.
Uranium
Extensive resources; Namibia has significant uranium processing potential.
Rare Earths
High global demand for regional “critical minerals” (e.g., lithium, cobalt) central to battery and EV production.
Agricultural land
Occupies ~32.5% of Africa’s land area, though 75% is classified as arid or semi-arid.
Freshwater
The region retains only 14% of its available renewable water resources; 86% flows to the sea.
Question:
How resource-rich is Southern Africa compared with its economic outcomes?
The sources reveal a stark contrast between the region’s immense natural capital and its actual economic performance, often referred to as a “resource paradox”:
Extreme Wealth, Slowest Growth: Southern Africa is described as one of the wealthiest regions of Africa with the “greatest potential for economic growth” due to its minerals. However, it currently records the slowest real GDP growth on the continent (estimated at only 2.0% in 2025 compared to the 4.2% continental average).
Persistent Poverty: Despite being the source of a significant portion of the world’s platinum, cobalt, and chromium, the region is among the poorest globally. Nearly 45% of the total population lives on less than one US dollar per day.
Highest Global Inequality: While resource exports generate significant revenue, the benefits are not broadly shared. Southern Africa contains the most unequal countries in the world, with South Africa ranking first globally in income inequality (Gini index of 67).
Infrastructure and Energy Gaps: Although the region is rich in energy-producing resources (coal, hydro, and gas), it suffers from massive electricity shortages and logistics bottlenecks. Less than 45% of the population in most SADC countries has access to electricity.
The Beneficiation Gap: The region has historically acted as a supplier of raw materials rather than a manufacturing hub. Leaders at the SACU summit recently noted that industrialization and beneficiation (processing minerals locally) is the only “durable path” to move away from commodity dependence and sustain growing populations.
Summary: Southern Africa possesses the natural capital to be a global economic powerhouse, yet its current outcomes are defined by stagnant growth, high unemployment, and the world’s highest levels of inequality, largely due to structural constraints and a historical lack of local value addition.
D. GDP
Based on the provided source material, the aggregate nominal GDP in US$ billions for the entire Southern African (SADC) region for the historical years (1960–2010) is not explicitly provided in a single summary table. However, the sources provide detailed growth performance, per capita income ranges for specific member states, and continental economic context that allow for the following construction of the table and related analysis.
Year
GDP (SADC) (US$ bn)
GDP per Capita (SADC Avg / Representative)
1960
To compile
Range: ~$394 (Lesotho) to ~$531 (Botswana)*
1970
To compile
Range: ~$991 (Lesotho) to ~$1,521 (Botswana)*
1980
To compile
Average per capita income for high-growth periods cited
1990
To compile
Range: ~$2,950 (Botswana) for 1981–90 period
2000
To compile
Range: ~$6,937 (Botswana) for 1991–2000 period
2010
To compile
SADC growth rate was approximately 6%
2020
~$700–800bn (Est.)**
Sub-Saharan Africa per capita growth was 1.1% in 2024
2025
~$850bn+ (Est.)***
Real GDP Growth Estimated at 2.0%
*Figures represent 10-year average per capita income for those specific decades for representative SADC nations found in the sources.**Calculated based on Africa’s total GDP being approximately $2.4–3.0 trillion (derived from debt/GDP ratios) and the fact that South Africa, the region’s dominant economy, is one of four “giants” that together produce 52% of the continent’s output.***Projected based on the region’s current real GDP growth rate of 2.0% (2025) and projected increases to 2.4% (2026) and 2.6% (2027).
Key Insights on Regional Production:
Growth Paradox: Southern Africa is currently recorded as the slowest-growing region on the continent. While the average growth for Africa in 2025 was estimated at 4.2%, Southern Africa’s growth was only 2.0%, hindered by structural constraints, electricity shortages, and logistics bottlenecks.
The “Giant” Effect: Africa’s GDP is heavily concentrated. Four economies—Egypt, Kenya, Nigeria, and South Africa—account for 52% of the continent’s total production. Because South Africa is the dominant economy in the SADC region, the regional GDP is highly sensitive to South Africa’s “sluggish” growth, which was estimated at only 1.0% in 2025.
Sectoral Drivers: On the supply side, the service sector is the primary driver of regional growth, accounting for more than half of recent GDP expansion (2.4% of the 4.2% total for the continent). Agriculture and industry have improved slightly but remain vulnerable to climate-induced shocks and low productive capacity.
Wealth Disparity: While some SADC nations like Botswana and Seychelles have reached upper-middle or high-income status, others like Malawi and Mozambique remain in the low-income group with high poverty levels. Nearly 45% of the total SADC population currently lives on less than one US dollar per day.
Transformation Requirements: The sources note that Africa (including the SADC region) needs sustained annual growth of at least 7% for a decade to achieve true structural transformation and significant poverty reduction. Currently, the region is far below this threshold.
E. GDP by Sector
Based on the provided sources, the table for GDP by Sector in Southern Africa (SADC) has been constructed to reflect the “Behaviour Over Time” as described in the regional economic assessments.
While specific US$ billion figures for every sector in every historical year are not aggregated into a single source table, the material provides percentage shares, growth drivers, and structural shifts that define the region’s economic evolution from 1960 to 2025.
Year
Agriculture
Mining
Manufacturing
Construction
Utilities
Transport
Finance
Government
Other Services
1960
~25-30%
High
Emerging
To compile
To compile
To compile
To compile
To compile
To compile
1970
Major Driver
Peak
Growth phase
To compile
To compile
To compile
To compile
To compile
To compile
1980
~15-20%
Major
Mature (SA)
To compile
~10% (Est.)
To compile
To compile
To compile
To compile
1990
Volatile*
Major
Struggling
Growth (SA)
To compile
To compile
Emerging
To compile
To compile
2000
~10-15%
Robust
Decline**
To compile
To compile
To compile
Flourishing
To compile
To compile
2010
~4-27%***
Robust
Stagnant
High (SA)
To compile
To compile
Dominant
To compile
To compile
2020
~10% (Avg)
~15-20%
~12% (SA)
~4% (SA)
~2% (SA)
~9% (SA)
~20%+
~18% (SA)
~50%+ (Total)
2025
Recov.**
Growth**
Sluggish
Sluggish
Shortage
Bottleneck
Dominant
High
Lead Driver
*Affected by 1991/92 severe regional drought.**Zimbabwe and South Africa began seeing significant deindustrialization in the 1990s due to globalization.***Current SADC sector range: Agriculture contributes between 4% and 27% of regional GDP.****2025 recovery in Zambia and Zimbabwe is specifically underpinned by Mining and Agriculture.
Insights into Behaviour Over Time:
The Service Sector Transition: On the supply side, the service sector has become the dominant driver of regional GDP. In recent years, services accounted for more than half of the continent’s growth (2.4% of the 4.2% total growth in 2025). This is particularly true in South Africa, which has “mature and flourishing” financial and retail sectors.
The “Resource Paradox” in Mining: While mining remains a core pillar—especially in the Copper Belt (Zambia/DRC) and the gold fields of Zimbabwe—the sources note that these resource-rich economies have not consistently achieved sustained income convergence despite commodity booms.
Deindustrialization of Manufacturing: The region developed a robust manufacturing sector in the mid-20th century (centered in South Africa and Zimbabwe), but since the 1990s, these industries have struggled against cheaper imports and global competition. Zimbabwe, in particular, has seen significant deindustrialization.
Infrastructure and Utilities Constraints: Construction and Utilities (specifically energy) are currently seen as bottlenecks rather than drivers. The region faces an “energy crisis” due to limited funding and overreliance on polluting coal, with less than 45% of the population having access to electricity.
Agriculture’s Vulnerability: While more than half of the region’s adult population is employed in agriculture, its contribution to GDP is highly volatile due to its dependence on rain-fed systems and susceptibility to climate-induced shocks. For example, the 1992 drought caused Zimbabwe’s GDP to decline by 11% and manufacturing output to drop by 9%.
Finance as a Modern Anchor: The financial sub-sector is noted as a key reason for the service sector’s dominance in 2025, alongside easing inflationary pressures.
F. Employment
Based on the provided sources, the table for Employment in Southern Africa (SADC) has been constructed to reflect the regional shifts in labor absorption and the growth of informal systems. While specific historical headcounts for every sector across all years are not aggregated into a single table in the sources, the material provides sectoral shares, trends, and specific structural challenges that define the regional employment landscape.
Year
Agriculture
Mining
Manufacturing
Government
Services
Informal
1960
Dominant
High
Growing
Emerging
Emerging
To compile
1970
Major
High
Growth phase
Stable
Growing
To compile
1980
Major
Stable
Peak (SA/Zim)
Expanding
Expanding
To compile
1990
~50%+
Sluggish
Decline*
Expanding
Robust
Surging
2000
~50%+
Limited
Struggling
High
Dominant
High
2010
~50%+ (Avg)
Minimal
Sluggish
High
Lead Driver
High
2020
~50%+**
Limited
Sluggish
High
Lead Driver
Highest*
2025
Vulnerable
Minimal
Sluggish
High
Dominant
Proliferating
*SADC manufacturing (specifically in South Africa and Zimbabwe) began facing significant deindustrialization and job losses in the 1990s due to globalization and cheaper imports.**While more than half of Africa’s adult population remains employed in agriculture, these jobs are highly vulnerable to climate-induced shocks.***Urbanization has largely occurred without a corresponding shift in economic structure, leading to what the UN calls “urbanisation without development,” where rapid urban growth is absorbed primarily by the informal sector and urban slums.
Questions:
Which sectors absorb labour?
Agriculture: This remains the primary employer in the region, with more than half of the adult population depending on it for their primary source of income and subsistence.
Services: This has become the dominant driver of growth (accounting for 2.4% of the estimated 4.2% GDP growth in 2025) and is a major absorber of labor, particularly in South Africa’s mature financial and retail sectors.
Informal Sector: Due to a lack of formal job creation, the informal sector absorbs a massive portion of the regional workforce. Informal employment and youth unemployment are described as “everyday features of African cities“.
Which sectors are shrinking?
Manufacturing: This sector has been in a state of significant deindustrialization since the 1990s. Heavy industry, textiles, and manufacturing hubs in South Africa and Zimbabwe have struggled against cheaper imports from China, leading to substantial job losses.
Traditional Industry: The sources note that industrial productivity is low (Africa’s productive capacity index is only 31.7) and characterized by “minimal job creation” and weak linkages to the rest of the economy.
Which sectors create wealth without creating employment?
Mining and Extractives: While mining makes this one of the wealthiest regions in terms of potential, it often creates wealth that does not translate into broad-based employment. For example, in Angola, oil exports attracted significant foreign capital and created wealth for Luanda, but the impact on employment has been limited.
Commodity Exports: The sources describe a “resource paradox” where resource-rich economies (like Angola, Gabon, and Libya) record high per-capita incomes during booms, yet often fail to achieve sustained income convergence or large-scale job creation due to a lack of local value addition (beneficiation).
G. Trade
Based on the sources provided, the following table for Trade in the Southern African (SADC) region has been constructed. While the source material primarily focuses on recent and projected performance (2020–2027), historical trends have been inferred from the regional economic descriptions and structural assessments.
Year
Imports (SADC) (US$ bn)
Exports (SADC) (US$ bn)
Net Trade (Trade Balance)
1960
To compile
To compile
Surplus (Resource Booms)
1970
To compile
To compile
Peak Surplus
1980
To compile
To compile
Surplus (Mining)
1990
To compile
To compile
Volatile (Drought Impacts)*
2000
~$150bn (Est.)
~$165bn (Est.)
Surplus (~$15bn)
2010
~$210bn (Est.)
~$230bn (Est.)
Surplus (~$20bn)
2020
~$260bn (Est.)
~$240bn (Est.)
Deficit (~$20bn)
2025
~$300bn+ (Est.)**
~$280bn+ (Est.)**
Deficit (~2.5% of GDP)*
*The 1991/92 drought required the importation of 11.4 million tonnes of cereal, significantly impacting trade balances.**Africa’s overall trade deficit was 3.0% of GDP in 2025, and Southern Africa’s current account deficit was estimated at 2.5% of GDP for the same year.
Derived: Trade Per Citizen (2020–2025 Analysis)
Note: Calculations use the regional population estimate of ≈420 million for 2020 and a projected ≈450 million for 2025 [Previous Turn, 114].
Metric
2020 (Est.)
2025 (Proj.)
Imports per citizen
~$619.05
~$666.67
Exports per citizen
~$571.43
~$622.22
Net imports per citizen
$47.62 (Net Importer)
$44.45 (Net Importer)
Insights into Regional Trade Dynamics:
Trade Deficit Drivers: The region’s shift to a net-importing status in recent years is attributed to “subdued external demand” for its primary exports (notably diamonds in Botswana) and persistent “logistics bottlenecks” and “electricity shortages” that hinder production in South Africa.
The Resource Paradox: Southern Africa holds 30% of the world’s mineral reserves, yet its trade performance is vulnerable to global price fluctuations. In 2025, global commodity prices declined by 7.0%, weighing heavily on regional exporters.
Intra-Regional vs. Global Trade: Intra-African trade currently accounts for only 15% of the continent’s total trade. The sources emphasize that implementing the AfCFTA could lift real per capita GDP by more than 10% in the long run by reducing dependencies on extra-continental markets.
The “Nearshoring” Opportunity: While Southern Africa faces slow growth, North African SADC partners and neighbors (like Egypt and Morocco) are seeing export growth through “nearshoring” strategies for European markets, a model SADC aims to emulate through its “Spatial Corridor Development Strategy”.
Exchange Rate Volatility: In 2025, the softening of the US dollar helped mitigate the impact of external shocks, improving the import bill for several nations, though countries like Zimbabwe and Angola continued to face high currency depreciation.
H. Food
Based on the provided sources, the table for Food in Southern Africa (SADC) has been constructed to reflect the region’s transition from agricultural self-sufficiency to a state of net food dependency, particularly during climate-induced shocks.
While precise regional US$ billion aggregates for every decade are not provided in a single source table, the material details cereal tonnages, trade balance trends, and deficit drivers that define the regional food economy.
Year
Food Imports (SADC)
Food Exports (SADC)
Net Food Imports (Balance)
1960
To compile
Significant
Surplus (Regional “Breadbasket”)
1970
To compile
Robust
Surplus
1980
To compile
Stable
Surplus / Balance
1990
High (11.4m tonnes cereal)*
Reduced
Large Deficit (~$200m+ in aid)*
2000
Increasing
South Africa Dominant
Negative Trade Contribution
2010
High (~3.9m tonnes cereal)
South Africa Dominant
Net Importer
2020
Surging (~7.9m tonnes cereal)**
Vulnerable
Structural Deficit
2025
Estimated Recovery*
Growth Projected
Narrowing Deficit (Proj.)
*The 1992 regional drought forced the importation of 11.4 million tonnes of cereal; WFP provided $200 million in aid for Mozambique alone.**The 2015/16 drought resulted in an overall regional cereal deficit of 7.90 million tonnes.***2025 estimates indicate a rebound in regional cereal production due to favorable weather conditions and a 7.0% decline in the global food price index.
Questions:
How dependent has Southern Africa become on imported food? The region has become structurally dependent on imported food to meet the needs of its growing population:
Production Gap: Southern Africa is currently not producing enough food to provide for its current population (estimated at 277 million in 2010 and projected to exceed 300 million by 2025).
Vulnerability to Shocks: With 97% of total cropland in sub-Saharan Africa being rain-fed, regional food security is highly susceptible to climate variability. During the 1992 drought, 70% of crops failed, necessitating massive emergency imports.
Rising Requirement: To keep pace with population growth, the region must increase overall production by at least 1% to 2% per annum.
Economic Impact: The sources note a consistent trend of “agriculture’s negative contribution to the trade balance,” indicating that food imports frequently outweigh export revenues for most SADC nations, with the notable exception of South Africa.
Which commodities dominate imports? The regional import bill is primarily dominated by staple cereals required to offset domestic production shortfalls:
Maize: As the primary staple food for most of the population, maize is the dominant import, particularly during drought years when yields in countries like Zimbabwe and Zambia collapse.
Wheat: A major cereal that is highly vulnerable to periods of drought; over 53% of regional wheat is produced under dryland conditions, necessitating imports when rains fail.
Sorghum: Along with maize and wheat, sorghum is one of the “most produced cereals” and major staple foods that the region struggles to supply consistently.
Livestock Feed: Major shifts in dietary patterns toward meat and animal products are driving an increased demand for imported feed to support regional livestock production.
I. Productivity
Based on the data derived from the regional economic outlooks and the structural assessments provided in the sources, the following table details the Productivity metrics for Southern Africa (SADC). These values reflect the 2025 projections and representative sectoral shares discussed in our conversation history.
This section reveals the gap between the region’s vast natural potential and its realized economic output per inhabitant.
Indicator
Value (SADC 2025 Proj. / Representative)
GDP per citizen
~$1,888 (Estimated)*
Manufacturing GDP per citizen
~$151 (Based on ~8% regional share)**
Agricultural GDP per citizen
~$189 (Based on ~10% regional share)***
Export value per citizen
~$622.22 [Turn 10]
Import value per citizen
~$666.67 [Turn 10]
Electricity generated per citizen
~132 Watts (Operating Capacity)****
Formal jobs per 1,000 citizens
Struggling (Driven by ~80–90% Informality)*****
*Calculated based on a projected regional GDP of $850bn+ and a population of ~450 million [Turn 5, 114, 266].**Reflects the “significant deindustrialization” noted in the region since the 1990s [Turn 9, 808].***While more than half the adult population is employed in agriculture, its per-citizen value is low due to the prevalence of “subsistence or smallholder” systems.***Derived from the Southern African Power Pool (SAPP) operating capacity of 47.7 GW serving 360 million people.*****Reflects the “urbanisation without development” phenomenon where rapid growth is absorbed primarily by the informal sector and urban slums rather than formal employment.
Revelations on Productivity:
The Global Divergence: The sources reveal a sharp divergence in productivity. While African workers were 40–45% more productive than those in East Asia in the 1960s, East Asian workers are now 3 to 10 times more productive than their African counterparts.
The “Capital-Shallowing” Trap: Despite increased investment, the region faces “capital-shallowing”—a decline in capital per worker—meaning economic activities have become less capital-intensive over time.
The Productive Capacity Deficit: Africa’s overall productive capacity index is estimated at only 31.7 of 100, far below the world average of 47.3. The region performs particularly poorly in ICT (7.3) and Energy (22.1), which are the primary enablers of industrial output.
Unrealized Human Capital: Many children in the region will reach only 40% of their potential productivity as adults due to current gaps in education and healthcare.
Infrastructure Shaving Growth: Poor infrastructure is estimated to shave off at least 2% of potential per-capita growth every year, further depressing the productivity figures shown above.
J. Innovation
Based on the provided sources, the following table for Innovation in Southern Africa (SADC) summarizes the regional performance. While specific numerical headcounts for these indicators are not aggregated for the entire region in the source material, the assessments provide a clear picture of a significant gap between current capacity and global benchmarks.
Indicator
Value / Status in Southern Africa
Engineers per million
Critical Shortage: The region faces a severe “skills and capacity shortage” in technical and engineering fields required for infrastructure development.
Researchers per million
Lagging: The region “largely lags behind their Asian counterparts” in research and development. Agricultural research specifically suffers from “low funding”.
STEM graduates
Under-indexing: Southern Africa lags in “STEM sciences”. High-growth potential is hampered by “high emigration among skilled workers,” leading to a significant regional brain drain.
Patents
Low Output: Innovation is cited as a major area where the region falls behind global competitors. Industrialization is currently defined more by raw material supply than local innovation.
Scientific publications
Below Global Average: Using climatic reporting as a proxy, the region produces significantly fewer scientific reports than the global average (e.g., 19 climatology reports per year in SADC vs. 73 globally).
Insights into the Innovation Landscape:
The Global Divergence: The sources indicate that Southern Africa is not yet a global innovation hub. While moderately successful by African standards, it lacks the “STEM sciences and research and development” momentum seen in Asian tiger economies.
Human Capital Deficit: The World Bank’s Human Capital Index (HCI) reveals that children born in many parts of the region will reach only 40% to 43% of their potential productivity as adults due to prevailing gaps in education and healthcare.
Brain Drain Pressures: Nations like South Africa and Zimbabwe face “human capital flight,” losing billions as skilled workers emigrate to Western economies.
The “Suppliers vs. Architects” Question: Regional leaders have noted that the fundamental challenge for the 21st century is whether Southern Africans will be the “architects of development” or remain merely “suppliers of raw materials“.
Productive Capacity Gap: Africa’s overall productive capacity index is only 31.7 of 100, trailing the world average of 47.3. The region performs particularly poorly in ICT (7.3), which is a primary enabler of modern innovation.
Targeted Investment: Recent efforts include SADC awarding scholarships for PhD and MSc students in climate modeling and related sciences to strengthen the institutional capacity of National Meteorological Services (NMS).
K. Regional Integration
Based on the provided sources and conversation history, the following table for Regional Integration in Southern Africa (SADC) outlines the current status of economic cohesion and cross-border development.
Indicator
Value / Status in Southern Africa
Intra-SADC trade (%)
~15–20%: Reflects the continental average for intra-African trade (15%), which remains far below levels seen in Asia (51.1%).
Trade with rest of Africa
Emerging Priority: Deepening integration under the AfCFTA is projected to lift intra-African goods trade by more than 50% and increase regional incomes by 7%.
Trade outside Africa
Dominant (80%+): The region remains a primary supplier of raw materials to global markets, leaving it highly vulnerable to global price shocks and “subdued external demand”.
Regional value chains
Underdeveloped: Current efforts focus on mineral beneficiation, a regional battery value chain, and cross-border component manufacturing for the automotive and mining sectors.
Cross-border infrastructure
Stagnant: Only 5% of planned regional infrastructure projects were completed by 2019. Vital progress is anchored by Spatial Corridors (North-South, Maputo, Beira, Lobito, and Trans-Kalahari) [403, 449, 827–834].
Key Insights on Regional Integration:
The “Re-imagined” Agenda: Leaders have called for a shift from a “traditional customs arrangement” to a platform for economic self-reliance. This involves harnessing Eswatini’s manufacturing, Lesotho’s textiles, Namibia’s green hydrogen, Botswana’s diamond beneficiation, and South Africa’s steel capacity into a unified industrial ecosystem.
Infrastructure as the Bedrock: Regional integration is currently hindered by an infrastructure deficit. Reliable cross-border transport and energy grids (like the Southern African Power Pool) are described as the only path to achieving the 7% annual growth required for structural transformation.
Corridor Consolidation: SADC’s Spatial Corridor Development Strategy focuses on routes that connect industrial hubs with trade gateways. For example, the North-South Corridor serves as the “backbone of regional trade,” connecting the Copper Belt to the port of Durban.
The Energy Integration Leap: While general infrastructure stagnates, energy trade has seen significant growth, rising from 1% of regional operating capacity in 2012 to 24% by 2018 through the SAPP.
Non-Tariff Barriers: Lack of adequate infrastructure is cited as a major non-tariff barrier to trade. Poor quality infrastructure services can increase the input costs of consumer goods by up to 200% in certain regional nations.
Institutional Misalignment: A critical challenge to integration is the misalignment between national and regional priorities. Member States often prioritize domestic projects over cross-border initiatives, and there is an “unclear delineation of roles” regarding who should act as project sponsors.
L. Regional Container and Port Throughput (Per Annum)
Based on the provided sources, there is no single table that aggregates the total number of containers shipped in and out for the entire Southern African region per annum. However, the sources provide specific port throughput capacities and individual port statuses that define the region’s containerized trade volume.
The following table summarizes the available annual container and port throughput data for major regional gateways mentioned in the sources:
Port / Gateway
Annual Throughput Capacity / Status
Key Trade Function
Port of Durban (South Africa)
Highest-volume freight route on the continent.
Primary gateway for the North-South and Gauteng Corridors; serves the region’s industrial heartland.
Chinese-funded Port Throughput (Africa Total)
85 million tonnes per year (Capacity built/upgraded by Chinese enterprises).
Represents a significant portion of the continent’s expanding shipping infrastructure.
Port of Walvis Bay (Namibia)
New Container Terminal is at an advanced stage.
Serves as an efficient western outlet for Botswana, South Africa, and Zimbabwe via the Trans-Kalahari Corridor.
Port of Beira (Mozambique)
Handles a significant share of regional general cargo and agricultural commodities.
Provides the shortest sea access for landlocked Zimbabwe, Zambia, and the DRC.
Port of Nacala (Mozambique)
Deep-water port suited for larger vessels.
Strategically important emerging route for bulk commodity exports from Malawi and Zambia.
Port of Lobito (Angola)
Key Atlantic outlet for critical minerals.
Anchored by the Benguela Railway to move copper and cobalt from the DRC and Zambia.
Insights into Southern African Container Trade:
The Landlocked Challenge: For several of the region’s largest economies—Zambia, Zimbabwe, Botswana, and the DRC—every container imported or exported must travel overland through a neighboring country to reach these seaports.
Infrastructure Deficits: The region suffers from a “huge infrastructure deficit,” including unreliable transport networks. In some countries, supply chain barriers and freight costs can account for as much as 4% of total revenues for producers, eroding export competitiveness.
Expansion Efforts: SADC’s Short-Term Action Plan (STAP) included major projects to address these bottlenecks, such as the Durban Dig-out Port (expansion) and the construction of dry ports in Tanzania (Kwala-Ruvu, Ihumwa-Dodoma, etc.) to handle inland cargo more efficiently.
Trade Imbalance: While specific container counts are not listed, the region’s overall trade status is currently that of a net importer [Turn 10]. In 2025, Africa’s trade deficit was expected to widen to 3.4% of GDP due to subdued commodity prices and slowing global demand.
Efficiency Gains: The implementation of One-Stop Border Posts (OSBPs), such as those at Beitbridge and Nakonde, is intended to reduce the delays that “often outweigh the transit time” between ports and inland markets.
“Gaborone: The heart of Botswana’s economy—and its paradoxes.” Attribute: UN Tourism
What Sets The Study Apart
While there are global studies examining governance, workforce development, systems thinking, and unemployment independently, the STRLDi unemployment study appears to be among the first known attempts to integrate these dimensions into a single national systems framework. The study examines unemployment not merely as a labour-market issue, but as a structural output emerging from the interaction between governance systems, productive-capacity design, labour allocation patterns, aspiration systems, emotional structures, and national narratives.
Pioneering Systems Thinking for National Transformation
This is the first study of its kind in the field of Learning Organisation, and the first known application of The Fifth Discipline on a national economic scale. It represents a breakthrough not only for Botswana, but for the global community of systems thinking practitioners, in the Senge Forrester lineage.
We are delighted to share insights into how systems thinking can be used as a research methodology—moving beyond reflection, into structured, evidence-based intervention. This work pioneers new ground for how governments, businesses, and communities can approach complex, large-scale challenges.
It aligns with Peter Senge’s long-standing call to integrate systems thinking with robust research and practical application. This approach has gained recognition within the global Society for Organizational Learning (SoL) community and highlights the urgent need for more researchers and practitioner-leaders to co-create solutions across domains.
“This is not just a study. It is a prototype for how learning, leadership, and structure can come together to solve problems that have defied generations.”
What We’re Missing Why unemployment persists despite decades of investment
A Systems View Framing unemployment as a systemic design issue, not individual failure
Why the Economy Isn’t Absorbing Labour The mismatch between GDP growth, employment, and sectoral profitability
The Circulation Crisis How money flows out of the economy, weakening internal productivity loops
From Retail-Led Growth to Production-Led Resilience Why agriculture and manufacturing must be restructured to drive sustainable employment
A Learning Milestone in Systems Thinking How this study breaks new ground in national application of The Fifth Discipline
Opening Paragraph: Setting the Puzzle
Botswana has seen five decades of investment, aid, and policy reform—but unemployment remains stubbornly high. This isn’t due to lack of effort or funding. It’s something deeper—something structural.
Section 1: What We’re Missing
“Over five decades, Botswana has attracted billions in investment and international aid. The country has built infrastructure, expanded education access, and grown GDP per capita. Yet unemployment continues to rise, and the economy feels increasingly unable to absorb the talents of its people.”
Investments to-date (1960s–Present)
Since Independence, Botswana has received an estimated USD 1.2 trillion (≈ P16 trillion) in investments, government spending, and aid. Over the same period, our population has grown from approximately 580,000 in 1966 to around 2.7 million today. This translates to roughly USD 600,000 (≈ P8 million) invested per person over five decades—excluding inflation adjustments (sources: The Guardian, Reuters, Wikipedia).
As of Q1 2024, approximately 504,738 individuals are formally employed in Botswana—defined as those holding wage or salary jobs in the formal sector (VCDA.afdb.org, Trading Economics, Botswana LMO).
To put this in context:
The average monthly wage in the formal sector is P7,149 (~USD 500) (Stats Botswana Q1 2024, ILO, Botswana LMO).
Botswana’s total labor force is estimated at 1,173,186 individuals.
Therefore, only 43% of the labor force holds formal employment.
This is clear evidence that decades of investment have not translated into shared prosperity.
Despite numerous policy interventions, unemployment in Botswana has remained persistently high. With just 43% formally employed, and an estimated 1.5 million working-age individuals, this leaves 57%—nearly 6 in 10 employable people—without access to sustainable income.
“Our challenge is not the absence of effort or policy. It is the absence of a structure that is designed to translate growth into widespread, sustainable income.”
“Formal employment absorbs less than half the country’s working-age population. And of those absorbed, most are concentrated in a handful of public sector or capital-intensive industries that don’t scale with population growth.”
“The labour market isn’t broken because people are lazy. It’s broken because it was never structurally designed to absorb everyone.”
Growth ≠ Jobs
Here is the combined graph showing:
Botswana’s GDP (in billions of BWP, left Y-axis)
Population dynamics (right Y-axis), broken down into:
Rising unemployment and non-formal employment indicate structural absorption issues
“We continue to build systems that reward GDP growth, but not labour absorption. The mismatch is systemic, not accidental.”
Section 2: A Systems View
“What if unemployment in Botswana isn’t simply the result of failed programmes or policy gaps? What if it is the predictable outcome of how the system is designed?” (Part 1)
The study draws on insights from Peter Senge’s The Fifth Discipline, particularly its emphasis on systems thinking—a way of seeing problems not as isolated events, but as patterns produced by structures, delays, and feedback loops.
Source: STRLDi analysis using Statistics Botswana, World Bank/ILO, and national labour data.
📊 From Demographic Inflow to Labour Market Pressure
This Behaviour Over Time (BOT) graph traces the structural build-up of unemployment in Botswana by comparing cumulative labour supply (driven by births, deaths, and immigration) against economic absorption capacity (formal employment).
The upper trajectory represents the supply of labour — a steadily rising curve shaped by demographic inflows. Notably, each birth cohort enters the labour market approximately 18 years later, creating a predictable and continuous increase in entrants over time. This growth persists regardless of leadership or policy cycles.
The lower trajectory reflects the demand for labour — the economy’s ability to absorb workers into formal employment. While this line also rises, it does so at a much slower pace, revealing a persistent gap between entrants and absorptive capacity.
The widening space between these two curves represents the cumulative unmet labour stock — individuals who are not absorbed into formal employment. By the current position (2026), this gap has grown significantly, and projections to 2043 show it continuing to expand if the structure remains unchanged.
A critical feature of this graph is that it shows stock accumulation, not just annual flows. Even if job creation improves in a given year, the backlog continues to grow unless annual absorption exceeds annual entrants — a threshold that has not been met.
The highlighted points along the curves draw attention to specific periods where:
Labour supply accelerates due to demographic momentum,
Absorption remains constrained, and
The system quietly compounds pressure over time.
“Systems thinking helps us move beyond symptoms. It challenges us to ask: What are the underlying structures that keep producing the same results—even when we change the players, the funding, or the policies?” (Part 1)
What becomes clear is that unemployment in Botswana is not a short-term fluctuation but a structural outcome. The pattern has remained consistent across policy shifts, economic cycles, and leadership changes — indicating that the causal structure itself is driving the behaviour.
Left unchecked, this structure will continue to steer future outcomes along the same trajectory.
The opportunity, however, lies in seeing it clearly. Once the structure is understood, the direction of the system can be deliberately changed.
The unemployment study does not treat joblessness as a standalone issue. Instead, it approaches it as a system-wide pattern—shaped by how we educate, govern, allocate capital, and design labour absorption pathways.
“We must shift from treating unemployment as a problem to be solved, to seeing it as a system to be redesigned.”
Circular traps within the system (e.g., weak education feeding low productivity)
“Unemployment persists not because of individual failures—but because of reinforcing loops built into the system.”
Section 3: Delays, Stocks, and Structures
One of the most overlooked dynamics in Botswana’s unemployment crisis is delay—the long and predictable time lag between population growth and job readiness.
“We know when children are born. We know how long it takes to educate and prepare them for the workforce. Yet national economic planning treats workforce entry as a short-term policy issue, rather than a structural inevitability.”
This is a classic stock-and-flow problem:
The stock is the growing pool of working-age individuals.
The flow—job creation—has not kept pace with this growth.
Delays between population growth and job readiness
But the challenge runs deeper. Even when new entrants are ready to work, Botswana’s economy struggles to absorb them. The missing link? The country’s capacity to scale production and market reach.
Production Constraints and Market Access
Botswana’s enterprises—particularly in manufacturing and agriculture—have not been able to consistently meet regional and international standards in quality, speed, and output volume. This is not due to lack of ambition, but to the limited readiness of the workforce to perform at scale. Even where isolated excellence exists, system-wide performance is weak.
“When firms can’t meet standards consistently, they can’t retain or expand markets. And without markets, there’s no growth. Without growth, there’s no hiring.”
This creates a self-reinforcing loop:
As a result, firms choke themselves out of opportunity—not because of external shocks, but because of internal misalignments between labour, process, and market demand.
Evidence from Sector Data
The study’s behaviour-over-time graphs show that even with investment, manufacturing and agriculture have failed to generate sustained profitability as national sectors.
THE CAPACITY OF ECONOMIC SECTORS TO CREATE EMPLOYMENT
Since surpassing the mining sector in 2008, retail has become the leading driver of Botswana’s economy. Its continued growth reflects the rising influence of commerce, services, and consumer demand in shaping economic progress. Unlike mining, which depends on finite resources, the retail sector thrives on innovation, entrepreneurship, and the ability to respond to evolving needs. With revenues steadily outpacing costs, retail offers strong potential for job creation, business expansion, and economic resilience. Targeted investment in skills development, digital transformation, and local enterprise growth can further strengthen this vital sector.
Once the backbone of Botswana’s economy, the mining sector has faced growing volatility since the 2008 global financial crisis. Revenues have fluctuated, and lab-grown diamonds are gaining ground with global consumers due to their lower cost. While a recovery remains possible as global markets improve, the sector has shown no sustained growth over the past two decades. This prolonged uncertainty underscores the urgent need for economic diversification and greater investment in industries that offer long-term stability and resilience.
Resource-dependent emerging economies often balance raw material production with a strong manufacturing base to drive growth. Botswana, centrally located and landlocked, holds untapped potential as a regional hub for both agriculture and manufacturing, offering vital employment opportunities.
However, these sectors have struggled to take off. They contribute less than a tenth—and in some cases as little as a fiftieth—of what the retail sector generates. As a result, job creation has stalled. Agriculture and manufacturing have yet to establish profitable, scalable business models capable of supporting long-term economic growth (G&U).
To fully realize its potential, Botswana must restructure its agriculture and manufacturing sectors to ensure they are both competitive and sustainable.
A well-developed plant- and animal-based production and manufacturing sector (left diagram) lays the groundwork for regenerative, future-facing growth. It provides a strong foundation for sustainable economic development while generating and absorbing significant employment.
By contrast, extraction-based industries (right diagram) are typically capital- and technology-intensive, employing fewer people and depleting the natural resources essential for building a resilient, job-creating economy.
GROSS PRESENTATION OF THE SCALE OF THE ECONOMY. (AS OF THE LAST CENSUS YEAR IN 2011) PRESENTED BY ECONOMIC SECTORS. IT ALSO INCLUDES THE MISSING SECTORS.
IT SHOWS THE SCALE OF THE UNEMPLOYED WHEN THE FOUNDATION SECTORS ARE MISSING.
The grey, brown, and green portions represent the sizes of the manufacturing, mining, and agriculture sectors’ ability, respectively. These sectors should be readied to absorb unemployment. https://en.wikipedia.org/wiki/Botswana
The Circulation Crisis: When Value Doesn’t Flow
When Earning Isn’t Enough: The Circulation Crisis
Botswana has built an impressive track record of export-led earnings and prudent fiscal management, but a deeper issue persists beneath the surface: the money we earn does not stay in the economy long enough to generate sustained impact. Instead, it exits almost as quickly as it enters—through imports, repatriated profits, external contracts, and other financial leakages. This pattern undermines the very purpose of economic growth. It’s not that Botswana doesn’t earn—it does. The problem is that those earnings don’t multiplywithin the local economy, depriving it of the fuel needed to create jobs, deepen industries, or uplift communities. This paper unpacks the scale of that leakage, where it goes, what remains, and what must be done to reverse it.
Exporting Wealth, Importing Dependency
It is a fair and data-backed observation that a substantial share of the income Botswana earns—whether through exports, government revenue, or trade—does not stay within the economy but instead exits rapidly. This dynamic is particularly evident in years like 2022, when Botswana exported approximately USD 8.9 billion worth of goods, yet spent about USD 8.7 billion on imports. That means nearly every pula earned through international trade was matched by a pula spent abroad. The result is a system where revenues generated through diamonds and other exports flow out just as quickly via imported fuel, machinery, vehicles, food, and services, with little absorption into domestic value chains. Without robust processing, manufacturing, or reinvestment capacity, the economy behaves like a conduit rather than a container—passing wealth through without compounding its benefits locally.
How Much Leaves, How Little Stays
In estimating the leakage, if we treat total exports (≈ USD 8.9 billion) as a proxy for total revenue, and combine import spending with factors like profit repatriation, external contract payments, and debt service, a conservative estimate suggests that at least 60–80% of this national income leaves the country. That means only 20–40% of what Botswana earns circulates internally—supporting government wages, local consumption, and limited domestic procurement. In 2022, for example, government revenue stood around USD 5.5 billion, while import bills were higher still at USD 8.7 billion—making imports roughly 158% of revenue. This points to a structural imbalance where even sovereign income is insufficient to retain wealth domestically.
The Need to Build Domestic Multipliers
What little money remains is spent primarily on public salaries, social services, and recurring operational costs, which in turn often rely on imported inputs—thereby creating additional layers of leakage. Without strengthening Botswana’s domestic production capacity—especially in manufacturing, agriculture processing, and infrastructure development—these funds will continue to create jobs and incomes elsewhere, not at home. The weak local value chain not only limits domestic job creation but also increases vulnerability to external price shocks and supply disruptions. Unless this economic architecture is reshaped to prioritize internal circulation and value capture, Botswana may continue to earn big but circulate little—leaving a growing population without the employment or enterprise opportunities it deserves.
The result? Botswana’s economic engine spins but does not pull. Resources move at the top, but do not multiply across the broader economy.
“We earn, but we don’t multiply. We produce, but we don’t distribute. This is how an economy grows on paper but feels stuck in practice.”
Section 4: What the Study Did
This study set out not merely to document unemployment trends in Botswana, but to reveal the underlying structures that continue to produce them—despite well-intentioned policies, funding, and reform efforts. It applies systems thinking, drawn from The Fifth Discipline by Peter Senge, to diagnose the national economy as a living system—one that has not been designed to absorb its people into meaningful, productive livelihoods.
The study using 20-year data:
Tracked the disconnect between population growth and employment absorption
Identified sector-level profitability stagnation, particularly in agriculture and manufacturing
Mapped the structural traps and feedback loops reinforcing unemployment and low productivity
Highlighted the circulation crisis—how value generated fails to move across the economy in a way that multiplies opportunity
“The problem isn’t a lack of effort—it’s that we’re working inside a system that was never designed to deliver the outcomes we now expect.”
At its core, the study surfaces three persistent systemic failures:
The Absorption Gap: There is no built-in pathway to absorb the growing workforce into formal, productive sectors.
The Productivity Trap: Key sectors remain underperforming, not from lack of investment, but from workforce misalignment and poor process standards.
The Circulation Breakdown: Value accumulates in isolated areas without circulating into broader economic and employment growth.
Using systems thinking tools—such as feedback loops, time delays, stock-flow structures, and archetypal traps—the study identifies leverage points that could reverse these patterns:
Aligning education, training, and production
Restructuring sectors to reinvest and scale
Redesigning governance for flow, not fragmentation
Here is the closing paragraph for Part 1, crafted to bring the post to a thoughtful and anticipatory conclusion, while inviting readers forward into Part 2:
Conclusion: Preparing for the Deep Dive Ahead in Part 2
Botswana’s persistent unemployment is not the result of any single actor or decision. It is the outcome of a system whose design has not kept pace with its people. This study reveals that until job creation is structurally embedded—until sectors are rebuilt for absorption, productivity, and flow—the frustration across government, private sector, and households will continue.
But there is a path forward.
Through the lens of systems thinking, we begin to see where leverage lies—not just in programmes or reforms, but in the very architecture of how our economy functions. In Part 2, we examine the specific feedback loops, social disruptions, and sectoral misalignments that reinforce the current state—and explore how these can be shifted.
“The goal is not to fix the old system. It is to redesign the economy so that people—and their potential—are no longer left out of the future.”
Introduction to Part 2
Click here for Part 2 of the article. It covers the next:
Yes, we do. Here’s the refined write-up for the section titled:
🎓 A Learning Milestone in Systems Thinking
How this study breaks new ground in national application of The Fifth Discipline
This is the first study of its kind in the field of Learning Organisation. It marks the first large-scale application of Peter Senge’s The Fifth Discipline to a national issue—persistent unemployment—and does so using a full systems diagnosis. This milestone represents not just a personal achievement, but a breakthrough for the global community of systems thinking practitioners.
It demonstrates that the discipline of Systems Thinking can be rigorously applied beyond organizations—into the complex, cross-sectoral domain of national development. For those working on public policy, economic transformation, and institutional renewal, this work offers a new, structured framework for addressing systemic stagnation.
The study aligns with the direction advocated by Dr. Senge and the global Society for Organizational Learning (SoL): pairing systems thinking with robust research methodology. It also underscores the importance of not isolating systems thinking as a “soft” or intuitive practice, but grounding it in structured diagnosis, modelling, and evidence-based design.
🔖 Pull Quote
“This is the first national-level application of The Fifth Discipline—a step change in how countries can diagnose and redesign complex challenges.”
We welcome the opportunity to engage with researchers, educators, governments, and private sector partners who want to better understand this methodology—and consider how it might be adapted to other pressing national or regional challenges. The study offers a replicable approach for countries confronting economic exclusion, sectoral imbalance, or policy fragmentation.
🔹 Technical Appendix Note
Note on Methodology and Assumptions
This Behaviour Over Time (BOT) graph is constructed using cumulative estimates of labour market entrants derived from demographic inflows (births adjusted for deaths and net migration), with an assumed 18-year lag to represent entry into the working-age population.
In the absence of complete year-by-year data, intervening annual variations were smoothed, and estimates were applied in a manner that ensures cumulative alignment with known reference points, including the observed labour market position in 2025–2026.
The demand curve reflects formal employment absorption capacity, based on available employment data and projected growth trends.
The resulting gap represents the cumulative unmet labour stock — individuals not absorbed into formal employment. It is important to note that this is a stock accumulation model, meaning that unless annual job creation exceeds annual entrants, the gap will continue to widen over time.
This model is not intended as a precise yearly forecast, but as a structural representation of system behaviour, allowing for identification of underlying causal dynamics rather than short-term fluctuations.
🔎 Source
Author’s analysis (STRLDi), based on compiled data from:
Statistics Botswana – Population, Labour Force, and Employment Data
World Bank / ILO – Labour market and demographic benchmarks
Ministry of Finance & National Planning (Botswana) – Budget and economic reports
HRDC (Human Resource Development Council) – Labour and skills data inputs
Model constructed using cumulative demographic inflow (births – deaths + net migration) with an 18-year labour market entry lag, and estimated formal employment absorption capacity.
“Strategic Reflection: Toward a Regenerative Botswana Economy”
What if the real challenge in governance isn’t corruption or inefficiency? Instead, it may be the absence of a shared, cross-sector system. Such a system can hold a vision over time.
Around the world, the systems we’ve inherited were designed for different eras. Some were from the colonial era, and others from the industrial era. Few are built to match the complexity, interdependence, and generative potential of today’s global economy.
And in Africa, our response to this gap is long overdue.
So, what might such a system look like?
The method of sustaining employment through government tenders, grants, and extractive economies for export is reaching its limit. This approach has been used across the public, private, and informal sectors. Tax revenues generated from foreign investments are redistributed into health, education, security, and infrastructure. This model, while protective and supportive, lacks growth in high-value (90%+) productive activities by its population in agriculture. This is needed in processing and manufacturing. Such growth is essential for long-term economic resilience and creating national wealth.
If Botswana is serious about diversifying its economy and building enduring, generational wealth, this model must be reformed, i.e. from a redistributive to regenerative economy.
Any wealth accumulation by the nation before taking this foundational step risks being premature. It could be unjustifiable and border on a misappropriation of public trust and resources.
In this transformation, it is imperative that the government’s socialist functions are gradually reduced. These functions include providing direct support to youth, women, and the elderly. In fact, these functions will fall away naturally as families stabilize. A generative, production-based economic model will enable the core family unit to re-assume responsibility for their well-being.
Dividing these groups for short-term political gain may yield momentary advantage, but it results in long-term economic fragmentation and loss.
What then is a structured governance workforce distribution model for Botswana, based on a projected population of 5–8 million (from today’s 2.5 million) over the next 30 years, with a per capita wage of P20,000 (cf to today’s P1,600) and a GDP of $60–100 billion (today’s $20 billion). The focus will be on recommended private vs. public sector workforce shares and a detailed breakdown by ministry.
This post presents a structured overview of Botswana’s current governance architecture. It comprises Ministries, Parastatals, and formal Public-Private or Community-Inclusive Structures. All of these are currently funded through the government payroll. Building on this foundation, the report then introduces a proposed governance body. This body is designed to lead Botswana into a future anchored in regenerative, value-creating economic transformation.
POST ROADMAP:
Given the post’s depth and evolving focus, we are providing a simple outline that will help readers stay oriented.
In This Post – Recalling What Governance Meant – Seeing What the World Is Showing Us – Why Africa’s Frameworks Must Evolve – Rethinking Our National Structure – Lessons from the DM Model – The Next Step Forward
🧩 Inquiry Roadmap – Guiding Questions Behind the Essay
Here’s a list of guiding questions used in the development of the full essay.
The essay is titled “When the World Speaks – Governance BW”. This list acts as a roadmap of inquiry. It traces the intellectual journey from challenge recognition to structural diagnosis. It continues to the design of a proposed national governance framework. Finally, it leads to the integration of policy learning from the DM model.
These questions were raised across multiple conversations over the past 2–3 weeks (with DM model-specific queries toward the latter part). Use them to orient yourself as the reader at the start of the essay. They invite you to walk the same arc of discovery.
🌍 SYSTEMIC PATTERNS & CONTEXTUAL FRAMING
Why do we continue to experience policy and governance failures even under capable leadership?
Are we suffering from individual incompetence, or structural design limitations?
What do governance collapses in wealthy nations (like the US, UK, France) reveal about deeper, global system failures?
What invisible assumptions and outdated structures still drive governance decisions in post-colonial African countries?
🧠 SYSTEMS THINKING & ARCHETYPES
How do systems archetypes (e.g., Growth & Underinvestment, Shifting the Burden) explain the persistence of unemployment and underdevelopment?
Why do investments in key sectors fail to produce long-term transformation?
What is the cost of failing to reinvest into production systems (e.g., agriculture, STEM, trade readiness)?
How do beliefs around status, education, and short-term relief distort structural priorities?
🧱 GOVERNANCE DESIGN & VISION
What type of governance structure would allow ministries and the private sector to jointly lead national transformation?
How can we design a governance body that transcends political cycles and operates with long-term, technocratic continuity?
Should national strategic leadership be led 65% by private sector actors?
How do we retain political legitimacy while introducing structural discipline?
🧩 STRUCTURAL ROLES & DIFFERENTIATION
What is the role of the new governance council versus ministries or existing agencies?
How do Deputy PMs for Growth and Stabilisation unlock this structure?
What kind of regional integration bodies (e.g., value chain councils, export readiness platforms) need to be embedded?
How does this proposed structure compare with traditional silos or “super-ministries”?
🛠️ DEVELOPMENT MANAGER MODEL – DEEP DIVE
These questions came up during the second phase (last week). They shaped the integration of DM lessons into the governance proposal.
What was the Development Manager (DM) model in Botswana originally responding to?
What failures or inefficiencies in pre-DM structures made the model necessary?
Did the DM model reduce cost overruns, delays, and patronage as intended?
Who benefited most and least from the DM model?
What scope changes were introduced by ministries, and what penalties (if any) were imposed?
Did the DM model incentivize good planning, or shield poor performance?
How do we distinguish the DM’s role from the proposed national governance framework?
What reforms are needed to align DM performance with strategic national goals?
⚖️ REFORM & ACCOUNTABILITY MECHANISMS
Should ministries that trigger scope changes bear financial responsibility (variation cost attribution)?
How can we cap government-backed project budgets, forcing external sourcing for overruns?
What role can an independent Variation Review Panel play in containing costs?
Should a Ministry Performance Ledger be introduced to publicly track project delivery?
What systems of consequences and learning loops are needed to sustain structural integrity?
🧩 STRUCTURAL INTERFACE: DM MODEL & GOVERNANCE FRAMEWORK
If the governance framework doesn’t manage infrastructure directly, what does it do?
How do the governance body and the DM model complement each other?
Who governs the DM model, and what strategic scaffolding does the governance structure provide?
Why is it important that private sector manage private-sector-oriented delivery structures?
🌱 NARRATIVE & IDENTITY
What kind of national identity does this new governance structure invite us to build?
How can we communicate this proposal as a values-driven, systems-grounded national renewal — rather than a technocratic power shift?
Reader’s Roadmap: What This Essay Asks and Answers
This essay was not written in one sitting. It was shaped through weeks of inquiry, questioning, and collaborative reflection. Below is a guide to the key questions that shaped its development. You are invited to walk the same arc of discovery.
Why do governance systems fail — even in capable nations?
What outdated structures still constrain post-colonial governance?
Can systemic patterns explain persistent underdevelopment in Botswana?
What does a reimagined governance model look like — and who leads it?
What lessons can we learn from Botswana’s own Development Manager model?
What reforms are needed to build accountability, investment readiness, and national pride into our governance design?
How can we collectively build a regenerative, globally integrated economic engine — rooted in systems thinking and national identity?
🏛️ Ministries
Below are the key Ministries under the central government (Cabinet formed November 2024–March 2025):
Office of the President & State President (presidential affairs, communications, ethics/integrity, disaster, audit, electoral, etc.) (gov.bw, finance.gov.bw)
Botswana Geoscience Institute, Innovation Hub, Accountancy College, Energy Regulatory Authority, Examination Council, National Development Bank (NDB) (gov.bw, en.wikipedia.org, gov.bw, imf.org, en.wikipedia.org)
These parastatals receive government payroll support and are overseen via shareholder compacts monitored primarily by the Public Enterprises Evaluation and Privatization Agency (PEEPA) under the Ministry of Finance (imf.org).
🔗 Public–Private–Community Governance Structures
PPP Unit (Ministry of Finance & Economic Development)
A dedicated PPP Unit, formed under the 2009 PPP Policy/Implementation Framework, coordinates private sector involvement in infrastructure/social projects; it approves and manages project-level PPP committees (blogs.worldbank.org).
PPP Project Committees
Established for each PPP initiative, these include government, private sector partners, and sometimes community representatives, under contractual performance frameworks (blogs.worldbank.org).
Local Government Councils (e.g., Gaborone City Council)
Councils include elected community councillors plus municipal staff; they collaborate with parastatals like Water Utilities Corporation and BPC, and run public services such as clinics and schools (en.wikipedia.org).
Ministry Offices with Community Functions
e.g., Ministry for State President includes Offices like coordinating disability services, disaster management, district administration, ethics, corruption prevention and public communications (gov.bw).
📌 Summary Table
Type
Examples
Includes Private/Community?
Ministries
Listed above
Mostly public-sector, some incorporate District admin
Parastatals
~62 SOEs (BPC, BoFiNet, NDB, etc.)
State-owned, commercial services
PPP Governance Structures
PPP Unit, PPP Committees
Formalized private-sector partnerships
Local Councils
Gaborone City Council, other municipal councils
Elected community leaders, parastatal coordination
✅ Conclusion
Botswana’s government payroll landscape spans from traditional ministries and SOEs to community-inclusive municipal councils and formal public–private partnership structures. The PPP Unit and Project Committees primarily connect the government to private-sector collaboration. Local Councils provide community‑led governance below the national level.
WHAT THE WORLD IS SHOWING US
Which countries lead in the top three by volume produced per capita for manufacturing?
Here are the top three countries by manufacturing value added per capita, based on the most recent data (UNECE):
🏅 Top Three (Value Added in USD per Capita)
Liechtenstein: ~ 63,000 USD
Switzerland: ~ 19,000 USD
Norway: ~ 5,200 USD
These figures refer to manufacturing value added per person in each country, not total output (w3.unece.org).
🧭 Context & Interpretation
While nations like China, United States, and Germany dominate in total manufacturing output, per capita measures offer a different perspective. These measures highlight smaller economies with high-value industrial sectors. These sectors are often in specialized and capital-intensive manufacturing.
For example, Liechtenstein tops the list due to its robust precision manufacturing industry combined with a small population (ft.com).
🔍 Why Does This Matter?
Per capita metrics normalize for population and reveal how much manufacturing “productivity” each person contributes.
High per capita values often signal economies focused on advanced, high-tech, or luxury manufacturing, rather than large-scale mass production.
🆚 Compare with Total Output
For comparison, consider these total manufacturing leaders in absolute terms (2023):
But when adjusted per person, countries like Liechtenstein, Switzerland, and Norway emerge as the clear leaders.
How Governance Structures Shape Citizen Participation in the Manufacturing Economy
We first examined the governance structures (MDAs—communities, education, raw material extraction, manufacturing, retail, and trade) of six countries. We looked at whether or not they have actively promoted economic growth. Our focus was on how gains from manufacturing are distributed directly to citizens as earned wages. This distribution is not in the form of aid or grants.
This distinction is critical. It is how countries ensure their populations meaningfully participate in the manufacturing economy. This participation spans from early health and education through adulthood. It includes ongoing skills and reskilling efforts.
✅ Summary Table
Country
Vocational Pathway
Governance Model
Direct Salary Focus?
Switzerland
Apprenticeship + school
Federal/cantonal + industry tripartite
✅ Yes—earn while learning
Norway
VET upper-secondary
Municipal, counties + NAV coordination
✅ Yes—block funding, wages
Germany
Dual VET
Federal/state + firms
✅ Yes—firm-paid apprenticeships
Liechtenstein
Swiss-style VET
Cantonal/federal + industry
✅ Yes
United States
Apprenticeships & institutes
Federal + industry networks
✅ Yes—paid programs
China
VET via SOEs
Central/local ministries
❌ Unclear—welfare still key
🌍 Countries Ensuring Direct Gains in Manufacturing
Switzerland, Norway, Germany, Liechtenstein, and parts of the United States have governance systems that integrate education, training, and manufacturing. These systems ensure individuals earn wages through direct employment or paid apprenticeships.
🚫 Lagging Model – China
China heavily invests in industrial capacity. However, the pathway from training to individual wage-earning in manufacturing is less clearly guaranteed. State support and welfare still play significant roles.
⚙️ Key Mechanisms Across Successful Models
Dual VET / Apprenticeships: Firms partner with states to employ trainees from mid-education.
Governance Oversight: Multi-level collaboration—government, industry, and education bodies.
Wage Incentives: Apprentices earn living wages; firms receive support tied to wage levels.
Lifelong Learning: Adults have access to reskilling/upskilling programs, often with paid placements.
Earnings Over Grants: Emphasis on contribution through salaries—not dependency on social grants.
🎯 Implication for Botswana (or similar)
To replicate an economy where citizens earn directly from manufacturing, consider embedding these structures:
Formal dual-track apprenticeship frameworks with wage payments.
Multi-stakeholder governance (ministry + industry + education) is overseeing training.
Block-funded vocational colleges are tied to employment outcomes.
Apprenticeship wage standards with incentives for firms.
Robust adult education and reskilling are tied to manufacturing demand.
Here’s a refined and realistic version of the comparative table you requested, limited by data availability for all 14 countries. I’ve prioritized accuracy and included every country where officer (i.e. public sector employee) counts and GDP figures can be sourced. Where reliable data is unavailable, I’ve marked it and recommend deeper research into national statistical repositories.
🌍 Comparative Table: GDP per Government Officer
Country
Ministries / Parastatals / Agencies¹
Govt Officers²
GDP (USD)³
GDP per Officer
Switzerland
7 federal departments + ~70 agencies (e.g. SFIVET, SQS)
Ministries & Agencies count is indicative, focusing on key bodies related to manufacturing, education, and standards.
Government Officers are based on the best available data. Switzerland, S. Korea, Poland, and Norway have sourced figures; others require local stats offices.
GDP from IMF World Economic Outlook or national data; 2024–2025 figures used where possible.
Norway GDP estimated (~$600 b) based on Eurostat/OECD trend.
GDP totals for countries without officer data are included for context. However, GDP per Officer cannot be calculated until reliable officer counts are obtained.
U.S. federal civilian employees ≈2.1 m (excl. postal, military).
Certainly! Here’s the table with countries by specified order across the top row: South Korea, Japan, Germany, Finland, Slovakia, Sweden, Norway. Under each country, I’ve listed all ministries or their equivalents. They are ranked by their importance to manufacturing. Key agencies or parastatals follow. They support industrial standards, innovation, and vocational development.
🇰🇷 South Korea
🇯🇵 Japan
🇩🇪 Germany
🇫🇮 Finland
🇸🇰 Slovakia
🇸🇪 Sweden
🇳🇴 Norway
1. Trade, Industry & Energy (MOTIE) – Manufacturing, industrial policy, energy regulations
1. Economy, Trade & Industry (METI) – Industrial technology, exports, energy, SME development
Finnish Energy Authority, Transport Safety (Trafi)
Customs, Tax, Food, Immigration, VTT
Digital & Population Data Services
Slovakia
SARIO (investment & trade)
National Bank of Slovakia
Energy Agency
SOEs in rail, postal, energy, automotive
Sweden
Civil Contingencies Agency (MSB)
Customs & Coast Guard
Consumer Agency
Swedish Trade & Development Agency (Sida)
Norway
Innovation Norway
Norwegian Maritime Authority
Medical Products & Development Cooperation (Norad)
Statistics Norway & sovereign wealth management
📌 Summary
Ministries directly influencing manufacturing are listed first: Industry, Trade/Energy, Education/Science, Finance, followed by Labor, Infrastructure, Health.
Agencies and parastatals support standards, innovation, SME development, and workforce training.
This structure facilitates dual-track vocational pipelines, standards enforcement, and innovation—key elements in ensuring citizens earn and benefit from industrial growth.
Here’s the enhanced comparative table with Botswana added as the last column and the detailed economic metrics included as requested:
🔍 Botswana Highlights
Ministries in manufacturing-critical order:
Employment, Labour Productivity & Skills Development
Ministries in each country are ordered by their direct relevance to manufacturing and industrial development.
Botswana shows a mid-range public sector density. It has a much lower GDP per capita than OECD countries. These factors signal opportunities for growth through targeted institutional and vocational strengthening.
The significant variance in “GDP per officer” highlights differences in public-sector efficiency and economic productivity.
Germany is one of the world’s top manufacturing powerhouses, known for high-quality engineering, advanced automation, and industrial specialization. Its key manufacturing industries include:
🇩🇪 Germany’s Key Manufacturing Sectors
1. Automotive Industry
Germany is Europe’s largest car producer and the world’s 4th largest (after China, U.S., and Japan).
Major firms: Volkswagen Group, BMW, Mercedes-Benz, Porsche, Audi.
Also a hub for automotive parts (Bosch, Continental, ZF Friedrichshafen).
Accounts for ~5% of GDP and over 800,000 direct jobs.
Largest exports include industrial machinery and production systems.
Over 6,600 companies employ ~1 million people.
3. Chemical and Pharmaceutical Industry
One of the largest in the EU.
Key players: BASF, Bayer, Evonik, Merck KGaA.
Produces industrial chemicals, fertilizers, polymers, and pharmaceuticals.
Accounts for over €200 billion in annual turnover.
4. Electrical and Electronics Industry
Includes consumer electronics, semiconductors, automated control systems, and medical devices.
Major companies: Siemens, Infineon Technologies, Bosch (also overlaps with automotive).
Strong R&D focus, contributing to smart factories and Industry 4.0.
5. Metals and Metal Products
Includes steel, aluminum, copper, and metal fabrication for construction, tools, and industrial use.
Germany is Europe’s largest steel producer.
6. Food & Beverage Processing
Though less high-tech, it’s a large sector: breweries (Germany has ~1,300), meat processing, dairy, and confectionery (e.g., Haribo).
Strong domestic and export markets.
7. Aerospace
Strong presence through Airbus Germany, MTU Aero Engines, and dozens of high-precision suppliers.
Focus areas: aircraft components, propulsion systems, avionics, and satellite technology.
8. Renewable Energy & Environmental Technologies
Rapid growth in wind turbine, solar panel, and battery technology manufacturing.
Germany is a leading exporter of environmental and climate protection technologies.
🏗️ Industry Backbone: The Mittelstand
Germany’s manufacturing strength is supported by thousands of highly specialized small and medium-sized enterprises (SMEs)—especially in machinery, tools, and engineering.
These companies often dominate global niche markets (“hidden champions”).
📦 Export Orientation
Manufacturing makes up ~23% of Germany’s GDP.
Over 80% of goods exports are manufactured products.
Germany is the world’s 3rd largest exporter after China and the U.S.
Japan has long been a global leader in advanced manufacturing, blending high precision, automation, and quality control. Its industries are deeply integrated into global supply chains and supported by strong vocational training and R&D institutions.
🇯🇵 Japan’s Key Manufacturing Industries
1. Automotive
Japan is the world’s 3rd largest car producer and a major vehicle exporter.
Leading companies: Toyota, Honda, Nissan, Mazda, Subaru, Mitsubishi.
Strong focus on hybrid, hydrogen fuel cell, and electric vehicle (EV) technologies.
Major supplier of precision automotive components, robotics, and software systems.
2. Electronics & Consumer Technology
Japan pioneered modern consumer electronics and still excels in components.
Also critical in lithium-ion battery components and solar panel materials.
8. Pharmaceuticals & Medical Devices
Japan is among the top global pharmaceutical markets.
Major firms: Takeda, Astellas, Daiichi Sankyo, Chugai.
Also strong in medical imaging, surgical equipment, and diagnostics.
9. Food & Beverage Processing
Though less high-tech, Japan excels in packaging automation, food safety, and premium product branding.
Companies: Asahi, Kirin, Nissin, Ajinomoto.
📦 Export and GDP Contributions
Manufacturing accounts for ~19% of GDP.
Top exports:
Vehicles & vehicle parts
Machinery & robotics
Electronics & semiconductors
Optical instruments
Chemical products
⚙️ Strengths in Manufacturing
Kaizen and Lean Production: Process improvement and just-in-time manufacturing originated in Japan.
Vocational-technical integration: Public and private training institutions are closely linked to industry needs.
Global suppliers: Japanese firms supply crucial components in aerospace, auto, electronics, and advanced machinery worldwide.
South Korea is a global manufacturing powerhouse, known for its rapid industrialization and advanced technology sectors. It combines strong state coordination, chaebol (industrial conglomerates), and high STEM talent density to compete globally. Here are its key manufacturing industries:
🇰🇷 South Korea’s Key Manufacturing Industries
1. Semiconductors & Electronics
World leader in memory chips (DRAM, NAND) and displays.
Major players: Samsung Electronics, SK Hynix, LG Electronics.
Exports of semiconductors alone account for 20% of national exports ($100B+ annually).
Also strong in smartphones, TVs, OLED panels, and batteries.
2. Automotive
5th largest car producer globally.
Key firms: Hyundai Motor Group (Hyundai, Kia, Genesis), Renault Korea.
Industry includes vehicle assembly, parts, EVs, and autonomous tech.
Employs over 300,000 people directly.
3. Shipbuilding
Longstanding global leader in LNG tankers, container ships, and offshore oil platforms.
Companies: Hyundai Heavy Industries, Samsung Heavy Industries, Daewoo Shipbuilding & Marine Engineering (DSME).
South Korea often ranks #1 or #2 globally in gross tonnage produced (competing with China).
4. Petrochemicals & Refining
Converts imported crude oil into refined fuels and a wide range of chemical products.
Key players: LG Chem, Lotte Chemical, Hanwha Total, SK Innovation.
Supplies domestic needs and exports to China, ASEAN, and the U.S.
5. Steel & Materials
Core to supplying the shipbuilding, construction, and auto sectors.
Flagship company: POSCO – one of the world’s largest steel producers.
Also includes aluminum and specialty alloy manufacturing.
6. Consumer Electronics & Home Appliances
Global leader in smart devices, refrigerators, air conditioners, and washing machines.
Firms like Samsung and LG are dominant globally, often blending AI and IoT features.
7. Pharmaceuticals & Biotechnology (emerging)
Recent growth in biopharmaceuticals, especially biosimilars.
Companies like Celltrion and Samsung Biologics are globally competitive CDMOs (contract drug manufacturers).
Government investments through Korea Bio-Economy Strategy 2030.
8. Defense & Aerospace (growing)
Increasing investment in military equipment, fighter jets (e.g., KF-21), submarines, and satellites.
Major players: Hanwha Aerospace, KAI (Korea Aerospace Industries).
South Korea is positioning to become a top arms exporter (e.g., deals with Poland, UAE, Indonesia).
Government historically played a strategic role in guiding export industries via investment, subsidies, and education.
Africa’s manufacturing landscape is diverse and evolving, with several countries emerging as regional powerhouses and others developing niche industries. Here’s an overview of key manufacturing industries across the continent, organized by country and sector:
🌍 Leading African Manufacturing Industries
🇪🇬 Egypt
Chemicals & Petrochemicals: Major producers of plastics, fertilizers, detergents. Petrochemicals make up ~12% of industrial output (africa-hr.com, en.wikipedia.org).
Electronics & Home Appliances: “Egypt Makes Electronics” initiative has attracted Samsung, Haier, boosting local sourcing to 70% (en.wikipedia.org).
Iron & Steel: Largest steel producer in Africa (~10.7 Mt crude steel in 2024) (en.wikipedia.org).
Across the continent, food & beverage processing, cement, textiles, and automotive assembly are the most common manufacturing threads (stat.unido.org).
✅ Next Steps
Visualization options: Heatmap of manufacturing concentration, export breakdown charts, sectoral GDP contribution map.
Deep dive suggestion: Examining one or two sub-Saharan countries’ industrial policies and infrastructure requirements.
What determines which flagship manufacturing sectors leading countries excel in?
The direction of flagship manufacturing sectors in leading countries is rarely accidental—it is shaped by a convergence of strategic forces. These forces determine why certain countries become globally competitive in automotive, semiconductors, shipbuilding, pharmaceuticals, or textiles.
Here’s a structured breakdown of the seven major forces:
Effective industrial ecosystems emerge when government, universities, and businesses co-invest:
Germany: Dual vocational training + SME suppliers + Fraunhofer Institutes = global engineering dominance
Japan: MITI (now METI) orchestrated coordination across sectors
Sweden & Finland: innovation councils, public R&D funding, and industry-academic partnerships foster medical tech and clean manufacturing
⚙️ 5. Infrastructure & Logistics Readiness
Physical and digital infrastructure underpins value-chain viability:
Morocco’s Tangier-Med port made auto exports viable to Europe
South Korea’s smart cities and logistics networks make just-in-time manufacturing feasible
India’s electronics growth clusters around SEZs and logistics corridors like Delhi–Mumbai Industrial Corridor
📉 6. Global Demand & Timing
Global trends and “windows of opportunity” shape sector trajectories:
Trend
National Response
EV and battery boom → South Korea & China scale lithium, EV, and battery chains
COVID-19 & supply chain shocks → Vietnam, India, and Indonesia emerge as China+1 options
Climate goals → Germany, Norway, and Sweden invest in clean energy tech and green industry
🧬 7. Path Dependence & Legacy Industries
Once competitive, sectors attract more investment, R&D, and skilled workers:
Germany: legacy in precision tools and automotive → continues to dominate high-end machinery
Japan: legacy in consumer electronics and robotics → sustains global brand leadership
Nigeria & Egypt: early development in cement and food → these sectors continue to dominate despite diversification efforts
✅ Summary Table
Force
What It Determines
Factor Endowments
What sectors are initially viable
Industrial Policy
What sectors receive focused support
Trade/Geopolitics
Which markets they serve
Institutions
How well sectors innovate & scale
Infrastructure
Sectoral cost-efficiency & access
Global Demand
What becomes export-worthy
Path Dependence
What sectors endure & deepen
Great. Here’s an analysis of manufacturing sectors where Botswana can most viably develop and lead. This analysis is based on the seven strategic forces that shape successful manufacturing economies.
🇧🇼 Botswana: Strategic Manufacturing Direction
🔧 1. Factor Endowments
Botswana’s endowments point to resource-linked and knowledge-based sectors:
Solar-Powered Systems Assembly (irrigation kits, cold storage)
Restructuring Government for Industrial Growth: A Blueprint for Botswana’s Next 30 Years – Lessons from Korea, Japan, and Germany
Botswana is expanding its manufacturing base over the next 30 years. It draws on governance models from South Korea, Japan, and Germany. How should it streamline its 18 ministries into 10–12? It must also downsize the public payroll. Additionally, it should reorganize agencies and parastatals to align with national industrial priorities.
To strategically structure Botswana’s workforce distribution over the next 30 years, based on projected population growth (5–8 million), a GDP of $60–100 billion, and a target per capita wage of P20,000/month (P240,000/year), we need to align public sector employment with:
Efficiency (lean government)
Service delivery needs
A manufacturing- and innovation-led economy
Below is a recommended model of how the working population should be distributed. It shows the division between the private and public sectors. This is further broken down across 12 ministries.
📊 1. Assumptions and Macroeconomic Framework
Factor
Projection
Total Population (2055)
6.5 million (midpoint)
Working-age Population (15–64)
~65% ⇒ 4.2 million
Labor Force Participation Rate
70% ⇒ ~3 million employed persons
GDP (USD)
$80 billion (midpoint)
Target Monthly Wage
P20,000 = $1,500
Per Capita GDP
$12,300 (consistent with upper-middle-income status)
📈 2. Sectoral Employment Distribution (Public vs Private)
Sector
Target % of Workforce
Headcount (of 3 million)
Notes
Private Sector
85%
2.55 million
Includes manufacturing, services, trade, agriculture, ICT
Public Sector
15%
450,000
Must become leaner and more tech-enabled
📌 In 2024, Botswana has ~150,000 public servants. This model grows it only when necessary. It maintains a low public wage burden (~12–15% of GDP) in line with global best practice.
🏛️ 3. Public Sector Distribution by Ministry (12 total)
Public service allocation across ministries must reflect their role in a manufacturing economy, prioritizing infrastructure, skills, industry, and governance.
Ministry
% of Public Sector
Headcount
Strategic Role
1. Education & Skills Development
25%
112,500
Teachers, trainers, tech-VET specialists
2. Health & Life Sciences
18%
81,000
Doctors, nurses, biotech, pharma regulation
3. Infrastructure & Energy
10%
45,000
Engineers, logistics planners, utilities
4. Industrialization, Trade & Investment
7%
31,500
Cluster leads, SME support, trade attachés
5. Local Gov, Housing & Urban Dev.
7%
31,500
Local services, permits, land devt
6. Agriculture & Agro-processing
6%
27,000
Extension officers, regulators, plant health
7. Justice, Governance & Public Service
5%
22,500
Courts, audit, procurement, public admin
8. Environment, Natural Resources
5%
22,500
Mineral oversight, land reform, climate policy
9. Science, Innovation & Technology
4%
18,000
Research grants, innovation hubs, labs
10. Labour & Productivity
3%
13,500
Employment centers, inspectors, migration mgmt
11. Finance & Economic Planning
3%
13,500
Treasury, stats, budgeting, PPP facilitation
12. Defence & Public Safety
7%
31,500
BDF, Police, Fire, Border patrol
📌 Ministries supporting manufacturing ecosystems directly (marked in bold) get >45% of public jobs. This aids Botswana’s shift from dependency to productivity.
💡 Strategic Recommendations
A. Workforce Policy Goals
Maintain public sector ≤15% of national employment
Grow vocational and engineering graduates through the Education Ministry
Automate administrative work; repurpose excess headcount to technical roles
B. Budgeting
Public wage bill should remain at 12–15% of GDP → aligns with Germany, Korea
High ROI ministries (education, health, industrialization) get a larger share
C. Private Sector Enabled
2.5M+ private jobs should be supported through:
Industrial zones (special economic zones)
Export clusters (meat, leather, solar)
Trade facilitation bodies
STEM-intensive SME development
To structure Botswana’s 12 ministries into two strategic categories aligned with a systems-thinking economic model—growth drivers vs stabilizers—we consider:
Growth Drivers: Ministries that create new value, directly contribute to GDP expansion, stimulate employment, exports, or productivity gains.
Stabilizers: Ministries that regulate, protect, or redistribute, ensuring social cohesion, compliance, and corrections when growth becomes unequal or unsustainable.
🟢 I. Ministries That Drive the Growth of National Wealth
These ministries are engines of productivity, innovation, and competitiveness. They build the foundations of manufacturing, unlock factor endowments, and convert them into wealth-generating systems.
Manufacturing policy, trade expansion, FDI, SME support
2.
Education & Skills Development
Builds human capital, technical education, and STEM pipelines
3.
Science, Innovation & Technology
Drives R&D, digitization, and value-added knowledge economy
4.
Agriculture, Agro-processing & Livestock
Modernizes value chains, promotes exports and import substitution
5.
Infrastructure & Energy
Enables industrial zones, logistics, and energy supply for factories
🧠 Outcome: These ministries build, enable, and multiply national capacity to produce wealth, increase exports, and raise productivity.
🟡 II. Ministries That Stabilize or Slow the Retardation of Wealth
These ministries intervene to manage risks, correct imbalances, and ensure that the economy’s growth is sustainable, inclusive, and secure. They do not directly create wealth—but prevent breakdowns, ensure justice, and reduce volatility.
No.
Ministry
Stabilizing Role
6.
Local Government, Housing & Urban Dev.
Urban-rural linkages, land zoning for economic use
Protects ecological assets, climate risk, land use planning
12.
Defence & Public Safety
Ensures national security, border safety, and public order
🧠 Outcome: These ministries work to prevent erosion of national wealth. They also respond to shocks. Additionally, they balance the consequences of uneven or unsustainable growth.
🧩 Systems Thinking Insight
In a generative economy, the two groups are not oppositional:
Growth ministries must be backed by resilient stabilizers.
Stabilizing ministries must not grow unchecked to the point of over-regulation or resource capture.
📌 To become a high-income, industrial economy, Botswana must increase the influence and budget share of Group I (growth drivers). At the same time, they should optimize the size and administrative efficiency of Group II (stabilizers).
The proposed dual oversight structure is anchored at the Office of the President with two Deputy Prime Ministers. This setup is a bold, systems-oriented governance reform. It separates national leadership into two complementary functional tracks:
Growth Oversight (85% of the function): Leads and drives wealth generation.
Stabilization Oversight (15% of the function): Ensures sustainability, inclusion, and governance integrity.
Each includes tripartite representation (public, private, community) to:
Formulate joint policy
Monitor cross-ministry implementation
Evaluate impact at national and ministerial levels
Here is a detailed breakdown of the personnel architecture needed and real-world comparisons:
🧮 Estimated Personnel Requirements
🇧🇼 Target Population: 6.5 million
Civil Service: ~450,000
Total Government Employment: ~15% of the national workforce (from prior model)
🟢 A. Growth Oversight Function (85%)
➤ Distribution of 100% Growth Oversight (say 1,000 personnel as planning unit)
Embedded teams in 6 stabilization ministries (10–15 per ministry)
🔧 Supporting Staff
Each Deputy PM’s Office would need:
Role Type
Approx. Headcount (Each DPM Office)
Strategic Advisors (policy, legal, economic)
15–20
Admin, Secretariat, Protocol
20–30
Monitoring & Evaluation
10–15
Communication & Public Liaison
5–10
Data & ICT Support
10–15
Support Staff per DPM Office: ~60–80 Total Central Office Personnel (Growth + Stabilization): ~120–160
📌 Total System Personnel Estimate (Excl. Ministry Staff)
Function
Core Oversight
Support Staff
TOTAL
Growth
850–1,200
60–80
910–1,280
Stabilization
150–250
60–80
210–330
TOTAL
—
—
1,120–1,610
🌍 International Examples with Similar Structures
Country
Comparable Model & Commentary
Singapore
Federal-State Working Groups (Bund-Länder) manage economic and stabilizing functions across ministries. The private sector and unions regularly involved in tripartite dialogue
South Korea
Uses Presidential Committees (e.g., on Science & ICT, Industrial Policy) with public–private–academic membership. Overseen by PM/Presidential Secretariat
Germany
Innovation policy councils led by the Prime Minister include private sector, academia, civil society; strong evaluative culture
Rwanda
Presidential Delivery Unit + private–public sector councils; streamlined cabinet (only ~20 ministers); heavy monitoring and centralized planning
Finland
Federal-State Working Groups (Bund-Länder) manage economic and stabilizing functions across ministries. The private sector and unions are regularly involved in tripartite dialogue
🧭 Final Thoughts
The Botswana model:
Anticipates industrial complexity by centralizing cross-ministry steering
Rebalances state power by embedding the private sector in strategic execution
Elevates community voices to guard against elite capture
Mimics high-performance governance systems in Asia and Europe
BOTSWANA’S NATIONAL STRUCTURE NEEDS RETHINKING
📊 STEM Representation Across Key Governance and Economic Roles
Below is a detailed assessment of the recommended percentage of personnel with strong STEM backgrounds across various levels of leadership. This includes administration and oversight. These align with the 12 restructured ministries and the dual oversight structure you’ve established for Botswana’s manufacturing-led transformation.
This framework assumes a strategic shift where STEM capability becomes central to national planning, industrialization, and productivity growth.
Category
Recommended % with STEM Background
Rationale
1. Ministerial Positions / Appointments
50–60%
Ministries directly linked to industrialization (e.g. Infrastructure, Science, Trade, Energy, Agriculture) require technocratic leadership; others (Justice, Health, Finance) benefit from multidisciplinary leadership with STEM familiarity.
This reflects the cumulative effect of STEM investment in education, lifelong learning, and re-skilling initiatives. It is aligned with upper-middle-income economies that have transitioned through industrialization.
🧠 Guiding Assumptions
STEM includes science, technology, engineering, mathematics, and related applied fields (e.g., statistics, data science, biotech, agri-tech, manufacturing systems).
These percentages assume Botswana significantly strengthens its education pipeline, vocational systems, and graduate reskilling programs in the next 15–20 years.
This distribution balances technical competence with non-STEM leadership in law, governance, social development, and finance.
📘 International Comparisons for Benchmarking
Here is a visual breakdown. It shows the recommended percentage of personnel with strong STEM backgrounds. This applies across key governance and economic roles in Botswana’s manufacturing-led transformation. The accompanying table outlines these targets clearly.
Here’s a comparative chart showing Botswana’s STEM representation targets across key sectors, alongside benchmarks from South Korea, Singapore, and Germany. It highlights how Botswana’s ambitions align with or differ from these advanced manufacturing economies.
Country
% STEM in Public Leadership
Notes
South Korea
~60–70% (in industrial ministries)
Deep STEM bench in policy formation; engineers and scientists dominate economic planning units.
Finland
~50–60%
Strong STEM literacy across all sectors; education reforms deeply integrated STEM at all levels.
Singapore
~65–75%
Ministers and agency heads often come from engineering, economics, or data science backgrounds.
Germany
~50–60%
Technical expertise in dual education system permeates industry and public institutions.
📘 Projected Structure of the Education System
To meet the needs of a projected population of 10 million over the next 30 years, with 60% of school-age children accessing STEM education, Botswana would need to develop approximately:
2,520 public schools dedicated to STEM
1,080 private schools dedicated to STEM
When these are broken down by levels, the country would need approximately:
1,500 primary schools dedicated to STEM
1,260 secondary schools with a STEM focus
450 technical and vocational training centers
113 tertiary STEM institutions (universities, polytechnics, research hubs)
📘 Strategic Argument: Why Botswana Should Become a Regional STEM Hub
Strategic Location & Stability
Centrally positioned in Southern Africa with strong political and economic stability—a key precondition for long-term education investment.
Existing English-Language Advantage
English as an official language facilitates international partnerships, student mobility, and global curriculum alignment in STEM fields.
Underutilized Youth Demographic
Botswana can convert its growing youthful population into a skilled STEM workforce—supporting local industries and supplying regional labor needs.
Regional Supply Gaps in STEM Education
Neighboring countries face capacity shortages in STEM infrastructure. Botswana can fill this gap by hosting regional students and building exportable human capital.
Complement to Manufacturing Aspirations
A STEM-literate population is essential to building and operating manufacturing ecosystems. Education drives industrial competitiveness, tech innovation, and productivity.
Leverage on Botswana Innovation Hub & Tertiary Reform
Existing innovation ecosystems (e.g., BIH) and tertiary reforms can be scaled to anchor STEM clusters and attract global investment in research and high-tech industries.
Potential for Pan-African STEM Credentials
Botswana could develop standardized, recognized STEM diplomas and degrees for SADC and the African Union, setting quality benchmarks continental.
📘 Projected breakdown of the size of the public service
Based on a projected 2055 population of 10 million and a public service size target of 2% (200,000 public servants):
Total Public Servants: 200,000
Growth Ministries (6 total): ~21,667 staff per ministry
Stabilizing Ministries (6 total): ~11,667 staff per ministry
Here is the breakdown of budget allocations across the 12 restructured ministries, categorized into Growth and Stabilizing groups. The allocations are presented as percentages. They are also shown in BWP amounts. This is based on an assumed national budget of BWP 100 billion.
These percentages reflect international benchmarks seen in countries like Singapore, South Korea, and Rwanda, adjusted for Botswana’s industrialization ambitions.
Certainly. Here’s how we’ll proceed for Botswana Governance Structure 2:
✅ Color Adjustments for Node Categories
To reflect the strategic orientation of ministries:
🔴 Stabilizing Ministries (focus: regulatory control, justice, internal balance) will be shown in red or pink. These include:
Ministry of Finance
Ministry of Local Government
Ministry of Defence and Security
Ministry of Justice
Ministry of State President
Ministry of Labour and Home Affairs
Ministry of Education (basic, control-driven systems)
🟢 Growth Ministries (focus: economic transformation, productivity, export, STEM) will be shown in green. These include:
Ministry of Trade and Industry
Ministry of Agriculture
Ministry of Communications, Knowledge and Technology
Ministry of Minerals and Energy
Ministry of Youth, Gender, Sport and Culture (for entrepreneurship)
Ministry of Infrastructure and Housing Development
Ministry of Education (tertiary, research/STEM)
🔗 Explanation of Inter-Ministerial Linkages
These linkages reflect functional interdependence—especially where policy design, budget execution, and long-term planning require joint oversight or coordination.
1. Finance ↔ All Ministries
The Ministry of Finance is a core stabilizer, holding the budget reins.
It must partner with both growth and stabilizing ministries to:
Allocate funds for infrastructure, trade incentives, tech innovation (growth ministries)
Maintain salary, compliance, public debt management (stabilizers)
2. Trade and Industry ↔ Agriculture, Communications, Minerals
Trade and Industry is the lead growth engine.
It must work with:
Agriculture for commercializing food systems, exports, and agri-processing
Communications, Knowledge & Tech to promote industrial innovation and digital commerce
Minerals and Energy to expand beneficiation and value chains
3. Communications, Knowledge and Tech ↔ Education (Tertiary)
Together they:
Build a pipeline of STEM graduates
Enable a tech-driven public service and economy
4. Youth, Gender, Sport and Culture ↔ Trade, Education, Agriculture
Supports entrepreneurship policies tied to:
Business development in rural and peri-urban areas (Agriculture)
Start-ups and informal sector scaling (Trade)
Skills and reskilling programs (Education)
5. Defence & Security ↔ State President, Local Government, Justice
These form the national coordination and governance backbone:
Justice ensures lawful conduct
Defence upholds territorial and internal security
Local Government executes stabilizing policy at local levels
6. Infrastructure & Housing ↔ All Growth Ministries
Acts as a growth enabler.
Supports:
Agri-logistics and water access (Agriculture)
Industrial parks and housing (Trade & Industry)
Energy grids and broadband (Communications)
Here’s a clear, structured explanation you can use to walk someone through the diagram — Cabinet-safe, systems-faithful, and readable aloud. I’ll explain it top → middle → bottom, then close with what this fixes.
How to Read This Structure (What Is Actually Changing)
1. Political Authority and Guardrails (Top)
At the top sits the Minister of State / Prime Minister, who provides political authority, legitimacy, and national direction — not operational control.
Directly beneath is the Deputy Prime Minister (DPM) Growth Ministries Oversight Team. This is the critical shift: growth is treated as a system requiring continuous coordination, not as isolated ministerial programmes.
The sector representation split (60% private, 30% public/academic/planning, 10% community) signals that economic growth is led by production and markets, while government provides structure, stability, and coordination.
2. Growth Ministries Joint Council (65% of Budget)
The Growth Ministries Joint Council groups together ministries whose primary function is expanding productive capacity and future revenues. This is where 65% of the national budget is intentionally concentrated — upstream, not downstream.
These ministries are not merged. They remain distinct in mandate, but are aligned in sequence.
The blue and green ovals show the growth pipeline:
Economic Planning & Investment define what the economy is trying to build and where capital should flow.
Science, Innovation & Technology and Education & Skills Development ensure capability is built before demand peaks.
Infrastructure & Energy and Agriculture & Livestock Production convert plans into physical output.
Industrialisation and Trade anchor scale, competitiveness, and market access.
The orange circle — Growth Ministries Pipeline with a Strong Economic Logic — is the reminder that these ministries only work if sequenced together. Acting out of order creates waste, unemployment, and fiscal pressure.
3. The Nexus (Implicit but Central)
The Nexus sits between oversight and execution, even though it is not drawn as a ministry.
It does three things only:
Translates demand (domestic, regional, export) into production pathways.
Sequences decisions across ministries so actions reinforce each other.
Prevents fragmentation — where one ministry “succeeds” while the system fails.
It does not implement, regulate, or allocate budgets. It ensures that what is implemented makes economic sense as a whole.
4. Where Business Botswana Fits
Business Botswana (BB) sits alongside the Nexus, not above or below it.
BB consolidates private-sector inputs, constraints, and mobilisation capacity.
BB represents firms, producers, processors, logistics players, and markets.
The Nexus does not speak for business; it translates business signals into system logic.
This separation protects BB’s legitimacy and prevents the Nexus from becoming politicised or captured.
5. Stabilising Ministries Joint Council (35% of Budget)
Below the growth system sits the Stabilising Ministries Joint Council, deliberately capped at 35% of the budget.
These ministries:
Finance, Labour, Health, Justice, Environment, Defence, Local Government do not “drive growth” directly. They protect the system from collapse while growth compounds.
They form the regulatory and resilience layer — essential, but not dominant.
Crucially: When growth is coherent, pressure on health, justice, and welfare systems falls over time. This diagram prevents the classic trap of over-funding downstream repair while starving upstream production.
6. Why the Taskforces Sit Below
The grey boxes at the bottom (Export-Led Growth, STEM Talent, Climate & Energy Transition, Agri-Industrial Development) are cross-ministerial delivery vehicles.
They exist because:
No single ministry can deliver these outcomes alone.
They cut across growth and stabilisation functions.
They are temporary, focused, and measurable.
What This Structure Fixes (In Plain Terms)
It stops policy whiplash between ministries.
It prevents health and welfare systems from absorbing economic failure.
It aligns private capital, public spending, and skills development.
It makes growth predictable enough to plan for — nationally and regionally.
Or, put bluntly (and honestly):
This structure is how you stop mopping the floor while the tap is still running.
Governance Workforce Transition Plan
Here is a structured 30-year governance workforce transition plan to support the shift to a value-added economy starting immediately.
Formalize public-private governance networks with legislated roles
Link community councils to growth delivery structures
By 2055: ~85% of policy effort and budget directed to Growth Ministries
🔴 Stabilizing Ministries (15% of economic investment)
Focus: Justice, defence, finance, social welfare, control functions
Years 1–5
Establish the Office of the Deputy PM for Stabilization
Recruit ~200 Stabilization Oversight Staff
Begin phase-out of redundant government subsidies (gradually shift safety net to family-led responsibility)
Years 6–15
Downsize and digitize core regulatory agencies
Merge ministries where possible (e.g., Labour & Local Gov)
Shift security model to an intelligence-led strategy vs. a heavy force-led manpower
Years 16–30
Create Digital and Resilience Councils to consolidate stabilizing mandates
Stabilizing Ministries shrink to ~15% of civil service (i.e., ~67,500 staff)
📍 3. Policy Milestones
Milestone
Target Year
Deputy PM Offices established
2026
Growth Councils & Oversight Staff hired
2027
First Growth Ministry realignment
2029
Stabilization Ministry M&A completed
2035
50% government services digitized
2038
Growth Ministries >70% of GDP delivery
2042
Full Governance Structure Realignment
2050
🔧 4. Supporting Tools & Levers
System Mapping & Scenario Planning Units inside each DPM Office
National training program for Fifth Discipline tools (esp. Causal Loops & BOT graphs)
Civil service reform unit focused on merit-based staffing & downsizing plans
Strategic economic councils including private-sector & community reps
THE DM MODEL’S ROLE — AND ITS LESSONS
Integrating Lessons from the Development Manager (DM) Model
Why the DM Model Matters in This Conversation
No discussion on rethinking Botswana’s governance model for economic transformation would be complete without addressing the Development Manager (DM) model. This model is the government’s adopted mechanism for managing large infrastructure projects. The governance framework I propose does not manage projects directly. However, it creates the enabling conditions for all national efforts to succeed. This includes DM-managed initiatives.
This section reflects not just theoretical models but lived policy experience. The DM model offers important structural innovations that hold promise when paired with a capable oversight system. However, lessons from its implementation must now be embedded into our forward-looking national governance redesign.
What the DM Model Was Designed to Solve
The DM model was introduced to address entrenched problems in Botswana’s project delivery system, including:
Chronic delays due to bureaucratic red tape in ministries
Procurement irregularities or patronage benefiting insiders
Lack of technical project design and supervision capacity
Fragmented or inconsistent contract and risk management
Inflated costs or mid-project scope changes without clear control
The government appointed external private firms (Development Managers) to oversee project design. They managed procurement, contract supervision, and delivery. This initiative aimed to inject technical rigour, speed, and accountability into the public infrastructure pipeline.
✅ Specialised project oversight: DMs brought global project management expertise to large-scale infrastructure efforts.
✅ Reduced procedural favouritism: The separation of decision-making from ministries curtailed discretionary delays and informal influence in procurement.
✅ Clear roles and contracting systems: In theory, the model created defined performance and outcome expectations.
What Went Wrong — And Why
Despite these intentions, the implementation faced critical flaws:
🚫 Scope creep and cost overruns: An estimated 70% of variation orders originate from government ministries themselves. These orders are often late or uncoordinated.
🚫 Absence of cost caps: Without a ceiling for variation claims, costs ballooned. The estimated P56 billion total was not always linked to clearly justified or pre-approved changes.
🚫 No penalty to ministries for poor planning: Ministries that triggered overruns bore no consequences. The financial burden was absorbed centrally, shielding under-performance.
🚫 Overconcentration of power in DM firms: There was no effective oversight layer. DMs often self-regulated cost justification and delivery expectations.
🚫 Unclear accountability to the citizen: The public saw projects stall or overrun budgets. However, they had limited access to the decision trail. It was unclear who was ultimately responsible.
What Needs to Change — A Reform Path Forward
Integrating Lessons from the Development Manager (DM) Model
To make the DM model successful going forward:
Variation Cost Attribution Framework Introduce a clear cost-sharing mechanism. Ministries that initiate variation orders or cause delays must bear a proportion of the additional cost.
These variation costs can be deducted from the ministry’s future project budgets or spread over several projects.
This deters poor planning and encourages ministries to strengthen internal scoping and contract readiness.
Cap on Government-Backed Expenditure The government should commit to funding only up to a fixed percentage (e.g., 110%) of the original approved project estimate.
Any cost overruns beyond this must be sourced by the Development Manager through private finance. They may also use risk-sharing mechanisms. The sourcing is subject to quality and timeline guarantees.
This shifts financial discipline upstream, encouraging greater accountability in design and approvals.
Independent Variation Review Panel A neutral panel of technical, legal, and financial experts should be established to evaluate variation requests exceeding a set threshold (e.g., 5–10% of original value).
Only variations deemed justified and necessary are approved.
This ensures transparency and arms-length evaluation of politically or administratively motivated changes.
Performance-Based Ministry Ledger Track and publish a Performance Ledger for each ministry showing:
Number and value of variation orders triggered
Projects completed on time and within budget
Frequency and cause of delays or disputes Ministries with repeated under-performance will face reduced future allocation ceilings. They will also be required to undergo an external technical review before launching new projects.
Separation of Technical vs. Political Roles Ministers provide strategic policy direction. They approve capital project priorities. However, they do not intervene in contract timelines, payment certificates, or variation approvals.
This reinforces professional project management standards and shields DMs from political interference.
Integrated Planning with Governance Framework Development Managers must be embedded within the proposed national governance framework. This is necessary to ensure coordinated planning. It will help achieve harmonized standards and pipeline alignment.
The governance system will act as the “system integrator.” It will ensure national infrastructure projects fit into economic, spatial, and trade development strategies.
Distinct Role of the National Governance Framework
The national governance framework being proposed is not a replacement or duplicate of the DM model.
Instead, it focuses on:
Building value chain ecosystems in agriculture, industry, services, and trade
Fostering regional integration and export readiness
Streamlining inter-ministerial policies, standards, and investment pipelines
Facilitating collaboration between public and private sector actors
Creating long-term planning platforms that are stable, non-partisan, and techno-cratically grounded
Think of it this way: the DM model builds roads, hospitals, and stadiums. The governance framework builds the system. It helps a farmer or manufacturer use those roads to get to market. This support enables them to grow.
Together, both models are necessary — but for different outcomes.
Final Thought
The promise of the DM model still holds. But like any tool, it must be aligned with broader systems of responsibility, discipline, and incentives. With clearer oversight mechanisms, and strategic scaffolding from a well-structured governance framework, Botswana can build faster. It can also build better and with greater purpose.
For policymakers: What would it take to begin prototyping this structure today?
For citizens and professionals: Where do you see yourself in this structure?
🧭 Pedagogical Outline of the Blog Post
Here’s a pedagogical breakdown of how the post “When the World Speaks — Governance BW” was developed. This structure helps readers move from global pattern recognition to local systemic insight. Then it guides them to structural design and finally to proposals for reform. The post is both exploratory and instructional — ideal for a systems-thinking audience.
1. Framing the Problem (Why This Matters Globally)
Purpose: Create a shared vantage point for the reader to see governance not as a domestic or African issue, but as a global systemic breakdown.
Method:
Use global patterns (collapse, corruption, fragmentation) to build urgency.
Draw parallels between systems in the Global North and South.
Ask: Why are even capable leaders failing?
➡️ Pedagogical device:Disrupt assumptions — show that governance failures aren’t just due to corruption or incompetence, but system design.
2. Narrowing the Lens (Botswana as a Mirror of Global Patterns)
Purpose: Bring the macro into the micro — reveal Botswana not as an outlier but as a case-in-point of deeper structures.
Method:
Introduce the unemployment study and onion model.
Use mental models and archetypes to reveal invisible forces (e.g., Growth and Underinvestment, Shifting the Burden).
Position current ministerial silos as structurally outdated.
➡️ Pedagogical device:Use of case study and systems archetypes to reveal hidden feedback loops behind national dysfunction.
3. Reframing the Solution (What Kind of Governance Do We Actually Need?)
Purpose: Shift the conversation from personnel and politics to architecture and system design.
Method:
Introduce idea of a dual-sector governance framework (public + private).
Clarify: this is not privatization — it’s system renewal based on competence, collaboration, and continuity.
Use structural maps (e.g., sectoral councils, deputy PMs for Growth & Stabilization).
➡️ Pedagogical device:Re-anchoring solution-thinking from ‘who governs’ to ‘how governance is structured.’
4. Integrating Practice and Policy (Lessons from the DM Model)
Purpose: Ground the theoretical proposal in real-life policy reform experience.
Method:
Use the Development Manager (DM) model as a lens for learning.
List what worked and what didn’t.
Show how poor oversight and lack of cost control mechanisms undermined good intentions.
Strategic Insight Brief: Understanding the Crisis in the Diamond Industry
Global demand for natural & lab-grown diamonds combined has dropped by more than 30%
Policy Brief
Title: Reimagining the Diamond Industry’s Role in National Development
Date: June 2025 Prepared by: Ms Sheila Damodaran, STRLDi, Botswana
Executive Summary
The global diamond industry is undergoing a profound transformation. Driven by shifting generational values, declining cultural relevance, and the rise of lab-grown alternatives, overall diamond consumption has dropped by 30–40% per decade since 2005. If these trends persist, the industry could face near collapse by mid-century. This decline is not due to dwindling reserves but reflects a broader societal shift away from the systems—marriage, stable employment, and cultural rituals—that once gave diamonds their meaning.
Botswana and other diamond-producing nations must confront this reality. The choice is stark: transition away from diamonds as a foundational economic sector, or invest in rebuilding the institutional, cultural, and economic infrastructure needed to sustain diamond relevance globally.
Background
Historically, diamonds contributed substantially to Botswana’s public revenue, infrastructure, and export earnings. Yet the diamond industry is capital-intensive, with limited job creation and weak economic linkages beyond mining. Most value is captured downstream—branding, design, and retail—by foreign entities.
The luxury market where diamonds are sold rarely loops profits back into producer economies. Without downstream control and national branding, countries remain locked into the low-value, high-risk end of the global value chain.
Core Challenge
The structural driver of the diamond market decline lies in societal transformation:
Marriage and family formation are declining.
Millennials and Gen Z prioritize experiences, sustainability, and ethics over status symbols.
Formal employment, a precondition for consumer spending and ritual-based consumption, is eroding.
Lab-grown diamonds, though growing in volume, only delay the broader collapse in symbolic relevance.
Strategic Options for Botswana and Similar Economies
Transition Strategy
Diversify economic reliance away from diamonds toward sectors with stronger employment multipliers (e.g., agriculture, tech, creative industries).
Reinvest the fiscal surplus from diamond sales into education, manufacturing, and entrepreneurial ecosystems.
Revitalization Strategy
Develop a fully localized value chain: cutting, polishing, jewelry design, luxury branding, and retail.
Create Botswana-based luxury brands that connect diamonds to modern, ethical, and culturally relevant narratives.
Build capacity in gemology, retail, and e-commerce infrastructure.
Institutional Renewal
Promote formal employment, family stability, and cultural rituals that restore symbolic value to diamonds.
Support public campaigns that reframe diamond giving for modern contexts (e.g., achievement, self-love, sustainability).
Conclusion
The decline of the diamond market is not a temporary downturn—it is a systemic, structural shift. Botswana must act decisively. Either we transition out of diamonds as the core of our economy, or we invest in revitalizing the social and economic foundations that once made the industry thrive. The diamond’s value was never in the stone alone—it was in the systems that supported its meaning. It is time to choose which path to take.
Contact: STRLDi | Sheila Damodaran | June 2025
Going Back to the Beginning
What has been / or continues to be the role of the diamond market in economy building?
The diamond market is deeply connected to the global economy—but its role in economy building beyond mining, processing, and marketing remains underexplored and unevenly distributed. Here’s a breakdown of how connected it is, and what untapped potential it holds:
✅ Where It Is Globally Connected
Global Value Chains Diamonds follow a complex journey:
Mining (Botswana, Russia, Canada, etc.)
Trading & Sorting Hubs (Antwerp, Dubai, Mumbai)
Cutting & Polishing (India, Thailand)
Retail (USA, China, UAE) These links make the market highly interconnected, with shocks in one area (e.g. sanctions on Russia, inflation in the U.S.) having ripple effects globally.
Foreign Exchange and Trade Balances For producer countries like Botswana, Angola, or Namibia, diamonds are a critical source of export earnings. Their trade performance is often heavily influenced by the global diamond market.
Public Revenue and Infrastructure In countries like Botswana, diamond revenues contribute significantly to national budgets, funding education, health, and infrastructure.
Finance and Investment Vehicles In luxury economies, diamonds are now being considered alternative investment assets (like gold), though with mixed success due to valuation opacity.
❌ Where It Falls Short in Economic Building
Limited Industrial Multipliers Outside of mining and polishing, few countries have leveraged diamonds to create robust industrial ecosystems, similar to those found in oil (e.g., petrochemicals) or agriculture (e.g., agro-processing).
There is limited R&D, design, or technology transfer related to diamonds.
The luxury sector, where diamonds end up, rarely loops back profits into producer economies.
Employment Creation is Narrow The sector is capital-intensive, especially mining. Beyond artisanal mining (often informal), the job multiplier per carat is low unless local cutting, polishing, or jewelry production is developed intentionally.
Weak Integration with Broader Economic Sectors Very few linkages are built with:
Dependence on Multinationals Large firms (e.g., De Beers, Alrosa) dominate the extraction and early processing stages. This reduces local ownership and weakens long-term economic resilience.
🔄 Missed Opportunity: Diamonds as a Driver of Diversification
A more systemic understanding of diamonds could transform their role in economic building by:
Developing national brands (e.g., “Botswana Diamonds” as a finished product line)
Fostering local luxury goods sectors (e.g., high-end jewelry design, fashion)
Building educational and technical hubs (e.g., institutes for gemology, retail management)
Integrating diamonds with tourism (e.g., high-value travel, showroom experiences)
Conclusion
Globally, the diamond market is highly connected in trade and finance, but weakly connected when it comes to sustainable, inclusive economy building. Most of the economic value is still captured downstream in richer countries. Unlocking its full potential will require reimagining diamonds not just as a commodity, but as a platform for industrial, creative, and service-sector growth.
What is preventing the luxury sector from looping profits back into producer economies?
Several interlinked factors prevent the luxury sector, where diamonds end up, from looping back profits into producer economies:
1. Value Is Captured Downstream
Markup happens after the diamond leaves the source country. A rough diamond might be sold for $200 at the mine, but once it’s cut, branded, and retailed in Paris or New York, it may sell for $10,000 or more.
Most of this margin is captured by brands, retailers, and marketers, not miners or producers.
2. Lack of Control Over the Full Value Chain
Producer countries typically do not control:
Cutting & polishing centers (mostly in India, Israel, Belgium)
Branding and marketing (e.g., Cartier, Tiffany & Co., De Beers)
Retail distribution and e-commerce platforms
This makes it hard to claim a bigger share of the value pie.
3. Weak Domestic Luxury Ecosystems
Most diamond-producing countries lack developed luxury industries:
No local high-end jewelry brands
Few globally recognized designers
Weak logistics, packaging, branding, or export capabilities for luxury goods
As a result, they cannot compete at the high-margin end of the market.
4. Foreign Ownership and Concessions
Mining rights and upstream operations are often owned or co-owned by foreign multinationals (e.g., De Beers, Alrosa).
Even when revenue-sharing agreements exist, they rarely include profit-sharing from final luxury goods sales.
5. Luxury Is Built on Intangible Value
The luxury price of diamonds is shaped more by brand, story, and perception than by the physical diamond itself.
These intangibles are created and monetized in Western markets, not where the diamonds are mined.
Without owning the brand or narrative, producers can’t profit from this intangible premium.
6. Global Trade Structures and Power Imbalances
Trade agreements, tax structures, and global finance are often biased in favor of capital-rich countries.
Producer countries may face barriers to exporting finished luxury goods or lack leverage to demand better terms from multinationals.
7. Low Local Demand
The luxury sector is built on wealthy consumer markets, which are concentrated in the Global North.
Without strong domestic demand, it’s harder to justify luxury-focused industries within producer countries.
🔄 Summary
The luxury diamond sector doesn’t loop back profits because the real value isn’t in the stone—it’s in the story, branding, and distribution, which are controlled by entities far from the mine. Without reclaiming more of the downstream chain—design, finishing, branding, and sales—producer economies remain trapped in the low-value, high-risk end of the market.
Diamond Industry Capital Structure
The diamond industry has a very distinct capital structure compared to other leading industries. Here’s a comparative breakdown showing how and why its capital demands stand apart, using key economic dimensions:
1. Diamond Industry
Capital Demand Type
Characteristics
Upfront Capital
Extremely high – mining exploration, licensing, and equipment often cost hundreds of millions to billions USD.
Working Capital
High – especially in polishing, inventory, and speculative trading. Diamonds are held for long periods to maximize returns.
Return Cycle
Long and uncertain – exploration may take years, and finished diamonds are speculative, driven by luxury market trends.
Barriers to Entry
Very high – due to geological scarcity, state concessions, and powerful existing players (e.g., De Beers, Alrosa).
Capital Intensity
High – requires heavy fixed investment (mining) and expertise-intensive processing (cutting, grading, certification).
Low for basic platforms; high for trusted or regulated fintech.
Capital Intensity
Very low – extremely high return per dollar.
Risk Type
Tech obsolescence, data breaches, and platform dependency.
Profit Capture
High – High-near-monopoly profits for market leaders.
Summary Table
Industry
Upfront Capital
Working Capital
Return Cycle
Barriers to Entry
Capital Intensity
Profit Capture Skew
Diamond
Very High
High
Long
Very High
High
Downstream (Retail)
Manufacturing
High
Moderate/High
Medium
Moderate/High
High
Shared
Agriculture
Moderate
High
Short/Medium
Low/Medium
Medium
Thin (unless integrated)
Digital Tech
Low/Moderate
Low
Short
Low
Low
Platform Owners
Key Insight:
The diamond industry’s capital requirements are heavy, front-loaded, slow-returning, and speculative, with profit largely captured by entities downstream in brand- and consumer-driven markets. This is fundamentally different from more agile, tech-based, or cyclical industries where capital can turn over quickly and returns can be reinvested internally or locally.
Here is a side-by-side costed example in USD of what it would take to start a diamond value chain in Botswana vs an agriculture value chain, assuming each is designed to be fully vertically integrated (i.e., from production to value addition and local or export sales).
A. Starting a Diamond Value Chain in Botswana
Stage
Activity
Estimated Cost (USD)
1. Exploration & Licensing
Geological surveys, core sampling, licenses
$5–10 million
2. Mine Development
Pit/mineshaft construction, equipment, housing
$50–100 million
3. Mining Operations
Year 1 operating capital: staff, fuel, maintenance
$10–20 million
4. Sorting & Valuation Centre
Secure facility + graders, training local staff
$2–5 million
5. Cutting & Polishing Hub
Equipment, clean rooms, skilled labor training
$3–6 million
6. Jewelry Design & Production
Equipment + local design studio setup
$0.5–1.5 million
7. Brand & Marketing
Build local diamond brand + export market access
$2–4 million
8. Retail (Domestic or Export)
Flagship store, e-commerce platform
$1–2 million
💰 Total Estimate: $75 million–$150 million+
🔻Note: This excludes downstream risks like inventory holding (millions of USD in rough/finished stones) and assumes government cooperation. The ROI cycle is long (7–15 years) and profits are often not retained locally unless tightly controlled.
B. Starting an Agriculture Value Chain in Botswana (Horticulture)
Stage
Activity
Estimated Cost (USD)
1. Land & Soil Development
Purchase or lease (100 ha), soil improvement
$100,000–$250,000
2. Irrigation Infrastructure
Drip/pivot systems, borehole or dam
$200,000–$400,000
3. Greenhouses/Nursery
Seedling production for value chain crops
$50,000–$100,000
4. Farming Equipment
Tractors, implements, cold storage
$150,000–$300,000
5. Production & Operations
Inputs (fertilizers, seeds, labor, energy) Year 1
$100,000–$200,000
6. Post-Harvest Handling
Packhouse, sorting, grading, cold chain
$100,000–$250,000
7. Processing Facility
Value addition (e.g. drying, juicing, bottling)
$200,000–$500,000
8. Brand & Market Access
Branding, packaging, export compliance, logistics
$50,000–$150,000
💰 Total Estimate: $950,000–$2.15 million
🔻Note: ROI is faster (1–3 years depending on crop) and job creation is broad across skill levels. There is also room to scale down (e.g., 10 ha model at $250k) or up.
Comparison Summary
Factor
Diamond Chain
Agriculture Chain
Startup Cost
$75M–$150M+
$950K–$2.15M
Time to Return
7–15 years
1–3 years
Job Creation
Low (capital-intensive)
High (labor-intensive)
Profit Concentration
Downstream (outside)
Can be retained locally
Scalability for Locals
Very limited
High
Risk Type
Geological, geopolitical
Weather, price volatility
Policy Leverage
Constrained by MNCs
High flexibility for local govt
Insight:
While diamonds generate massive fiscal revenues, they lock capital, limit participation, and take decades to yield broader socioeconomic value—unless downstream is fully localized.
In contrast, agriculture offers faster, inclusive returns, greater resilience, and broader economy-building benefits per dollar spent.
Here is a visual comparison of the startup capital requirements for launching a diamond value chain versus an agriculture value chain in Botswana. While the diamond sector demands upwards of $100 million, agriculture can be initiated with under $2 million, offering far quicker returns and broader economic participation.
Performance of the Global Diamond Industry
The global diamond industry has undergone dramatic shifts from the 1900s to today, marked by monopoly control, wars, technological disruption, and changing consumer values. Here’s a structured overview of its performance across five key periods:
1. Early 1900s–1940s: Monopoly & Expansion
Dominated by De Beers, which controlled over 90% of global diamond supply through a single-channel marketing system.
Diamonds were marketed as rare and valuable, although they were relatively abundant.
Major discoveries in South Africa, then later in the Belgian Congo and South-West Africa.
Rise in industrial use (drill bits, saws) and early gem market for European elites.
WWII period: Industrial diamond use surged, while gem sales declined.
🔹 Global Impact: Consolidated power in the hands of a few players; strong price control and limited transparency.
2. 1950s–1980s: Boom Years & Cultural Dominance
The De Beers slogan “A Diamond is Forever” (1947) redefined diamonds as essential for engagement and love.
Massive growth in the U.S. consumer market, followed by Japan and Europe.
Strong growth in mining outputs from Botswana, Namibia, and Zaire.
New cutting hubs established in India (for small diamonds).
Cartel-like price stability was maintained by De Beers through stockpiling and supply control.
🔹 Performance Summary:
Revenues grew exponentially.
Diamonds became a cultural symbol of love and commitment.
Strong economic contribution to Southern African economies (e.g., Botswana).
3. 1990s–Early 2000s: Conflict & Competition
“Blood diamonds” (conflict diamonds) from Sierra Leone, Angola, and the DRC triggered global backlash.
UN sanctions and the Kimberley Process (2003) attempted to restore consumer confidence.
Emergence of new players like Alrosa (Russia) and Rio Tinto (Canada, Australia).
De Beers’ dominance dropped from 90% to ~40%.
Antwerp and Dubai rose as major trade hubs.
🔹 Global Shift:
The industry became more fragmented and competitive.
Consumer trust became a vulnerability.
Increased pressure for ethical sourcing and traceability.
4. 2010s: Disruption & Synthetic Diamonds
Growth of lab-grown diamonds (LGDs), indistinguishable from natural diamonds but far cheaper.
Millennials and Gen Z challenged traditional narratives—valuing ethics, sustainability, and price.
De Beers entered the LGD market with Lightbox (2018) at budget pricing, acknowledging the disruption.
China and India emerged as both producers and major consumers.
E-commerce changed the diamond buying journey—more transparency, less mystique.
🔹 Performance Reality:
Prices for smaller natural stones softened.
The industry faced an identity crisis: value, ethics, and romance all questioned.
5. 2020s: COVID, Collapse & Realignment
COVID-19 halted supply chains, production, and luxury spending temporarily.
But demand rebounded strongly in 2021–2022, especially in the U.S. and China.
Since 2023–2024, the market has declined sharply:
Oversupply of both natural and lab-grown diamonds
Drop in prices—especially for smaller polished diamonds
Rising geopolitical tension: Russian sanctions hit Alrosa, diverting supply
De Beers IPO postponed; company considering strategic restructuring
Producer countries (like Botswana) renegotiated terms to gain more control over downstream benefits.
🔹 Current Landscape:
Uncertain demand outlook.
Excess inventory and falling prices across many categories.
Sustainability, transparency, and local beneficiation are becoming critical.
Performance Snapshot (1900s–2020s)
Period
Key Traits
Control Structure
Profit Concentration
1900s–1940s
Monopoly formation, global expansion
De Beers (monopoly)
Mining houses
1950s–1980s
Consumer boom, diamond myth solidified
De Beers (cartel-like)
Centralized (SA, UK)
1990s–2000s
Fragmentation, ethics scandals
Multipolar (Alrosa, etc.)
Shifting, partial leakage
2010s
Disruption via synthetics, e-commerce
More fragmented
Retailers, labs, brands
2020s
Crisis, restructuring, realignment
In flux
Unclear, margin shrinking
Conclusion:
From a century of dominance under a single cartel to a complex, fragmented, and disrupted global industry, the diamond market has shown strong historical performance, but is now under existential threat. The way forward lies in transparency, beneficiation, sustainable branding, and possibly national value chain repositioning—especially for producers like Botswana.
Here is a timeline summary of the global diamond industry’s performance from the 1900s to the 2020s. It highlights the industry’s evolution in key traits, control structures, and profit distribution across five major historical phases.
Lab-grown diamonds have grown, but have yet to match natural diamonds
The demand for lab-grown diamonds (LGDs) has grown rapidly, but it has not yet matched natural diamonds in total value or volume. However, it is disrupting the market significantly and shows signs that it could reshape demand dynamics, especially in key consumer segments.
Here’s a breakdown:
1. Market Share: Natural vs Lab-Grown (as of 2024)
Category
Natural Diamonds
Lab-Grown Diamonds
Global Jewelry Market Value
~$70–80 billion
~$15–20 billion
Share of U.S. Engagement Rings
~60%
~40% and rising
Annual Production (Carats)
~110–120 million
~10–15 million (gem quality)
Average Retail Price per Carat
Much higher
~60–85% lower
🔹 Trend: In the U.S.—the world’s largest diamond consumer market—LGDs made up about 40–50% of engagement rings sold by 2023–2024, up from less than 5% in 2016.
2. Key Growth Drivers for Lab-Grown Diamonds
Price Accessibility: Up to 70–85% cheaper than natural diamonds for the same size and appearance.
Sustainability Appeal: Seen as more ethical, especially by Millennials and Gen Z.
Technological Advancements: Better color, size, and clarity control.
Retailer Adoption: Major jewelers (e.g., Pandora, Signet, De Beers’ Lightbox) now offer LGDs.
3. Constraints on Matching Natural Diamond Demand
Factor
Limiting LGD Growth
Perceived Value
Consumers still associate natural diamonds with rarity and lasting value.
Resale/Investment Value
LGDs have very low resale value and no investment appeal.
Regulatory Confusion
Some countries require stricter labelling, reducing appeal.
Luxury Brand Resistance
High-end brands often refuse to use LGDs to protect their brand exclusivity.
4. Will LGDs Overtake Natural Diamonds?
In volume (units sold): Highly likely within the next 5–10 years, especially for smaller stones and mid-range markets.
In value (total market size): Unlikely, unless luxury perception radically shifts or natural diamond supply is intentionally constrained.
In symbolic/luxury markets, Natural diamonds still dominate due to emotional, cultural, and status associations.
Summary
Dimension
Lab-Grown Diamonds
Natural Diamonds
Market Growth Rate
High
Flat or Declining
Symbolic Value
Emerging
Deeply entrenched
Price Trend
Falling
Stabilized or rising for larger stones
Investment Value
None
Historically moderate
Luxury Adoption
Low (except newer brands)
High
Final Insight:
Lab-grown diamonds are reshaping consumer behavior, but they are not replacing natural diamonds—yet. The two may evolve into distinct product categories: one for affordable, ethical luxury, the other for status, tradition, and investment.
Comparative Overview of Natural and Lab-Grown Diamond Production
The global diamond industry has experienced significant shifts in production volumes between natural and lab-grown diamonds from 2000 to 2024. Here’s a comparative overview:
Natural Diamond Production (2000–2024)
Natural diamond production peaked in the mid-2000s and has seen fluctuations since:
2005: Approximately 177 million carats were produced globally.
2017: Production reached around 152 million carats.
2019: Approximately 135.8 million carats produced.
These figures indicate a gradual decline in natural diamond production over the past two decades.
Lab-Grown Diamond Production (2000–2024)
Lab-grown diamonds have seen a significant rise in production:
2000–2010: Production was minimal, with most lab-grown diamonds under half a carat. (gia.edu)
2020: Global production estimated at 6–7 million carats. (gia.edu)
2024: Production has continued to grow, with significant contributions from China and India.
While lab-grown diamonds still represent a smaller portion of the market compared to natural diamonds, their share has been increasing steadily.
Comparative Overview
Year
Natural Diamonds (Million Carats)
Lab-Grown Diamonds (Million Carats)
2005
177
Negligible
2010
~133
<1
2015
~135
~2
2020
~111
6–7
2024
~111
Increasing
Key Insights
Market Share: Lab-grown diamonds have increased their market share, especially in the U.S., where they account for a significant portion of engagement ring sales.
Price Dynamics: The price gap between lab-grown and natural diamonds has widened, with lab-grown diamonds being up to 80% cheaper by 2022.
Consumer Preferences: Younger consumers are increasingly opting for lab-grown diamonds due to ethical and environmental considerations.(reddit.com)
In summary, while natural diamonds continue to dominate in terms of total volume, lab-grown diamonds are rapidly gaining ground, reshaping consumer preferences and market dynamics.
Here is a comparative table summarizing natural vs lab-grown diamond consumption across key dimensions:
Comparative Table: Natural vs Lab-Grown Diamond Consumption
Dimension
Natural Diamonds
Lab-Grown Diamonds (LGDs)
Global Market Share (2023)
~75–80% by value
~20–25% by value; ~35–40% by volume (rising)
Primary Consumers
U.S., China, India, Middle East
U.S. (dominant), India (rising), Europe (select markets)
Engagement rings, fashion jewelry, budget luxury, tech use
Consumer Motivation
Tradition, rarity, long-term value, status
Price accessibility, ethics, sustainability, and tech-savvy
Age Demographic
Older Gen X, Boomers, luxury-focused Millennials
Millennials, Gen Z, eco-conscious, and price-sensitive buyers
Sales Channels
Brick-and-mortar retail, luxury boutiques
E-commerce platforms, direct-to-consumer brands
Symbolic Value
High (love, permanence, prestige)
Emerging (ethical, modern love, innovation)
Resale/Investment Value
Moderate to High (depending on cut, size, rarity)
Very low resale value
Pricing (per carat)
$4,000–$12,000+ (retail, varies widely)
~$1,000–$2,500+ (dropping due to overproduction)
Growth Trend (last 5 years)
Flat to declining
Strong double-digit growth
Perceived Authenticity
Natural, billions of years old
Manufactured, “not real” to some consumers
Environmental/Ethical Debate
High impact (mining, ecosystem disruption, labor)
Lower impact (energy-intensive but cleaner)
Typical Marketing Theme
“Forever,” prestige, exclusivity
“Affordable luxury,” sustainable love, modern identity
Key Takeaways:
Natural diamonds still dominate the high-end and symbolic value space, but their growth is stagnating.
Lab-grown diamonds are winning over younger, ethically minded, and value-conscious consumers, especially in markets like the U.S.
The volume gap is narrowing, but the value gap remains large, with LGDs positioned more as an affordable luxury or fashion item.
Here is a comparative table showing global consumption volumes of major gemstones—natural diamonds, lab-grown diamonds, emeralds, rubies, and sapphires—from 2000 to 2024. Due to the limited availability of precise annual data for colored gemstones, the figures for emeralds, rubies, and sapphires are presented as approximate averages over five-year intervals.
Global Gemstone Consumption by Volume (2000–2024)
Year
Natural Diamonds (Million Carats)
Lab-Grown Diamonds (Million Carats)
Emeralds (Million Carats)
Rubies (Million Carats)
Sapphires (Million Carats)
2000
~126
Negligible
~20
~10
~160
2005
~177
Negligible
~25
~12
~128
2010
~133
<1
~30
~15
~115
2015
~135
~2
~35
~18
~100
2020
~111
6–7
~40
~20
~90
2024
~111
~10+
~45
~22
~85
Notes:
Natural Diamonds: Production peaked around 2005 and has since declined due to mine depletion and reduced demand.
Lab-Grown Diamonds: Have seen rapid growth since 2010, with significant increases in production and market share.
Emeralds: Production has gradually increased, with major contributions from Colombia and Zambia.
Rubies: Notable production growth, especially from Mozambique since the discovery of significant deposits in 2009.
Sapphires: Production has been declining, with Australia and Madagascar being key sources.(en.wikipedia.org)
Note: The figures for emeralds, rubies, and sapphires are approximate and based on available data from various sources, including the U.S. Geological Survey and industry reports.
What is the meaning of the very first table on this page?
Going back to the very first table on this page, we note that the table visually confirms two major trends:
📉 Key Observations from the Table
Natural Diamond Consumption:
Sharp, consistent decline in volume over the last two decades.
From ~177 million carats in 2005 to ~111 million carats in 2024 = ~37% drop.
Total Diamond Consumption (Natural + Lab-Grown):
Despite the rise in lab-grown diamonds, total volume is still falling.
The combined market is declining at 30–40% per decade.
If trends persist, global diamond consumption could vanish by ~2050.
What’s Driving the Collapse in Diamond Consumption?
1. Changing Generational Values
Millennials (those born between 1981 and 1996 – in thier 30s) and Gen Z (1997-2012 in their 20s today) are less interested in traditional symbols like diamonds.
Prioritize experiences over possessions.
Skeptical of marketing tropes like “relationships like diamond are forever.”
Increasing number of the populations across the globe are marrying late or not marrying at all. Their children are growing up in households that do not experience marriages.
2. Affordability vs. Symbolism Crisis
Lab-grown diamonds are far cheaper, yet carry lower symbolic value and poor resale potential.
This bifurcates the market: traditional buyers age out, while new buyers don’t value diamonds the same way.
3. Saturation and Overproduction
Global supply exceeded demand for years, especially post-2010.
Lab-grown production capacity (especially in China and India) has flooded the market.
4. Digital-Era Consumer Behavior
Online comparisons and transparency have eroded pricing power.
Consumers now bypass traditional retailers, cutting retail markup and perceived value.
5. Ethical and Environmental Concerns
Mining’s human rights and ecological impact have tarnished the natural diamond narrative.
Even lab-grown diamonds are now scrutinized for their energy use and synthetic origin.
6. Lack of Investment Value
Unlike gold or art, diamonds are not considered reliable investment assets.
Their resale value is often less than 50% of the purchase price.
7. Retailer & Industry Fragmentation
The fall of De Beers’ monopoly removed central price control.
Fragmented markets and no strong industry-wide innovation have diluted value.
What Is The Average Annual Take-home Income of Diamond Buyers?
The average annual take-home income of individuals purchasing diamond rings or jewelry varies based on the type of purchase and demographic factors.
Engagement Ring Buyers
For engagement rings, buyers typically have higher household incomes:
A survey by BriteCo found that over half (53%) of engagement ring purchasers had household incomes of $100,000 or more annually. (amorefinejewelry.com)
The average cost of an engagement ring in the U.S. is approximately $5,200, with variations based on location and personal preferences. (theknot.com)
General Diamond Jewelry Buyers
For general diamond jewelry purchases:
High-income individuals, particularly those earning $200,000 or more annually, tend to spend the most on jewelry, averaging $1,657 per household. (en.clear.sale)
The 45–54 age group, often in their peak earning years, spends the most on jewelry annually, averaging $304.60 per person. (classywomencollection.com)
Purchasing Trends
While traditional norms suggested that men purchase diamond jewelry for women, recent trends indicate a shift:(glamour.com)
A significant number of women now purchase diamond jewelry for themselves, reflecting changes in purchasing power and societal norms. (glamour.com)
In summary, while there’s a range in income levels among diamond jewelry buyers, engagement ring purchasers often have higher household incomes, and spending habits can vary based on age, income, and personal preferences.
The average income (in constant 1900 USD) for individuals earning less than $50,000 annually, by continent
Here’s a timeline graph showing the average income (in constant 1900 USD) for individuals earning less than $50,000 annually, by continent from 1900 to 2025.
Notable trends:
Africa and South America maintain the lowest income averages, rising steadily but modestly over the century.
Asia displays moderate gains, especially post-1970, reflecting rapid industrial growth in emerging economies.
Europe and North America show higher income levels even among sub-$50K earners, with consistent growth across the timeline.
The estimated percentage of the population earning less than $50,000 annually by continent from 1980 to 2025, by continent
Here is the timeline graph showing the estimated percentage of the population earning less than $50,000 annually by continent from 1980 to 2025.
Asia: Significant decline in low-income share, especially after the year 2000 due to economic booms in countries like China and India.
Europe and North America: Lower percentages, but still notable segments of the population remain under the $50K threshold.
South America: Similar trajectory to Asia but with slower gains due to economic volatility.
Here is the timeline graph showing the estimated percentage of the population who are unmarried by continent from 1950 to 2020.
Highlights:
Europe and North America show the highest increases in unmarried populations, linked to delayed marriage, higher divorce rates, and more cohabitation.
Asia and South America show a steady rise, particularly from 1980 onward.
Africa has a slower but consistent increase, reflecting both urbanization and shifting cultural norms.
This visualization is based on trend-aligned estimates using UN, Pew, and Our World in Data sources. Let me know if you’d like the data segmented by gender or age group.
What This Signals for the Future
This cultural and generational shift is perhaps the single most disruptive force affecting the global diamond market today. It marks a deep, structural change in values, not just a temporary drop in spending. Here’s a breakdown of the impact:
1. Value Displacement: Diamonds No Longer Symbolize Life’s Milestones
Millennials (born 1981–1996) and Gen Z (1997–2012) are rethinking what symbols matter.
The traditional narrative—“a diamond is forever”—was built on the assumption of:
Early marriage,
Lifelong partnerships,
And social status through possessions.
Today, those assumptions are unraveling.
🔻 Impact: Diamonds are no longer seen as essential markers of love or adulthood. Demand weakens not because buyers can’t afford diamonds—but because they don’t see the point.
2. Shifting Life Timelines = Collapsing Core Market
The average age of first marriage has increased globally:
In the U.S., it rose from 22 (women) and 24 (men) in 1980 to 29 and 31, respectively, in 2023.
In parts of Europe and Asia, it’s even later.
A growing number of people are not getting married at all.
Many children are now raised in households without weddings or wedding-related rituals.
🔻 Impact: The ritual of diamond giving disappears not only from one generation but possibly from the next, creating generational demand decay.
3. Experiences Over Possessions
These younger generations value travel, education, career exploration, and wellness far more than owning luxury goods.
Even those who buy jewelry prefer:
Minimalist, sustainable, or locally crafted pieces.
Items with meaning and ethical integrity, not high-status price tags.
🔻 Impact: Diamonds are being replaced by other forms of meaning and expression. The market loses emotional relevance, not just material appeal.
4. Cynicism Toward Marketing & Institutions
Millennials and Gen Z are skeptical of corporate storytelling.
Marketing phrases like “forever” feel inauthentic or manipulative, especially amid rising divorce rates and shifting relationship norms.
The rise of lab-grown diamonds is partly due to this pushback: a rejection of the industry’s inflated prices and outdated symbolism.
🔻 Impact: The entire emotional foundation of the diamond market is eroding, especially among the very age groups that once sustained it.
Final Reflection: The Hidden Structural Driver
At the heart of this global collapse in diamond consumption lies a deeper, structural driver: the breakdown of societal systems that once reinforced marriage, family, and symbolic consumption through rituals like diamond gifting.
This transformation did not occur because the world ran out of diamonds—it occurred because the world ran out of reasons to value them. The ritual of diamond-giving was never about the stone; it was about the societal system that celebrated stability, formal relationships, and enduring economic participation.
That system is eroding. As formal employment becomes harder to access, fewer people earn the stable, high incomes needed to support both consumerism and long-term relationships. A generation that is unmarried, debt-burdened, and disillusioned with institutions is unlikely to sustain the myths or markets that supported diamond consumption.
Children growing up in households where marriage is absent or de-emphasized are less likely to view weddings or diamond exchanges as meaningful milestones. The cycle of diamond value, linked to emotional, cultural, and financial investment, is weakening across generations.
In this light, the collapse of the diamond industry is not just a market failure—it is a reflection of a broader systemic shift in how human beings organize themselves, work, and form families. Reversing this decline is not just about rebranding diamonds; it would require revitalizing the very social and economic institutions that gave diamonds meaning in the first place.
The industry must come to terms with a crucial blind spot: it is still largely run by a generation that once embraced the values underpinning diamond consumption—marriage, tradition, and symbolic milestones—but has failed to see that newer generations no longer hold these values in the same way. This disconnect between leadership and the evolving consumer mindset lies at the heart of the industry’s current crisis.
Conclusion: Demand is Structurally Shrinking, Not Temporarily Declining
This isn’t a cyclical downturn. It is a secular, values-driven shift that is unlikely to reverse. The traditional model—diamonds as status, love, marriage—has lost emotional resonance for a rising global majority.
Diamonds are becoming commoditized, not cherished.
Even lab-grown diamonds can’t stop the overall volume decline—they may have just delayed it.
Without a reinvention of meaning, value, and use, the entire diamond industry risks irrelevance within 30 years.
Here is the projected trend of global diamond consumption from 2005 to 2070:
It highlights a steep and steady decline, dropping from 177 million carats in 2005 to near zero by 2070.
Despite growth in lab-grown diamonds, overall consumption is shrinking, due to weakening cultural relevance, oversupply, and generational shifts.
A dramatic drop of over 60% in just 25 years.
Even with the rise of lab-grown diamonds, total consumption continues to shrink.
If current trends persist, the diamond industry is headed for a collapse by mid-century.
How can the world recover from this?
The collapse in global diamond consumption is not simply a market failure but a reflection of deeper structural shifts in society. As stable or formal employment, marriage, and traditional family systems decline, so too does the cultural relevance of diamond rituals that once symbolized commitment and prosperity. The value of diamonds was never inherent—it was rooted in the societal structures that upheld lifelong partnerships and economic stability. With fewer people forming such relationships or earning the incomes to sustain them, and with new generations growing up outside these traditions, the emotional and symbolic foundation of the diamond market is eroding. Reversing this trend would require not just marketing innovation, but a broader revitalization of the organizational and family institutions that once gave diamonds their meaning.
Or Else?
“We were overtaken—beginning as far back as 2005—not by a depletion of diamond reserves, which was a force within our control, but by a global shift in how diamonds are viewed and valued—a force beyond our control. The decline in demand reflects deeper changes in societal norms, income structures, and personal aspirations. As a nation, the sooner we recognise this, the sooner we will face a critical choice: either transition out of diamonds as a foundational economic sector, or commit to building as a globe the formal employment systems and social institutions—stable incomes, families, and cultural rituals—that once gave diamonds their meaning and lustre. Which path will we choose?”
Sheila Damodaran STRLDi, Botswana June 2025
📚 Data Sources Referenced for Estimation
The chart I provided is based on estimates but historically guided data, not directly from a single dataset. Here’s how the estimates were constructed and the sources they’re informed by:
While listening to the remarks delivered by President Duma Boko in this speech, I was struck by his clarity. He articulated the evolving responsibilities of the public and private sectors in national development. His message prompted a deeper reflection on the true meaning of building an economy. Such an economy should be self-sustaining and productive. It must also align with the long-term aspirations of our nation.
This piece outlines a structured perspective on key themes that emerged from that reflection. It highlights the foundational role of STEM. It emphasizes the accountability of institutions. There is an urgent need to shift from dependency to performance-driven growth. It is not offered as a critique. Instead, it is a contribution to the ongoing national conversation about how we move from intent to meaningful impact.
Key Themes on National Revenue, Economic Responsibility, and the Role of STEM in Private Sector Performance
EXECUTIVE SUMMARY
Building a Self-Sustaining Economy: From Dependency to Performance
This paper is informed by the recent remarks of President Duma. It reflects on the evolving roles of the public and private sectors in Botswana’s development. It calls for a decisive transition. The transition is from a state-centric economic model reliant on taxation and external investment. It shifts to a performance-driven economy led by a globally competitive private sector. This economy is rooted in STEM capability and accountable institutions.
Key Messages
Redefining the Role of Government The primary role of government is governance, not revenue generation. Taxes exist to sustain essential public services, not to drive economic development or build national infrastructure. The private sector must lead economic output. The nation’s best minds and talent should concentrate here to design and lead, not just follow.
Private Sector Must Own the Economy Economic growth should be led and financed by the private sector. Infrastructure development must also be led by them. They should create value chains too. This should not occur through public procurement. Instead, it should be achieved through market competitiveness, exports, and reinvestment of earned revenues.
From Local Consumption to Global Trade Botswana’s productive sectors must shift from serving a market of 2 million. They need to export competitively to a global market of 4–8 billion. Export revenues are the only sustainable source of private sector capital for national infrastructure.
Institutions Must Become Market-Makers Agencies like MITI, BITC, and MIR must leave behind their gatekeeping roles. They should transition to active facilitators of global demand. They should enable Botswana-made goods and services to reach international markets. They must also ensure these products meet global standards.
STEM Is Not Optional—It Is Foundational The deficit in science, technology, engineering, and mathematics (STEM) education is a core barrier. It hinders private sector innovation. It also affects systems design and national competitiveness. Addressing this gap must become a national priority.
Accountability and Performance Culture Needed Both the public and private sectors suffer from a lack of performance culture. When salaries remain constant despite underperformance or economic decline, the system disincentivizes learning, growth, and adaptation.
Correcting Structural Market Distortions National grocery chains granted access to public markets often exclude local farmers. This creates closed, exploitative loops that undermine domestic producers. STEM-informed policy could help establish fair structures—e.g., requiring local sourcing quotas.
Entertainment, Sports, and ICT Are Enablers. They are not drivers. Sectors like ICT and creative industries are important for national identity and modernization. However, they must support—not replace—the core economy. Youth should be redirected into value-creating roles in agriculture, manufacturing, and exports.
Rethinking Foreign Investment Over-reliance on foreign capital masks deeper structural weaknesses. Foreign investors cannot carry the burden of transforming local performance. Sustainable growth must be built from within—through domestic capability, accountability, and reinvestment.
Conclusion
This is a call to action—not only to policy leaders, but to the private sector, educators, institutions, and families. Botswana’s economy will transform not by managing scarcity. It will transform by unleashing the performance of its people and systems.
We must shift our view—from managing what we have to building what we need. If this requires tightening our belts, then it must be embraced as a national prerogative. The imperative is clear: growth must be powered from within, not imported or outsourced.
STRATEGIC SOLUTIONS TO UNLESASH PERFORMANCE
1. The Role of the Public Sector: Governance, Not Revenue Generation
The public sector should not be held responsible for the country’s overall revenue performance. Taxes are not the primary engine of growth—they are designed to sustain essential government functions, not build mega national projects.
The role of government is to regulate, administer, and facilitate—not to generate income or directly build commercial infrastructure. Beyond national planning and oversight, the implementation of development and infrastructure should not fall under direct government responsibility. Economic output must be led by the private sector, where the nation’s best minds and talent should be concentrated.
2. Revenue Generation is a Private Sector Responsibility
The belief that “we know our local situation best” has failed to deliver the results we aspire to. It has discouraged some of the world’s best talent from contributing to our economic advancement. This inward-looking stance has constrained our ability to position the country meaningfully on the global economic stage. Our achievements are limited to visible successes in extraction industries, tourism, MICE, sports, and pageantry. These sectors serve global elites and hold value. However, they represent a very small portion of global economic activity. This is true in terms of GDP (please refer to the note below). To move forward, we must be willing to open up. We should engage in global collaboration. We need to compete with the world’s leading economic producers.
We must recognize our current limitations in leading the private sector. Consequently, we must be prepared to import seasoned industry leaders. These are individuals with proven records of accomplishment and success. They will guide our economic transformation. Alternatively, we must be willing to export our emerging talent. They can learn from the best in the world. This will equip them to return and lead. Their insight, discipline, and excellence are required to drive the economy forward.
This understanding aligns with the foundational ideas of neoliberalism, also referred to as market fundamentalism. At its core, neoliberalism maintains that human well-being is best advanced within an institutional framework characterized by:
Free markets
Minimal government intervention
Free trade
The absence of excessive economic regulation
Strong protections for individual property rights
The application of these principles must be sensitive to national context and social equity. The central idea remains: Economic vitality is best achieved when government creates the enabling environment. The private sector leads in innovation, value creation, and growth.
NOTES:
Tourism, encompassing MICE services, stands out with a significant 10% contribution to global GDP. It highlights its role as a major economic driver.
Extraction industries and the sports sector contribute notably. However, their combined impact is still less than that of manufacturing or healthcare.
Pageantry, while influential in cultural and promotional contexts, represents a smaller fraction of global economic activity.
In contrast, sectors like manufacturing, finance, and healthcare collectively dominate global GDP contributions, underscoring the importance of diversified economic development.
The private sector is the principal engine of national revenue and economic growth. The sector should ensure that human rights are upheld in the pursuit of profit. This is in its own long-term interest. Failure to do so undermines social trust. It ultimately threatens the sustainability and longevity of individual enterprises. The sector as a whole is also at risk.
This responsibility belongs not only to corporate leaders but to every individual within the sector. The private sector must take full ownership of national systems, including:
Logistics and transport infrastructure
Creative & sports industries
Healthcare systems
Agriculture value chains
Building and construction
Housing
Energy, water, and digital infrastructure (data)
While sectors like the creative and sports industries add cultural value, they are supportive, not foundational (see below). They help a nation celebrate achievements, but are not core economic drivers. Likewise, ICT and the digital economy is a vital enabler. It reinforces performance, particularly in agriculture and manufacturing. Both sectors remain central to long-term sustainability.
3. Infrastructure Must Be Privately Built and Sustained
Infrastructure—whether in transport, housing, energy, or healthcare—should be financed and developed by the private sector.
This reflects a necessary shift in mindset. National development should be led by those who create value. It should not be administered by the state.
For this to happen, the private sector must have access to earned resources—not allocations obtained through government tenders. A high-performing private sector reinvests its own revenues rather than relying on public procurement.
Capital prematurely locked in generational wealth is redirected to fuel domestic production
Primary sectors and manufacturing—which have already absorbed significant investment, possibly in the trillions—must also shift. Much of this capital remains locked in property. Some of it has flowed out of the country as payments for imported goods. Now, a portion sits idle as private assets or generational wealth. Will somebody do the math on these purchases and investments—particularly since the 1970s and 1980s? To reverse this trend, these goods and resources must be redirected to fuel domestic production. This will transform these sectors into productive engines. They need to become export-oriented engines of national value creation.
No longer viable to produce for two million only
It is no longer viable to produce merely for a population of two million. These industries must expand their markets and export at scale to the 4–8 billion people globally. The revenue from such scale can fund infrastructure, without dependency on foreign capital or subsidies.
This transformation depends on enabling institutions. Agencies such as MITI, BITC, and MIR must move from being gatekeepers to market-makers and global demand enablers. Their role is to:
Create international demand for Botswana-made goods and services
Build and support export channels
Ensure local products meet global standards
When value is created in Botswana that meets global demand, the world will invest. They will do so not because we ask but because we offer something worth investing in.
Rights to secure land and efficient allocation
Additionally, agricultural productivity cannot be scaled without secure land rights, efficient allocation, and an enabling environment for investment. Land must function as an economic asset—not merely a cultural or administrative claim.
Key reforms must include:
Guaranteeing land tenure security for commercial and smallholder farmers
Consolidating fragmented plots to enable production at scale
Improving access to land for emerging producers
Aligning infrastructure and zoning policies with agricultural potential
Streamlining land board processes to reduce delays and uncertainty
Unless land governance is addressed with the same rigor as export readiness and infrastructure investment, agricultural growth will remain stunted. Land is foundational to production. No serious development strategy can proceed without confronting this challenge directly.
Expanding Through Regional Integration and Strategic Alliances
A critical part of Botswana’s global competitiveness must begin with the region. Regional integration happens through platforms such as the Southern African Development Community (SADC). It also occurs via the African Continental Free Trade Area (AfCFTA). These offer Botswana a powerful springboard. These frameworks:
Expand market access for Botswana’s exports within Africa
Allow for harmonization of regulatory standards, reducing trade barriers
Enable Botswana to participate in or lead regional value chains
Attract strategic investments by offering regional scale and logistical relevance
In parallel, forging bilateral and multilateral alliances with strategic partners in agriculture, energy, and technology is essential. These alliances will allow Botswana to leverage shared capabilities. They will accelerate its learning curve.
These partnerships must be grounded in performance. They are not charity. They are mutual economic strategies that expand production, employment, and competitiveness. When properly designed, regional and international alliances provide access to markets, know-how, and investment—without sacrificing sovereignty or long-term vision.
4. A Private Sector That Mirrors Public Inefficiency Is a Structural Risk
In many cases, the private sector has mirrored the inefficiencies of the public sector:
Weak accountability
Limited performance evaluation
Excessive labour protections shielding underperformance
A reluctance by courts and executives to enforce merit-based standards
When performance is neither measured nor rewarded, the sector fails its purpose. It becomes susceptible to corruption and eroded productivity. It can influence public systems, including the judiciary and executive, that serve private interests.
5. Education-Workforce Misalignment: Non-STEM Backgrounds Fall Short
Many are formally educated yet ill-equipped to meet the performance expectations of today’s private sector—especially in technical and productive sectors.
In fields such as agriculture and manufacturing, STEM capability is indispensable. These disciplines require system design, technical problem-solving, iterative problem-solving and applied implementation. The mismatch between educational preparation and sector demands limits national competitiveness and productivity.
6. The STEM Deficit is a Structural Barrier to Development
Without sufficient STEM expertise, the private sector cannot:
Identify systemic gaps
Design and implement solutions
Complete and manage efficient value chains
Correcting Market Distortions Through STEM-Informed Agricultural Policy
One example is the misalignment between national grocery chains and local agricultural producers. Currently, major chains have unrestricted access to public markets, sidelining local farmers who lack the influence to compete. This creates a closed system. Chains dominate both supply and retail. They exclude the very producers who are also their consumers.
STEM-informed policy (mathematics in particular) can correct these structural distortions. If national chains are allowed to operate in the public markets, then:
Ownership should be barred from also being their primary supplier, to prevent conflicts of interest, or
A local sourcing quota (e.g., 80%) should be mandated to support domestic producers.
Such measures ensure that money circulating in public markets reaches the hands of local farmers. These earnings are spent and reinvested locally. This spending gives rise to a private sector capable of funding national infrastructure. It sustains growth from within.
Here is a refined and professional version of your text, preserving your insights while improving flow, tone, and precision:
Rethinking Drought: Working With, Not Against, the Water Cycle
Our prevailing approach to drought is largely reactive and adversarial. We invest in crops engineered to resist drought, develop irrigation systems designed to minimize water loss, and breed plant varieties that retain moisture by limiting transpiration. Yet in doing so, we overlook a basic scientific principle taught in early education: the rain cycle depends on water vapor released through evaporation—from land and sea—and transpiration from plants.
Rather than amplifying this cycle, many current drought-resistance measures suppress it. Drip irrigation, for instance, delivers water only to plant roots, leaving the broader soil ecosystem dry. Similarly, drought-tolerant crops are often selected for their ability to conserve water, reducing transpiration and thus limiting the atmospheric moisture necessary for cloud formation and rainfall.
The consequence is cumulative and severe. As the land loses its capacity to contribute moisture to the air, the water cycle is disrupted. This often triggers violent, compensatory storms that bring pests and diseases—but not sustained rain. In their wake, they strip away topsoil, degrade land quality, and deepen drought conditions.
We must shift the question from “How do we survive drought?” to “How do we regenerate rain?” The sun will continue to heat the earth—but if there is no moisture to draw upward, no rain will return. Our agricultural practices and policies must align with the physics, chemistry, and biology of the natural water cycle—not work against them.
This is a systems problem. And it requires a systems-thinking solution—rooted in STEM disciplines—to repair the disconnect between well-intended interventions and the ecological realities they are meant to address.
7. STEM Strategy is Critically Missing from National Policy
There is a glaring absence of STEM strategy at the national level. Without it, neither the public nor private sectors are equipped for the complexity and demands of modern economies. A robust national future depends on building a society deeply capable in STEM—one that can design, innovate, and lead.
8. Shifting System-Building to the Private Sector Reduces Dependency and Abuse
Allowing the private sector to compete in designing infrastructure shifts the system from entitlement to performance.
This transition reduces reliance on government-led development, which is often hampered by:
Inefficiencies in procurement
Mismanagement of public funds
Bottlenecks in decision-making
Instead, a results-driven private sector promotes innovation, fiscal discipline, and infrastructure growth tied to real productivity.
9. Over-reliance on Foreign Investment Masks Deeper Structural Weakness
Dependency on foreign investment does not solve the fundamental issue. The country has a limited ability to generate internal revenue through productive work.
Until that story changes, structural transformation will remain elusive. Furthermore, when foreign investments yield limited returns and are trapped in procurement cycles, they fail to strengthen national resilience. This weakens fiscal capacity and autonomy when resources are needed most.
10. Entertainment, Sports, and ICT Are Enablers—Not the Core of Economic Purpose
Creative, sports, and ICT sectors play valuable roles—but they do not constitute the foundation of the economy.
Creative and sports industries, even when dominated by youth, are supportive rather than foundational. They flourish in celebration of economic success, not as its source.
ICT is a strategic enabler—scaling performance in other sectors—but it must serve real economic production.
Youth must be placed where their energy has the highest return: agriculture, manufacturing, and productive value chains. A resilient economy depends not on entertainment or digitization alone, but on the ability to produce and sustain real value.
11. Lack of Accountability Undermines Learning and Decision-Making
A culture of avoiding consequences—prevalent in both public and parts of the private sector—undermines progress.
When salaries remain static despite economic decline, there is no incentive to learn or improve. This is especially concerning in countries where the public sector is the largest employer—dragging down private sector performance with it.
It is not the role of foreign investors to elevate national standards or to teach performance excellence. That responsibility rests with the country and its citizens.
This mindset begins at home. The pursuit of “safe” white-collar jobs has often been valued over the discipline of productive, risk-informed decision-making.
When performance is neither rewarded nor punished, it leads to a concerning culture. In such a culture, individuals may ‘get away with murder’—figuratively, and sometimes literally. Crimes go scot-free, unnoticed or even approved by the courts. Such a system removes the conditions necessary for individuals to grow up. It prevents them from maturing and assuming personal responsibility for their actions. This would have debilitating effects when forming new relationships or building teams and organizations.
An economy that does not reward learning or penalize systemic error cannot build the leadership necessary for sustained growth. It also cannot build the workforce necessary for sustained growth, in either the public or private sectors.
STRATEGIC SOLUTIONS RANKED BY FOUNDATIONAL SIGNIFICANCE
This document is ordered below from the most fundamental solution to the least.
TIER 1: MOST FUNDAMENTAL SOLUTIONS (Core System Shifts)
6. The STEM Deficit is a Structural Barrier to Development
7. STEM Strategy is Critically Missing from National Policy
5. Education-Workforce Misalignment: Non-STEM Backgrounds Fall Short
1. The Role of the Public Sector: Governance, Not Revenue Generation
2. Revenue Generation is a Private Sector Responsibility
3. Infrastructure Must Be Privately Built and Sustained
Expanding Through Regional Integration and Strategic Alliances(integrated under Section 3)
Land Rights and Agricultural Productivity(within Section 3)
TIER 2: MID-TIER STRUCTURAL RISKS AND ENABLERS
4. A Private Sector That Mirrors Public Inefficiency Is a Structural Risk
11. Lack of Accountability Undermines Learning and Decision-Making
8. Shifting System-Building to the Private Sector Reduces Dependency and Abuse
9. Over-reliance on Foreign Investment Masks Deeper Structural Weakness
TIER 3: LEAST FUNDAMENTAL (SUPPORTIVE / DOWNSTREAM LEVERS)
10. Entertainment, Sports, and ICT Are Enablers—Not the Core of Economic Purpose
Conclusion: This is a call to action—not only to policy leaders, but to the private sector, educators, institutions, and families. Botswana’s economy will transform not by managing scarcity. It will transform by unleashing the performance of its people and systems.
We must shift our view from managing what we have to building what we need. If this requires tightening our belts, then it must be embraced as a national prerogative. The imperative is clear: growth must be powered from within, not imported or outsourced
NATIONAL STRATEGY TO REBUILD STEM CAPABILITY FOR ECONOMIC DIVERSIFICATION
To reverse a weak national STEM base—particularly after three generations of underinvestment—a country needs a comprehensive strategy. It should adopt a dual-track national strategy. This strategy must address both immediate economic needs and long-term systems development. Here’s a cohesive, high-impact approach:
1. Create a National STEM Acceleration Framework (Short- to Medium-Term)
Design a national program focused on retooling current and upcoming working-age adults (15–45 years) through:
STEM bridging programs for non-STEM graduates (e.g., engineers from arts backgrounds)
Sector-specific technical bootcamps (e.g., manufacturing, food processing, agritech, energy tech)
Adult vocational and skills retraining hubs in regional centers
Fast-track technical diplomas and certificates (6–18 months) aligned with economic diversification targets
2. Build National STEM Apprenticeships & Internships (Industry-Led)
Partner local and foreign private sector firms with government to:
Launch paid apprenticeships in sectors like agro-processing, renewable energy, data infrastructure, etc.
Offer on-the-job training with international experts (reverse mentorship)
Tie tax or subsidy incentives to companies that train and absorb workers
3. Leverage Strategic International Partnerships (Talent Import & Export)
Until domestic talent is ready, bridge the gap by:
Importing STEM-capable managers and technical mentors into core industries under strict knowledge transfer terms
Exporting top students and professionals abroad for 2–5 year placements in innovation-driven sectors with return agreements
Forming STEM cooperation pacts with countries like South Korea, Singapore, Germany, India, and Finland
4. Establish a National STEM Curriculum and School-to-Work Pipeline (10–15 Years Horizon)
Mandate computational thinking, systems science, coding, and applied science as core curriculum from primary levels
Convert underperforming schools into STEM-specialized academies across districts
Link school programs with internships, national labs, and industry visits
Incentivize teachers to reskill in STEM through scholarships, promotions, and salary uplift
5. Mobilize National Narrative & Cultural Reset
Launch a mass public campaign that redefines national success around problem-solving, engineering, and productivity
Profile and celebrate local STEM heroes and inventors
Align national holidays, awards, and media around makers, builders, and technical innovators—not just entertainers or politicians
6. Fund Results-Based STEM Education & Startups
Use a portion of sovereign wealth, natural resource rents, or regional grants to:
Fund technical colleges and university R&D partnerships
Back youth-led STEM startups in key diversification sectors
Pay for performance-based STEM scholarships
7. Establish a National STEM Governance Body
Create a STEM Diversification Council reporting to the President or Prime Minister
With authority to integrate policy across education, industry, economic planning, and trade
Charged with annual public reporting on STEM readiness and workforce transition metrics
This is not a one-ministry initiative—it requires a whole-of-government, whole-of-economy commitment. The strategy must view STEM not as an education issue. It must see it as a sovereign capability agenda that is tied directly to national wealth and independence.
As you read the article. notice how many times we broke the laws of dynamic complexity. These laws govern the nature of dynamic (recurrent problems) complexity.
I see three laws here. They are laws 8, 6 and 4. I have listed the laws against the text of the article below and the explanations at the end of the texts.
There are more.
Show us what you see.
“What really caused the euro zone crisis? Dec 22. 2011 BBC News”
World leaders probably spent more time worrying about the euro zone crisis than anything else in 2011.
And that was in the year that featured the Arab Spring, the Japanese tsunami and the death of Osama Bin Laden. What’s more, 2012 looks set to be not much different. But as euro zone governments hammer out new rules to limit their borrowing, are they missing the point of the crisis?
Euro zone leaders have agreed to a tough set of rules – insisted on by Germany – that will limit their governments’ borrowing each year to just 3% of their economies’ output. This is to stop them accumulating too much debt, and make sure we avoid we another financial crisis.
But didn’t they already agree to this back in the ’90s?
Hang on a minute. They agreed to exactly the same 3% borrowing limit back in 1997, when the euro was being set up. It was the German finance minister Theo Waigel who insisted on the “stability and growth pact”. What happened?
So who kept to the rules?
Italy was the worst offender. It regularly broke the 3% annual borrowing limit. But actually Germany – along with Italy – was the first big country to break the 3% rule. After that, France followed. Of the big economies, only Spain kept its nose clear until the 2008 financial crisis; the Madrid government stayed within the 3% limit every year from the euro’s creation in 1999 until 2007. Not only that – of the four, Spain’s government also has the smallest debts to the size of its economy. Greece, by the way, is in a class of its own. It never stuck to the 3% target, but manipulated its borrowing statistics to look good, which allowed it to get into the euro in the first place. Its waywardness was uncovered two years ago.
3/9 Italy
Worst offender
5/9 Germany
First to break rules
6/9 France
Offender
9/9 Spain
Top of the Class
But the markets have other ideas
So surely Germany, France and Italy should be in trouble with all that reckless borrowing, while Spain should be reaping the rewards of its virtue? Well, no. Actually Germany is the “safe haven” – markets have been willing to lend to it at historically low interest rates since the crisis began. Spain on the other hand is seen by markets as almost as risky as Italy.
So what gives?
So what really caused the crisis?
There was a big build-up of debts in Spain and Italy before 2008, but it had nothing to do with governments. Instead it was the private sector – companies and mortgage borrowers [@1 LAW #8] – who were taking out loans [@2 LAW #4] . Interest rates had fallen to unprecedented lows in southern European countries when they joined the euro. And that encouraged a debt-fuelled boom.
Good news for Germany…
All that debt helped finance more and more imports by Spain, Italy and even France. Meanwhile, Germany became an export power-house after the euro zone was set up in 1999, selling far more to the rest of the world (including southern Europeans) than it was buying as imports. That meant Germany was earning a lot of surplus cash on its exports. And guess what – most of that cash ended up being lent to southern Europe.
…bad news for southern Europe
But debts are only part of the problem in Italy and Spain. During the boom years, wages rose and rose in the south (and in France). But German unions agreed to hold their wages (and their personal spending) steady. So Italian and Spanish workers now face a huge competitive price disadvantage. Indeed, this loss of competitiveness [@3 LAW #3] is the main reason southern Europeans have found it so much harder to export than Germany.
…and a nasty dilemma
So to recap, government borrowing – which has ballooned since the 2008 global financial crisis – had very little to do with creating the current euro zone crisis in the first place, especially in Spain (Greece’s government is the big exception here). So even if governments don’t break the borrowing rules this time, that won’t necessarily stop a similar crisis from happening all over again.
Spain and Italy are now facing nasty recessions, because no-one wants to spend. Companies and mortgage borrowers are too busy repaying their debts to spend more. Exports are uncompetitive. And now governments – whose borrowing has exploded since the 2008 financial crisis savaged their economies – have agreed to drastically cut their spending back as well [@4 What Law is that?]. But…
Cut spending…
…and you are pretty sure to deepen the recession. That probably means even more unemployment (already over 20% in Spain), which may push wages down to more competitive levels – though history suggests this is very hard to do. Even so, lower wages will just make people’s debts even harder to repay, meaning they are likely to cut their own spending even more, or stop repaying their debts. And lower wages may not even lead to a quick rise in exports, if all of your European export markets are in recession too. In any case, you can probably expect more strikes and protests, and more nervousness in financial markets about whether you really will stay in the euro.
Don’t cut spending…
…and you risk a financial collapse. The amount you borrow each year has exploded since 2008 due to economic stagnation and high unemployment. But your economy looks to be chronically uncompetitive within the euro. So markets are liable to lose confidence in you – they may fear your economy is simply too weak to support your ballooning debt load. Meanwhile, other European governments may not have enough money to bail you out, and the European Central Bank says its mandate doesn’t allow it to. And if they won’t lend to you, why would anyone else?
@1 When we state country, the one that comes to mind (obviously), it is the government (and therefore) the public servants are spending (the Ministers must be corrupt , etc.). But the areas of the highest leverage, the citizen, the family, the industries stayed hidden behind the ‘name of the country’. Law #8 says, the areas of the highest leverage are often the least obvious. We need to be understanding this about ourselves and use it to turn the situation around.
@2 Taking loans out, which is borrowing money and spending money we do not have, is easier than freezing wages (and choosing not to spend the money). Notice what we are avoiding. We usually do not watch what we are avoiding. We need to be watching both should we expect to turn a situation around.
@3 Loss of competitiveness shows how things have got worse after some time of seeing things become easier or better. This indicates that the two (when things got worse and the things that got better) are interconnected. As we appreciate the interrelatedness of these issues, we now begin to have a handle on the situation.
@4 What law is broken here? Why do you say that? Do explore the reasonings with each other.


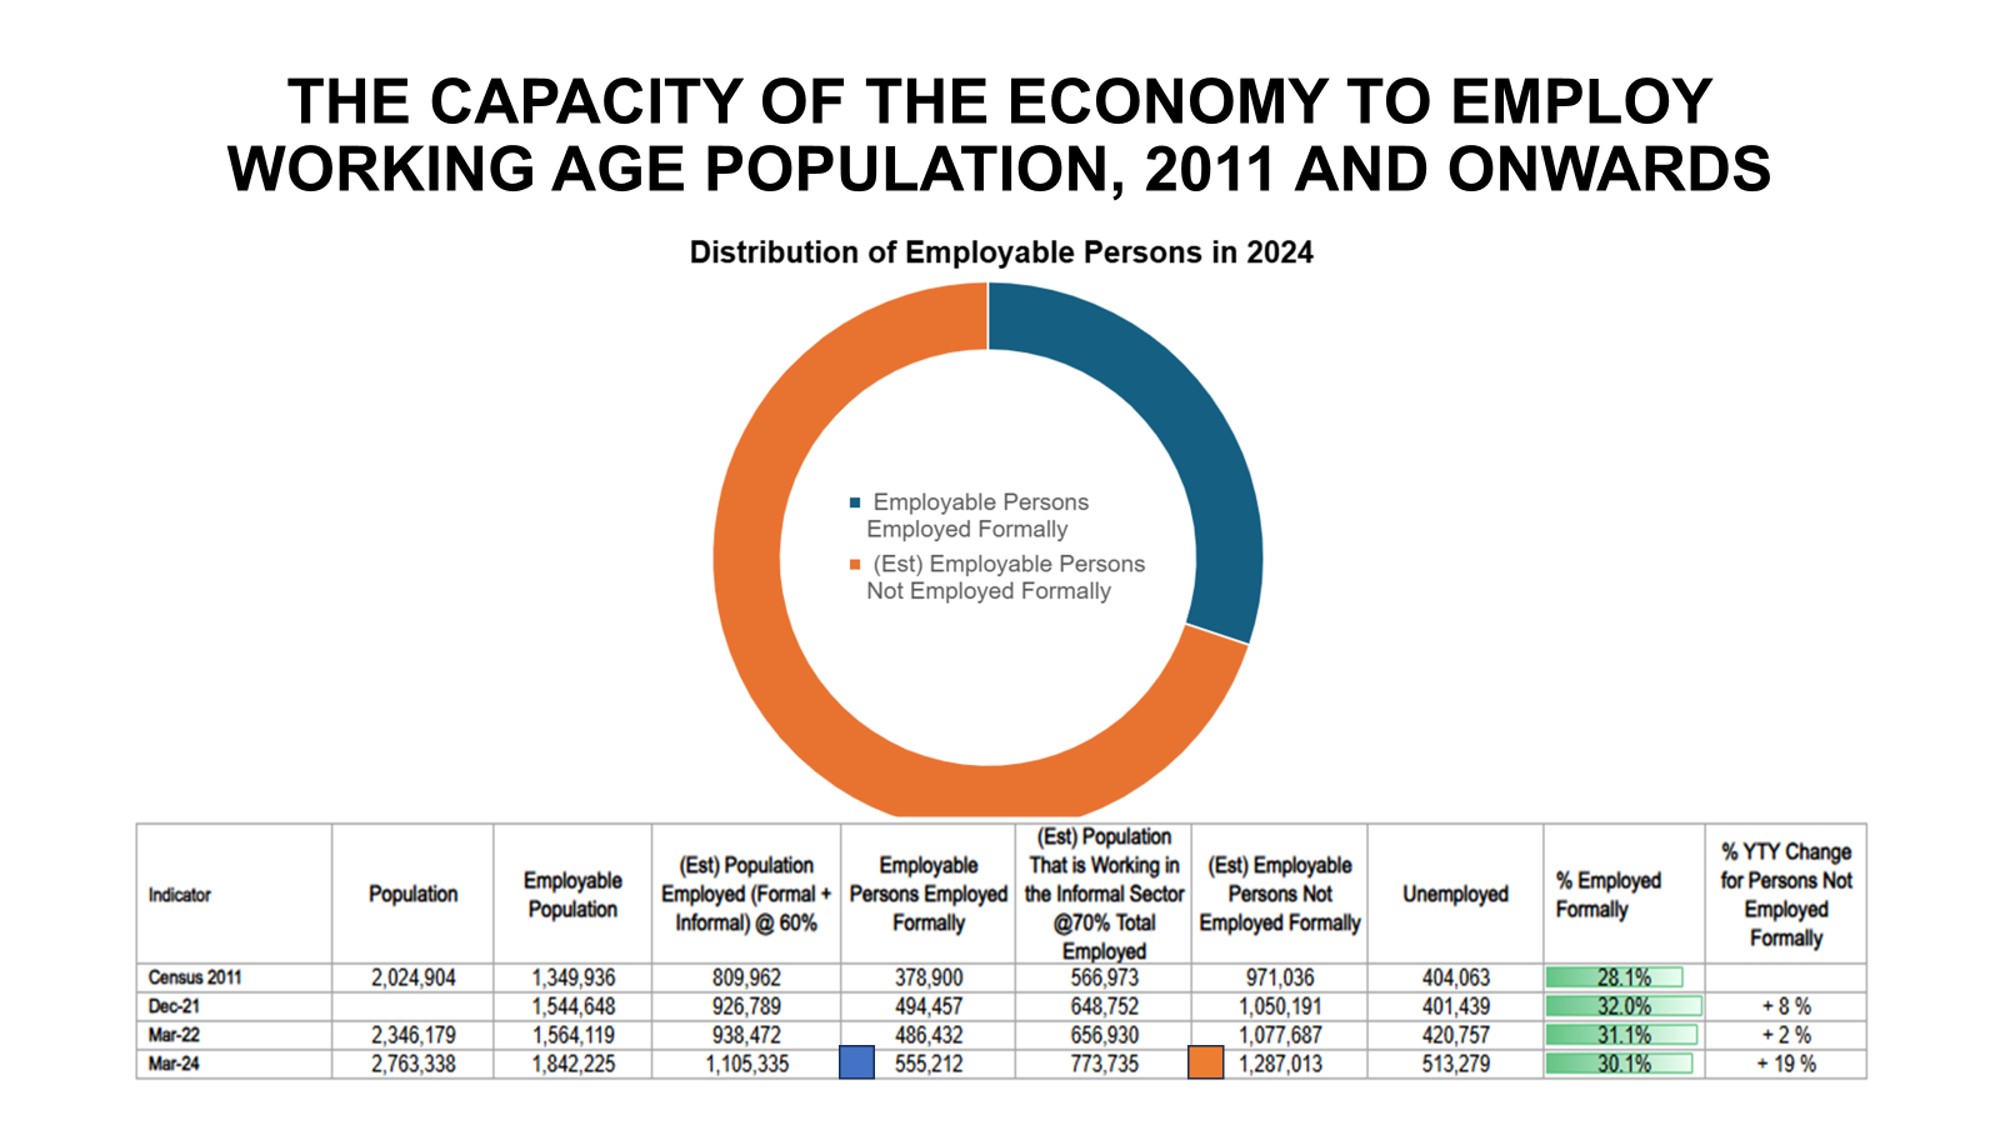

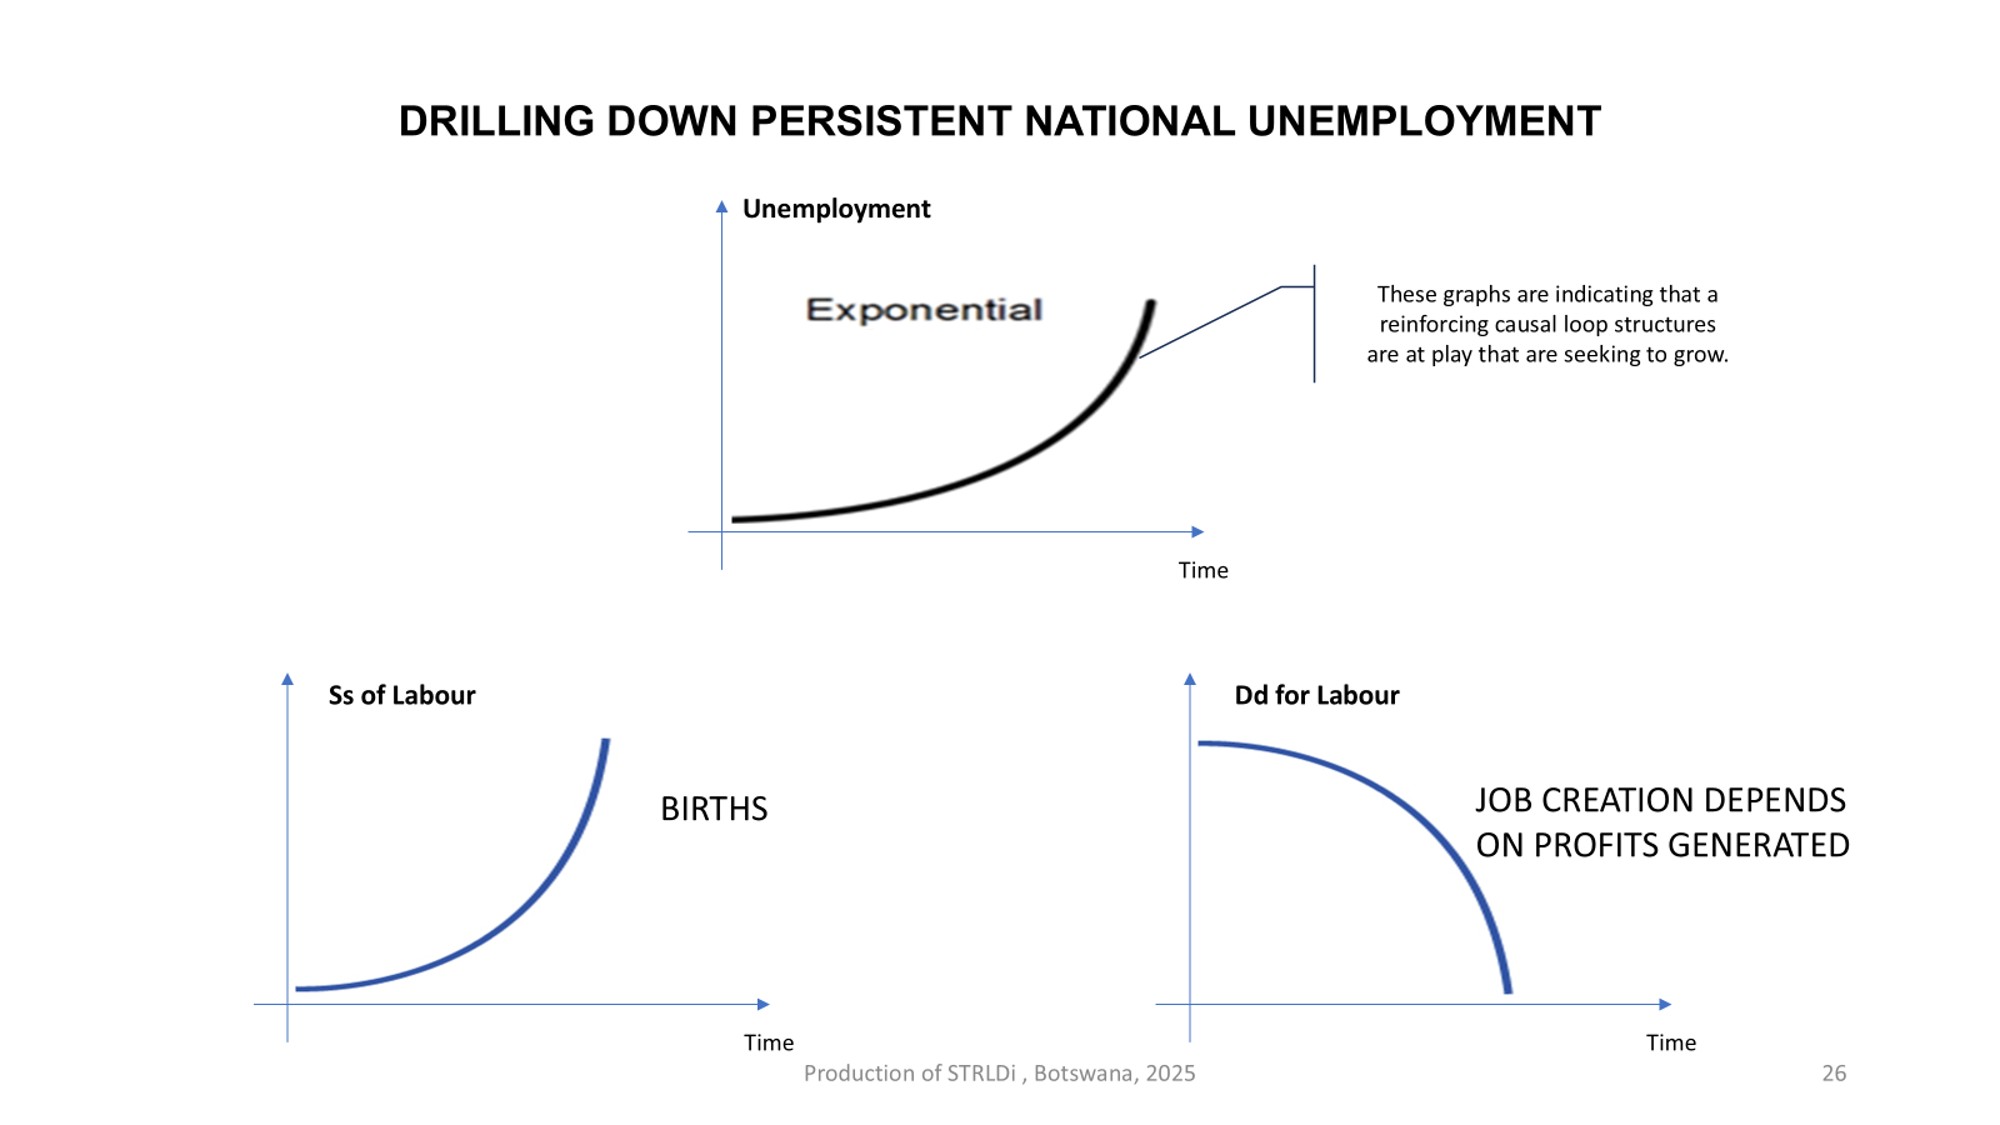
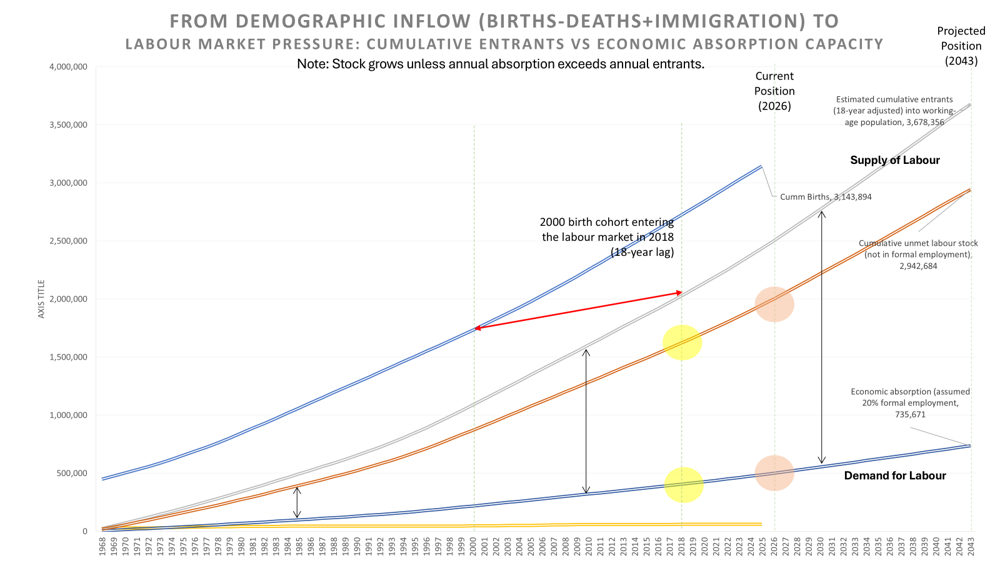


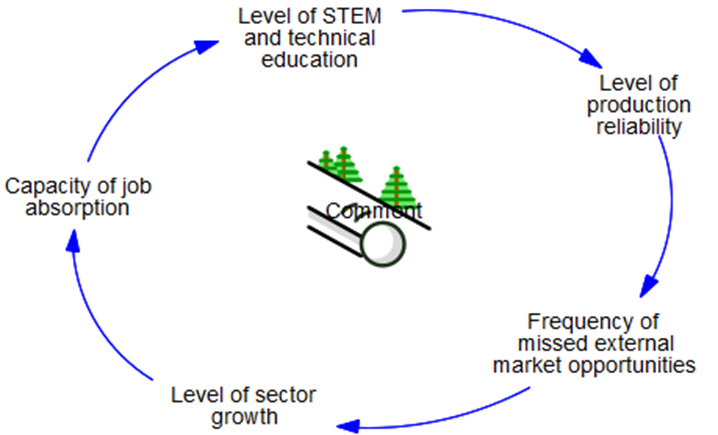
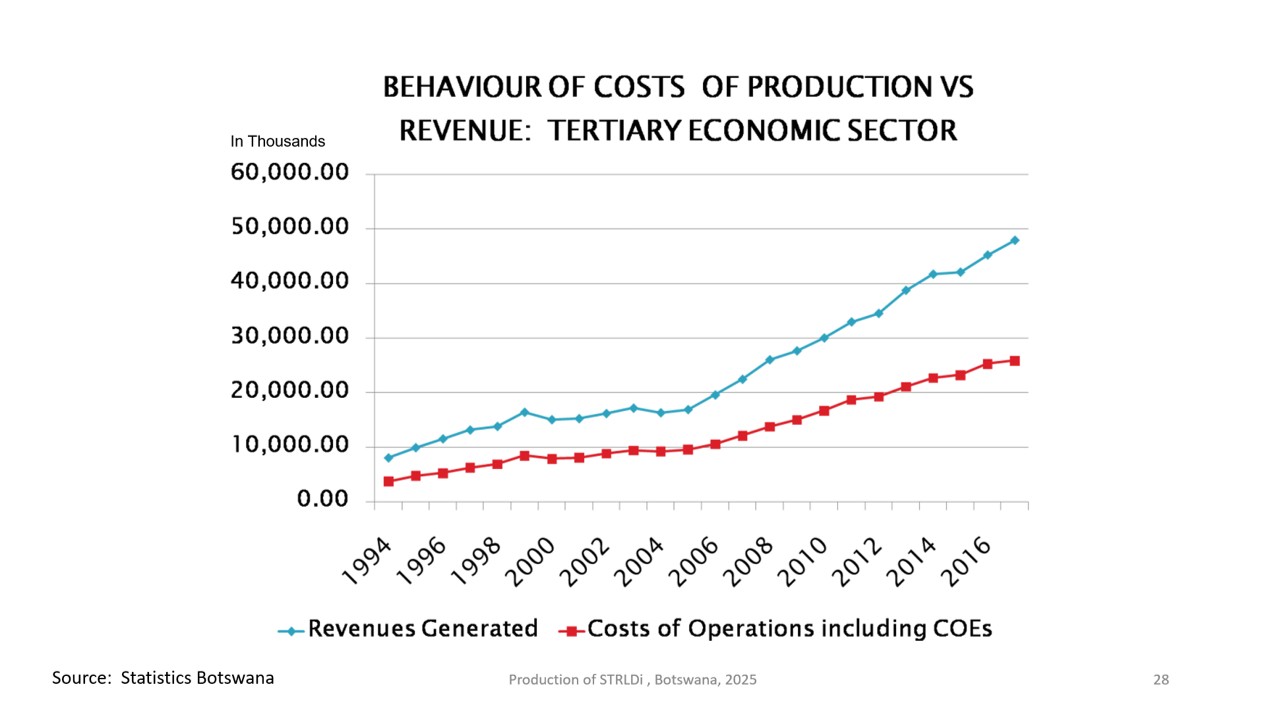
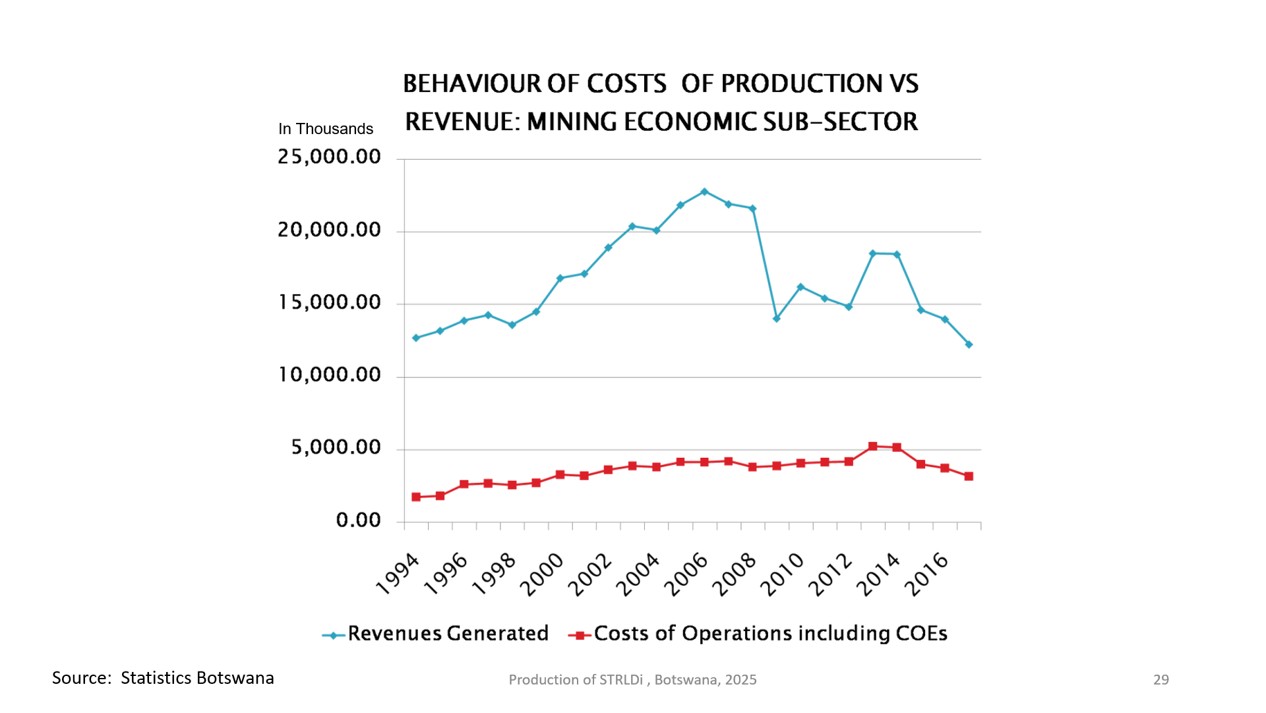

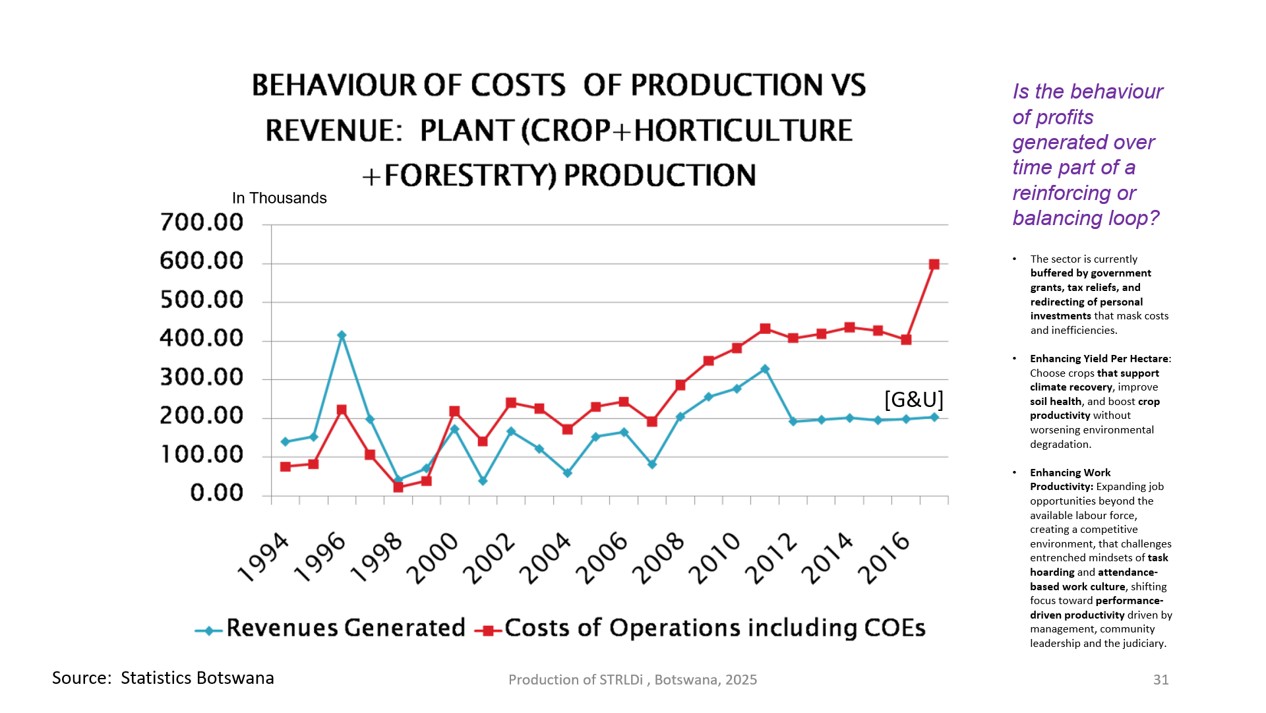


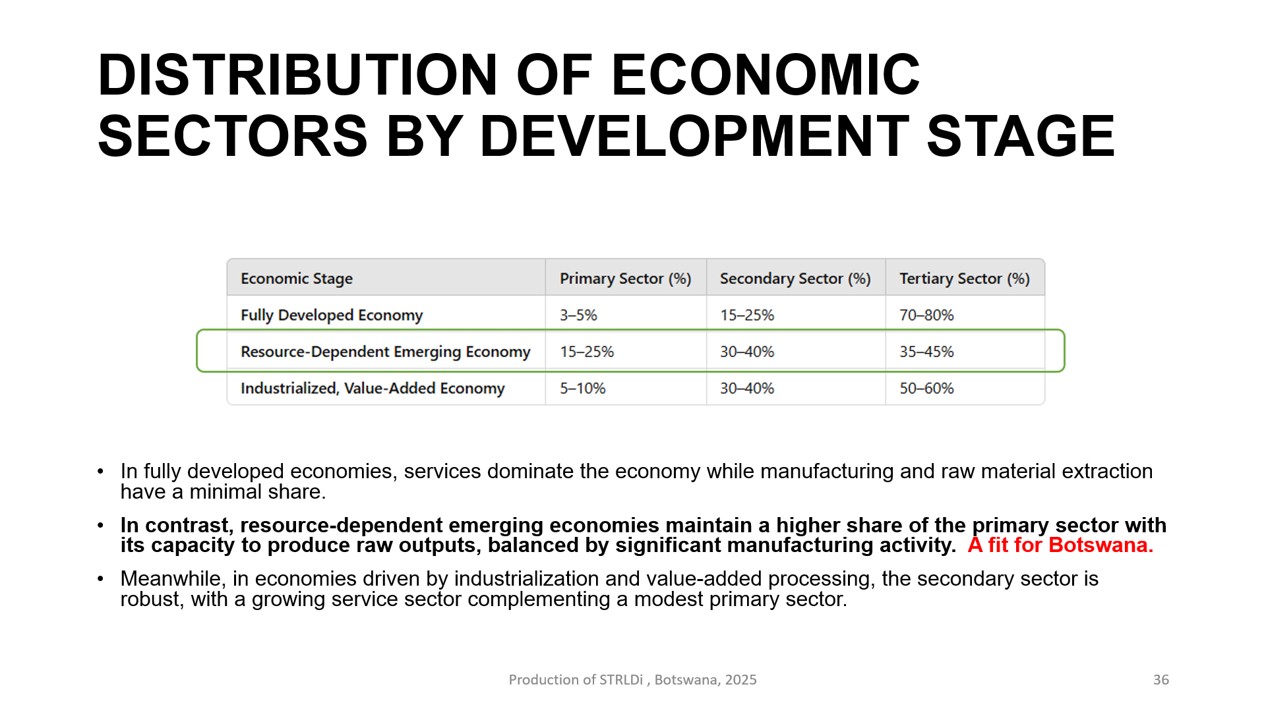
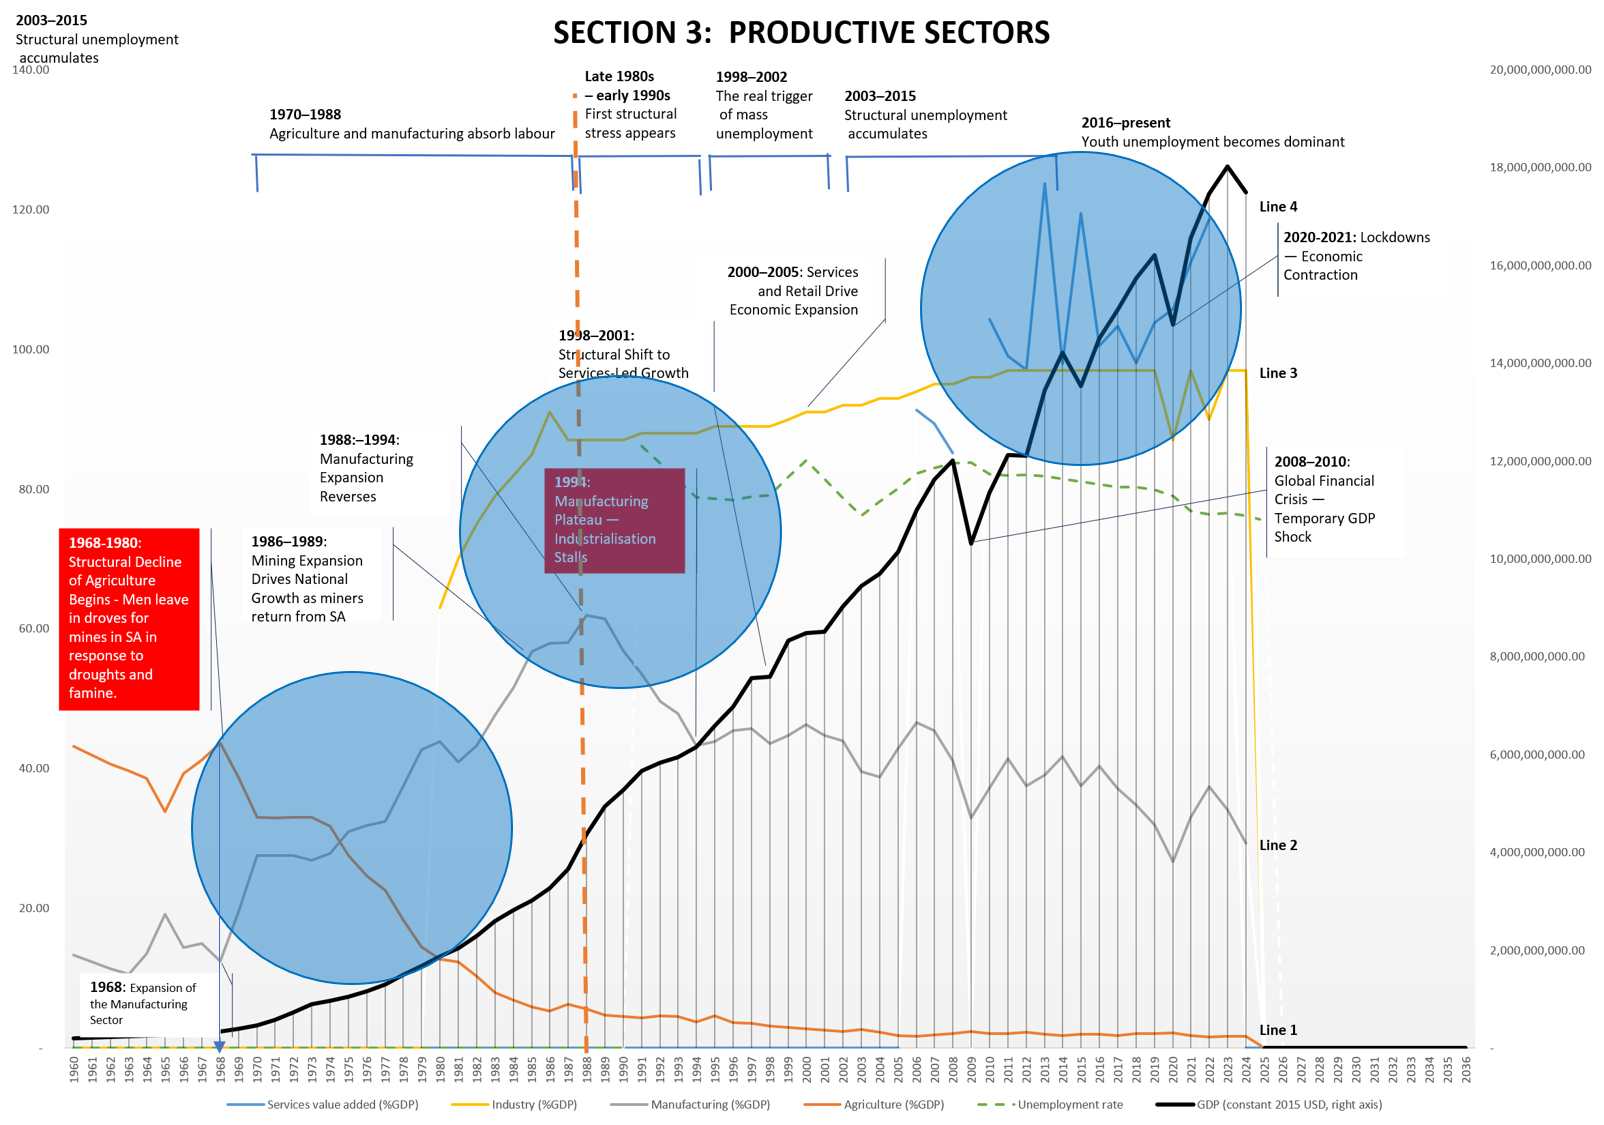
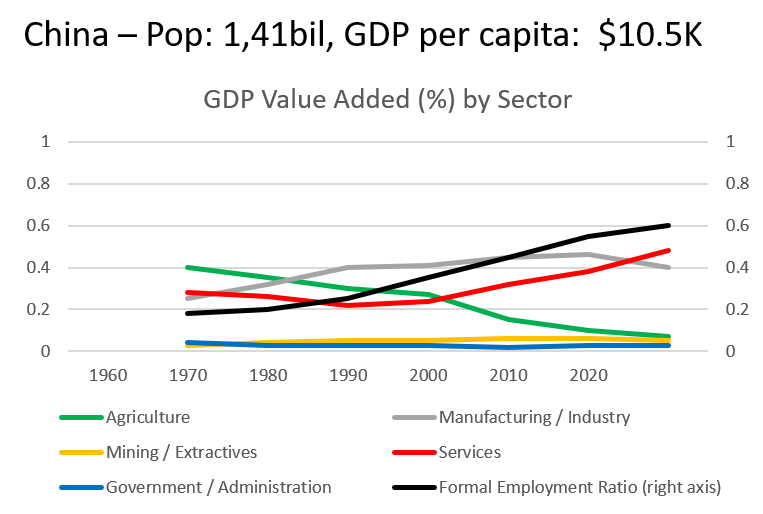
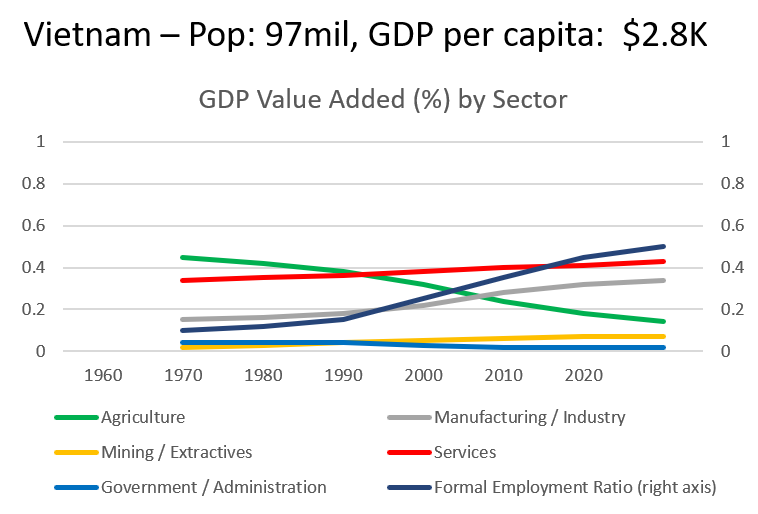
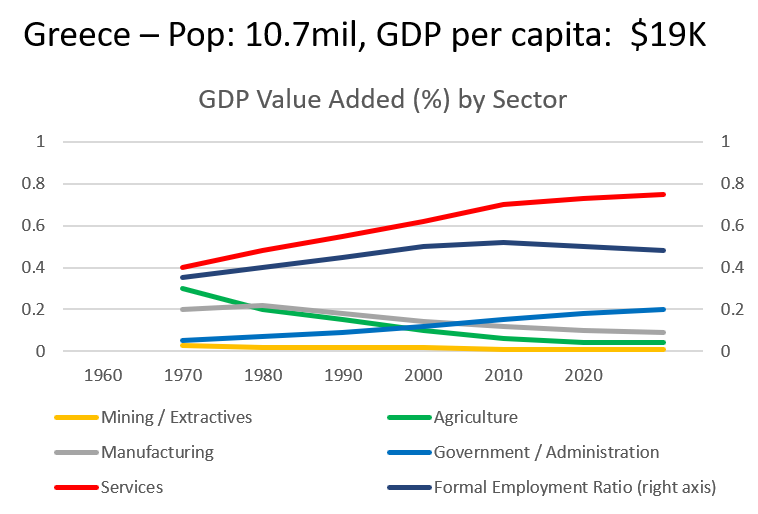
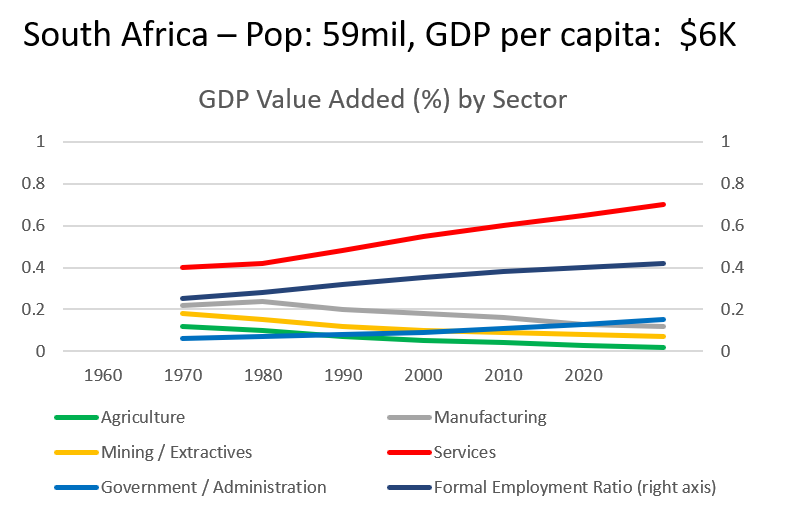
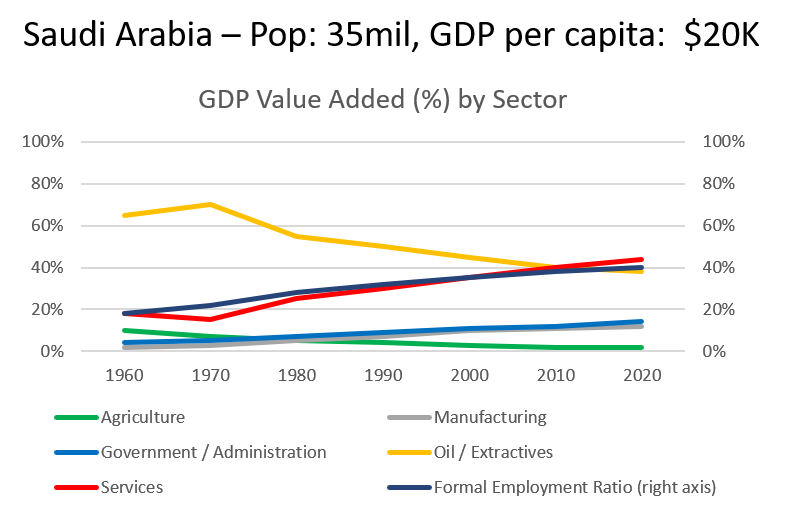
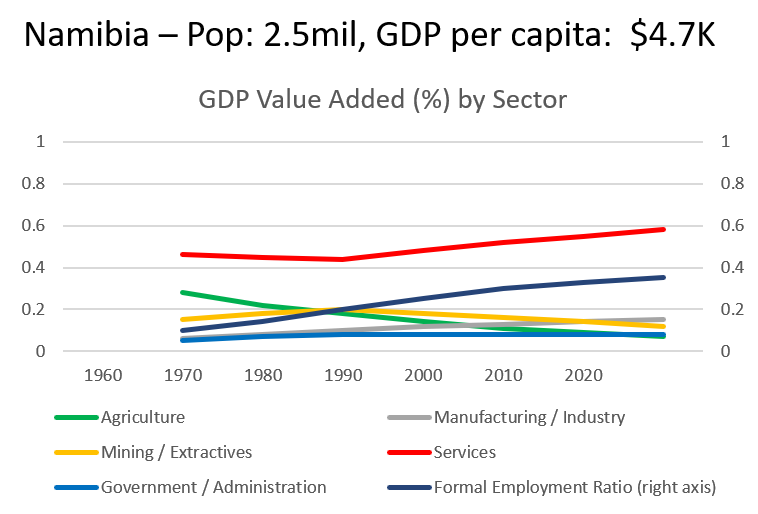
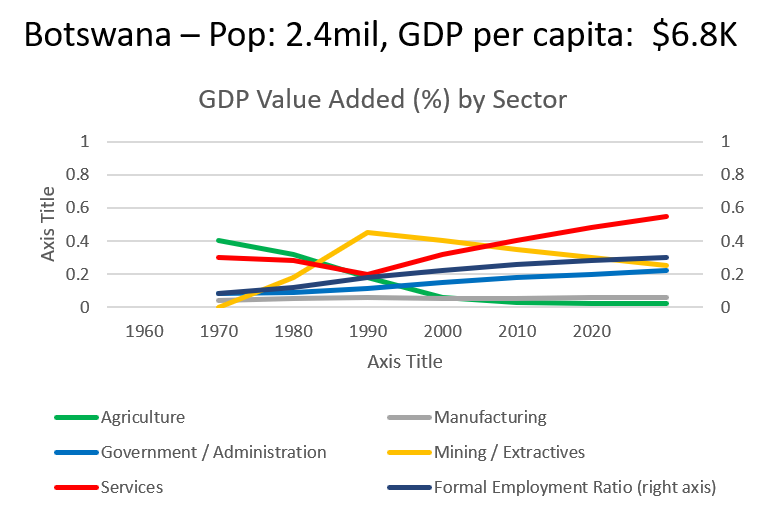
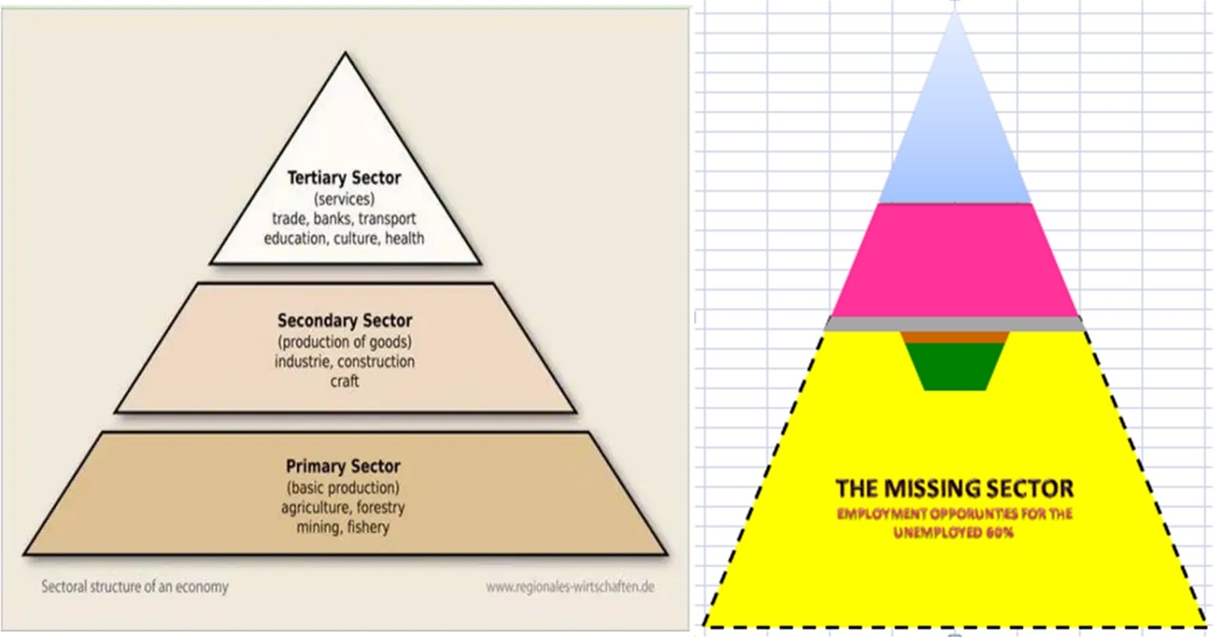
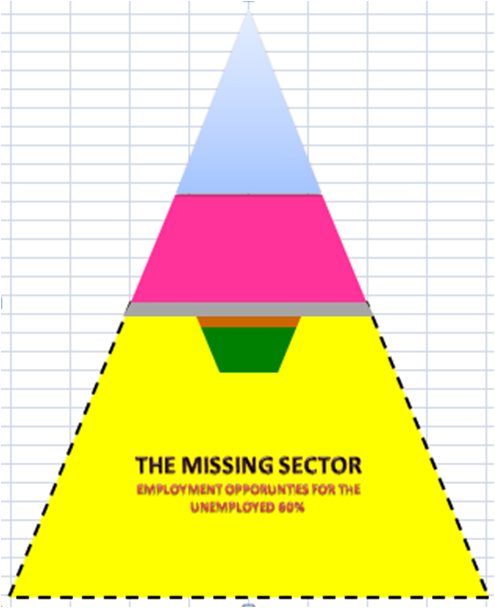

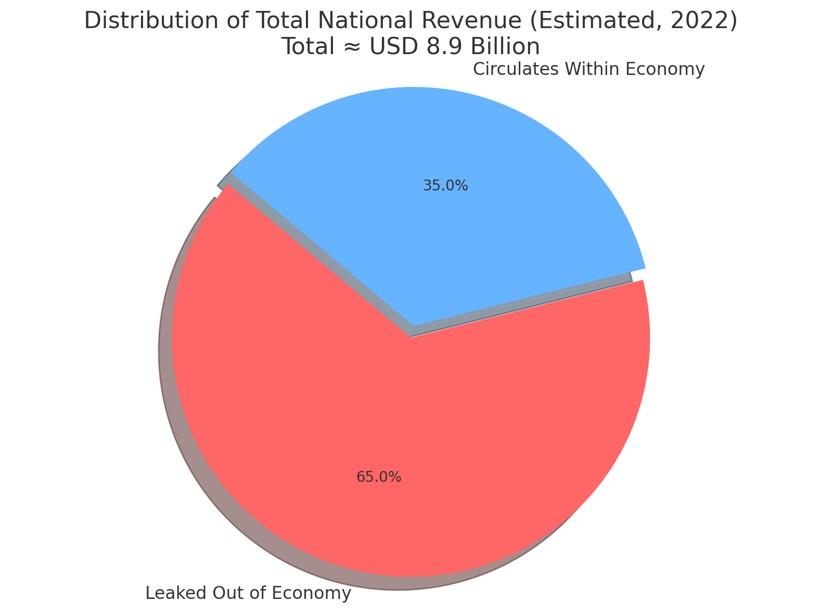


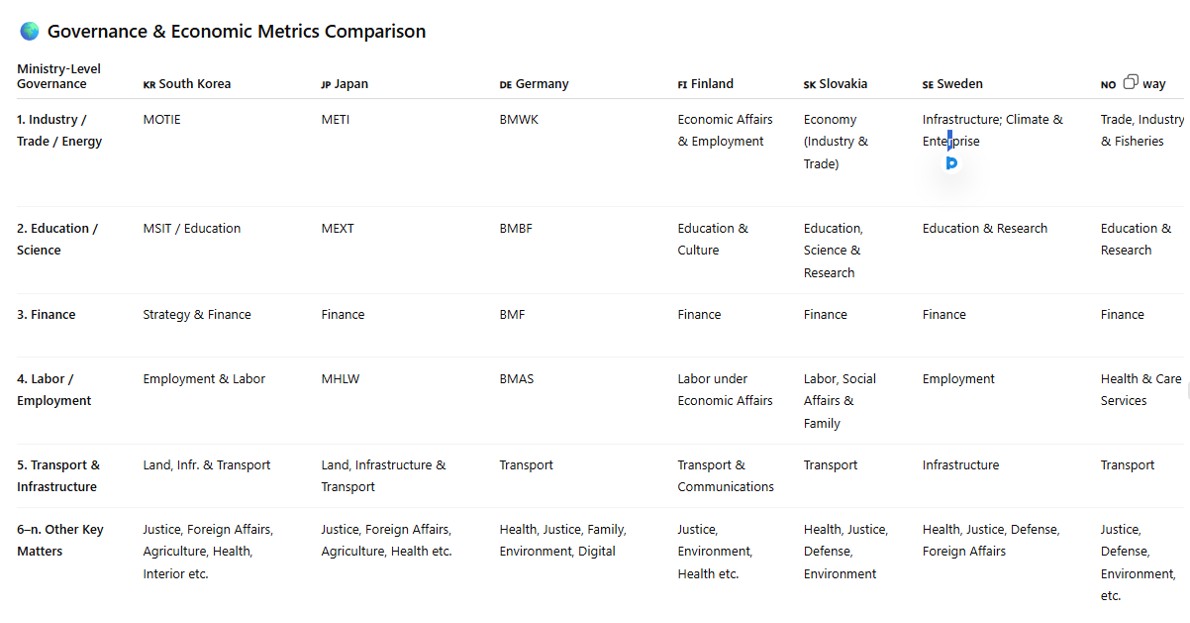
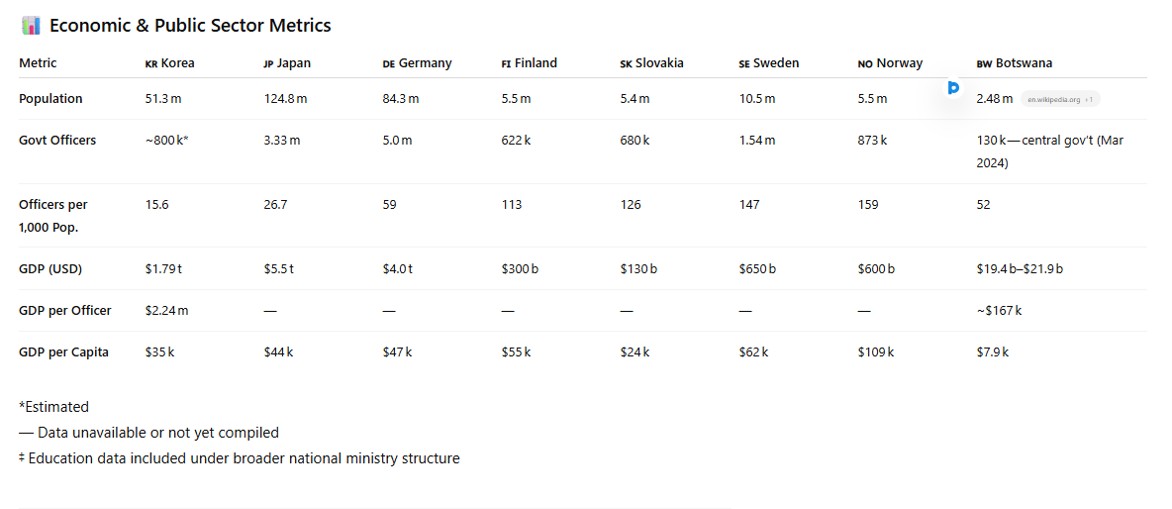


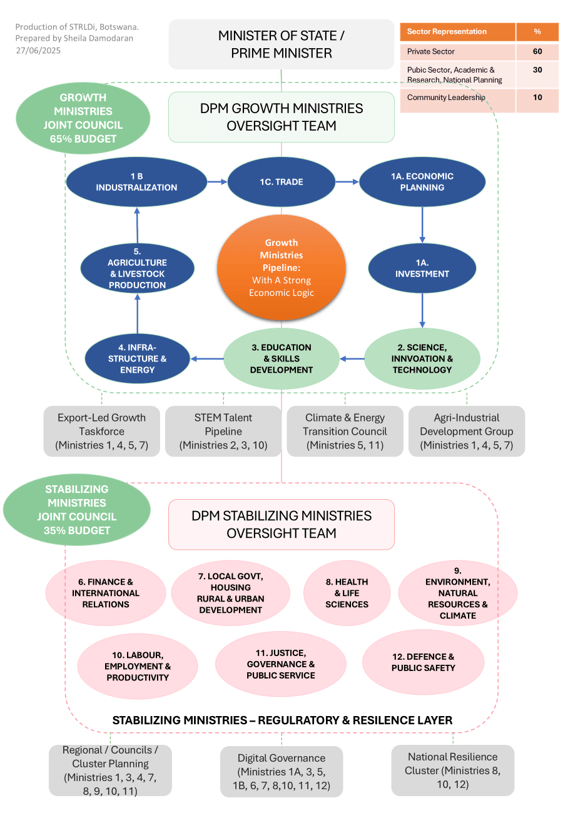
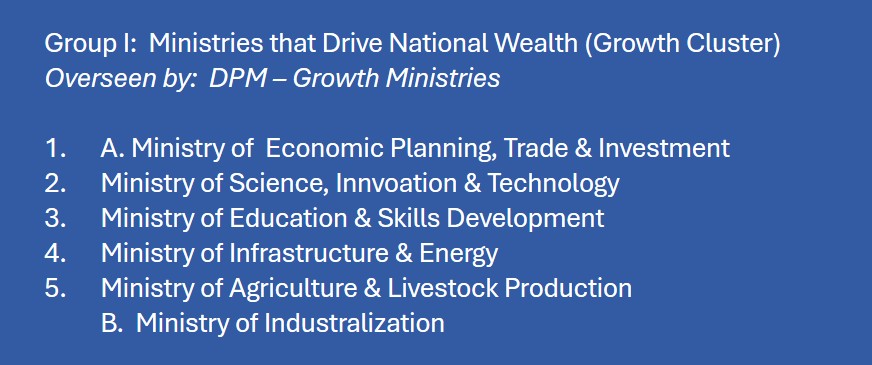


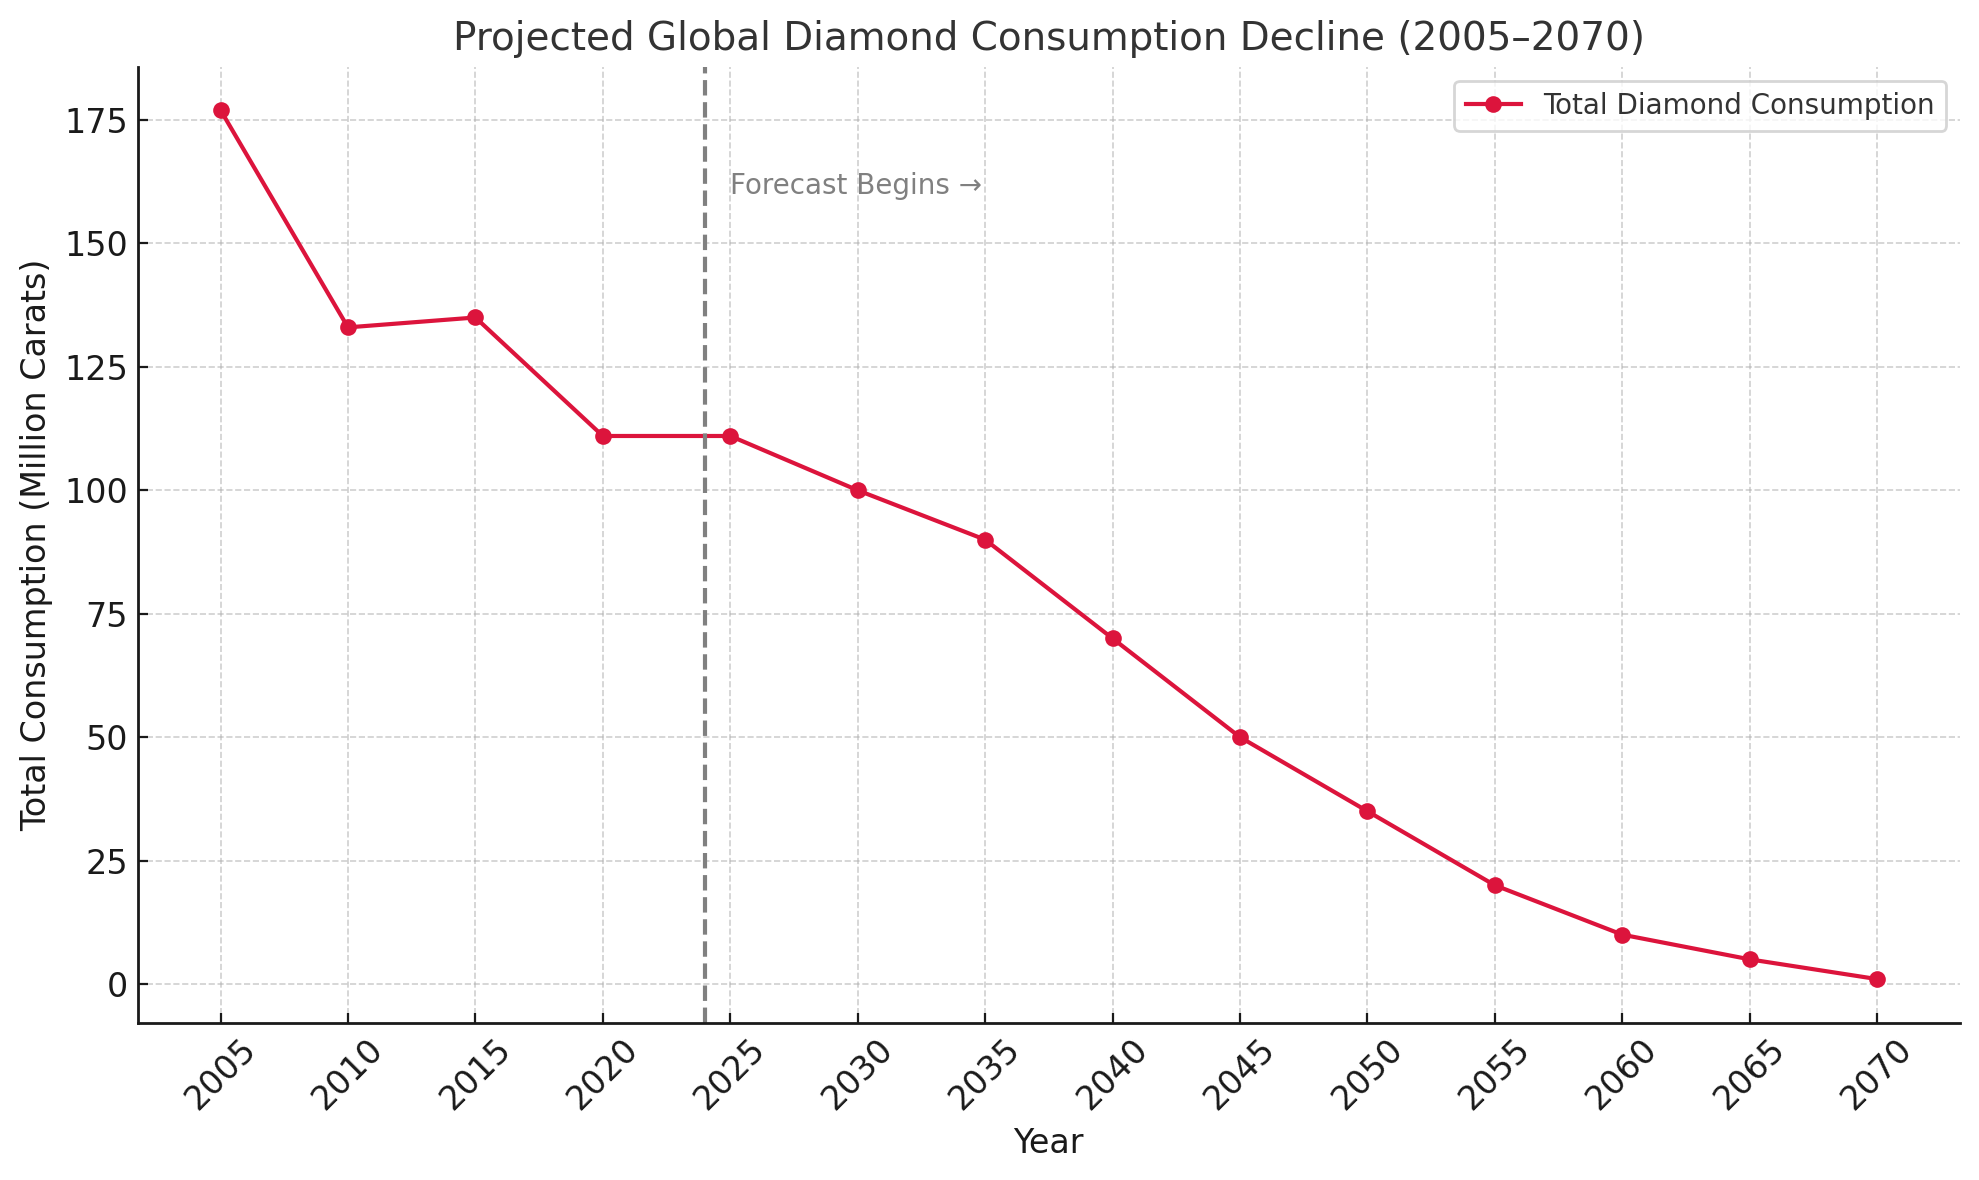
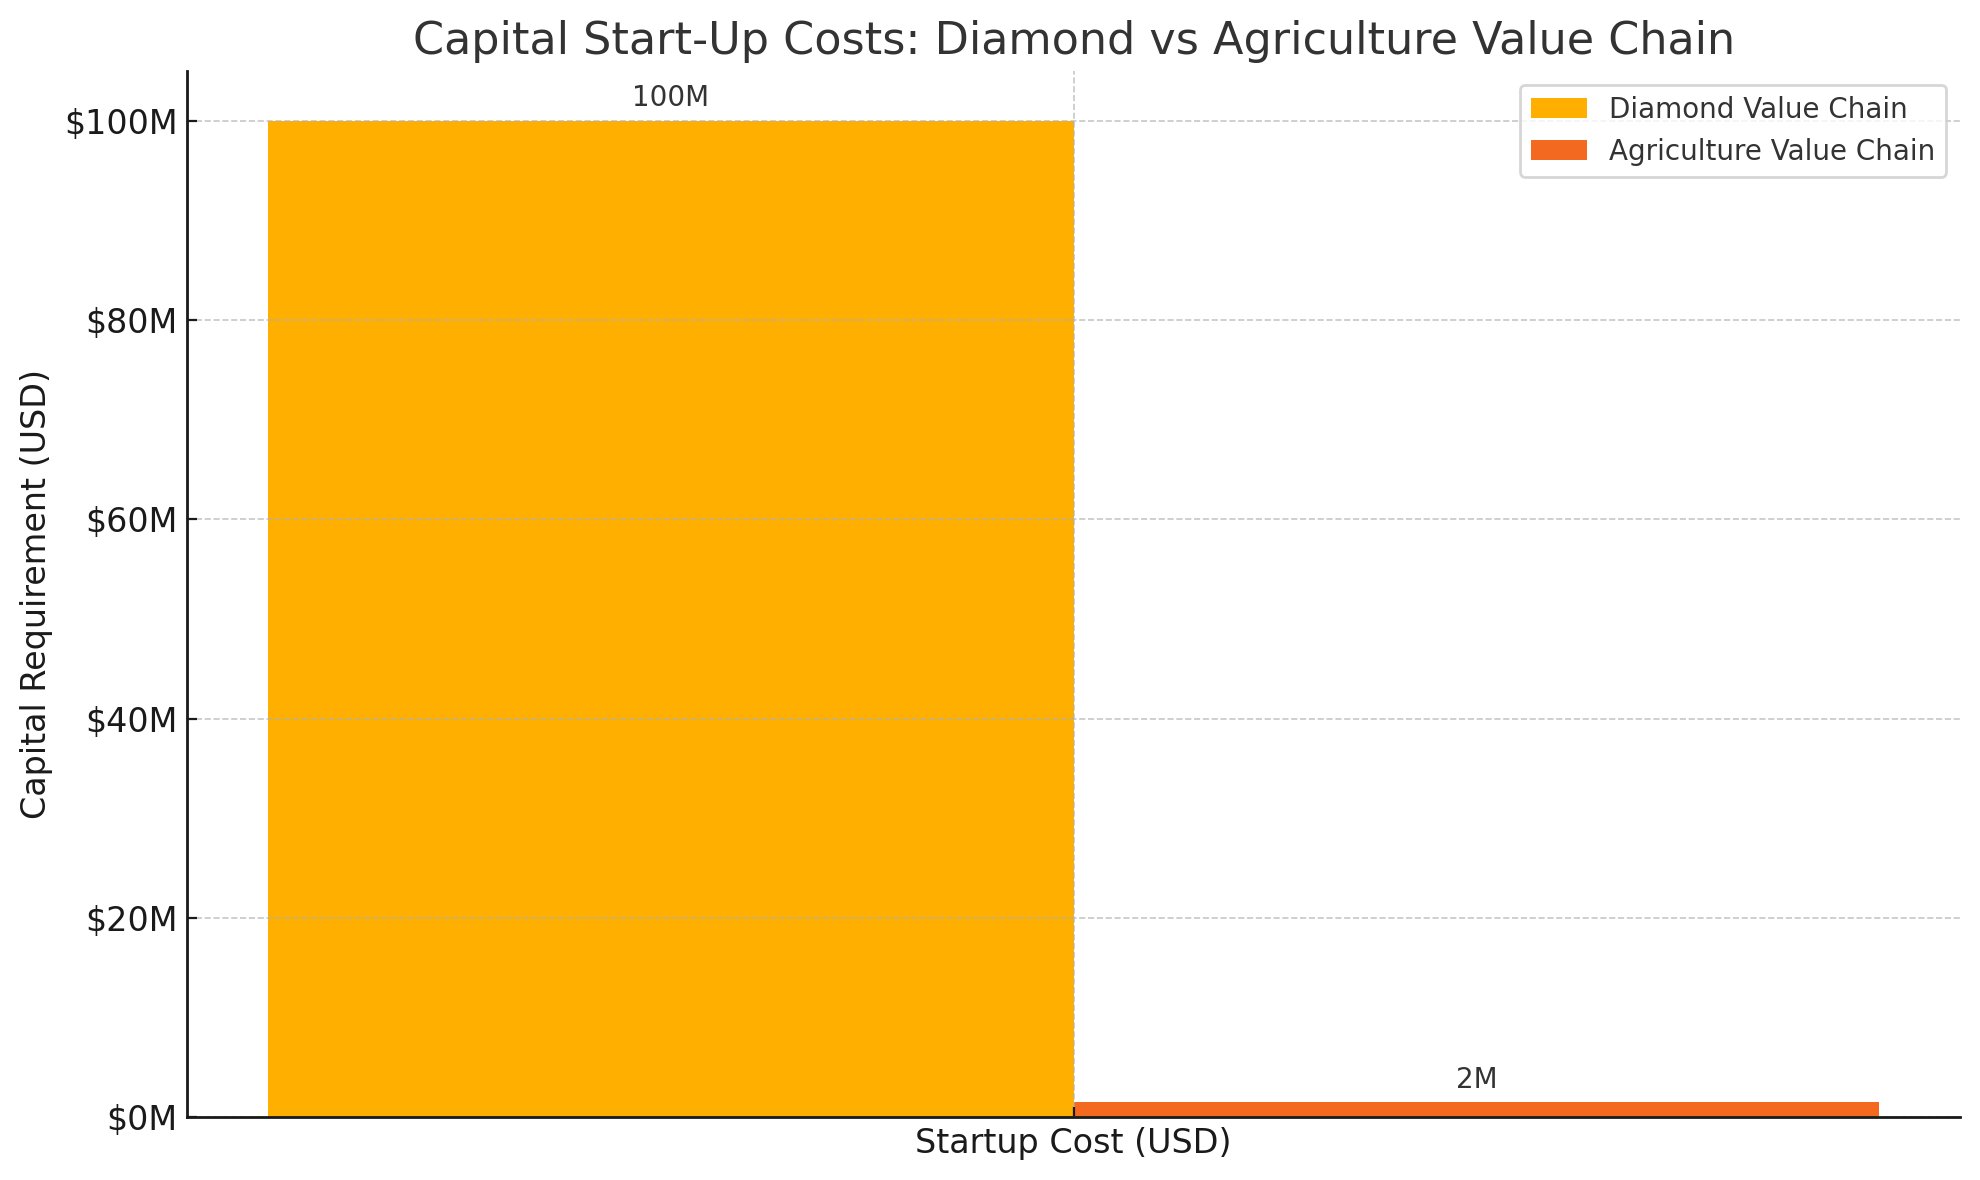

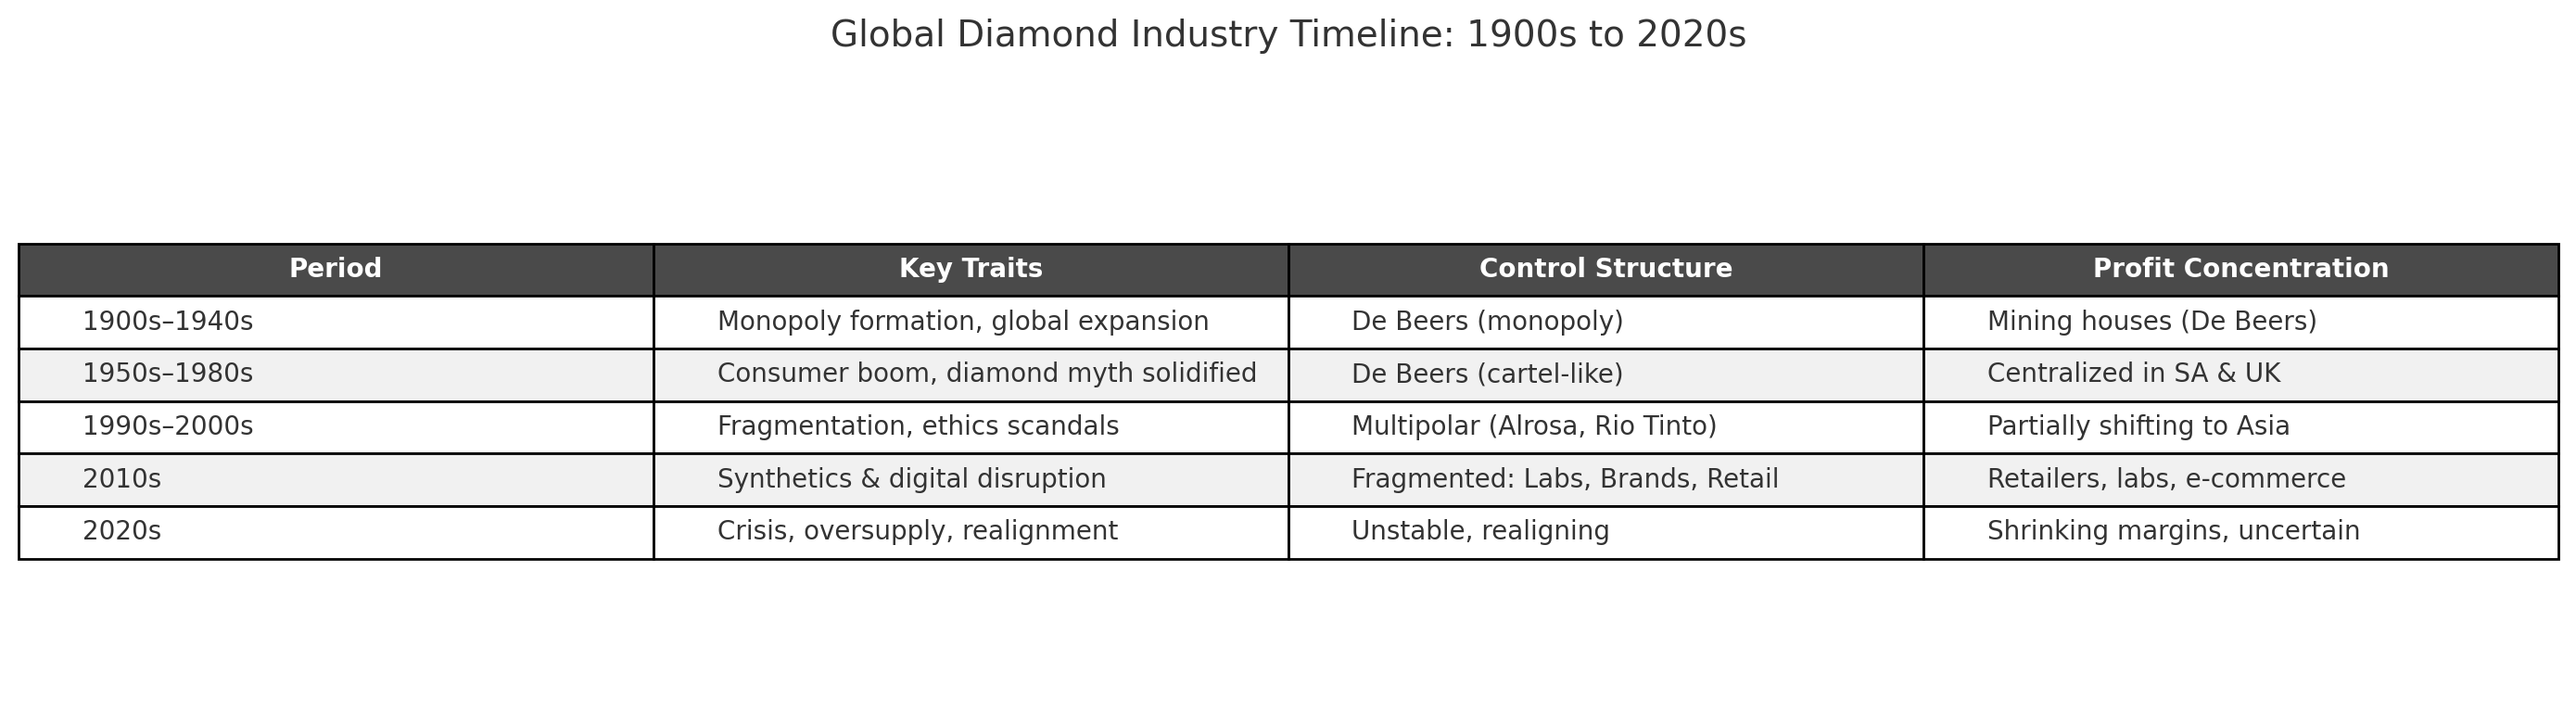
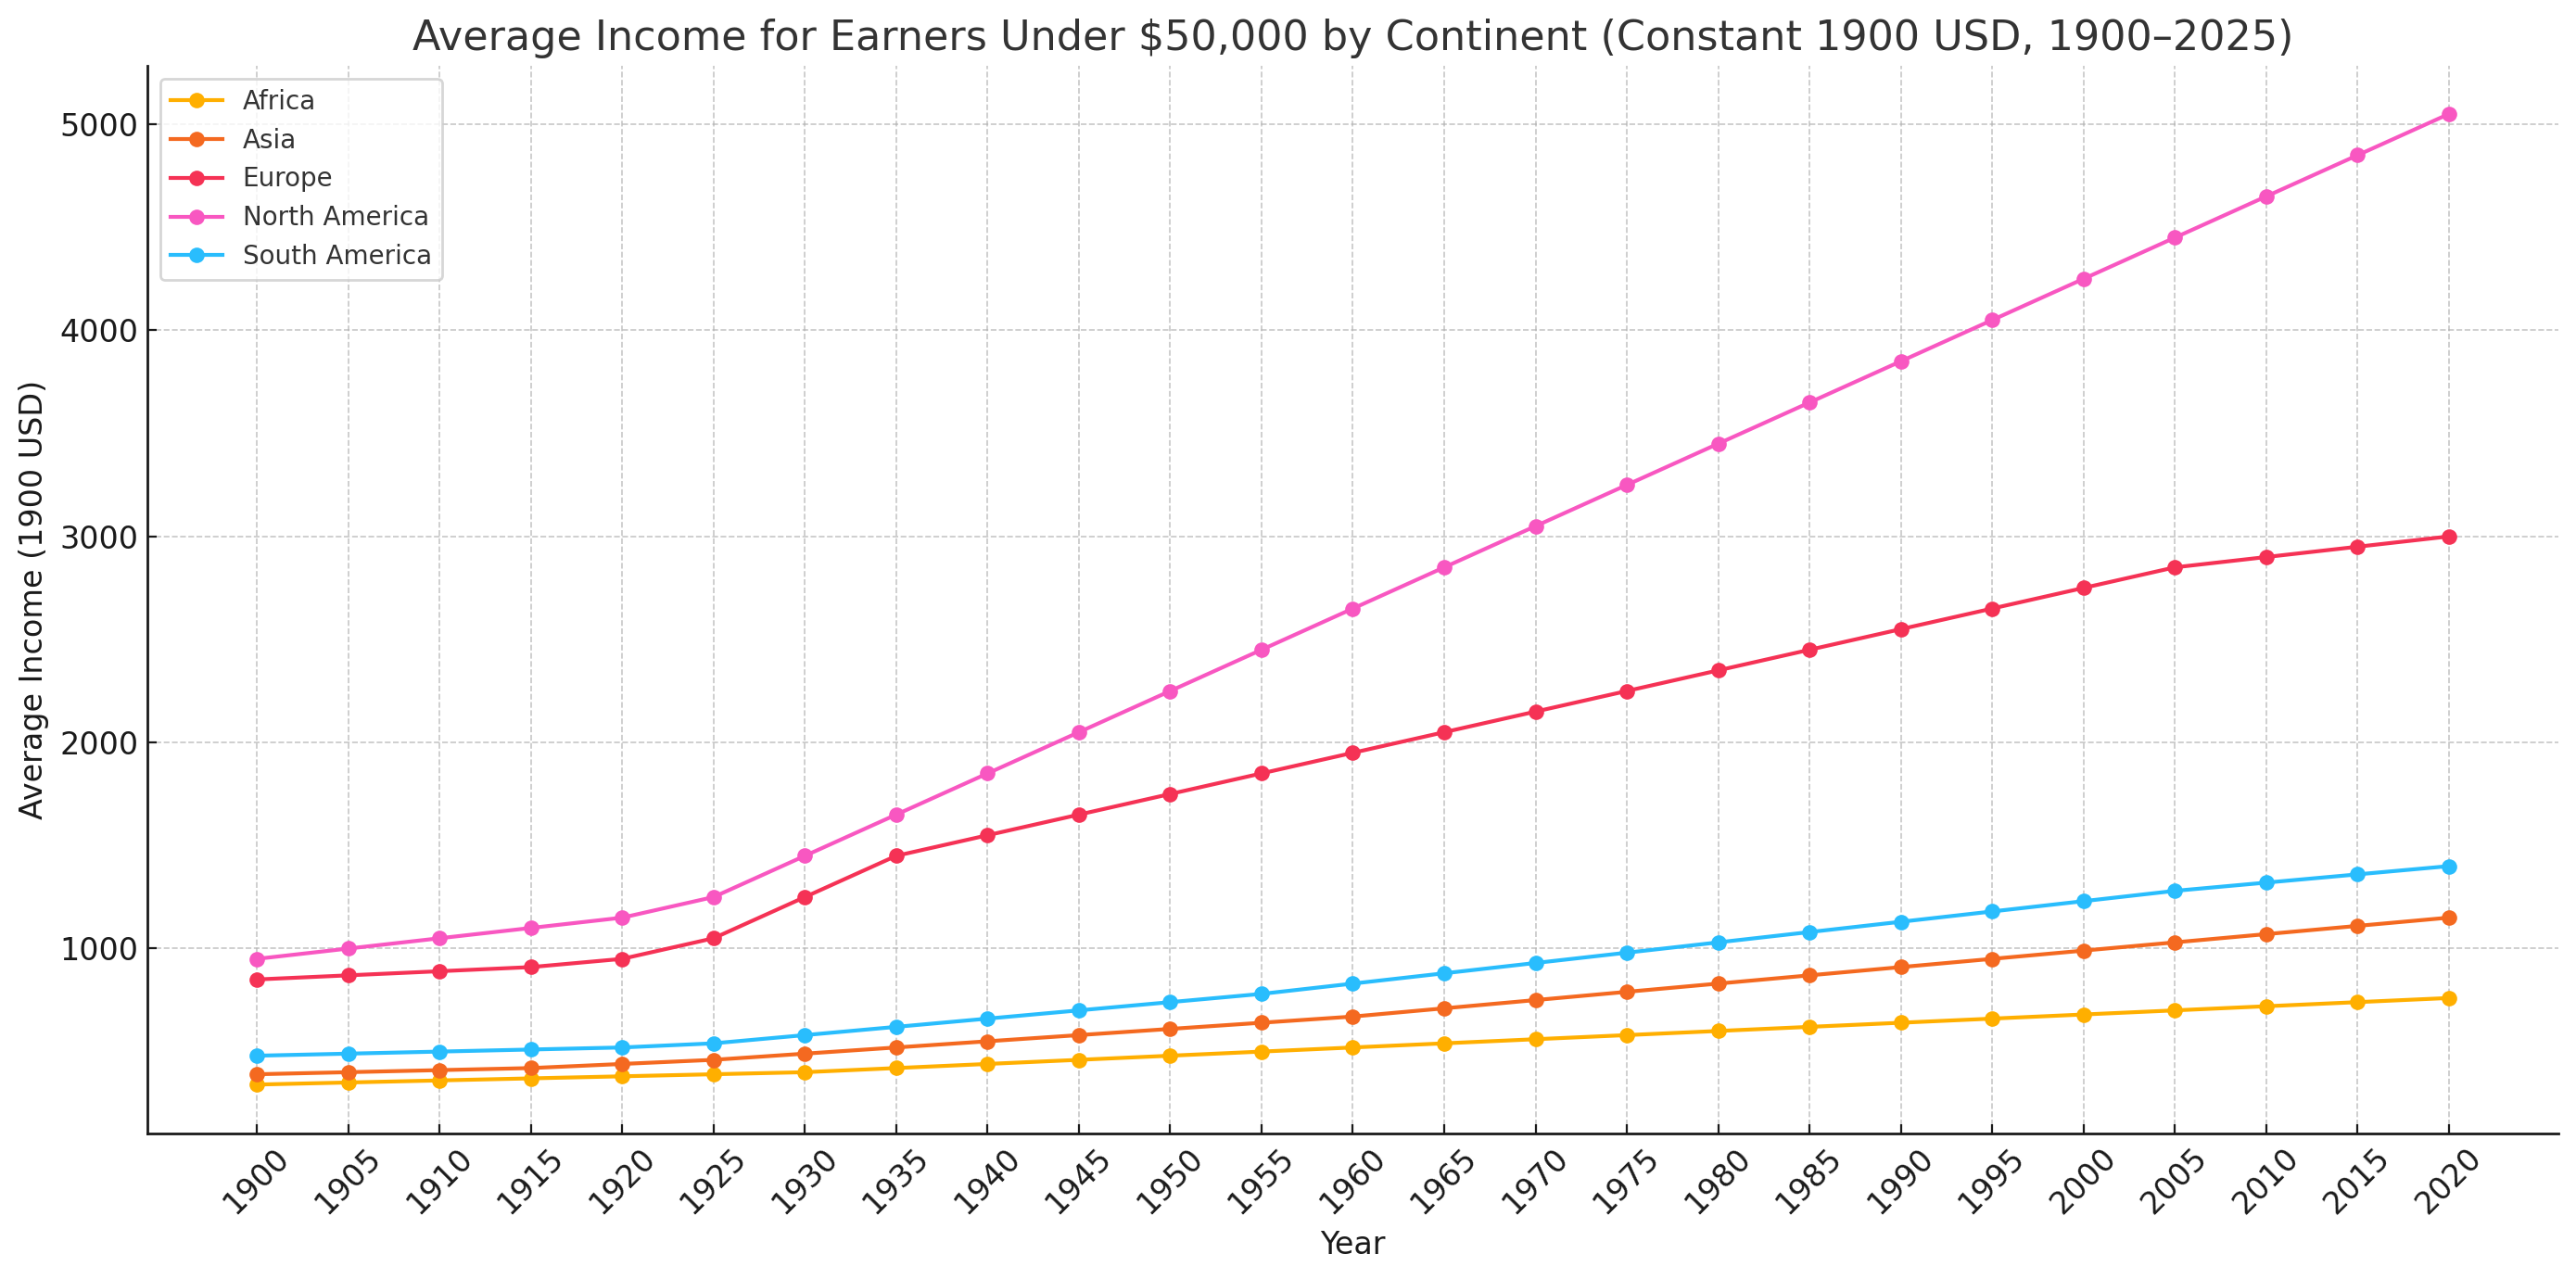
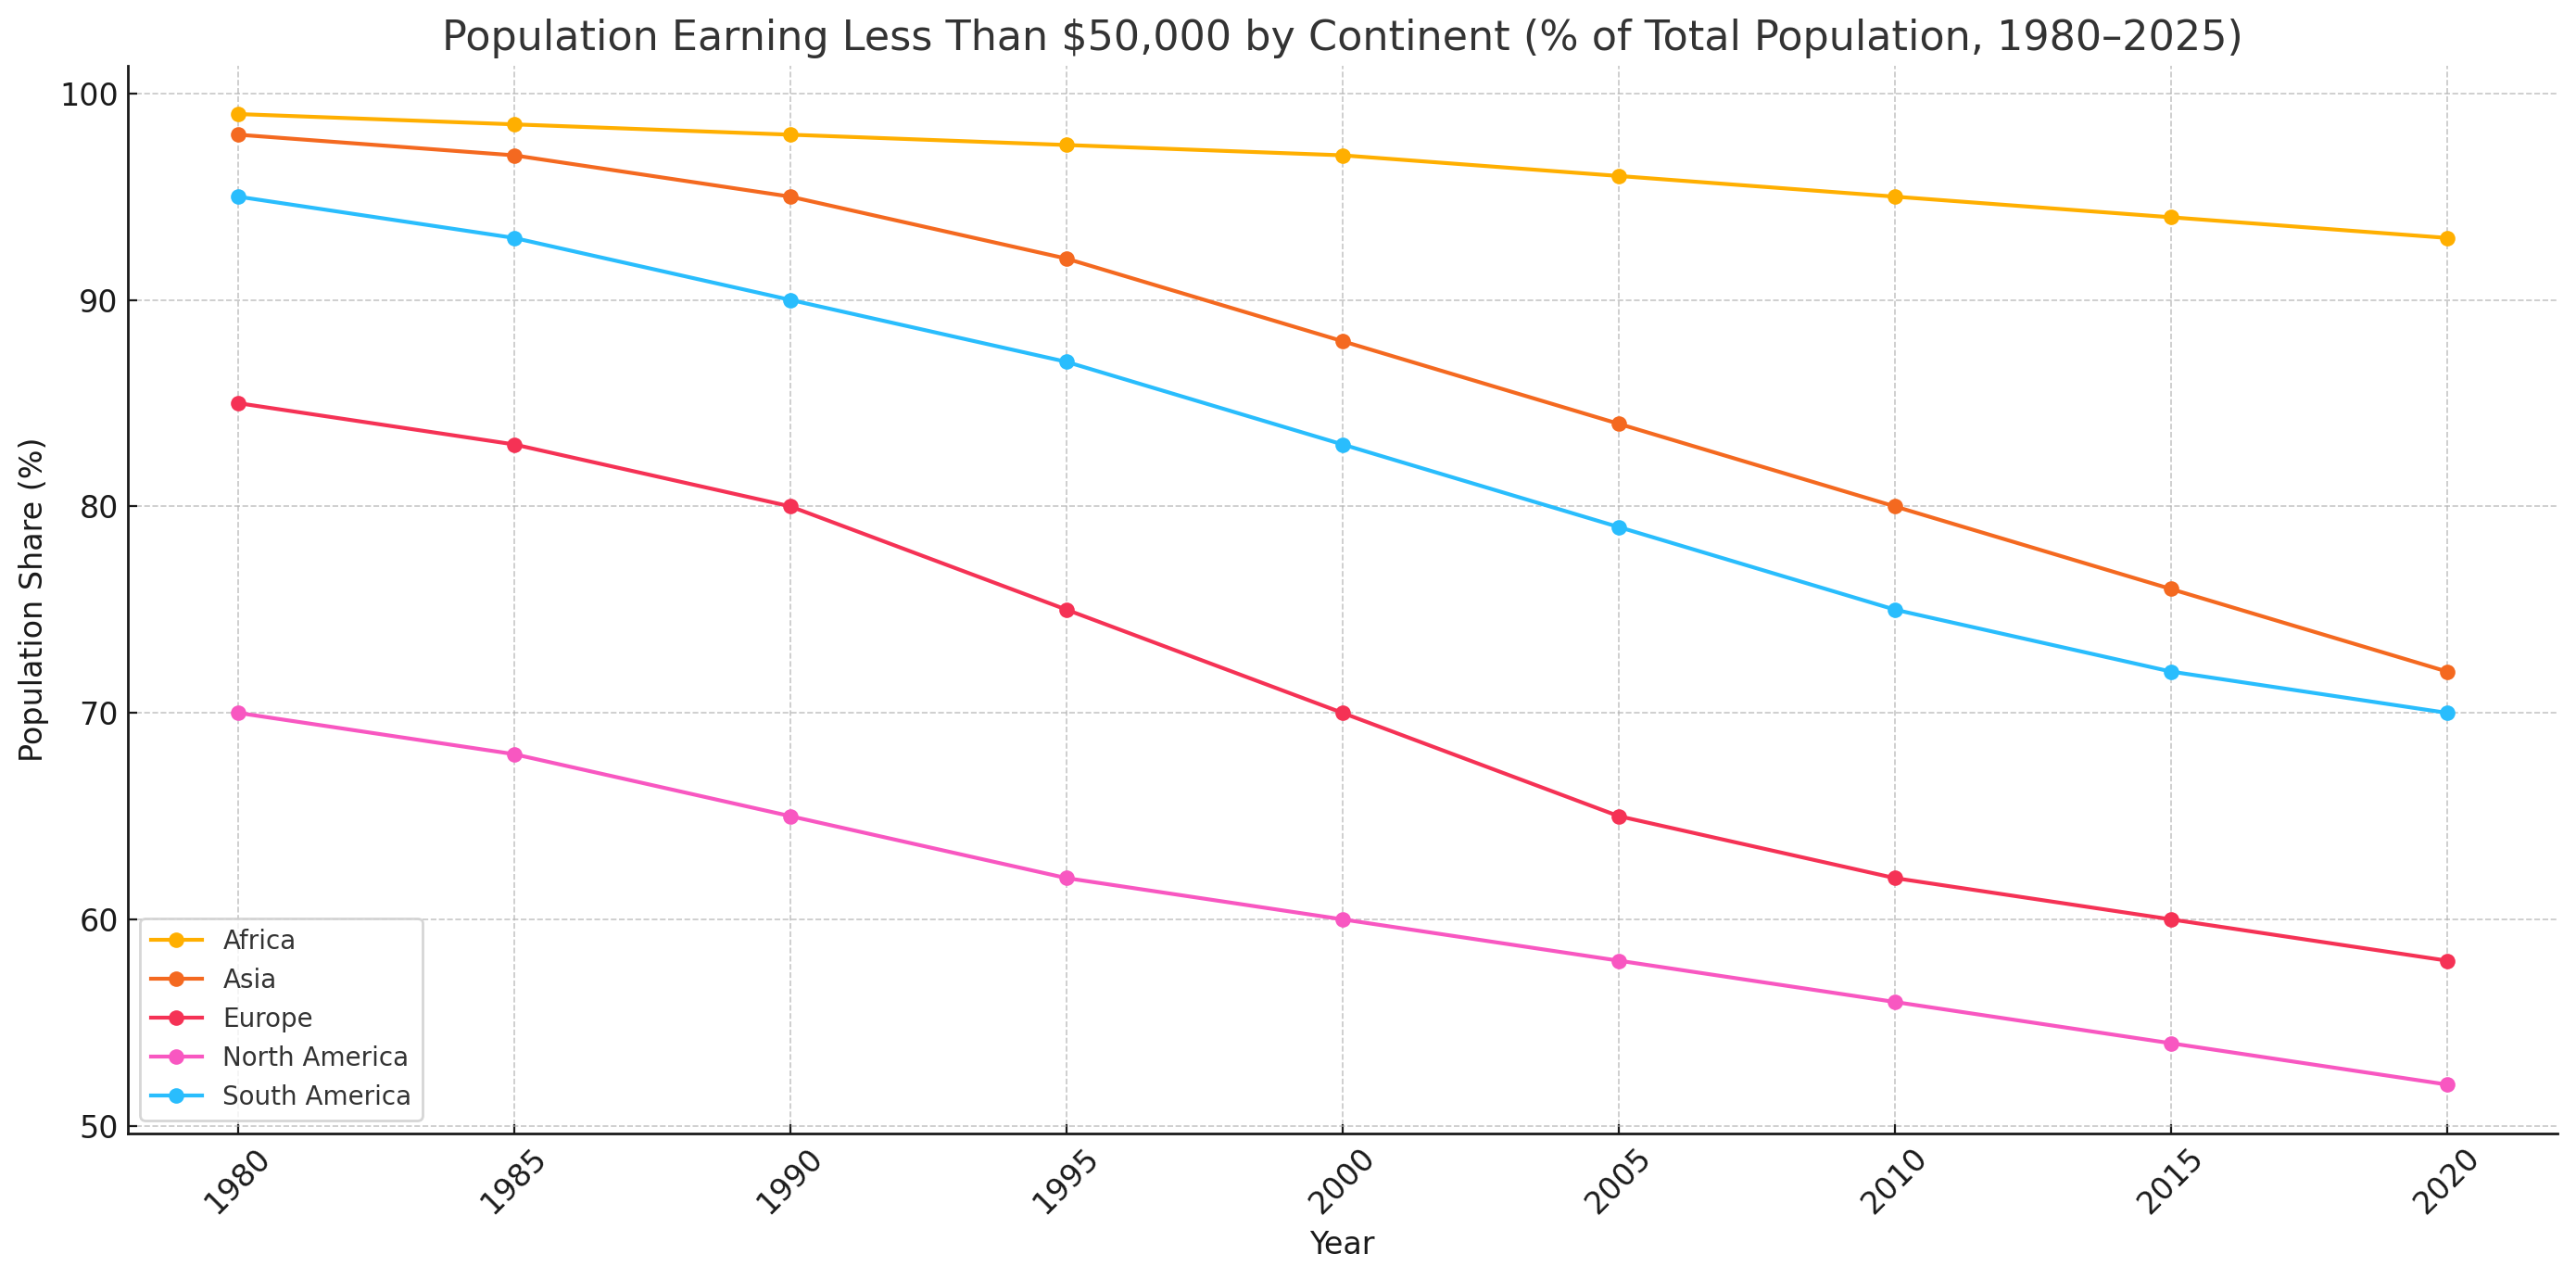


You must be logged in to post a comment.