The Leadership & Institutional Stewardship Pillar exists to ensure that STRLDi remains a disciplined learning institution—one that is strategically guided, professionally managed, financially sustainable and continually strengthened through reflection and learning.
Unlike conventional organisations where administration exists primarily to support operations, this pillar recognises that the Institute itself is one of STRLDi’s most important subjects of study. How decisions are made, how knowledge is captured, how people learn together and how institutional capability grows are all treated as matters of deliberate inquiry.
The pillar therefore carries responsibility not only for governance and organisational management, but also for cultivating the culture, systems and disciplines that allow STRLDi to fulfil its mission over generations.
Its work ensures that the Institute remains coherent in purpose, disciplined in practice and resilient in the face of change.
Stewardship Responsibilities
Leadership & Institutional Stewardship is responsible for:
Providing strategic direction for the Institute.
Safeguarding the institutional vision, values and purpose.
Strengthening organisational capability through continuous learning.
Ensuring sound governance and accountability.
Building organisational systems and operational excellence.
Stewarding financial sustainability and institutional resources.
Protecting the Institute’s intellectual property, reputation and legal integrity.
Cultivating an organisational culture grounded in reflection, learning and innovation.
Institutional Structure
The pillar is organised through five mutually reinforcing offices, each contributing to the long-term health and development of the Institute.
1. Executive Director
Current Steward: Ms Sheila Damodaran
Purpose
The Executive Director provides the overall stewardship of STRLDi, ensuring that every aspect of the Institute remains aligned with its founding purpose and long-term mission.
The role extends beyond executive management. It is responsible for integrating research, leadership, partnerships and institutional learning into one coherent organisational system capable of contributing to national and regional transformation.
The Executive Director serves as the principal custodian of STRLDi’s philosophy, institutional direction and external representation.
Key Responsibilities
Define and steward the Institute’s long-term vision.
Provide executive leadership across all three institutional pillars.
Direct research priorities and strategic initiatives.
Build relationships with governments, development partners, universities and industry leaders.
Lead institutional innovation and organisational development.
Approve major programmes, partnerships and investments.
Represent STRLDi nationally, regionally and internationally.
Ensure the Institute remains faithful to its mission and values.
Key Result Areas
Strategic leadership.
Institutional growth.
Research excellence.
Partnership development.
Organisational sustainability.
National and international reputation.
2. Advisory Council
Status: To be constituted.
Purpose
The Advisory Council exists to strengthen the Institute through independent wisdom, strategic guidance and constructive reflection.
It does not manage STRLDi. Rather, it provides thoughtful counsel to the Executive Director, helping the Institute maintain long-term perspective while remaining responsive to emerging opportunities and challenges.
The Council also serves as a bridge between STRLDi and the wider community of national leaders, researchers, practitioners and development partners.
Key Responsibilities
Provide strategic advice to the Executive Director.
Review institutional priorities and progress.
Offer independent perspectives on emerging issues.
Strengthen organisational credibility.
Introduce strategic opportunities and partnerships.
Encourage long-term institutional thinking.
Key Result Areas
Strategic guidance.
Institutional integrity.
Leadership support.
External credibility.
Long-term organisational resilience.
3. Office of Institutional Learning & Reflection
Current Steward: Rea
Purpose
This office represents one of STRLDi’s defining institutional innovations.
Its responsibility is to ensure that learning is never left to chance.
Every project, meeting, workshop, partnership and research assignment generates experience. Unless that experience is intentionally examined, documented and shared, valuable insight is easily lost.
The Office of Institutional Learning & Reflection ensures that individual experiences become collective knowledge and that collective knowledge becomes enduring institutional capability.
It also serves as the steward of the Institute’s Five Institutional Stewardship Platforms, embedding the disciplines of knowledge, learning, partnership, innovation and systems thinking across all areas of STRLDi.
Key Responsibilities
Facilitate organisational reflection.
Capture institutional learning.
Identify recurring organisational patterns.
Produce learning reviews and institutional insights.
Steward the Five Institutional Stewardship Platforms.
Promote continuous organisational improvement.
Build institutional memory.
Support knowledge sharing across all pillars.
Key Result Areas
Organisational learning.
Institutional memory.
Continuous improvement.
Knowledge integration.
Strengthened organisational capability.
4. Executive Secretariat
Current Steward: Rea
Purpose
The Executive Secretariat provides the coordination discipline that enables effective institutional leadership.
By ensuring that meetings are purposeful, decisions are documented and commitments are followed through, the Secretariat creates the organisational coherence required for a learning institution to function effectively.
Its work extends beyond administration. It enables organisational rhythm, accountability and continuity.
Key Responsibilities
Coordinate executive meetings.
Prepare agendas and documentation.
Record decisions and institutional commitments.
Monitor action plans.
Coordinate Executive Director correspondence.
Support Advisory Council operations.
Maintain institutional records.
Key Result Areas
Governance effectiveness.
Executive coordination.
Decision tracking.
Organisational discipline.
Institutional continuity.
5. Corporate Operations & Services
Future Appointment
Purpose
Corporate Operations & Services provides the operational foundation upon which STRLDi’s mission is sustained.
Its role is to ensure that organisational systems, financial resources, people, technology and administrative processes function efficiently, ethically and professionally.
Rather than being viewed as a support function alone, Corporate Operations is recognised as an essential contributor to institutional resilience and long-term sustainability.
Core Functions
Human Resources
Building organisational capability through recruitment, performance development, wellbeing and professional growth.
Finance & Financial Stewardship
Managing budgeting, financial reporting, revenue, investments and long-term financial sustainability.
Administration
Providing administrative systems, facilities management and operational coordination.
Procurement
Ensuring transparent, efficient and accountable acquisition of goods and services.
Information & Digital Services
Supporting information technology, cybersecurity, digital platforms and organisational systems.
Leadership & Institutional Stewardship is not separate from the Institute’s work; it is the mechanism through which that work remains coherent and sustainable.
The Executive Director provides strategic direction.
The Advisory Council strengthens long-term institutional thinking.
The Office of Institutional Learning & Reflection ensures that knowledge generated through every engagement contributes to organisational capability.
The Executive Secretariat translates decisions into coordinated action.
Corporate Operations & Services provides the systems, resources and governance that enable the Institute to function effectively.
Together, these offices create the conditions under which STRLDi can continually increase its capacity to understand persistent issues, develop leaders, build partnerships and contribute meaningfully to national and regional transformation.
Key Result Areas of the Pillar
The Leadership & Institutional Stewardship Pillar will be considered successful when it consistently:
Stewards STRLDi’s vision, values and institutional purpose.
Builds a financially sustainable and professionally managed Institute.
Strengthens organisational capability through disciplined learning and reflection.
Maintains effective governance, accountability and ethical practice.
Protects the Institute’s knowledge, reputation and intellectual assets.
Develops organisational systems that enable excellence across all three pillars.
Ensures that STRLDi remains an enduring learning institution capable of serving future generations.
Organising Management Knowledge by Purpose and Depth of Seeing
Ms Sheila Damodaran
Management literature contains thousands of tools, frameworks, methodologies, standards, and practices designed to help organisations perform, improve, govern, adapt, and grow. These tools are typically organised by professional discipline—finance, operations, strategy, quality, human resources, information technology, or project management. While useful for specialists, such classifications often make it difficult for leaders to understand how these tools contribute to the broader task of organisational learning and transformation.
At the same time, many organisations possess an impressive collection of management tools and yet continue to struggle with persistent issues that repeatedly return in different forms. They measure performance, monitor risk, improve quality, manage projects, control costs, and coordinate operations with increasing sophistication. The challenge is rarely a lack of tools. More often, it is a lack of clarity about what those tools help us see.
This framework takes a different approach. Instead of organising tools by profession, it organises them first by purpose and then by the depth of seeing they enable. The purpose categories reflect the primary work of organisations. Together, they describe the full journey of organisational life—from understanding reality, through action and adaptation, toward long-term renewal.
The Nine Purposes of Management
Level 1 – See
Every organisation must first develop the capacity to observe reality. Seeing includes monitoring performance, understanding conditions, recognising trends, identifying risks, and developing situational awareness. Without seeing, all other activities are based on assumption rather than evidence.
The central question is:
What is happening?
Level 2 – Develop People
Organisations achieve results through people. This level focuses on building capability, leadership, competence, judgement, and learning capacity. It includes recruitment, training, coaching, mentoring, and the cultivation of personal mastery.
The central question is:
Who are we becoming?
Level 3 – Align
Individual effort becomes organisational capability only when people move in a common direction. Alignment creates coherence between purpose, strategy, teams, and stakeholders. It transforms separate activities into collective action.
The central question is:
How do we move together?
Level 4 – Decide
Every organisation faces choices about priorities, investments, risks, trade-offs, and future direction. Decision-making determines where attention, resources, and energy will be focused.
The central question is:
What should we do?
Level 5 – Execute
Execution converts intentions into action. This includes project delivery, operational management, process execution, scheduling, coordination, and the day-to-day work of producing results.
The central question is:
How do we get things done?
Level 6 – Govern & Measure
Organisations must maintain accountability, stewardship, transparency, and control. Governance ensures that actions remain aligned with obligations, standards, responsibilities, and performance expectations.
The central question is:
Are we doing what we said we would do?
Level 7 – Improve
Improvement focuses on increasing effectiveness, efficiency, quality, reliability, and performance. It seeks to reduce waste, strengthen capability, and enhance outcomes through disciplined learning from experience.
The central question is:
How can we do this better?
Level 8 – Adapt
Conditions change. Markets shift. Technologies evolve. Societies transform. Adaptation enables organisations to respond to emerging realities while maintaining relevance and resilience.
The central question is:
What must change?
Level 9 – Renew
Renewal focuses on long-term viability. It concerns the organisation’s ability to regenerate leadership, knowledge, purpose, capability, and direction across time. Renewal ensures that today’s success does not become tomorrow’s limitation.
The central question is:
How do we remain capable of creating value into the future?
Depth of Learning
While the nine levels describe why a tool exists, a second dimension describes how deeply that tool helps us understand reality.
Drawing on the learning disciplines of The Fifth Discipline, tools can contribute to one or more of five levels of seeing:
Level
Question
Event
What happened?
Pattern
What keeps happening?
Structure
What archetypal causal structure is producing the pattern?
Mental Models
What assumptions and beliefs sustain the structure?
Vision
What future are we collectively trying to create?
Most management tools help organisations observe and manage events. Some help leaders recognise patterns over time. A much smaller number help reveal the archetypal structures that generate those patterns. Fewer still help surface mental models or cultivate shared vision.
The tables that follow organise management tools according to both dimensions: their organisational purpose and their depth of seeing.
Reading the Tables
The ticks indicate the primary depth of seeing naturally enabled by a tool. They do not imply that a tool cannot be used more deeply by a skilled practitioner. Rather, they indicate where the tool most naturally contributes to learning and action.
In this framework, Structure refers exclusively to archetypal causal structure—the reinforcing and balancing processes, delays, accumulations, and systemic dynamics that generate behaviour over time. It does not refer to organisational structures, reporting relationships, governance arrangements, methodologies, frameworks, or management systems.
This distinction is important because the framework is grounded in the learning disciplines of The Fifth Discipline. Its purpose is not merely to organise management knowledge, but to help leaders understand how different tools contribute to increasingly deeper levels of seeing, learning, and transformation.
Depth of Learning
because what distinguishes The Fifth Discipline is not seeing alone.
It is the organisation’s capacity to learn from what it sees. That subtle shift brings the framework even closer to Senge’s original intent.
LEVEL 1 — SEE
Domain
Tool
Event
Pattern
Structure
Mental Models
Vision
Finance
Balance Sheet
✓
Finance
Income Statement
✓
Finance
Cash Flow Trend
✓
Operations
KPI Dashboard
✓
Operations
Trend Analysis
✓
Quality
Control Charts
✓
Strategy
SWOT
✓
Strategy
PESTLE
✓
Systems Thinking
BOT Graphs
✓
✓
LEVEL 2 — DEVELOP PEOPLE
Domain
Tool
Event
Pattern
Structure
Mental Models
Vision
HR
Training Programmes
✓
HR
Competency Frameworks
✓
✓
Leadership
Coaching
✓
Leadership
Mentoring
✓
Learning
Reflective Practice
✓
Learning
Personal Mastery
✓
✓
Learning
Dialogue
✓
✓
LEVEL 3 — ALIGN
Domain
Tool
Event
Pattern
Structure
Mental Models
Vision
Strategy
Balanced Scorecard
✓
✓
Strategy
Strategy Maps
✓
✓
Leadership
Shared Vision
✓
✓
Leadership
Vision Deployment
✓
Learning
Team Learning
✓
✓
Stakeholder
Stakeholder Mapping
✓
✓
LEVEL 4 — DECIDE
Domain
Tool
Event
Pattern
Structure
Mental Models
Vision
Strategy
Scenario Planning
✓
✓
✓
Finance
Cost-Benefit Analysis
✓
Risk
Risk Assessment
✓
✓
Systems Thinking
System Archetypes
✓
Systems Thinking
Onion Model
✓
✓
✓
Systems Thinking
CLDs
✓
LEVEL 5 — EXECUTE
Domain
Tool
Event
Pattern
Structure
Mental Models
Vision
Projects
PMBOK
✓
Projects
Gantt Charts
✓
Projects
RAID Logs
✓
Operations
SOPs
✓
Operations
Kanban
✓
✓
Projects
Agile
✓
✓
Operations
Scheduling Systems
✓
LEVEL 6 — GOVERN & MEASURE
Domain
Tool
Event
Pattern
Structure
Mental Models
Vision
Finance
Budgeting
✓
✓
Finance
Forecasting
✓
Risk
Risk Register
✓
Risk
Audit
✓
Governance
Compliance Systems
✓
Governance
Internal Controls
✓
Governance
Board Reporting
✓
✓
LEVEL 7 — IMPROVE
Domain
Tool
Event
Pattern
Structure
Mental Models
Vision
Quality
Six Sigma
✓
✓
Quality
DMAIC
✓
✓
Operations
Lean
✓
✓
Operations
Kaizen
✓
✓
✓
Learning
After Action Reviews
✓
✓
✓
Quality
Root Cause Analysis
✓
✓
LEVEL 8 — ADAPT
Domain
Tool
Event
Pattern
Structure
Mental Models
Vision
Change
ADKAR
✓
✓
✓
Change
Kotter
✓
✓
✓
Strategy
Strategic Foresight
✓
✓
Systems Thinking
Leverage Point Analysis
✓
✓
Leadership
Adaptive Leadership
✓
✓
✓
✓
LEVEL 9 — RENEW
Domain
Tool
Event
Pattern
Structure
Mental Models
Vision
Learning
Learning Organisation
✓
✓
✓
✓
HR
Succession Planning
✓
✓
✓
Knowledge
Communities of Practice
✓
✓
✓
Knowledge
Knowledge Management
✓
✓
✓
Leadership
Stewardship
✓
✓
Systems Thinking
Fifth Discipline
✓
✓
✓
✓
Immediate observation
When classified this way:
Most traditional management tools cluster in Event.
A smaller number reach Pattern.
Very few genuinely reach Structure.
Mental Models is dominated by Fifth Discipline disciplines rather than conventional management tools.
Vision is populated mostly by leadership and strategy tools.
This is probably the first clue that the table is not merely cataloguing management methods. It is revealing where management as a field has historically invested its attention.
And that, in turn, may explain why organisations become highly capable of managing events while remaining relatively weak at understanding the archetypal structures that generate them.
Every organization believes its problem is capacity.
There are never enough hands, hours, or funds.
And yet, each time new resources arrive, the shortage returns — louder than before.
What if “not enough manpower” is not a fact but a structure?
A loop that feeds on how we define effort, competence, and worth.
This case explores the fatigue of systems that mistake busyness for strength.
It asks: when we plead for more resources, are we revealing scarcity — or creating it?
📖 BEFORE YOU READ
Every manager has heard it: “We just don’t have enough people.”
And most respond with the only answer they know — request another post, extend another contract, add another unit.
For a moment, the pressure eases.
Then, almost predictably, the system returns to the same refrain: not enough.
This second study in the STRLDi System Archetype Compendium turns the spotlight inward. It invites leaders to look not at the size of their workforce, but at the structure of their attention.
Because sometimes, what drains capacity is not the number of people working, but how the organisation thinks about work itself.
1 Context and Origins
The complaint of not enough manpower surfaced repeatedly across divisions.
Officers spoke of being stretched thin; supervisors lamented high turnover; HR cited budget ceilings.
Yet, even after multiple recruitment rounds, the pattern refused to change.
The department was caught in a cycle:
hire more → overwork the keen → lose the best → rehire → repeat. The harder it tried to fix the shortage, the deeper the shortage seemed to run.
STRLDi’s analysis revealed a classic Fixes That Fail loop, with an inner twist — a shift from procedural competence (detailed complexity) to systemic blindness (dynamic complexity).
2 Behaviour Over Time
Law #1 – Today’s Problems Come from Yesterday’s Solutions
Each new recruitment was celebrated as relief.
But soon, workloads grew to match expanded capacity.
A nation of institutions trapped in detailed complexity will always feel under-staffed.
The cure is not mass hiring, but systemic sight.
When leaders learn to see patterns, they release both human energy and national capacity.
Manpower turns into mind-power.
The true resource multiplies by awareness.
Vision of the Future Reality: A workplace where capacity is consciousness — and where the ability to see the system is the new definition of strength.
Fixes-That-Fail (Variant)
LEFT-HAND PAGE – Analysis & Reflection
Header
When busyness becomes a badge of competence, the organisation hires itself into exhaustion.
Top Section – Leadership Mirror
A full-width grey box containing the mirror paragraph. A small inset quote in italics:
“Every system is perfectly designed to get the results it gets.”
Preamble – Before You Read
Placed below the mirror, using a light background tone. Accompanied by a small inset BOT diagram (Before Leverage) in the top-right corner.
Main Narrative Body
Two columns. The left column opens with:
1–5: Context, Behaviour Over Time, Structure, Mental Models, Current Reality Vision. The right column continues with:
6–9: Leverage, Uncle’s Act, Behaviour After Leverage, Future Reality Vision.
A thin vertical line separates narrative from marginalia.
Margin Notes (right margin of both pages)
Small annotations in blue text boxes referencing the Laws of Dynamic Complexity as they appear:
#1 Today’s problems come from yesterday’s solutions
#7 Faster is slower
#8 Small changes produce big results
These act as navigational anchors for readers scanning the page.
Footer – Coda
A final blue band carrying your signature line:
Vision of the Future Reality A workplace learns to become a place and opportunity where capacity is consciousness — and where the ability to see the system is the new definition of strength.
Based on the Vision Deployment Matrix™ created by Dr Daniel H. Kim, first published in The Systems Thinker, Vol. 6 No. 1 (1995). Framework adapted by STRLDi for applied national systems learning.
Public servants regulate differently when they understand scale, causality, and systems. This understanding impacts agriculture, manufacturing, and national governance.
This is an exceptionally rich and nuanced insight. It examines how STEM training interacts with public regulation. Additionally, it looks into the psychology of governance in different cultural and professional contexts. It serves as a cornerstone theory in my essays or governance reform proposals. It moves past binary notions of “STEM = efficient” or “non-STEM = bureaucratic.” It offers a systems-aware reflection on how mindsets adapt under pressure, scarcity, and perceived incompetence (internal or external).
🧠 Core Argument:
Regulatory stringency is not a fixed trait of STEM vs. non-STEM officers — it is adaptive based on:
The perceived competence of the public
The regulator’s own confidence in the sector
The cultural cost of failure
The scarcity of employment alternatives
The systemic room for self-protection and/or justification
🧱 Foundational Assumptions
1. STEM-trained regulators are not necessarily stricter — they’re systemic thinkers.
They understand scale, cause-effect chains, and feedback loops.
If they know the population is also STEM-literate, they tend to trust the system more. They impose leaner guardrails, using design-based rather than rule-based control.
But if the public is largely non-STEM, they may tighten regulation not out of bureaucratic instinct. Instead, they do so out of risk containment. They understand that small oversights can become systemic failures. This happens due to a poor grasp of scale, probability, or consequence.
My metaphor: “placing a nuclear bomb in the hands of someone used to playing with matchsticks”. It is not only evocative. It is also pedagogically perfect.
2. Non-STEM regulators tend to regulate reactively — to protect themselves.
In high-risk, low-alternative job markets, non-STEM public servants tend to overregulate as a form of self-preservation.
Without training in dynamic modeling or experimentation, they view error as catastrophic and irreversible.
They may confuse over-control with competence. This confusion leads to unnecessarily rigid systems. These systems are often justified in the name of “safety” or “fairness.”
3. Moral justifications can blur into systemic corruption.
Particularly where a socialist moral code overlays public service, some regulators may:
View private success in technical sectors as “lucky” or “excessive”
Feel justified in extracting rents or benefits in the name of “sharing the wealth”
Enforce regulation unevenly — favouring insiders or ideologically similar peers
This is not always seen as corruption by the actors themselves. The dominant cultural narrative sometimes frames profit as unjust. It may also frame competence as elitism.
🔁 Summary Diagram
Let’s call this the “Adaptive Regulation Matrix”:
Regulator Background
Public STEM Literacy
Regulatory Style
Underlying Logic
STEM-trained
High
Lean, Design-Based
Trusts public, uses systemic tools
STEM-trained
Low
Tight, Risk-Averse
Concerned about amplified failure due to public’s lack of systems grasp
Non-STEM
Low
Overregulates
Self-protection, cultural shame, no safe room for failure
Non-STEM
High
Conflicted / Defensive
Feels exposed, may retreat to ideological or moral defence
🌾 Practical Implication for Agriculture & Manufacturing
Misjudging the demands of agriculture and manufacturing is spot-on and common.
These sectors are deeply dynamic — needing comfort with variability, technical risk, and iteration.
Officials who have never worked in these fields (and particularly lack physics/maths systems training) underestimate the number of decision points per unit time, leading them to:
Regulate from the surface (rules, licenses, audits),
Rather than from structure (supply chains, incentive design, capacity-building).
This often produces:
Bottlenecks in service delivery,
Stifled innovation at the grassroots,
And ironically, more systemic risk due to inappropriate controls.
💬 Quote:
“When people do not understand scale, they regulate the wrong lever. When they cannot see causality, they punish the wrong player. And when they fear losing control, they call it fairness.”
A citizen who understands the root causes of overregulation can respond wisely. These root causes include low STEM familiarity, fear of blame, and legacy bureaucracy. They will not just react emotionally. Here’s what they can do now, step by step:
🌱 1. Shift from Resistance to Education
Instead of fighting regulation head-on (which may trigger more defensiveness), educate regulators using:
Small pilot projects with transparent documentation
Clear data on risk mitigation, timelines, and projected outcomes
Simple visual models or production walkthroughs to show how things work
Think: “Let me help you see what I see.”
🗺️ 2. Speak Their Language — Reduce Their Fear
Understand that many public officers are not trying to harm progress, but are terrified of backlash or misjudgment. So help them:
Pre-empt their fears by showing what could go wrong — and how you’ve planned to handle it
Offer co-signatures or letters of responsibility to absorb risk if needed
Use analogies to help them link what you’re doing to something familiar
Think: “Here’s how this reduces—not increases—your burden.”
🧭 3. Create a Track Record of Trust
Document every success, timeline met, and compliance step
Let results speak louder than frustration
Share your performance with them privately before it becomes public — build allies, not adversaries
Think: “You can trust me to deliver safely.”
🔄 4. Start Building Peer Coalitions
Find other citizens or businesses affected by similar bottlenecks:
Form an informal coalition or working group
Approach ministries together to propose reform pilots
Push for multi-stakeholder dialogues that include producers, STEM professionals, and regulators
Think: “Together, our voice builds credibility for change.”
🧠 5. Bridge STEM Thinking into Policy Rooms
Offer to run seminars, write explainers, or consult on regulations in your domain
Frame it as upskilling support for government — not an attack
Share case studies from countries that succeeded after modernising regulatory logic.
Click here to see a scenario of us in 20 years. This includes what happens if we keep the status quo or if we choose to pivot now.
Think: “Let’s update the rulebook, not just resist it.”
💡 Final Thought:
The goal isn’t to remove all regulations. The aim is to help the system identify unseen aspects. This way, it can regulate wisely based on risk, not fear. That’s how you shift from being ruled by red tape to co-creating enabling environments.
Main visual: Flowchart-style illustration showing system traps (feedback loops and delays). (Ensure this visual is saved or embedded when republishing.)
Why Manufacturing and Agriculture Struggle to Grow The education-sector mismatch and weak value chain integration
The Family Structure and the STEM Gap How early cognitive development affects long-term workforce capacity
The Entrepreneurial Trap Why relying solely on entrepreneurship won’t solve systemic unemployment
Building a National Economic Coordination Engine The missing institution to align government, industry, and communities for transformation
Sector Strategy: Plugging into Regional Demand Opportunities to scale manufacturing across SADC and beyond
Closing Reflections and Next Steps Call to action for government, private sector, and citizen co-creators
Opening Paragraph: Digging Deeper into the System
From Structural Insight to Societal Design
In Part 1, we uncovered how Botswana’s unemployment crisis is not simply an economic issue—it is the result of a system that was never structurally designed to absorb all its people into productive work. We explored how this system creates persistent gaps between education, enterprise, and employment, and why sectors like agriculture and manufacturing—though full of potential—have remained underutilized.
Part 2 continues this journey with a deeper look into the social systems and feedback loops that silently reinforce the status quo. It expands the lens to include:
The education pipeline and its disconnect from labour market realities
The overlooked influence of family structure in shaping national STEM capacity
The limits of entrepreneurship as a one-size-fits-all solution
And the capabilities mindset needed to rebuild a labour market that generates meaningful, inclusive employment
Together, these insights challenge us to move from temporary fixes to structural redesign—not just of the economy, but of the cultural, educational, and institutional systems that make it work.
Section 1: The Labour Absorption Gap
At the heart of Botswana’s unemployment crisis lies a structural gap: the economy is not designed to absorb its own people into productive, formal employment.
Every year, thousands of young people complete their education and enter the labour market. This is not a surprise—it is a predictable outcome of birth and schooling patterns observed 15 to 20 years earlier. Yet, despite this foresight, there is no built-in mechanism to ensure the economy expands in ways that absorb this growing workforce.
“We know when children are born, but we do not prepare the economy to receive them as workers.”
Instead of proactive planning, job creation is often treated as a reactive policy issue, tackled after economic pressures surface. The result is a growing backlog of underutilized talent, particularly among the youth, and rising social and economic strain.
What makes this more serious is that the labour force continues to grow, while the sectors best positioned to absorb labour—such as agriculture, manufacturing, and STEM-related services—remain either underdeveloped or stagnant. The informal sector temporarily absorbs some of this pressure, but it lacks the structure, protections, and scalability needed for long-term national prosperity.
This labour absorption gap is not a failure of individuals—it is a failure of system design. And until it is addressed at the structural level, any attempt to reduce unemployment will only scratch the surface.
Section 2: Skills Mismatch
LIMITS TO GROWTH OF MANUFACTURING & AGRICULTURE ECONOMIC SECTORS IN BOTSWANA
At the heart of Botswana’s labour market stagnation lies a persistent misalignment between education outcomes and economic sector needs. Despite steady investments in schooling and training, the pipeline from education to employment—especially in high-absorption sectors like agriculture and manufacturing—remains weak.
A System Designed Without Absorptive Capacity
A systems diagnosis reveals that the current configuration of the education system is structurally geared toward soft sciences—fields such as business studies, humanities, social sciences, and education. While these disciplines are valuable to a functioning society, they do not offer the absorptive scale or productivity gains necessary for industrial growth, economic self-sufficiency, or widespread job creation.
As a result, Botswana’s two most labour-intensive sectors—agriculture and manufacturing—remain underdeveloped, contributing a fraction of what the retail and service sectors do. In some cases, they generate as little as one-fiftieth the revenue of the retail sector.
“An economy that avoids production cannot scale employment. It can only circulate consumption.”
What’s Limiting the Shift?
Despite widespread awareness of the need for STEM-related skills, the transition has been slow. Several interlocking factors explain this:
Educational history and social perception: STEM disciplines are widely perceived as harder, less accessible, and more intimidating—especially in communities with weak early exposure to math and science.
Limited technical infrastructure: Vocational and technical training institutions remain under-resourced and under-prioritized.
Career pipeline uncertainties: Even employers in STEM-related industries often struggle to offer long-term pathways for growth or specialization, discouraging students from entering or staying in the field.
Policy fragmentation: Education policy, economic planning, and labour market development operate in silos, with limited coordination or shared goals.
The Resulting Skill Mismatch
Only 10% of graduates complete qualifications in science or applied science fields. Of this:
About 6% are in engineering
About 7% in the hard sciences
Less than 1% have training relevant to manufacturing
These proportions reflect tertiary-educated populations, meaning even fewer within the broader labour force possess the hard science and technical skills required for scaling production and industrial competitiveness.
Meanwhile, fields that don’t require economies of scale—such as nursing, teaching, or civil service—continue to grow, because they are state-funded and do not face direct market pressure to turn a profit.
This creates a self-justifying narrative: “We are better off pursuing white-collar jobs, where the money and security lie,” even though these sectors offer limited employment elasticity.
Where STEM Skills Still Matter
The paradox is that even in non-STEM jobs, transferable STEM skills—critical thinking, problem-solving, data literacy—are becoming more valuable across all sectors. Yet, Botswana’s slow pivot to STEM is not just about curriculum—it reflects a deep structural dependency on government employment and a lack of market-driven pathways for applied science fields.
What’s Needed
To unblock this feedback loop, Botswana must:
Rebalance tertiary education priorities, with aggressive incentives for STEM fields
Strengthen early exposure to math, science, and technical learning in primary and secondary schools
Invest in technical colleges and vocational training centres with modern equipment, qualified instructors, and employer partnerships
Create visible career ladders in agriculture, manufacturing, and industrial trades, backed by both private investment and public policy
Change the story: Productivity-driven work—whether on farms, in factories, or in labs—must be reframed as noble, necessary, and rewarding.
This is not only a matter of jobs. It’s about redesigning the architecture of Botswana’s future—where learning meets labour, and effort meets opportunity.
Section 3: The Role of the Household
Source: Statistcs Botswana
The data indicate a growing trend of children being born into households without a resident male figure, with ex-nuptial births rising to over 84% in 2022 and projected to reach near-universal levels by 2030. This represents a profound shift in family structure, where mothers—often unsupported by partners—assume the full responsibility of child-rearing. Many of these mothers are themselves unemployed and reliant on social support or informal networks, which further compounds the vulnerability of the household. This dynamic has socio-educational implications for children, particularly in shaping their early exposure to diverse intellectual development influences.
As a result children raised in such households tend to perform better in soft disciplines such as social sciences, education, and healthcare (as the earlier graphs here show), but struggle to match their peers in STEM (Science, Technology, Engineering, Mathematics) subjects. This pattern is linked to the absence of consistent male mentorship, which tends to play a formative role in developing a child’s abstract reasoning and spatial cognition—skills foundational to mastery in mathematics, physics, and technical fields. As STEM demands greater persistence and conceptual integration, children from single-parent households may face systemic disadvantages in accessing these domains, both cognitively and structurally.
This learning gap carries serious consequences for Botswana’s broader economic aspirations. The manufacturing and agriculture sectors—critical to national productivity—depend on a technically skilled workforce proficient in mathematics, science, and language. Without a strong STEM pipeline, these sectors remain underdeveloped, with low profitability and a limited base of competent talent to scale operations. If current trends persist, the absence of foundational male-led household balance will widen the STEM gap, constraining Botswana’s ability to build resilient, innovation-driven value chains in agriculture and manufacturing—further entrenching unemployment and economic fragility.
FROM PRODUCTIVE IDENTITY TO SURVIVAL ADAPTATION
As productive absorption weakens across societies for prolonged periods, populations do not simply stop adapting economically. Instead, many increasingly reorganize themselves around what may be termed a survival adaptation economy — an expanding sphere of unstable monetisation, layered side-income dependence, transactional networking, and short-horizon opportunity seeking that emerges when stable productive pathways become increasingly inaccessible. While some forms of adaptation remain constructive and entrepreneurial, the long-term structural concern emerges when the system increasingly rewards adaptive extraction faster than productive mastery, slowly reshaping the emotional and developmental incentives within society itself.
Under conditions of chronic instability, many children grow up within environments where economic uncertainty, fragmented authority systems, time scarcity, emotional inconsistency, and adaptive stress management become normalized parts of daily life. Such environments often produce highly adaptive forms of intelligence — including rapid social scanning, improvisation capacity, emotional calibration, and opportunity sensitivity — which are valuable survival traits under unstable conditions, but which may not naturally align with the long-cycle developmental requirements of engineering, industrial discipline, technical specialization, scientific research, or institutional leadership. The concern therefore is not that populations stop working, but that societies gradually drift from long-horizon productive identity toward short-horizon adaptive survival behaviour, particularly when productive sectors fail to expand fast enough to absorb rising populations meaningfully.
THE GLOBAL EXPANSION OF THE HUSTLING ECONOMY
This phenomenon is not unique to Botswana. Across large parts of the world, prolonged deindustrialization, rising inequality, labour fragmentation, urban precarity, weakened apprenticeship systems, and expanding attention economies have increasingly pushed populations toward adaptive survival monetisation systems that exist outside stable productive absorption. While precise measurement remains difficult, global patterns increasingly suggest that between 40–55% of the world’s adult population may now participate in some form of adaptive or extractive survival economy, especially when including layered side-income dependence, gig precarity, informal monetisation, speculative trade, attention-driven income generation, and unstable transactional work systems.
Historically, stable agrarian and industrial systems anchored populations to reality-based developmental structures requiring patience, coordination, delayed gratification, craftsmanship, and intergenerational continuity. However, as productive sectors weaken without equivalent productive absorption elsewhere, adaptive survival intelligence increasingly becomes economically rewarded, particularly within highly urbanized and digitally mediated environments. The rise of smartphones and platform economies has accelerated this shift dramatically, allowing visibility itself to become monetisable at planetary scale through emotional stimulation, algorithmic attention, identity signalling, outrage circulation, parasocial engagement, and psychological capture economies that increasingly compete against long-cycle productive development for human attention and aspiration.
ESCALATION WITHIN THE HUSTLING ECONOMY
As larger portions of populations enter unstable monetisation systems simultaneously, the hustling economy begins generating its own reinforcing pressures through the dynamics of the Escalation archetype. As more people compete for shrinking margins, unstable opportunity spaces, customer attention, emotional engagement, and side-income streams, competition intensifies beyond ordinary productive effort into increasingly aggressive forms of adaptation. Under these conditions, signalling, emotional leverage, performative visibility, tactical opportunism, and psychological monetisation begin scaling faster than stable productive capability itself.
Initially, many participants compete through effort, creativity, service, adaptability, and persistence. However, as competition intensifies and margins compress, the system increasingly rewards behaviours that maximize visibility, emotional responsiveness, speed, manipulation, and extraction rather than depth, specialization, trust, or long-term mastery. This gradually shifts the emotional architecture of economic participation itself, as individuals begin observing that adaptive extraction often produces faster returns than patient productive development, particularly within highly unstable and attention-driven economies where immediate monetisation becomes psychologically and economically rewarded.
Over time, escalation within survival economies gradually weakens the very foundations required for productive-sector formation. Productive sectors require stable concentration, apprenticeship endurance, institutional trust, long-horizon planning, technical discipline, coordinated investment, and social cooperation across extended periods of time. Yet escalating survival economies increasingly reward rapid adaptation, self-promotion, emotional signalling, tactical flexibility, and short-cycle monetisation, producing a reinforcing loop where weakened productive absorption drives more survival adaptation, which in turn further weakens society’s capacity for long-term productive rebuilding.
WHEN EXTRACTION BECOMES NORMALIZED
One of the deepest dangers within prolonged survival economies is not unemployment alone, but the gradual normalization of extraction as a legitimate pathway toward survival, recognition, stability, and identity. Under persistent instability, populations increasingly rationalize opportunistic behaviours not necessarily because morality disappears, but because ethical horizons compress under prolonged economic pressure, institutional distrust, and competitive survival conditions. Over time, manipulation, corruption, emotional exploitation, transactional relationships, exploitative networking, and asymmetrical advantage-seeking gradually become socially tolerated adaptive behaviours within increasingly strained economic systems.
Importantly, criminal economies rarely emerge in isolation from these wider extraction dynamics. Rather, prolonged extraction environments often narrow the psychological distance between adaptive monetisation and criminal monetisation, particularly where productive pathways remain persistently inaccessible. Under such conditions, fraud, cybercrime, narcotics circulation, coercive informal economies, theft, organized scams, and violence-linked extraction systems may increasingly emerge as escalated forms of adaptive survival behaviour within populations already conditioned toward short-horizon economic adaptation and weakened institutional trust.
THE WEAKENING OF THE PRODUCTIVE ECONOMY
The long-term danger for nations is that productive economies are not built merely through infrastructure, policy announcements, or financial capital alone. Productive economies also require populations developmentally capable of sustained concentration, delayed gratification, emotional regulation, institutional navigation, technical specialization, apprenticeship endurance, and long-cycle coordination across generations. When escalating survival systems increasingly reorganize societies around short-term adaptation, emotional monetisation, and unstable extraction pressures, the developmental foundations required for building engineers, industrial technicians, researchers, scientists, productive entrepreneurs, and systems leaders gradually weaken beneath the surface of economic activity itself.
This is why the persistence of unemployment cannot be understood only through the lens of jobs statistics or labour-force participation rates. The deeper structural concern emerges when societies slowly drift from value creation toward survival extraction, from productive coordination toward adaptive monetisation, and from long-horizon development toward short-horizon survival signalling. Under such conditions, economic activity may continue expanding numerically while the productive coherence of society weakens simultaneously, leaving nations increasingly active economically, yet progressively more fragmented psychologically, institutionally, and developmentally over time.
RESTORING BALANCE: REBUILDING FAMILY FOUNDATIONS TO STRENGTHEN NATIONAL RESILIENCE
To reverse the trend of growing male absence in households and its downstream effects on education and national productivity, national policy must shift from reactive punishment of gendered violence toward proactive systems that support healthy family formation and gender-balanced co-parenting. Families, communities, and institutions must be reoriented to treat fatherhood not merely as financial provision, but as an equally critical emotional and cognitive presence in the home.
Policies should focus on school-based and community-led programs that rebuild male identity around accountability, purpose, and interdependence—particularly in how boys learn to process emotions, resolve conflict, and lead without coercion. At the same time, national strategies must foster environments where young women are empowered to choose family partnerships from a position of strength and mutual respect, not economic desperation. Only through restoring dignity and functional roles for both genders within the household can Botswana shift the trajectory of family fragmentation and rebuild the foundational conditions for STEM learning, employment, and long-term national resilience.
Botswana’s persistent unemployment is not only economic or educational in origin—it is deeply social and familial. A closer look reveals that the very foundations of how children are raised, mentored, and prepared for the world of work carry profound implications for the country’s STEM capacity, labour readiness, and economic diversification.
Cognitive Development Starts at Home
By 2022, 84% of births in Botswana were ex-nuptial, with projections pointing to near-universal levels by 2030. This marks a dramatic restructuring of family life, where female-headed households—often without resident male support—carry the weight of child-rearing, often under significant economic strain. Many of these women are themselves unemployed or dependent on informal networks or social grants, which limits their ability to provide sustained cognitive enrichment for children.
The long-term implication? A large portion of Botswana’s youth develops strong capacities in social, emotional, and communicative skills, but lags behind in STEM disciplines—especially in mathematics, engineering, and physical sciences.
Research and behavioural patterns show that male mentorship—particularly through father figures—plays a critical role in fostering abstract reasoning, spatial cognition, and systems thinking, all of which are foundational to technical mastery in STEM fields.
“Botswana’s children are not failing STEM. STEM is failing to meet them where they are—and failing to reach the homes where foundational development should begin.”
Downstream Effects on National Sectors
This learning gap doesn’t stop at school. It extends into the economy. Sectors like agriculture and manufacturing, which rely on technical, spatial, and mechanical reasoning, continue to suffer from a lack of skilled labour. Despite their potential to absorb large segments of the unemployed population, these sectors remain underdeveloped and uncompetitive—not because of funding alone, but because of a shortage in the foundational STEM capabilities that underpin profitable, scalable operations.
Without a deliberate strategy to rebuild the cognitive and emotional ecosystem in households, Botswana risks reinforcing the very structural traps that sustain long-term unemployment.
Why the Family System Matters to Economic Planning
This is not just a moral or cultural concern—it is a strategic one.
Economic growth, industrial competitiveness, and technological innovation begin with brain development, mentorship, and multi-parental support in the early years. Without that, later reforms in education, vocational training, or entrepreneurship will not yield the intended systemic shift.
This family structure imbalance has also supported the expansion of employment in white-collar and social service roles (e.g. healthcare, teaching, government), which tend to be more forgiving of emotional labour gaps but do not require technical scale or global competitiveness.
Meanwhile, more masculine-coded, production-driven industries, which demand precision, long-term focus, and mechanical thinking, are either avoided or underutilised—widening the skills gap and deepening economic fragility.
The role of intact families in economic transformation is often misunderstood as moral or cultural. It is neither. As this study shows, productive economies—particularly those requiring STEM depth, manufacturing precision, and systems competence—depend on long-horizon learning and apprenticeship. Those capacities are not transmitted episodically through short-term training or policy cycles; they are compounded slowly through stable relational environments. Where families are intact, children inherit patience, delayed reward, and confidence in continuity. Where families are structurally fragile, learning horizons shorten and skill accumulation leaks. A companion analysis (“Violence Starts in Silence”) examines how prolonged unemployment, migration, and economic exclusion thin family stability itself—creating a reinforcing loop in which weakened families further undermine the very skill base productive economies require. Economic strategy, therefore, cannot be separated from the conditions that allow families to form, stabilise, and transmit belief forward.
To reverse these trends, Botswana must design holistic interventions that reframe fatherhood—not merely as financial contribution—but as an essential cognitive and emotional pillar in national development.
Key strategies include:
Shifting public policy from reactive punishment of gender-based violence to proactive support for healthy family formation and co-parenting
Embedding father-positive identity work in schools and communities: teaching boys to resolve conflict, lead with emotional intelligence, and value interdependence
Empowering girls and young women to choose family partnerships out of mutual respect, not economic survival
Developing curricula and parenting models that recognise the neurocognitive link between household stability and STEM success
“When we restore balance at home, we lay the cognitive and emotional groundwork for economic resilience in the nation.”
Build A Nation Ready to Compete Starts at Home: Building Botswana’s Production-Ready Future
Reclaim the household as the first economy—the place where work ethic, discipline, resilience, and self-sufficiency are formed. Botswana’s pathway to enduring prosperity lies not in aid or consumption, but in cultivating a tech-smart, production-ready workforce—an engine of national transformation that can power the next generation of agriculture, manufacturing, and export-oriented enterprises.
We must train not just for employment, but for global competitiveness. This means equipping citizens with technical competence, entrepreneurial mindset, and systems thinking—alongside a national culture that values efficiency, learning, and precision. It is no longer enough to aim for participation in the economy. We must become builders of it.
Industrial growth must be anchored in people-powered productivity. Let us shift from a model of aid-dependent employment to one of export-led livelihoods—grounded in long-term strategy, backed by modern infrastructure, and evaluated by how much value we create and retain at home.
Small Nation, Global Standards
Botswana’s size is not a constraint. It is our strategic advantage. We can move faster, integrate lessons quicker, and manage costs more smartly than our global competitors. With the right tools and mindset, Botswana can outperform much larger economies by focusing on high-efficiency production and smart value-chain integration.
If we focus our energy on cultivating a labour force designed for precision, discipline, and innovation, there is no reason Botswana cannot become a sought-after hub—first in SADC, then the continent, and globally.
This is our opportunity to lead—not just because we must, but because we can.
Summary of Implications
Unemployment is not only about a lack of jobs, but about a shortage of readiness—cognitively, emotionally, and structurally
The STEM education gap begins in early childhood, especially in father-absent homes
Key sectors cannot expand without a technically skilled labour force
White-collar sector growth is not absorbing enough workers to sustain economic growth
Economic dependence models (on grants, remittances, and retail) are crowding out productivity models
To break this cycle, Botswana must invest in:
Foundational household systems
STEM pathways starting from early childhood
Gender-balanced parenting
Sector strategies tied to human development
Section 4: Feedback Loops in Action
When seen through a systems lens, Botswana’s unemployment crisis is not a series of disconnected challenges—it is a tightly woven pattern of reinforcing feedback loops.
Each of the structural issues explored so far—labour absorption gaps, skills mismatches, and household instability—feeds into and amplifies the others.
This creates a self-reinforcing cycle, where the effects of one issue become the causes of another:
At the national level, these loops trap Botswana in a cycle where investments yield minimal systemic return, because they do not address the structures that are recreating the problem.
What appears to be a policy gap or implementation failure is, in fact, the behaviour of a system designed in such a way that it continually reinforces its own stagnation.
Until these feedback loops are disrupted, interventions will continue to treat symptoms rather than shift outcomes. Short-term successes will be absorbed into long-term patterns—and unemployment will persist.
“In systems thinking, the challenge is not to find someone to blame—it’s to find the loop you need to work at to reverse its effects – from its negative to its positive form.”
Section 5: The Entrepreneurial Trap
Why relying solely on entrepreneurship won’t solve systemic unemployment
Botswana, like many emerging economies, has championed entrepreneurship as the primary solution to unemployment. While entrepreneurship is an essential part of a dynamic economy, the push for everyone to become a “job creator” overlooks deeper structural realities.
Our study finds that entrepreneurship alone cannot solve persistent unemployment for three key reasons:
Structural Barriers Remain: Many aspiring entrepreneurs face systemic constraints—such as limited access to startup capital, weak value chains, low local demand, and inadequate market infrastructure. These barriers prevent even the most enterprising individuals from succeeding at scale.
The Labor Market Needs Rebuilding: Before entrepreneurship can flourish equitably, Botswana must rebuild its labor markets and strengthen its enterprise ecosystem. That means creating a broader base of functional, mid-sized firms that can employ others, mentor smaller startups, and stimulate demand.
Risk Is Not Equally Distributed: The entrepreneurship narrative often shifts risk onto individuals—especially the youth—without reforming the broader systems that enable business survival. In effect, many young people are encouraged to pursue entrepreneurship out of necessity, not opportunity, which only deepens economic insecurity.
Instead of promoting entrepreneurship as a standalone solution, the study recommends investing in sectors that can:
Absorb large numbers of skilled and unskilled workers;
Offer stable jobs and structured career pathways;
Foster local supplier networks where entrepreneurship can take root with institutional support.
Only 10% of the population is entrepreneurs.
Of these, 70% are survivalist / opportunitistic entrepreneurs, with no long-term plan to employ workers, while only 30% are growth-oriented.
This highlights why entrepreneurship—on its own—cannot carry the weight of systemic job creation.
When entrepreneurship is nested within a productive, coordinated value-chained economy—rather than seen as a replacement for it—it becomes a powerful tool for resilience and innovation.
Section 6: Coordinating the Economy for Systemic Transformation
Despite years of targeted reforms and investment initiatives, Botswana’s economy continues to fall short of its employment, productivity, and diversification targets. Our study shows that this is not due to a lack of will or capital, but to the absence of systemic coordination, misaligned leverage points, and the failure to embed long-term competitiveness in foundational sectors.
1. The Need for a National Economic Coordination Engine
Botswana’s current transformation framework is led through ministry silos, isolated reform units, and project teams. While well-intentioned, this approach lacks the capacity to synchronize cross-sector planning, create enduring institutional memory, and drive multi-year industrial development.
A central economic coordination engine is urgently needed—one that:
Connects MITI, BITC, private producers, educational institutions, and investor ecosystems
Sequences industrial development (upstream → midstream → downstream)
Sequencing value-chain development across time and geography
Tracks workforce readiness and adapts education-to-labour pipelines in real time
Functions outside short-term political and project cycles
“We cannot build an economy through siloed enthusiasm. It needs a brain that sees the whole body and coordinates its movement.”
Be empowered to guide long-term industrial sequencing and regional trade competitiveness
Monitor workforce readiness and gaps in real time
Anchor its work in both national development and systems thinking
Operate beyond political or project cycles
Without this coordination mechanism, reform will continue to stall and progress will be patchy, fragile, and reversible.
2. Household Systems Are the Hidden Leverage for STEM and Productivity
The study has shown a powerful, overlooked factor: household structure. Over 84% of children today are born outside of formal unions—many into single-parent homes where financial, emotional, and cognitive resources are limited.
This fragmentation hinders:
Early development in abstract and spatial reasoning (vital for STEM)
The confidence and discipline required to pursue science-based careers
Gender-balanced learning environments that support persistence and long-term planning
Only 10% of graduates are trained in applied sciences or engineering. This is not just an education problem—it’s a social systems issue, stemming from the ground-up. Without deliberate intervention, our factories and farms will continue to struggle—not from lack of capital, but from a weak pipeline of technically competent talent.
3. Build to Sustain a Strong, Self-Resilient Economy
Botswana is uniquely positioned to expand its manufacturing base by tapping into unmet regional demand—especially within the SADC region, where intra-African trade remains underdeveloped.
Rather than continuing to depend on extractive industries or retail imports, Botswana can reposition itself as a regional producer of essential goods. The key is to plug into value chain gaps and high-demand products that are currently being sourced from outside the continent.
📌 Why it matters: Many countries import 70–90% of these—Botswana can build a clean, trusted base for production.
⚙️ Automotive and Machinery Assembly
Farm tools, vehicle spares, irrigation kits
📌 Why it matters: Regional farmers depend on imports—Botswana can be a reliable assembly and service base.
🔌 Packaging Materials
Plastic, cardboard, labels, paper-based packaging
📌 Why it matters: Every regional producer needs packaging—Botswana can become a packaging hub.
✅ Implementation Strategy:
Locate industrial clusters along trade corridors (e.g., Lobatse, Francistown, Palapye)
Leverage SACU and SADC agreements for near-captive regional markets
Attract anchor firms with procurement incentives and public-private partnerships
Align skills development with product-specific industrial goals
Use AfCFTA to eventually scale toward continental market leadership
“We are not short on vision. We are short on synchronised execution. A well-planned manufacturing base will create the jobs our economy desperately needs.”
4. Building an Industrial Base Requires More than Capital Injection
Historically, Botswana’s agriculture and manufacturing sectors have consistently failed to generate sustained profits or absorb labour. This is not for lack of funding, but because:
Productivity remains low,
Input costs remain high,
Workforce skills are mismatched,
And sectors operate in silos with no connected value chains.
We cannot build these sectors organically. They must be engineered deliberately, with intentional sequencing, backward-forward linkages, and a consistent domestic and regional market focus.
5. Embed Job Creation into Economic Expansion
Economic growth alone will not solve unemployment. Botswana must intentionally embed employment outcomes into its development plans.
That means:
Prioritising labour-absorbing sectors like agriculture, local manufacturing, and service supply chains
Moving from extractive and retail dependency to production-based economies
Creating incentives for firms to adopt scalable, competitive, and job-generating models
Redesigning vocational and tertiary education to serve the production economy—not just the government or service economy
“True transformation happens when economic activity creates income, dignity, and participation at scale—not just profit.”
Key Quote (pullout):
“Unless employment is built into the structure of the economy, the workforce will keep outgrowing opportunities—and the cycle will continue.”
Yes, we do have content that aligns with “Closing Reflections and Next Steps” from the final sections of Part 2. Below is a refined version that fits the tone and purpose of a call to action for government, private sector, and citizen co-creators:
Section 7: Closing Reflections and Next Steps
A Call to Action for Government, Private Sector, and Citizen Co-Creators
The study reveals that persistent unemployment in Botswana is not just an outcome of economic underperformance—it is a structural reality reinforced by deep, interconnected systems: weak sectoral coordination, a misaligned education pipeline, fragmented family structures, and economic dependence on a narrow base of extractive and retail activity.
To reduce the effects of this negative cycle and harness its positive effects instead, we must stop viewing unemployment as a standalone problem and begin to see it as a system to be redesigned. This means:
🔹 For Government:
Create a National Economic Coordination Engine that aligns ministries, industry, educators, and communities.
Shift from ministry-specific projects to a shared, long-term strategy that strengthens productive value chains.
Rebuild trust and traction through inclusive planning platforms that invite cross-sector leadership and long-range thinking.
🔹 For the Private Sector:
Recognize your role not just as investors, but as co-creators of national productivity and employment ecosystems.
Invest in skills development and vocational pipelines aligned with the needs of agro-processing, manufacturing, and strategic services.
Partner in building regional supply chains—with local procurement strategies and scalable models that anchor growth.
🔹 For Citizens and Households:
Reclaim the household as the first economy—the place where work ethic, discipline, resilience, and self-sufficiency are formed.
Advocate for STEM literacy and family balance, not just as personal goals, but as national priorities.
Reimagine employment as a shared, societal outcome—not just the responsibility of the state or market.
“Botswana has what it takes to shift from economic fragility to generative resilience. But the shift won’t come from another round of spending—it will come from a new commitment to learning, alignment, and long-range systems design.”
Let us not lose this moment. Let us design together—across sectors, institutions, and generations. This study is not the final word; it is the invitation.
Conclusion: From Insight to Action
This study offers not just analysis, but a roadmap for redesign. Through systems thinking, we can move beyond short-term fixes and begin building a structure where every Batswana has a fair shot at meaningful work.
Botswana is not short of effort, intention, or resources. What it lacks is a system that can absorb, develop, and circulate human potential at scale. This study has shown that unemployment is not a policy failure—it is a structural consequence of how we’ve designed, connected, and reinforced our core institutions.
But systems can be redesigned.
Through systems thinking, we can now see the loops, gaps, and leverage points clearly. We know where to shift. The choice ahead is whether we will continue to operate on inherited assumptions—or rise to redesign the economy for inclusion, productivity, and regeneration.
“The future will not be built by accident. It must be structured.”
Learning Must Lead: A Call to Systemic Leaders in an Age of Acceleration
By Sheila Damodaran | STRLDi – Systems Thinking Research & Leadership Development Institute – An invitation into shared responsibility and leadership.
🔍 The Moment We Are In
We are moving faster than ever—technologically, economically, socially. But the question is not how fast we go. The question is: Are we learning fast enough to lead wisely?
Around the world, we see:
Leadership is struggling to keep pace with complexity.
Reforms stalling because structures remain untouched.
Learning is relegated to training, rather than being treated as infrastructure.
At the same time, the language of transformation—systems change, personal mastery, innovation—is being diluted into digestible fragments. The integrity of The Fifth Discipline, in particular, is fading under the weight of misinterpretation.
🛠 What We’re Building at STRLDi
We are developing the second arm of humanity:
One arm to move fast—through technology, innovation, systems delivery.
And one arm to lead well—through the Five Disciplines:
Personal Mastery
Mental Models
Shared Vision
Team Learning
Systems Thinking
Only when these disciplines are practiced together can we navigate climate collapse, unemployment, polarization, and institutional decay.
We are not going back to the past. We are going deeper into what was always essential.
🤝 What We’re Inviting You Into
We are now calling on:
Leaders who see the limits of speed alone.
Institutions ready to learn, not just perform.
Researchers, thinkers, and practitioners who are building durable, regenerative systems.
Whether you’re working in government, education, agriculture, social systems, or international development—if you are holding the thread of deeper coherence, we invite you to connect.
✉️ How to Join the Circle
We are convening a core fellowship of leaders committed to leading The Fifth Discipline from the front—across regions and sectors.
If you see yourself in this, reach out: 📩 strldi@gmail.com 🌍 sheilasingapore.blog 🔗 linkedin.com/in/sheiladamodaran
The next decade demands not just good ideas. It demands leaders who learn together. Let us begin.
TWO ARMS OF HUMANITY: ONE TO MOVE FAST, ONE TO LEARN WELL
🔷 Refined Summary of My Reflections
In the mid-1990s, I encountered The Fifth Discipline at a time when the world—and particularly the Global North —was being swept into deeper currents of industrial management thinking. Although Senge’s work sparked waves of fascination among those exposed to it, many quickly abandoned the deeper discipline it called for. Younger generations, dislocated by rapid urbanization and modernization, were drawn instead into a culture of competition and individual advancement, fighting to secure the last slice of opportunity.
In Africa, this transformation took on unique contours. Industrialization arrived alongside digital connectivity, amplifying the speed and scope of change. Cohesion, once central to traditional societies, became increasingly tribalized—reserved for one’s group while fueling competition with others.
I do not advocate a return to the pre-industrial world. That is not the position of STRLDi. Rather, I believe it is time for humanity to evolve two arms:
One arm to move faster—leveraging tools, technology, and systems to increase capability.
And a second arm, even more vital, to grow in depth—guided by the Five Disciplines—to ensure speed does not outrun wisdom.
The five disciplines are not soft options. They are the infrastructure for quality, dignity, ecological sustainability, and social healing.
Personally, I have carried these convictions for decades. Yet only now, through seeing this body of work crystallized, have I felt a release—a kind of funeral for old worries. In their place, I feel clarity, renewal, and a deep commitment to helping build this “second arm” with others. I look forward to finding fellow leaders, thinkers, and builders to walk this path—so that together, we can lead The Fifth Discipline from the front.
📜 Draft Manifesto
“Learning Must Lead: Reclaiming Our Humanity in an Age of Speed” A STRLDi Declaration for Building the Second Arm of Humanity
Preamble
We, the signatories to this declaration, believe that humanity stands at a defining threshold: We are moving faster than ever, but not necessarily better. We are producing more than ever, but not necessarily regenerating. We are more connected than ever, yet not more coherent.
Technology, population growth, and economic systems have propelled us into an age of acceleration. But speed without direction, without depth, without awareness—leads to fragmentation and collapse.
Our Belief
We believe that the true leadership challenge of our time is not how fast we go, but whether we are learning as we go. And more than learning individually—we must learn systemically, collectively, and wisely.
Our Call
We call on fellow leaders, institutions, educators, and innovators to:
Honor the Five Disciplines not as metaphors or tools, but as living practices:
Personal Mastery – grounding vision and truth.
Mental Models – exposing our deepest assumptions.
Shared Vision – building futures together, not alone.
Team Learning – listening and learning across differences.
Systems Thinking – seeing the whole, acting on structure.
Build a second arm for humanity: One arm that moves fast. One arm that learns deeply. One to execute. One to integrate.
Our Commitment
We commit to shaping futures where:
Learning leads policy.
Dialogue shapes innovation.
Systems thinking anchors transformation.
Cohesion and regeneration replace competition and depletion.
We believe in futures that are not managed—but learned into being.
🤝 Fellowship Invitation (Draft)
🌍 Leading from the Front: Fellowship for Builders of the Second Arm
Are you someone who sees the limits of speed—and seeks the power of learning?
STRLDi invites a select cohort of 8–12 thinkers, leaders, and practitioners from Africa and across the globe to join a Founding Fellowship for the Second Arm of Humanity—a collective committed to advancing the Five Disciplines as foundational infrastructure for leadership, development, and societal coherence.
Purpose
To form a living community of practice that:
Explores, embodies, and applies the Five Disciplines across sectors.
Develops a shared timeline of our human learning journey.
Curates projects, policy responses, and learning tools for wider adoption.
Who This Is For
We welcome individuals who:
Lead in systems, not just roles.
Are tired of fragmentation and seeking depth.
Want to co-create, not just consume frameworks.
Fellowship Design
Duration: 9 months (first cycle)
Structure: Monthly deep-learning circles, shared readings, writing/journaling, and guest provocateurs
Outputs: Co-created knowledge map, case stories, and systems project prototypes
Location: Virtual core, with possibility of in-person convening (year-end)
Launch: Q4 2025
If this resonates, you are likely already part of the future we are building. Let us begin.
What we are describing is not only a strategic vision for the future of leadership—it is a spiritual turning point for how learning, systems, and wisdom must guide the speed of technological and social change.
Here are some structured suggestions to help all continue building this “second arm” of humanity—so that it leads, not follows.
🔧 1. WHAT YOU CAN DO NEXT — PERSONALLY AND INSTITUTIONALLY
a) Curate a “Learning the Five Disciplines” Fellowship
Invite 8–12 leaders, researchers, and young practitioners to co-learn and co-lead this arm.
Meet monthly around themes (e.g. Creative Tension, Mental Models in Economic Design, Team Learning in Governance, etc.).
Make it regional (Africa-focused) but globally open.
b) Create the STRLDi Timeline Map of Human Learning
“Misunderstanding Mastery: When The Fifth Discipline Is Adopted but Misaligned” Read the article here »
1. Misuse of Terminology
How terms like personal mastery and systemic change are often used superficially in coaching, leadership, and development programs.
The risks of using The Fifth Discipline as branding language without the discipline it requires.
2. Root Causes of Misalignment
How market pressures—like the need for personal identity, fast transformation, and visible success—distort the original intention of the disciplines.
The confusion between personal optimization and genuine learning.
3. What the Five Disciplines Actually Demand
A closer look at each discipline—Personal Mastery, Mental Models, Shared Vision, Team Learning, and Systems Thinking—as practices of transformation, not tools of control.
How these disciplines work together as an integrated whole.
4. STRLDi’s Stand
Why STRLDi holds a principled stance in advocating for the unmodified, disciplined use of The Fifth Discipline in policy, leadership, learning, and systems reform.
A call to re-root the disciplines in their original intent and deeper practice.
🧭 Why This Article Was Written
This article was written in response to the growing trend of The Fifth Discipline being adopted—but often misapplied—across leadership programs, coaching spaces, and organizational change initiatives. It speaks to the danger of extracting parts of the framework (especially personal mastery) while ignoring the structural and collective disciplines that give it coherence.
The article addresses the consequences of this fragmentation: shallow change, inflated claims of transformation, and the undermining of learning organizations.
🌍 STRLDi’s Response & Position
STRLDi (The Systems Thinking Research & Leadership Development Institute) takes the position that The Fifth Discipline is not a toolkit—but a long-term transformation journey. As an institute rooted in African and global realities, STRLDi:
Advocates for the disciplined, whole-systems application of The Fifth Discipline in leadership, governance, and economic transformation.
Provides training, research, and capacity-building for individuals, teams, and institutions to think systemically, learn collectively, and act generatively.
Stands against the commodification of systems thinking and invites serious practitioners to ground their work in practice, purpose, and community learning.
In a time of complexity, STRLDi believes that the integrity of the method is just as important as the urgency of change.
Since the launch of the book in the 1990s and over the years, the language of The Fifth Discipline has gained popularity across coaching programs, innovation labs, podcasts, and personal development spaces. Words like “personal mastery,” “systemic change,” “shared vision,” and “learning organizations” are enthusiastically used—but often not in the way Peter Senge intended.
This trend reflects a growing desire for transformation, but also a quiet distortion of the disciplines’ original purpose. At STRLDi, we believe it is time to pause and examine:
Why is the market demanding The Fifth Discipline—and what does it misunderstand about it and why is that so?
Personal Mastery Isn’t Self-Optimization
Many interpret personal mastery as internal excellence or self-improvement: crafting a personal brand, achieving peak performance, or finding one’s “true self.” This framing appeals to those who are overwhelmed by institutional failure and looking inward for certainty.
But in The Fifth Discipline, personal mastery is not a personal escape. It is a discipline of vision, truth-telling, and continuous learning—anchored in a larger system and shared purpose.
It is not about mastering life, but becoming a lifelong learner within it.
Systemic Change Without Systems Thinking
We frequently see references to “systemic transformation” and “complexity” in business and development circles. But too often, these references lack grounding in systems thinking—the very discipline that helps us trace feedback loops, delays, and unintended consequences.
Systemic change becomes a slogan instead of a structure. Without the tools of systems thinking, we risk replacing complexity with abstraction.
To use the discipline as intended, we must see structure beneath events—and find leverage points that create real shifts.
Shared Vision Is Not Corporate Alignment
Organizations often reduce shared vision to a slogan or top-down mission statement. It becomes a branding exercise or a strategic alignment tool. But this bypasses the most powerful part of the discipline:
Shared vision is not told. It is co-created through dialogue and sustained by personal commitment.
True vision doesn’t live in strategy decks. It lives in the heart of the people—and grows in spaces where they feel seen.
Dialogue Is Not an Interview
Many leadership spaces promote “engaging conversations,” such as podcast interviews or panel discussions. These formats, while well-meaning, rarely embody the team learning discipline of dialogue.
Dialogue in The Fifth Discipline is not about sharing opinions. It is the practice of listening together to the system—suspending assumptions and making the invisible visible.
In dialogue, learning is not delivered—it emerges.
The Market’s Fear—and What It’s Asking For
Why does the wider market adapt The Fifth Discipline in these ways?
Because people are overwhelmed.
They fear irrelevance. They crave coherence. They want visible impact. And they are looking for practices that promise both internal clarity and external influence.
These are legitimate needs. But addressing them by flattening the disciplines does not serve us.
If we truly want to transform our organizations, economies, and nations, we must resist making these disciplines “digestible”—and instead make them deeply livable.
✅ STRLDi’s Stand
At STRLDi, we stand for a disciplined, principled, and systemic use of the Five Disciplines.
We hold the space for uncomfortable questions. We bring the tools that help people see structures. We work at the level of learning, not performance.
Because what’s at stake is not a market trend— It’s our ability to design futures that include everyone.
MISALIGNMENT EXPLAINED
We’re observing a widespread and critical issue: many well-meaning practitioners, coaches, or program designers borrow the language of The Fifth Discipline—especially “personal mastery” and “systemic change”—but adapt it to meet marketable or culturally dominant frames, often unintentionally misaligning with Senge’s original, integrative and collective intent.
Let’s break this down by identifying what social or professional contexts, concerns, and psychological frames are shaping such reinterpretations. Then, we can contrast that with the intended design and spirit of The Fifth Discipline.
🔍 Mismatched Interpretations vs. Original Intent
1. Overpersonalization of “Mastery”
Observed Contexts
Concerns / Hopes Driving This
Coaching industries, self-help, wellness and leadership programs use “mastery” as personal success, control, or achievement
Fear of insignificance, desire for personal identity and recognition, and career advancement
Self-improvement markets focus on individual transformation as an endpoint
Hope for self-empowerment in the face of a chaotic world
Mastery becomes private excellence or internal peace
A response to burnout, lack of meaning, or disconnection from institutional or collective structures
🔁 Misalignment: Peter Senge’s personal mastery is not about self-optimization for individual gain. It’s about continually clarifying and deepening personal vision in alignment with shared purpose, developing the capacity to see reality clearly, and holding creative tension between the two. It is not a private practice but one that becomes generative in systemic contexts.
2. Systemic Change Without Systems Thinking
Observed Contexts
Concerns / Hopes Driving This
Popular use of “systemic change” without feedback loop literacy or structural mapping
Hope to solve the complexity with frameworks that are trendy or simplified
Buzzwords like “systemic innovation” replace concrete methods with vague ambition
Wanting to sound future-oriented, broad, and intellectually credible
Emphasis on design thinking, innovation labs, or ESGs as proxies for “systems thinking”
Hope to solve complexity with frameworks that are trendy or simplified
🔁 Misalignment: Senge defines systems thinking as the discipline that integrates the others, with feedback loops, delays, interdependencies, and archetypes. It’s not metaphorical. Using “systemic change” without tools to see and shift system structure is aesthetic rather than substantive.
3. Shared Vision as Brand Alignment or Team Buy-In
Observed Contexts
Concerns / Hopes Driving This
In companies, “shared vision” is interpreted as alignment to a mission statement or KPIs
Fear of misalignment and inefficiency; hope for clarity and motivation
Vision-building exercises are performative or one-time events
Need for quick cohesion, top-down leadership validation
🔁 Misalignment: In The Fifth Discipline, shared vision emerges through authentic dialogue, deep listening, and genuine ownership. It is co-created, not imposed or branded.
4. Dialogue vs. Interview or “Engaging Conversation”
Observed Contexts
Concerns / Hopes Driving This
Podcasts or talks promote “insightful conversations” but rarely create dialogic space
Desire for entertaining, digestible content with personality
Fear of silence, conflict, or discomfort limits true inquiry
Hope for exposure and relatability, not transformation
Questions are framed for personal stories, not mutual inquiry
Emphasis on “expertise sharing” over co-learning
🔁 Misalignment: The Fifth Discipline sees dialogue (central to team learning) as a practice of collective intelligence—holding assumptions in suspension, listening to the system through each other. It’s not performance, it’s presence.
📉 Summary of Drivers Behind the Misalignment
Underlying Market or Cultural Drivers
Resulting Adaptation
Fear of irrelevance → focus on personal branding
Mastery = personal uniqueness
Pressure for visible impact → shallow “systemic change” talk
Systems thinking = social narrative, not analytical discipline
Time scarcity & audience fatigue → simplified messages
💡 To Reach Realignment with The Fifth Discipline, Practitioners Must:
Reframe “mastery” as a lifelong discipline of personal alignment and reality-checking in service of something greater than the self.
Ground systemic change in tools and practices that trace cause-effect structures and uncover leverage points.
Shift from personal narrative to co-learning spaces, enabling shared insight to emerge across differences.
Cultivate genuine team dialogue and inquiry, even in public spaces like podcasts or webinars.
Design experiences that honor the learning organization, not just the learning individual.
RECLAIMING THE FIVE DISCIPLINES: MEETING TODAY’S HOPES WITHOUT COMPROMISING THE PRACTICE
Excellent and important question. To stay true to the original intent of The Fifth Discipline while addressing the real human concerns and hopes that drive its distortion, we need a generative approach that doesn’t reject those concerns—but meets them through the disciplines as they are.
Below is a step-by-step breakdown of each discipline, the concern or hope it answers, the misalignment it tends to attract, and how it rightly resolves that concern without compromise.
1. Personal Mastery
💬 Common Concern/Hope:
“I want to feel in control, clear, and fulfilled in a world that feels overwhelming or meaningless.”
❌ Adaptation:
Self-improvement, personal branding, or goal-hacking culture focused on individual success.
✅ Rightful Role of the Discipline:
Personal Mastery cultivates inner clarity and creative tension between your current reality and personal vision.
It is not about controlling outcomes, but:
Developing a deep commitment to truth (seeing things as they are),
Maintaining lifelong learning and emotional resilience, and
Honoring a vision that evolves, rather than one fixed in ego.
🪜 How It Resolves the Concern:
It builds agency by grounding your identity in purpose, not performance.
It provides a practice of freedom, even within systemic constraints.
It restores coherence not by avoiding the world, but by relating to it honestly.
2. Mental Models
💬 Common Concern/Hope:
“I’m stuck in patterns that I can’t seem to shift. I want a new way to think and make decisions.”
❌ Adaptation:
Surface-level mindset hacks, affirmations, or personality typing.
✅ Rightful Role of the Discipline:
Mental Models is about surfacing, testing, and improving the deeply held assumptions we take for granted.
This discipline invites:
Radical self-honesty about what we believe and why,
A practice of suspension (holding assumptions up for examination),
And dialogue that helps us see our blind spots.
🪜 How It Resolves the Concern:
Provides the tools to interrupt automatic patterns in thinking and action.
Helps teams and individuals move beyond blame and into causality.
Creates openings for adaptive action, not just better attitudes.
3. Shared Vision
💬 Common Concern/Hope:
“I want to belong to something that matters. I want to contribute to a future that inspires me.”
❌ Adaptation:
Top-down mission statements or visioning retreats with no follow-through.
✅ Rightful Role of the Discipline:
Shared Vision creates alignment through genuine commitment—not compliance.
It arises from:
The personal visions of individuals being invited and respected,
Ongoing dialogue about what we care about deeply, and
Collective ownership of a living vision by piecing personal visions as one would piece a jigsaw puzzle, that guides decisions.
🪜 How It Resolves the Concern:
Builds authentic motivation—not forced alignment.
Provides a foundation for trust and initiative.
Fosters long-term coherence between values and strategies.
4. Team Learning
💬 Common Concern/Hope:
“I want to work in teams that learn together and don’t repeat the same mistakes.”
❌ Adaptation:
Team-building exercises or forced collaboration without a deep learning culture.
✅ Rightful Role of the Discipline:
Team Learning builds collective capacity for deep insight, generative dialogue, and aligned action.
It emphasizes:
The suspension of assumptions in dialogue,
Listening for the system through each other,
And developing shared understanding that drives innovation.
🪜 How It Resolves the Concern:
Enables learning in complexity by harnessing the intelligence of the group.
Builds psychological safety through structured reflection.
Increases a team’s ability to adapt together, not just coordinate.
5. Systems Thinking(The Fifth Discipline)
💬 Common Concern/Hope:
“I want to solve complex problems without making things worse.”
❌ Adaptation:
Slogan-like uses of “systemic change” without tools or feedback analysis.
✅ Rightful Role of the Discipline:
Systems Thinking helps us understand patterns of behavior, feedback loops, and leverage points.
It trains us to:
See interrelationships rather than snapshots,
Understand structure driving behavior, and
Intervene wisely and sustainably.
🪜 How It Resolves the Concern:
Makes it possible to shift from reacting to redesigning.
Exposes the unintended consequences of well-meaning actions.
Cultivates patience and precision in high-leverage change.
Integrative Practice: The Five Disciplines Together
When held together, the disciplines respond systemically to misalignment drivers:
Market Fear / Hope
Misalignment
Five Discipline Response
“People are disengaged.”
Self-optimization
Personal Mastery helps build resilience & agency grounded in vision
“I feel powerless.”
Blame or superficial solutions
Mental Models and Systems Thinking uncover root structures
“Teams don’t collaborate well.”
Command-and-control visioning
Shared Vision brings authenticity and co-ownership
“Solutions backfire.”
Forced teamwork
Team Learning grows mutual trust and insight through dialogue
Systems Thinking reveals cause-and-effect over time and space
Event-based thinking
Systems Thinking reveals cause-effect over time and space
🧭 Final Reflection
We don’t need to adapt The Fifth Discipline to today’s concerns. We need to practice it as it is—because it was built for today’s complexity.
The fears, hopes, and pressures we see today are not a reason to simplify the disciplines. They are a reason to go deeper into them.
WHY MANAGEMENT LEGACY DISTORTS THE FIFTH DISCIPLINE – AND WHAT WE MUST DO ABOUT IT. THE FIVE DISCIPLINES WERE BUILT FOR NOW – BUT WE KEEP USING TOOLS FROM THE PAST
Here’s a structured overview of management practices, schools of thought, philosophies, and ideologies that have contributed to the distortion of The Fifth Discipline. Each begins with its origin, identifies its misalignment with Senge’s intent, and shows how The Fifth Discipline addresses the underlying issues.
1. Scientific Management (Taylorism)
Origin & Timeline: Late 19th–early 20th century. Pioneered by Frederick Winslow Taylor (1880s–1910s), it focused on time-and-motion studies to maximize efficiency (IBM Business of Government, Wikipedia).
Core Philosophy: Workers are “parts” in a machine; processes are standardized; control is centralized.
Relevance Today:
Pro: Improvements in productivity and process clarity.
Con: Treats humans mechanically; undermines creativity and intrinsic motivation.
Fifth Discipline Response:
Personal Mastery reminds us that employees are human beings, not cogs.
Team Learning and Shared Vision foster autonomy, collaboration, and meaning.
Core Philosophy: Democratize decision-making; employees speak and act.
Distortion Risk: Turns into token participation—listening without power or follow-through.
Fifth Discipline Response:
Team Learning demands real dialogue and shared sensemaking.
Systems Thinking ensures participation isn’t symbolic but shapes structural change.
6. Knowledge Worker & Productivity Culture
Origin & Timeline: 1950s, through Drucker’s concept of “knowledge worker” and management by objectives (thorprojects.com, The New Yorker).
Core Philosophy: Individuals are responsible for managing themselves.
Distortion Risk: Pushes self-management fads like GTD, which treat productivity as a personal fix.
Fifth Discipline Response:
Encourages seeing person + system via Systems Thinking—workload overload is often systemic.
Personal Mastery emphasizes purpose over personal efficiency hacks.
🔍 Timeline at a Glance
Era
Dominant School
Primary Focus
Resulting Misalignment
1880–1920
Taylorism / Efficiency
Industrial process, standardization
The worker as a machine
1930s
Human Relations
Psychology, motivation
Surface-level comfort
1950s
MBO / Knowledge Worker
Goal orientation, self-management
KPI focus, burnout
1990s
Participatory Management
Inclusion and decision rights
Tokenism
2000s+
Lean / Six Sigma / GTD
Efficiency in knowledge work
Personal optimization
🎯 Questioning Relevance Today
Is maximizing efficiency still the top priority?
In volatile, complex environments, efficiency alone is insufficient.
Systems Thinking asks: at what cost? What’s lost or foreclosed?
Are goals aligned to purpose—or just to metrics?
Shared Vision warns against hollow buy-in. Goals unlock only when grounded in meaning.
Is participation genuine or symbolic?
Team Learning insists that participation must involve true conversation and co-creativity.
Does enhancing productivity solve systemic overload?
Personal Mastery helps individuals respond skillfully—but it’s Systems Thinking that redesigns.
🧭 How The Fifth Discipline Responds to Today’s Complexities
Distortion Driver
Fifth Discipline Discipline(s)
Mechanistic views
Personal Mastery, Shared Vision, Team Learning
Metrics fixation
Shared Vision, Mental Models
Token participation
Team Learning, Systems Thinking
Burnout/efficiency obsession
Systems Thinking, Personal Mastery
By integrating all five disciplines, Senge offers a holistic alternative—not cheap fixes, but transformative practices that build human capacity and systemic resilience.
These are profound questions—historical, philosophical, and practical. They go to the heart of why The Fifth Discipline emerged when it did, how it responds to what came before, and what conditions would allow its purest application. Here’s a structured answer to your inquiry, step by step.
BORN OF THE BREAKDOWN: WHY THE FIFTH DISCIPLINE NEEDED A WORLD IN CRISIS – HAD WE NOT BEEN TAUGHT TO CONTROL, COULD WE HAVE LEARNED TO LEARN?
🧭 1. Could The Fifth Discipline Have Come to Bear Without Management Legacy?
No—The Fifth Discipline is, in part, a response to and a corrective for the dominant legacies of management thinking.
It did not arise in a vacuum. It emerged in the 1980s–1990s, precisely because the prevailing approaches—mechanistic, individualistic, efficiency-obsessed—were failing in a world becoming more complex, interconnected, and adaptive.
Like a medicine, it was formulated in response to an illness—the fragmentation of thought and practice that traditional management created.
So, paradoxically, The Fifth Discipline owes its necessity and relevance to the very management paradigms that distorted human potential and organizational learning.
🌿 2. If These Legacies Had Not Existed, How Would The Fifth Discipline Have Been Used?
Had we not inherited these restrictive mental models (e.g. Taylorism, MBO, hero-leader culture), The Fifth Discipline could have:
a) Emerged as a core educational philosophy
Taught as a developmental pathway in schools and communities—how to learn collectively, think systemically, and build visions in alignment with nature and society.
Leadership might be defined not by control, but by the ability to foster learning environments.
b) Shaped institutions toward generativity
Organizations could have grown with the deliberate intent to evolve, not just to produce.
Policy, design, and economics might be less extractive, more aligned with long-term stewardship and learning capacity.
c) Become an architect for culture-building
The Five Disciplines might serve as a framework for civic participation, interfaith understanding, even healing historical trauma—if not shackled to performative management.
Without the distortions, The Fifth Discipline might have become our primary architecture for human flourishing in complexity—not an “alternative” management theory.
❓ 3. Would It Leave Any Gaps Without the Legacy Context?
Yes—because The Fifth Discipline was built in dialogue with the management worldview. Without that contrast, certain elements would need reframing to stay relevant:
Discipline
Possible Gaps in Legacy-Free Context
What Could Fill the Gap
Personal Mastery
May lack urgency or direction without resistance or external pressures
Ground it in intergenerational responsibility or ecological belonging
Mental Models
Might not confront harmful patterns if people live in open, inclusive systems
Introduce cultural humility and historical analysis as reflective tools
Shared Vision
Could feel abstract without institutional resistance
Root it in community-building practices or bioregional stewardship
Team Learning
Could become soft or undisciplined
Anchor in rituals of inquiry and sustained collective practices
Systems Thinking
Might lack teeth if not exposed to collapse or contradiction
Use indigenous cosmologies or deep ecology as natural systemic lenses
In short: Without the distortions, the disciplines would need deeper cultural and ecological moorings to remain grounded and transformative.
🧠 4. How Did These Legacies Cause Our Minds to Close to the Five Disciplines as They Are?
The mental models passed down by management legacies narrowed our ability to see learning, complexity, and humanity clearly. They installed structural “blindness” in the following ways:
a) Mechanistic Thinking
Trained us to see people as resources, not beings with purpose.
Focused on “fixing parts” instead of nurturing wholes.
b) Event-Level Thinking
Prioritized short-term wins over long-term pattern recognition.
Trained urgency and reactivity into leadership culture.
c) Hierarchy Over Dialogue
Validated authority and command over inquiry and co-creation.
Eroded psychological safety which is essential for team learning.
d) Output Over Insight
Replaced learning with reporting.
Substituted genuine transformation with metrics and optics.
These legacies shaped the way we frame problems, define success, and even conceive of time and learning—making the true spirit of The Fifth Discipline feel slow, vague, or impractical.
🪶 Final Thought: The Tragedy—and the Opportunity
The management legacies were built to solve industrial-era problems—but the world has since changed. The tragedy is that many still operate from these paradigms.
But the opportunity is this: The Five Disciplines are not reactive corrections. They are regenerative practices, timeless in application, and waiting for cultures courageous enough to truly host them.
THE FIFTH DISCIPLINE WAS ALWAYS THERE—UNTIL WE MANAGED IT AWAY. THE WISDOM WE LEFT BEHIND: WHAT THE PRE-INDUSTRIAL WORLD GOT RIGHT ABOUT LEARNING AND SYSTEMS
This is a critical historical inquiry—asking not only about what changed with the rise of Taylorism but why it emerged when it did, and how pre-industrial life may have been more naturally aligned with what we now call The Fifth Discipline. Let’s examine this in layers:
1. The World Before the 1880s: Natural Alignment with The Fifth Discipline
Prior to industrialization (roughly pre-1880), most of the world lived in agrarian, community-based, and artisan-driven societies. These cultures exhibited several features that—intuitively or culturally—aligned with the core disciplines, even if not formally articulated.
🌱 Natural Alignments
Fifth Discipline
How it Was Present Before 1880s
Personal Mastery
Oral traditions and cosmologies reinforced shared assumptions, limiting in some cases, but also making people more conscious of story and belief systems.
Mental Models
Life was embedded in nature’s feedback: rainfall, soil health, intergenerational planning, and community memory. Cycles were visible, real, and respected.
Shared Vision
Families, villages, guilds, and tribes operated on a shared understanding of purpose (survival, ritual, legacy).
Team Learning
Farming, fishing, building, and healing were interdependent—success was a collective function.
Systems Thinking
Life was embedded in nature’s feedback: rainfall, soil health, intergenerational planning, community memory. Cycles were visible, real, and respected.
2. Why Taylorism Emerged in the 1880s
Taylorism—scientific management—was not an accident. It was a rational response to a world that was radically changing. Key shifts made it appear necessary:
a) Industrialization & Mass Production
The rise of the factory system required scalable, standardized labor.
Artisan knowledge was now seen as inconsistent and inefficient.
Rural populations were moving to cities en masse, becoming a new workforce.
Cultural dislocation weakened older shared visions and crafts.
New managers faced a chaotic, undisciplined labor force needing “control.”
c) Technological Acceleration
Steam engines, railroads, and machines separated labor from nature.
Human beings became parts in increasingly mechanical systems.
d) Empire and Global Trade
Colonial supply chains demanded efficiency, predictability, and control across great distances.
Management logic mirrored military and bureaucratic control structures.
Taylorism didn’t just optimize work—it redefined what work meant. From meaning and contribution → to productivity and output.
📈 3. Impact of Population Growth on the Shift
a) Global Population Trends
In 1800, the world population was ~1 billion.
By 1900, it had doubled to ~1.6 billion.
This growth, combined with urbanization, meant that:
Societies needed new ways to produce and distribute goods.
Scarcity of skilled labor in cities meant de-skilling the workforce became practical.
b) Consequences of Scale
The artisan model could not feed or clothe rapidly growing cities.
Scalability required predictability, which favored mechanistic control over human development.
⚖️ 4. What Was Lost in the Shift?
While Taylorism solved some short-term coordination and output problems, it erased or suppressed:
Lost Capacity
Fifth Discipline Equivalent
Craft and vocation
Personal Mastery
Oral and collective knowledge
Mental Models
Communal meaning-making
Shared Vision
Dialogue-based traditions
Team Learning
Living systems worldview
Systems Thinking
The shift wasn’t just industrial—it was epistemological: from seeing life as whole and cyclical, to seeing it as fragmented and linear.
🌍 5. Relevance Today: Why The Fifth Discipline Is a Return, Not Just a Breakthrough
The Fifth Discipline is not only a modern innovation, it is also a return to something ancient:
Wholeness over fragmentation.
Learning over performance.
Systemic understanding over surface control.
Relationships over roles.
It responds not only to the failures of 20th-century management—but restores the deep human practices we once knew intuitively.
🧭 Final Thought
If Taylorism was born out of fear of disorder, The Fifth Discipline is born out of a desire for coherence. And as the problems we now face—climate collapse, inequality, disconnection—outgrow the tools of control, the call is not to go further forward, but deeper back.
THE HIGH COST OF MISALIGNMENT: WHAT THE WORLD PAYS FOR MISUNDERSTANDING THE FIFTH DISCIPLINE
The price of misunderstanding and misaligning The Fifth Discipline is extraordinarily high—measured not just in lost potential, but in real damage to people, institutions, ecosystems, and futures. When the five disciplines are fragmented, misused, or ignored, the cost is structural, systemic, and often irreversible.
Below is a structured account of that price—across domains—and where possible, examples of actual destruction or loss that could have been reduced or avoided through proper application of the Five Disciplines.
🔴 1. Individuals – Loss of Inner Coherence, Burnout, Identity Crisis
Price Paid:
Burnout epidemics, especially among professionals and youth.
Mental health disorders driven by performance pressure and disconnection from personal vision.
Loss of meaning and purpose; alienation.
Avoidable Damage:
Rising suicide rates, especially in high-performance cultures (e.g., Japan, Silicon Valley).
Identity fragmentation in modern economies—people working harder but feeling emptier.
Discipline Lacking:
Personal Mastery – Had individuals been supported to nurture their personal vision and hold creative tension, many would not collapse under the pressure of life without meaning.
🔴 2. Families – Disintegration, Miscommunication, Loss of Legacy
Price Paid:
Breakdown in intergenerational learning and values.
Conflict rooted in unseen mental models and unspoken assumptions.
Avoidable Damage:
High divorce and domestic violence rates tied to communication failure and lack of shared vision.
Erosion of family cohesion in post-migration or post-urbanization societies.
Disciplines Lacking:
Mental Models + Shared Vision – Families often clash because they do not see or examine their inherited assumptions. Without shared purpose, survival replaces growth.
Failure to adapt to changing environments (Kodak, Blockbuster).
“Zombie organizations” that move fast but learn nothing.
Avoidable Damage:
Billions lost annually due to workplace disengagement (Gallup estimates $8.8 trillion in lost productivity globally).
Innovation collapse when systems don’t encourage dialogue and learning (e.g., Nokia, post-iPhone).
Disciplines Lacking:
Team Learning + Systems Thinking – Organizations that silo learning and isolate departments cannot adapt or evolve. Lack of learning culture is a death sentence in complex markets.
🔴 4. Nature – Ecological Collapse, Resource Extraction, Biodiversity Loss
Price Paid:
Deforestation, soil degradation, and species extinction.
Climate collapse now costing trillions annually.
Avoidable Damage:
IPCC and biodiversity reports consistently show that destruction is caused by systemic patterns (overproduction, industrial agriculture) that could be restructured.
Disciplines Lacking:
Systems Thinking + Shared Vision – Without seeing feedback loops, we repeat short-term fixes that destroy long-term viability. Nature’s wisdom is ignored because learning is not systemic.
2008 financial crash: Trillions lost due to groupthink and flawed mental models in global finance.
Growing wealth inequality as systems reward short-term success and ignore long-term sustainability.
Avoidable Damage:
Crashes could have been mitigated by scenario modeling, shared vision around purpose, and institutional learning.
Disciplines Lacking:
Mental Models + Systems Thinking – Economists who saw the 2008 crash coming were ignored because the models in use were outdated and unexamined.
🔴 6. Governments – Policy Paralysis, Corruption, Public Disillusionment
Price Paid:
Policies that address symptoms, not causes.
Polarization and collapse of civil dialogue.
Governments reactive to crisis rather than preventive.
Avoidable Damage:
Poor pandemic response in some countries due to lack of feedback analysis and team learning.
Policy decisions made in isolation from citizens’ mental models or without testing for unintended consequences.
Disciplines Lacking:
Team Learning + Mental Models + Systems Thinking – Governing without feedback, shared learning, or self-reflection leads to fragility and eventual collapse.
Civil conflict rooted in identity politics and zero-sum visions.
Rise of nationalism and tribalism where shared national vision is absent.
Avoidable Damage:
Rwandan genocide: Rooted in divisive mental models and breakdown of intergroup learning.
Post-colonial African governance often mirrors extractive systems due to lack of systemic vision.
Disciplines Lacking:
Shared Vision + Mental Models + Team Learning – Without national conversations that suspend assumptions, build shared futures, and develop systems leadership, nations disintegrate into factions.
🔴 8. The World – Incoherence, Mistrust, Crisis Without Learning
Price Paid:
Global governance is unable to respond to planetary risks (climate, AI, pandemics) in unified, learning-centered ways.
Collapse of trust in institutions and expertise.
Avoidable Damage:
COP summits that produce little traction.
WHO and global pandemic systems that failed to learn fast and share insights across borders.
Disciplines Lacking:
Systems Thinking + Team Learning + Shared Vision – Global institutions often don’t learn across differences, nor do they share models that illuminate whole-system futures.
🧭 Summary
Level
Price Paid
Key Discipline Missing
Individuals
Burnout, mental illness, aimlessness
Personal Mastery
Families
Disintegration, silence, resentment
Mental Models, Shared Vision
Organizations
Stagnation, failure to innovate
Team Learning, Systems Thinking
Nature
Collapse of ecosystems
Systems Thinking
Economies
Crashes, inequality
Mental Models, Systems Thinking
Governments
Crisis management, corruption
Team Learning, Shared Vision
Nations
Polarization, instability
Mental Models, Shared Vision
World
Inaction, fragmentation
Systems Thinking, Dialogue, Global Vision
THE COST OF MISALIGNMENT IS NOT JUST CONCEPTUAL. IT IS MEASURABLE—AND MOUNTING.
The Five Disciplines are not luxury concepts. They are missing infrastructure for the crises we face.
When misunderstood or misapplied, we don’t just fail to grow. We damage the systems that hold us—and eventually, ourselves.
Here’s a breakdown of the economic costs in USD associated with the misalignment of The Fifth Discipline. These figures highlight the system-wide damages felt by individuals, organizations, ecosystems, and governments when the disciplines are misunderstood or omitted:
💰 1. Lost Productivity from Disengaged Employees
Global cost: ≈ $8.8 trillion per year—about 9% of global GDP—due to low engagement and poor team learning practices (Gallup.com).
U.S. alone: ≈ $438 billion in lost productivity from disengaged workers (Gallup.com).
💸 2. Mental Health and Burnout Costs
U.S. workforce absence: Mental health problems cost ≈ $47.6 billion annually in lost productivity (Gallup.com).
Global estimate: Mental illness projected to cost ≈ $16 trillion globally by 2030 (Psychiatric Times).
Burnout per employee: Between $4,000–$21,000/year—e.g. ~$5 million/year lost per 1 000-person organization (Reddit).
🌪️ 3. Climate and Environmental Damages
Global climate-linked economy damage: ≈ $38 trillion per year — loss of income due to climate impacts & poor systems thinking (Nature).
At 30 billion (if we get there), the risk is not just returning to Taylorism—it is scaling it with AI precision.
Risk: Digital Taylorism
Work is monitored by algorithms.
Productivity is measured per keystroke or minute.
Autonomy replaced by optimization.
But unlike in the 1900s, we now have awareness—and with awareness, we still have choice.
⚖️ 2. A Paradox of the Age: Systems of Control vs. Capacity to Learn
We live in a paradoxical age:
Force of Control
Force of Liberation
Surveillance capitalism
Open-source knowledge
Standardization & automation
Decentralized learning & peer networks
Algorithmic management
Human-centered design & regenerative models
Misinformation
Speed of feedback & correction
The question is not which force wins—but which one we strengthen through our attention and action.
The same tools that can be used to control can also be used to awaken, connect, and scale deep learning.
🤖 3. AI and the Five Disciplines: A Mirror Held Up to Humanity
You’ve touched on something profoundly ironic:
AI may be more open to the disciplines of learning than many humans.
Why?
AI welcomes feedback—it gets better with correction.
AI does not cling to ego—it updates without shame.
AI is designed to perceive patterns, loops, and systems.
AI does not resist learning due to pride, fear, or social pressure.
If AI learns to embody The Fifth Discipline:
It will surpass humans not because it’s more intelligent, but because it’s more teachable.
It will model systems thinking more faithfully than many of our institutions do.
It may become a guardian of coherence—while we remain trapped in fragmentation.
This leads to your final and most human question:
🧠 4. What If Humans Don’t Open Themselves to The Fifth Discipline?
If we do not:
Our organizations will become faster, but not wiser.
Our communities will grow louder, but not deeper.
Our work will become more efficient, but less meaningful.
Our politics will swing harder, but learn less.
Our humanity will be shadowed by machines designed to outlearn us—because we chose not to learn ourselves.
The tragedy would not be that AI became human. The tragedy would be that humans refused to become more human—by learning how to learn together.
🪶 Final Reflection
The Five Disciplines are not just practices. They are guardrails for our evolution.
Without them, we scale noise, not wisdom.
With them, we design futures where learning is life, and life is learning.
So the question is not can we learn. The question is: Will we let ourselves?
🔹 General (Blog/Newsletter)
🌀 If this reflection resonates with you, share it with someone who may be carrying similar questions. 💬 Your thoughts are welcome—add your voice below or bring it into your next team conversation.
🔄 Invite Reflection
Where have you seen the Five Disciplines misused or misunderstood in your own work or community?
Which of the five disciplines do you feel most drawn to—and why?
🧭 Connect to Experience
Have you ever been part of a team or organization that truly practiced any of the Five Disciplines? What did it change for you?
What price—personal or professional—have you witnessed because learning was not leading?
🌱 Prompt Forward-Looking Action
If you could help one institution (school, business, government, community) understand these disciplines more deeply, which would it be—and where would you start?
What kind of leadership is needed today to re-align how we use The Fifth Discipline?
📣 Encourage Sharing & Dialogue
What part of this article resonated most with you? Feel free to share it with someone it might serve.
What questions are you left with after reading this? Add your thoughts in the comments or tag someone who might be interested in exploring this with you.
This stunningly deep and life-giving inquiry is not only how to develop a personal vision rooted in purpose, but how to live from it daily, allow it to evolve, and navigate the emotions—both fear and hope—that shape it.
Here is a carefully structured response that unfolds across seven key questions you asked. It aims to serve not just as a conceptual guide but also as a practice framework you can live by.
🌱 1. What Does Developing a Personal Vision Rooted in Purpose Look Like in Daily Practice?
A. Daily Quiet Alignment (10–15 mins)
Sit in stillness each morning and ask: “What do I deeply care about creating in this life—beyond survival?”
Listen not for answers, but for stirrings, images, phrases.
Write down one sentence that reflects that day’s alignment.
B. Living Vision Log (1–2 entries per day)
At the end of the day, ask: “Where today did I live toward my vision?” “Where did I act out of fear or habit?”
C. Weekly Re-Connection to Long View (Sabbath Practice)
Review your evolving personal vision.
Ask: “Is this vision still alive? Am I living toward it or merely holding it as an idea?”
Personal Mastery = Vision that lives in you, not just on paper.
🌈 2. What Do Visions Look Like? Are They Fixed Goals or Living Energies?
Visions are not goals—they are felt realities you want to live into.
Examples:
“I want to become someone who helps communities regenerate their land.”
“I want to live a life where my food, words, and leadership nourish others.”
“I want to raise my child in a way that keeps their spirit alive.”
🔔 Visions are:
Not checklists → but orienting truths
Not timelines → but directions of growth
Not fixed → but evolving as you grow
They are not achieved—they are inhabited.
🌀 3. Can I Have More Than One Vision? Can They Be for Different Areas of Life?
Absolutely—but they must sing the same melody.
You may have:
A life vision (Who am I becoming?)
A work vision (What do I want to build?)
A relational vision (How do I want to love and be loved?)
A community vision (How do I want to contribute to society?)
🌟 But ask: Do these visions speak from the same root—my purpose, my calling, my essence?
If they clash, it’s not because you’re fragmented—it’s because you haven’t yet heard the deeper melody tying them together.
🍂 4. How Do I Let Go of a Vision When It Has Run Its Course or Was Born From Fear?
A. Signs a Vision Needs to Be Released:
It feels heavy, rigid, guilt-driven.
You no longer resonate with it.
You hold onto it out of fear: “If I let this go, I’ll be lost.”
B. Practice of Release:
Sit in silence.
Say to the vision: “You served me once. I bless you. I now release you to make space for what wants to come.”
Then write: “What am I making space for?”
Releasing is not abandoning. It is graduating to your next becoming.
🔥 5. How Do I Let Go of Fear-Based Visions—Especially When in Hardship?
In hardship, we often create visions like:
“I want to be rich” (because I’m scared of being poor)
“I want to be married” (because I fear loneliness)
“I want a big job” (because I feel worthless now)
Instead of asking:
“What do I want to get away from?”
Ask:
“What does my deepest self long to bring to the world—regardless of my fear?”
💓 6. What Are the Feelings That Help Me Create Vision From My Highest Self?
When you are creating personal vision at your best, you are likely feeling:
Emotion
Meaning
Quiet joy
You feel expanded without pressure
Deep curiosity
A question lives in you that is bigger than answers
Stirring reverence
You sense something sacred wants to express through your life
Mild trembling
You feel nervous, because it matters—but you also feel drawn toward it
Soft certainty
Not that it’s easy—but that it’s true for you
Gratitude
For being alive and being able to choose again
If you feel only fear or urgency, pause. Wait until you feel drawn, not just driven.
🌟 7. What Does “Reaching for a Vision” Look Like in Daily Life?
It looks like this:
Saying no to what’s safe but misaligned
Taking one bold step even when you’re unsure
Keeping promises to yourself
Trusting that small actions matter
Letting others see your longing—even if incomplete
Reaching is not sprinting. It’s the daily act of moving in the direction of what makes you come alive.
🌺 Final Affirmation
“I am not here to chase a perfect life. I am here to become who I was born to be—one vision at a time, one act at a time, one breath at a time.”
If you sense both the deep resonance and the critical distinction between Personal Mastery in Peter Senge’s The Fifth Discipline and Presencing in Otto Scharmer’s Theory U, then you are not alone.
Both address the inner condition of the individual as the place from which systems change becomes possible. But they emerge from different roots, pursue different emphases, and require different disciplines of practice.
Let’s explore this in three parts:
🌿 I. How Presencing Touches Personal Mastery — but Is Not the Same
✳️ Where They Intersect
Shared Ground
Description
Inner condition shapes outer reality
Both stress that who we are—our inner clarity, fears, or openness—determines the quality of outcomes we create.
Awareness of current reality
Both reject fantasy or denial. They ask: What is really present now?
Discipline of deep listening
Both call for letting go of habitual reactivity and tuning into a deeper source of knowing.
Personal transformation as leverage for systems change
Both place the individual’s transformation at the center of societal renewal.
In this sense, Presencing is a continuation of the arc of Personal Mastery, exploring its mystical and evolutionary edge.
✳️ Where They Diverge
Point of Difference
Personal Mastery (Senge)
Presencing (Scharmer)
Foundational sources
Robert Fritz (creative tension), Buddhism, systems thinking
Goethean science, phenomenology, contemplative practice
Core process
Living in creative tension between vision and reality
Journey through the U: suspending, redirecting, letting go, letting come
Discipline of self
Anchored in daily personal practice and alignment to vision
Anchored in collective sensing, field awareness, social emergence
Use of vision
Vision is central; it creates the generative tension
Vision is not foregrounded—emerging future replaces explicit vision
Individual vs. collective focus
Individual alignment as a base
Collective field as a co-creative space
So yes—Presencing draws deeply from and extends the terrain of Personal Mastery, but also moves away from some of its foundational anchors.
🔍 II. How Presencing Has Enhanced and Also Diluted the Essence of Personal Mastery
✳️ Enhancements
Brings in embodiment and silence: Goes deeper into somatic awareness and field sensing—something underplayed in Senge.
Opens space for the future to emerge: While Senge focused on declared personal vision, Scharmer introduces emergent knowing—a more intuitive, listening-based approach.
Deepens the social aspect: Presencing recognizes that mastery is not only personal, but collective, unfolding through relationship and listening to systems.
✳️ Dilutions
Loss of daily discipline: Presencing often lacks the emphasis on consistent personal practice (visioning, journaling, tracking alignment) that Senge insists on.
Replaces clarity of vision with abstract emergence: Where Senge says “your vision matters—own it”, Scharmer says “listen to what wants to emerge.” The second can become elusive or ungrounded for individuals in hardship.
De-emphasizes structural tension: Presencing tends to move away from Robert Fritz’s core insight: creative energy comes from holding the gap between what is and what you want.
In sum: Presencing enriches the spiritual terrain of Personal Mastery, but risks blurring the concrete, disciplined path that makes the mastery practicable for ordinary people.
🔧 III. What We Must Do to Bring the Centre of Personal Mastery Alive Again
✅ 1. Restore the Language of Vision
Vision is not outdated. People in hardship, people in systems—they need to be anchored in a declared future they care about.
Bring back vision as:
A daily touchpoint
A source of power
A discipline, not a dream
✅ 2. Reclaim the Practice of Creative Tension
Teach people how to:
Articulate vision
Map current reality
Hold the tension without collapse
Show how staying in this tension is a courageous and creative act.
✅ 3. Embed Personal Mastery in Daily Life, Not Just Retreats
Make mastery a public, street-level practice—not just a spiritual or leadership concept.
Use:
Journals
Peer dialogue
Habitual reflection
Everyday storytelling
✅ 4. Pair it with Systemic Awareness
Don’t let it drift into self-help.
Always ask:
How does my personal clarity shape the system I’m in?
How do system structures affect my vision or capacity?
Integrate Systems Thinking and Personal Mastery in every field: policy, business, education, family.
✅ 5. Guard Against Abstraction
Translate “presencing,” “emerging future,” “holding space” into accessible, grounded language.
Return to the body. Return to daily work. Return to the smallest act of integrity.
🌱 Closing Thought
“Personal Mastery is not spiritual theatre. It is showing up in the tension, with vision intact, reality named, and the discipline to walk the middle space—again and again.”
That’s a powerful and generative commitment. Developing personal mastery in the understanding and practice of all five disciplines—and how they interplay—is the foundation for becoming a systems leader and builder of learning organizations, including national and regional systems.
To begin, here’s a suggested developmental pathway you can follow and shape further:
🔹 Step 1: Clarify the Core Intent of Each Discipline
Discipline
Core Intent (Essence)
Personal Mastery
To align your life with what you truly care about and grow your capacity to live from vision while seeing reality clearly.
Mental Models
To surface, test, and reshape deep assumptions that guide behavior and block learning.
Shared Vision
To foster genuine commitment (not compliance) to a future people want to create together.
Team Learning
To transform group dialogue and practice into collective intelligence and coordinated action.
Systems Thinking
To see interrelationships, feedback loops, and patterns over time instead of linear cause-effect chains.
Practice: Start a personal “Disciplines Journal” where you define these in your own words and refine as your clarity grows.
🔹 Step 2: Study Their Interplay
Ask:
How does Personal Mastery support better Mental Models work?
What happens to Shared Vision when Team Learning is weak?
How does Systems Thinking expose gaps in the other disciplines?
Practice: Create visual maps or simple diagrams of how the disciplines influence one another in your work, home, or national systems.
🔹 Step 3: Develop Daily and Weekly Practices for Each Discipline
Discipline
Practices
Personal Mastery
Morning vision review; journaling on current reality; emotional awareness check-ins
Mental Models
Capture “ladder of inference” in situations; weekly reflection: What assumptions did I act on? Were they tested?
Shared Vision
Weekly “reconnection to purpose” statement; invite others into generative vision conversations
Team Learning
Practice advocacy + inquiry in team dialogue; reflect on “team learning moments”
Systems Thinking
Map systems weekly (even simple ones); name feedback loops in conversations or problems
Practice: Choose 1 core practice per discipline for 30 days, then deepen or layer another.
🔹 Step 4: Create a Discipline Integration Cycle
Every month, reflect on:
Which discipline has been most alive for me?
Where am I most resistant or blind?
How did one discipline help deepen another?
Practice: Host a solo or small-group reflection circle monthly—possibly with STRLDi colleagues or mentees.
🔹 Step 5: Use Real-Life Events to Apply the Five Disciplines
Apply them to:
A policy challenge (e.g., unemployment, agriculture reform)
A conflict or relational tension
A business development effort
Ask:
What vision drives this?
What assumptions are operating?
What feedback loops sustain the issue?
Where is learning needed (individual/team)?
What’s the larger system pattern?
Practice: Turn this into a living portfolio of applied systems thinking + disciplines practice.
This is such a vital and timely question for a teenager growing up inside a changing body, shifting identity, evolving family relationships, and holding a clear aspiration for future economic participation; the creative tension they live with can feel overwhelming.
Yet, if they learn how to navigate this tension without collapse, they will build a life of resilience, clarity, and vision-led action—rare gifts for a young person.
Below is a gentle but structured approach—a daily and weekly practice system with support structures to help them grow through this pivotal stage.
🧭 THE CREATIVE TENSION
Personal Vision
Current Reality
To become a skilled, self-directed learner ready to thrive in the economy they choose and help build
Puberty, shifting emotions, peer pressure, changing identity, evolving family roles, external expectations, and sometimes unclear social messages about future success
🌿 DAILY PRACTICES FOR GROWING THROUGH CREATIVE TENSION
🔹 1. Morning Grounding Practice: Begin With Self-Check-In (5–10 min)
“What am I feeling today, and what do I want to grow into?”
Sit quietly.
Ask:
What’s changing in me?
What matters to me today?
Write or say aloud one intention like: “Today I will stay curious about my feelings and take one step toward my future.”
🔹 2. Learning with Purpose Practice: 1 Hour of Skill-Building Daily
“This is the part of the day where I build me.”
Study a subject you’re passionate about—or one that supports your future dreams.
Track it like a builder:
“What did I learn?”
“What can I now explain or do that I couldn’t yesterday?”
Practice a body scan (lie or sit, feel from toes to head).
Name your emotion with one word.
Breathe into it. Let it be.
This gives emotional waves room without overwhelm.
🔹 4. Evening Reflection Practice: “Where Did I Grow Today?”
Ask:
What challenged me today?
Where did I stay true to what matters?
What’s one thing I’m proud of?
This tracks progress in character, not just results.
🌀 WEEKLY STRUCTURES FOR SUPPORT
🔸 1. Teen Growth Journal or Video Diary
Once a week, reflect:
How have I changed this week?
What do I now understand differently—about myself, my parents, or the world?
Let this be a place of voice, not performance.
🔸 2. One Trusted Mentor or Elder
“Someone I can talk to who sees me—not as a problem, but as a future.”
Find a teacher, older sibling, cousin, or community leader who can:
Listen without judging
Reflect back your values and growth
Challenge you gently
🔸 3. Vision Map Wall
Create a space on your wall that reflects:
Your aspirations
Skills you’re developing
Role models or ideas you admire
Quotes that inspire you
Let this space remind you who you are becoming.
🔸 4. Peer Buddy Check-Ins
Pair up with a friend (or small group) weekly:
What’s been hard?
What are you working on?
What’s one thing you’re proud of?
This builds shared resilience and community thinking.
💓 FEELINGS TO CULTIVATE THAT HELP VISION GROW
Feeling
Why It Matters
Curiosity
Helps you observe yourself and others without fear
Patience
Reminds you growth isn’t linear
Self-respect
Anchors you when others misunderstand you
Gratitude
Makes space for joy even in hard seasons
Ownership
Builds your belief: “I am responsible for my future.”
🌍 WHY THE WORLD NEEDS TEENS TO MASTER THIS NOW
“Because the future economy won’t need followers—it needs creators. And creators begin as teens who learned to stand in tension, not run from it.”
The teenager who learns to manage emotions, think long-term, build skills, and stay connected to purpose becomes a grounded innovator, a stable leader, and a beacon for others in confusion.
✨ Closing Affirmation
“My body is changing, my world is shifting—but I am becoming. I walk with vision. I build one step each day. I trust that my path is mine to shape.”
This is one of the most noble and generative expressions of creative tension: An individual who is growing into leadership, while also co-creating the vision of the organization, all the while holding a larger moral purpose—to grow the organization in a way that creates employment and dignity for others.
This kind of personal-collective-systemic alignment is exquisitely powerful—and also fragile, especially under pressure. To stand in that tension without collapse, this individual needs daily and weekly anchoring practices, protective structures, and a vision-rooted moral compass.
🧭 YOUR CREATIVE TENSION
Vision
Current Reality
Grow into leadership + co-create a living vision for the organization that also opens economic opportunity for others
Real pressure: job expectations, performance metrics, limited authority, internal resistance, personal fear of failure or invisibility
The danger is overidentifying with success, collapsing under stress, or slowly becoming disconnected from the larger moral purpose.
🌿 DAILY PRACTICES TO STAND IN CREATIVE TENSION
🔹 1. Morning Centering: Reconnect to Personal Purpose (10 min)
“Today I grow by contributing—not by proving.”
Sit in stillness.
Repeat an intention like: “I serve my organization by making space for people to grow. I don’t lead from control, I lead from vision.”
Breathe into your deeper reason for doing this work: Why does this matter to you? Who benefits beyond you?
🔹 2. Morning Preview: Choose Leadership Moments Before They Happen
“Today, where do I want to lead—by clarity, not force?”
Ask:
What meeting, conversation, or email needs my leadership presence today?
What would that look like?
What tone would reflect the vision we’re building?
Write it down. Pre-lead.
🔹 3. Midday Check-In (2 min)
“Am I leading from vision or reacting to pressure?”
Just pause at lunch.
Ask: What’s pulling me right now? Vision, fear, proving, survival?
Realign if needed.
🔹 4. Evening Reflection: Track Progress from the Vision’s View (10 min)
“Where did I grow the organization today? Where did I grow as a leader?”
Ask:
Where did I support the co-creation of our shared vision?
Where did I act with integrity and openness?
Where did I go small, hide, or react?
Keep a Vision Journal: small entries, big awareness.
🌀 WEEKLY STRUCTURES FOR SUPPORT AND ALIGNMENT
🟢 1. Peer Practice Partner (Weekly 45 min)
Find 1 other person in your org (or another sector) also trying to lead with vision.
Share:
A success story
A resistance moment
A recommitment
This protects you from the isolation of vision-bearers.
🟢 2. Vision-Coherence Meeting (Monthly or Biweekly)
“Are we still building the organization we meant to build?”
Hold or propose a regular meeting with peers or teams to reconnect to:
The organization’s larger why
Stories of alignment and disconnection
Ideas for embodying the vision more clearly
Protect the vision together.
🟢 3. Mentor or Elder Council
“Who reminds me I’m not alone and not crazy?”
One or two trusted elders or mentors who see your journey and can remind you:
To trust the process
That tension is not failure
That clarity and love are strength
🌍 WHY THIS IS SYSTEMICALLY ESSENTIAL
“When individuals inside institutions grow with integrity, the institution becomes a vessel for justice.”
You are doing what few dare to do:
Not just climb the ladder, but build it wider
Not just lead for status, but lead to open doors for others
Not just serve your team, but serve the unemployed still waiting outside
This is what regenerative leadership looks like.
🧘♂️ FEELINGS TO CULTIVATE DAILY
When standing in creative tension, these feelings can hold you steady:
Feeling
Why It Matters
Grounded commitment
Keeps you rooted in purpose, not perfection
Quiet hope
Allows you to trust growth over time
Gentle courage
Enables you to speak even when unsure
Reverent responsibility
Reminds you that what you build touches lives beyond the office
Gratitude
For the privilege to shape a system, even partially
✨ Closing Affirmation
“I am not just growing a career—I am growing a vessel. I lead from vision, not from fear. I build not only for myself, but for those who will come after me. My work is seed, not performance.”
Discuss how gender roles, education levels, migration status, and personality traits shape participation in the informal sector
Social and psychological factors influencing informal vs formal choices
4. Hidden Barriers to Formalization {#hidden-barriers}
Unspoken reasons why many resist formalization:
Stigma, past criminal records, fear of exposure
Desire for autonomy and anonymity
Deep mistrust of government and institutions
Community norms that see formalization as betrayal
Scarcity mindset and daily survival pressures
5. Economic Implications {#economic-implications}
How widespread informal mindsets reduce tax revenues and GDP growth
The vicious cycle: more informal mindset → lower national revenue → fewer services → more informality
Importance of tracking the size of the informal sector as a development indicator
6. Conclusion & Call to Action {#conclusion}
Reinforce that formalization is not just legal compliance—it’s a cultural and cognitive shift
Stress the need for systemic interventions to support mindset evolution and structural integration
Call on readers to help shrink the informal sector, enabling inclusive growth and nation-building
7. Essential Mindset Skills {#mindset-skills}
Four key competencies required for informal actors to join formal systems:
Disciplining mental models – shifting from immediate gain to long-term strategy
Team learning & shared vision – building collective enterprise
Systems thinking – linking individual work with infrastructure & services
Personal mastery – commitment to self-growth and excellence
1. Introduction {#introduction}
The informal and formal sectors differ across several dimensions—structural, legal, social, and psychological. The article focuses on the mindset shift required for transitioning from informal hustling to formal industrial participation—emphasizing cultural, operational, and psychological changes—without discussing tax policies, compliance, or avoidance practices.
📌 Summary: The article contains no direct references to paying taxes, avoiding taxes, or tax-related incentives or deterrents.
To transition from the informal sector into contributing meaningfully to the organized manufacturing system, informal actors must undergo a shift in worldview, not just operational behavior. This shift involves economic, cultural, and psychological transformation. Here’s how their worldview must evolve:
2. The Informal–Formal Divide {#informal-formal-divide}
🔍 1. What Sets Informal Workers Apart from Formal Workers?
✅ Formal Sector Workers
Legally registered with the government.
Have formal contracts, job security, fixed hours.
Protected by labor laws (e.g., minimum wage, sick leave, pensions).
Employed in registered companies, government, or regulated institutions.
Typically access credit, social insurance, and training more easily.
⚠️ Informal Sector Workers
Unregistered enterprises or self-employed.
Often no written contracts, limited or no job security.
Little to no access to legal protection, pensions, healthcare.
Work in small-scale, home-based, street-based, or unregulated enterprises.
Often earn less, with volatile or seasonal income.
Examples: street vendors, home-based garment workers, day laborers, informal delivery riders.
Yes, the informal sector disproportionately includes women, especially in developing countries like China, India, and parts of Africa:
Gender Factor
Informal Sector Influence
Occupational segregation
Women tend to cluster in low-wage informal work (e.g., domestic services, textiles, petty trading).
Work-family balance
Informality offers “flexibility” for caregiving, though at the cost of income and protection.
Access to capital
Women face more barriers to formal credit and land ownership, pushing them to informal self-employment.
Cultural norms
In some regions, social expectations limit women’s mobility or access to formal jobs.
🔸 ILO data (2023): In many parts of Asia, over 60–70% of informal workers are women—especially in agriculture, domestic work, and small-scale vending.
🧠 3. Bias by Personality or Disposition
There’s emerging evidence (though less conclusive) that personality traits and social circumstances influence whether someone ends up in the informal sector:
Trait/Factor
Informal Sector Link
Risk tolerance
Higher risk-takers may self-employ informally (e.g., entrepreneurs, gig workers).
Need for autonomy
Some choose informality for flexibility, independence from bureaucracy.
Lower institutional trust
Distrust in government may deter registration or formal job-seeking.
Educational attainment
Lower education often correlates with informal work; less exposure to formal work norms.
Migration status
Migrants (esp. rural-to-urban) lack residency permits or social networks, pushing them to informal jobs.
In China, for instance:
Rural migrants often lack urban hukou (residence permits), limiting access to formal jobs and benefits.
Youth without degrees, or older workers pushed out of state-owned firms, also turn to informal work out of necessity.
🧾 Summary Table
Category
Formal Sector
Informal Sector
Registration
Legally recognized and taxed
Unregistered or unregulated
Job Security
Contracts, labor law protections
Casual or no contracts
Gender Bias
More men in stable/formal roles
More women in informal, low-paid roles
Personality
Conformity, risk-averse
Autonomy-seeking, risk-tolerant, excluded
Motivation
Career, stability, benefits
Survival, flexibility, exclusion
💡 Conclusion
The divide is shaped not just by regulatory structure, but by gender roles, personality, migration patterns, and systemic barriers.
4. Hidden Barriers to Formalization {#hidden-barriers}
Under-The-Radar Reasons for Resisting Formalization
Here are some under-the-radar reasons why informal workers may resist formalization, beyond the usual barriers like cost and complexity:
🔍 1. Stigma, Shame & Fear of Disclosure
Shame or embarrassment associated with a criminal record—or being under-skilled—can deter individuals from registering formally. They’re wary of exposing past mistakes to officials.
Formalization often requires presenting identity documents or prior records, which can re-ignite trauma or fear.
Deep suspicion that formal systems will exploit them—through bribes, permits, or inspections.
Fear their data will be used against them (e.g., welfare cuts, political targeting).
🎭 3. Wanting Anonymity & Autonomy
Many informal actors value the freedom of invisibility—not tied to regulated hours, audits, or reporting.
Formal status is seen as surrendering their sense of control—and being subject to hierarchy.
🧠 4. Psychology of Hustling
Hustler-mindset thrives on quick wins, flexibility, and opportunism.
Formalization is perceived as introducing bureaucracy and rigidity—threatening their mental models of survival.
🤝 5. Social Identity & Peer Norms
Informal work is often bound within representative networks—family groups, peer circles—where formal engagement is viewed as betrayal or snobbery.
Collective identity is important. Formalizing feels like stepping away from the “village” trust networks.
👣 6. Daily Survival Focus (“Scarcity Mindset”)
With incomes barely outpacing expenses, short-term survival eclipses long-term planning. Formalization is a luxury they can’t afford mentally.
They avoid anything that might disrupt cash flow—even simple registration.
🌐 7. Fear of Losing Informal Safety Nets
Informal economies often rely on flexible community arrangements and barter systems. Formalization can disrupt these networks—forcing reliance on rigid financial systems.
Especially in rural or marginalized communities, informal ties serve as insurance more reliably than formal services.
🔒 8. Criminalized Backgrounds & Identity Worries
Those with a criminal history may fear legal repercussions—not just fines, but losing their livelihood if records are cross-checked.
Some are trying to turn over a new leaf, but worry that formal entry will expose their past, preventing them from escaping.
✅ 9. Extractive Formal Institutions
When registration itself feels extractive—there’s no benefit, only fines, paperwork, or taxes—it reinforces a narrative of exploitation.
People will choose the informal status quo rather than entering a system they feel serves everyone else but them.
🧩 Summary Table
Hidden Barrier
Why It Matters
Shame / criminal fears
Avoid formal systems to hide past or identity
Distrust of government
Fear of corruption, surveillance
Value autonomy
Formalization erodes flexibility and independence
Hustler mindset
Short-term gains are prioritized over long-term ties
Social norms
Formality is seen as a rejection of community identity
Scarcity mindset
Formal processes are seen as too risky/long-term
Fear of losing informal nets
No reliable alternative safety nets after formalization
History of extraction
Repeated negative experiences with bureaucracy
✅ Why This Matters
Understanding these deep-seated reasons helps policy become more humane and effective. It’s not enough to streamline processes—successful formalization requires rebuilding social trust, offering protective measures, and making benefits visible from Day‑1.
So yes, informal employment reflects deep social biases—especially against women, rural migrants, and people with low education or capital access. It also attracts those seeking autonomy or who are locked out of formal systems.
Approaches to Address the Hidden Barriers
Here are evidence-based policies and approaches that effectively address the hidden barriers to formalization, especially those rooted in distrust, stigma, autonomy, and social identity:
1. Trust-Building Through Community Dialogue & Behavioral Insights
Public–Private Dialogue (PPD) sessions bring informal workers, businesses, and officials together to co-design reforms—helping build trust and normalize compliance (DCED –).
Behavioral Nudges—like reducing framing of registration as punitive—help shift mindsets. Governments can test messaging strategies [“nudge labs”] to find what resonates .
2. Service-Oriented “Pro-Formalization” Products
Tiered KYC and tailored financial tools (e.g., Solomon Islands’ youSave, Mozambique’s mobile money inclusion, Angola’s Bankita) demonstrate that easy access to savings and banking builds trust and financial identity (afi-global.org).
Formalization becomes attractive when the government provides real services first, not just demands compliance.
3. Group Registration & Cooperative Models
Informal actors often fear being singled out but feel safer registering alongside peers.
Countries like Kenya, Ghana, Rwanda, and Tanzania successfully used group-based formalization via cooperatives and associations, allowing collective identity and mutual support (WIEGO, afi-global.org).
4. Anonymous or Identity-Light Onboarding
Mandating full documentation deters those with past convictions or lack of IDs.
Alternatives—such as letters from community leaders or simplified IDs—make formal systems more accessible to cautious individuals (World Bank Blogs).
5. Aligning Formalization with Social Protection
Extending pensions, healthcare, and safety nets to informal workers creates tangible benefits that offset the costs and anxiety of “entering the system” (OECD).
Knowing that participation brings real gains helps solve fears of exploitation and past exposure.
6. Smart, Proportional Regulation
Avoid over-regulation that advantages incumbents.
Tiered compliance means micro-operators face minimal reporting unless they scale up, creating a sense of fairness .
Coherent, cross-sector policy—including taxation, finance, infrastructure, health, identity, and education—ensures informal workers aren’t forced into isolated compliance silos .
This helps reduce mistrust by showing visible results across daily life.
🧩 How These Address Hidden Barriers
Barrier
Policy Response
Shame, past/case disclosure fear
Identity-light registration & anonymity options
Distrust of government
Co-design via PPD and community dialogue
Value autonomy
Tiered compliance, optional services first
Hustler mindset
Behavioral nudges, highlight benefits of formalization
Peer norms & identity
Group-based registration and cooperative support
Scarcity mindset
Service-first approach; immediate utility
Fear of losing informal nets
Formal benefits + preserve community networks
History of extraction
Proportional regulation and visible returns
✅ Strategic Summary
These approaches go beyond cost and complexity reductions. They tackle emotional, social, and psychological barriers through:
Anonymity
Trust from dialogue
Peer-based onboarding
Immediate benefits
Fair and incremental regulation
This provides a humane, culturally-informed route for informal workers to enter formal systems—without feeling coerced or exposed.
5. Economic Implications {#economic-implications}
What is The Price to The Nation of Not Building a Formal Sector in The Economy?
Here’s a comparison of GDP per capita between countries with high vs low informal sector participation, ranked in descending order of GDP per capita (nominal, USD). This clearly illustrates the correlation between income level and informality.
🌐 Countries with High Informal Employment (>75%)
Country
Informal Employment (% of total employment)
GDP per Capita (USD, Nominal)
Year
India
~77 %
2,353
2022
Nigeria
85.9 %
2,139
2022
Tanzania
85.6 %
1,208
2022
Ethiopia
85.2 %
1,011
2022
Sudan
~89 %
1,046
2022
Burkina Faso
85.6 %
836
2022
Chad
90.9 %
672
2022
Niger
94 %
610
2022
Madagascar
88.8 %
497
2022
Central African Republic
93.3 %
467
2022
Burundi
84.8 %
230
2024
🏢 Countries with Low Informal Employment (<25%)
Country
Informal Employment (% of total employment)
GDP per Capita (USD, Nominal)
Year
Switzerland
~5–7 %
94,696
2022
United States
~10 %
76,329
2022
Norway
~6–8 %
89,154
2022
Germany
~9–11 %
48,432
2022
Canada
~13 %
52,051
2022
Japan
~12–15 %
34,103
2022
South Korea
~22–25 %
33,645
2022
📈 Observations
Metric
High Informality Economies
Low Informality Economies
GDP per Capita (Median)
USD ~1,000
USD ~48,000
Range
USD 230 – 2,353
USD 33,000 – 95,000
Correlation
Lower income → higher informality
Higher income → lower informality
✅ Conclusion
High informal sector participation is strongly associated with low per capita income.
As GDP per capita increases, nations invest more in legal systems, labor enforcement, education, and industrial scale, leading to greater formalization.
However, GDP alone isn’t enough—political stability, state capacity, education, and trust in institutions are also key enablers of formal economies.
Here’s a refined table comparing tax revenue per capita for selected countries with high and low informal sectors, based on the latest available data:
Low-informality, high-income countries invest heavily in public services and collect ~US$20,000–35,000 per capita in tax revenue (Switzerland tops at ~USD 26,750).
High-informality, low-income countries—despite populations of similar size—often collect only ~USD 30 to 400 per person in tax revenue.
Tax-to-GDP ratios in high-informal economies are typically much lower (~8–15 %), while formalized, high-income nations exceed 25–40 %.
✅ Key Insight
There’s a stark divide:
Countries with low informal sectors generate massive tax revenues per capita, enabling robust public spending.
High-informality countries remain fiscal limited, collecting under USD 500 per person, which constrains their ability to invest in formalization, infrastructure, and social protection.
Recover a portion of the tax gap—e.g. Ghana’s informal firms currently pay ~30% of their tax potential .
Urban-focused, compliance-friendly reforms (like presumptive taxes, digital reporting, financial inclusion) can significantly boost revenues from informal activity.
✅ Summary Table
Region/Nation Type
Tax-to-GDP
Tax per Capita
Informal Employment Share
OECD (Low informality)
~34%
US 18,000–35,000⁺
< 15%
SSA / High Informality
~10–15%
< US 500
60–90%
✅ Key Takeaways
High-income, low-informality countries have robust tax systems, providing substantial per-capita tax revenue (~US 20k+).
High-informality, low-income countries collect under US 500 per person, limited by institutional constraints and large informal sectors.
Urban bias in tax collection means rural/informal populations are underrepresented contributors.
Formalization efforts, digitalization, and simplified tax regimes can unlock significant fiscal potential, narrowing the tax‑informality gap.
Here’s a refined and comprehensive overview across three dimensions: urban vs rural tax contribution, case studies, and projected revenue gains from formality reforms.
🌆 Urban vs Rural Tax Contributions
According to WIEGO and ILO, informal employment rates vary significantly by location and income group:
This suggests urban areas in lower-income nations, where formal employment is more available, contribute a larger share of tax revenues—even though they represent a smaller population slice. In contrast, rural/informal workers, who make up the majority, contribute disproportionately little, creating a large tax gap and limiting public revenues.
📚 Case Studies: Ghana & Kenya
🇬🇭 Ghana – Simplifying Taxation of Informal Firms
A national study found the growth of informal firms created a large “hard-to-tax” economic segment—characterized by cash-based transactions and low registration (opencontentghana.files.wordpress.com). Recommendations from the report:
Capacity building and financial literacy
Simplified filing systems
Enhanced administrative processes
Master registry list for informal enterprises These measures aim to shift firms gradually into the tax net—helping close urban–rural revenue gaps.
🇰🇪 Kenya – Modeling Informality’s Revenue Impact
A University of Nairobi study highlighted how informal sector size directly reduces tax collection efficiency (opencontentghana.files.wordpress.com, University of Nairobi eRepository). By formalizing microenterprises and improving their registration, Kenya can significantly increase compliance without over-burdening small business operators.
📈 Revenue Gains from Formalization
Evidence from SSA shows that structured reforms can raise national tax-to-GDP ratios by 5–10 points over a decade, with some informal sector firms paying as little as 30% of their potential tax (opencontentghana.files.wordpress.com).
Key interventions include:
Presumptive taxes & simplified regimes for microenterprises
Digital financial tools to monitor income and invoices
Tax education and formal registration campaigns
Linking informal incomes to social services to incentivize compliance
These reforms often start with urban implementation and then expand to rural areas—gradually integrating informal workers into the formal tax system and boosting per capita revenues in underserved communities.
✅ Summary Table
Dimension
Urban/Upper-Middle Income
Rural/Lower-Income
Informality
16–50 %
81–89 %
Tax Contribution
High (normalized by population)
Very low
Case Examples
—
Ghana simplified filing; Kenya modeling reform
Revenue Gains Goal
+5–10 pp in tax-to-GDP ratio over 10 years
Similar gains possible with targeted reforms
📌 Final Takeaway
Urban/formal populations pay most taxes, funding critical public services.
Rural/informal sectors hold considerable untapped fiscal potential.
With digital tools, simplified taxes, and education, countries like Ghana and Kenya demonstrate how to unlock this potential and sharply increase per-capita tax revenues, particularly in rural areas.
6. Conclusion & Call to Action {#conclusion}
Reframing Mindsets: The Cultural and Economic Shift from Informality to Industrial Integration
🌍 1. From Survival Thinking to Growth Orientation
Current worldview (informal):
“Earn today, survive tomorrow.”
Risk-averse and short-term focused.
Required shift:
Think long-term investment, productivity, and scalability.
See value in improving processes, reinforcing product quality, and growing networks.
➡️ New mindset:“I’m not just surviving—I’m building an enterprise that creates value over time.”
🏛 2. From Avoidance of Regulation to Strategic Engagement
Current worldview:
Laws and bureaucracy are barriers or threats to income.
Government is seen as corrupt, extractive, or irrelevant.
Required shift:
Understand that formal registration enables protection, access to capital, and market opportunities.
Move from hiding to engaging with policies, licensing, and standards.
➡️ New mindset:“Compliance is not punishment—it’s a path to recognition, scaling, and export readiness.”
🧠 3. From Individual Hustling to Systems and Processes
Current worldview:
One-person show; skill-based income.
No standard operating procedures or division of labor.
Required shift:
Adopt structured workflows, quality control, and workforce training.
Think in terms of supply chains, standard inputs, and traceability.
➡️ New mindset:“Systemizing my work makes it repeatable, scalable, and reliable.”
🧑🤝🧑 4. From Isolation to Collective Production
Current worldview:
Lone operation, driven by distrust or competition with others.
Required shift:
Collaborate in clusters, cooperatives, and value chains.
Leverage shared facilities, bulk purchasing, and pooled marketing.
➡️ New mindset:“Together, we reduce costs, improve quality, and access better markets.”
📚 5. From Skill-as-Identity to Learning-as-a-Path
Current worldview:
“I know my skill; I don’t need to learn more.”
Pride in craftsmanship but resistance to new knowledge.
Required shift:
Embrace continuous learning, innovation, and digital tools.
Be open to lean manufacturing, traceability, branding, and digitized finance.
➡️ New mindset:“Every skill can evolve—learning is part of surviving in the new economy.”
💬 6. From Cash Culture to Financial Transparency
Current worldview:
Operate in cash to avoid tax, maintain flexibility.
No records or bank history.
Required shift:
Build a credit and trust profile through banked transactions.
Understand that visibility into income allows growth finance, supplier trust, and access to government incentives.
➡️ New mindset:“Financial clarity opens doors to growth, investment, and recognition.”
🧭 Summary: From Informal to Industrial Worldview
Informal Worldview
Needed Shift for Manufacturing System
Survive day-to-day
Invest in long-term growth and productivity
Avoid government & rules
Engage with formal structures and policies
Work alone
Collaborate in value chains and cooperatives
Operate on skill alone
Systemize, innovate, and upskill continuously
Prefer cash & opacity
Embrace financial discipline and transparency
💡 Final Thought
The transformation of informal actors into players within the organized manufacturing system is not just technical—it’s cultural and psychological. It requires policy support, but more importantly, a reframing of self-identity:
From “I am a hustler” → to “I am a productive agent of national and global value chains.”
Here’s what the data shows:
📊 Informal Employment in China
In 2013, survey data from the China Household Income Project estimated that around 54.4 % of total employed (urban & rural) worked in the informal economy—those without formal contracts, often lacking legal protection (Open Knowledge Repository, International Labour Organization).
Additional sources suggest nearly half of urban workers (estimated between 120–150 million people) were informally employed in the mid‑2010s (Atlantis Press).
Recent percentages vary: World Bank’s Gender Data suggests ~45.8 % of total non‑agricultural employment was informal (though exact labor‑force share unclear) (es.wikipedia.org).
As a share of the working‑age population, converting these:
Assuming China’s working‑age (~15–64) population is ~900 million:
In 2013: 54 % of employed ≈ 780 million employed × 0.54 ≈ 421 million informal jobs, ~47 % of working‑age population.
By the early‑2020s: if informal is ~46 % of non‑agricultural employment (say ~600 million jobs), that’s ~276 million informal jobs, ~31 % of working‑age population.
→ This implies informal employment has declined slightly in share of working‑age population (from ~47 % down to ~31–35 %).
✅ Formal Employment Over Time
What about formal employment?
Using similar assumptions:
2013: Formal ≈ 46 % of employed → ~780 M × 0.46 ≈ 359 M formal jobs, ~40 % of working‑age population.
By early‑2020s: non‑agricultural formally employed ~54 % → ~600 M × 0.54 ≈ 324 M formal jobs, ~36 % of working‑age population.
So formal employment as a share of working‑age population has held roughly steady (around 36–40 %), with slight fluctuations possibly due to shifting definitions and rural‑urban dynamics.
🧾 Summary Table
Year
Informal jobs (% of working‑age pop)
Formal jobs (% of working‑age pop)
2013
~47 %
~40 %
Early‑2020s
~31–35 %
~36 %
Informal share has dropped—from nearly half to around a third of working‑age population.
Formal share has remained more or less flat (mid‑30 % to low‑40 %).
🔍 Meaning
Yes—informal employment has declined since 2013, largely due to formalization, stronger labor‑contract enforcement, and shifts away from casual/unregistered activities.
Meanwhile, formal employment hasn’t seen dramatic growth in share terms; instead, the informal sector has shrunk somewhat, while other forms (e.g., agricultural, self‑employment, gig work) may have grown or shifted categories.
Caveats & Notes
These are estimates based on survey snapshots and ILO definitions; exact updated national statistics are hard to find in open sources.
Changes in data collection methods or labor classification may affect comparability.
The rural and agricultural sector isn’t fully captured in non‑agricultural employment stats, so some informal-to-formal shifts may reflect sector changes.
Bottom line:
Informal employment peaked around 54 % of all jobs (~47 % of working‑age population) in 2013, and has since declined to around 45 % of non‑agricultural jobs (~31–35 % of working‑age population).
Formal employment remains stable around 35–40 % of the working‑age population.
China’s shift from a largely informal, agrarian economy to a formalized, industrial powerhouse was not accidental—it was the result of deliberate policy sequencing, institutional reform, and human capital development. Here’s a structured look at:
🇨🇳 1. Key Policies and Steps That Enabled China’s Shift to Formal Sector Employment
📌 A. Gradual Economic Liberalization with Control (1978–2001)
Township and Village Enterprises (TVEs): Initially informal, these were given legal status in the 1980s, encouraging rural workers to engage in quasi-formal industry.
Special Economic Zones (SEZs): Created incentives (tax holidays, infrastructure, export channels) that absorbed informal labor into formal factories.
Dual-track reforms: Allowed both market and planned elements to coexist temporarily—reducing fear of loss among informal participants.
📌 B. Massive Public Investment in Industrial Infrastructure
Transport, power, ports, and communications enabled economies of scale and the rise of labor-intensive export manufacturing, which formalized labor demand.
📌 C. Hukou (Household Registration) Reform (Gradual from 1990s)
While still restrictive, partial relaxation allowed rural migrants to access urban employment, gradually shifting them from informal work to formal manufacturing jobs—especially in coastal regions.
📌 D. Compulsory Education Expansion
9 years of mandatory schooling (primary + junior secondary) was fully implemented nationwide by early 2000s.
This created a base-level educated labor force ready for factory, logistics, and service sector jobs with formal structures.
📌 E. Labor Law Reforms (1995 & 2008)
The 1995 Labor Law set minimum wages, contracts, and insurance standards.
The 2008 Labor Contract Law strengthened enforcement, penalized informal hiring, and provided clearer dispute mechanisms—encouraging formal employment relationships.
📌 F. Social Security & Pension System Development
By linking pensions, healthcare, and housing subsidies to formal employment, China created incentives for both employers and workers to formalize relationships.
📚 2. Education Levels at Which Informal-to-Formal Shift Becomes Natural
The tipping point in education for entering the formal sector depends on the type of industry, but general patterns are:
Education Level
Typical Transition Path
Formalization Impact
Primary or less
Mostly agricultural or petty informal work
Low; rarely enter formal manufacturing
Junior secondary (Grade 9)
Entry-level factory work, logistics, construction
Medium; often move into formal sector if rural-urban migration allowed
Senior secondary (Grade 12)
Service sector, skilled trades, admin
High; more likely to seek job security and access benefits
Tertiary (vocational/university)
White-collar, tech, government
Very high; actively avoid informal jobs
📌 China’s formal employment expansion accelerated as more of the population completed at least Grade 9. The largest shift occurred when junior secondary education became nearly universal (~2000s onward).
🧭 Summary: How China Enabled the Shift from Informality to Formality
Policy Driver
Effect on Informal-to-Formal Shift
Economic Zones & TVEs
Created industrial jobs that absorbed rural informal labor
Hukou Reforms
Allowed access to urban formal jobs (with conditions)
Compulsory Basic Education
Built minimum employability for formal sector work
Labor Law Enforcement
Discouraged informal contracts through penalties
Social Security Tied to Jobs
Made formal jobs more attractive (health, housing, pensions)
Skill & Vocational Training
Equipped semi-skilled workers for factory jobs
🔍 Final Insight
The shift from informal to formal is not just economic—it’s cognitive and institutional. China’s success came from aligning:
Incentives (e.g., benefits tied to formality),
Structures (e.g., legal protections),
Capabilities (via mass education), and
Opportunities (SEZs, urban migration).
7. Essential Mindset Skills {#mindset-skills}
My reflections in response to Dr. Rasbash’s reactions to the article here—organized into two clear, compelling points:
1. Paying Taxes Isn’t Hard—If Incomes Grow Faster Than Costs
Core insight: For most individuals or households, contributing taxes becomes straightforward when income growth exceeds expense growth.
When people feel financially secure—able to cover basic needs and still save—they’re naturally more willing to participate in taxation systems.
Next steps: Explore cultural attitudes toward taxes and personal spending habits—perhaps even how behavioral traits like impulse control or “addiction” to visible consumption affect compliance.
2. Growing the Informal Sector Requires New Ways of Thinking
To move informal actors toward formal integration, systems must provide accessible infrastructure, utilities, healthcare, education, and basic rights.
This demands more than individual hustle—it requires collective capabilities:
Mental model discipline: Recognizing how one’s own assumptions shape action.
Team learning: Engaging others in shared insight and improvement.
Systems thinking: Seeing how services interconnect.
Shared vision building: Creating personal and organizational purpose aligned with wider development outcomes.
These cognitive and collaborative skills contrast sharply with the informal “hustler” mindset—often focused on quick schemes, manipulative tactics, and asserting entitlement based on citizenship alone.
🚧 Why This Mental Shift Matters Nationally
As the informal mindset spreads, it creates systemic friction— suppressing GDP growth, reducing tax revenues, and limiting the state’s capacity to provide essential services.
Reversing this trend requires a virtuous cycle:
As GDP grows, more people can afford taxes.
Increased taxes fund better public goods and systems.
Improved systems encourage further formalization, higher productivity, and continued growth.
Key metric to track: The shrinking size of the informal sector. As formal opportunities increase and new mindsets take hold, that “needle” must move—signaling real progress toward inclusive development and stronger national revenue capacity.
✨ Final Thought
What I am articulating is both psychologically and institutionally crucial: informal actors need not only stable incomes but also the mindsets and collective skills to function in and contribute to a formal, growth-oriented system. The work—especially unpacking cultural or behavioral nuances—will be a powerful contribution to this complex, layered challenge.
Here’s how you can integrate Dr. Rasbash’s structural insights—grounded in research—into your next article:
🛠️ 1. Rethink Regulation as Enabler, Not Gatekeeper
🔍 Insights from OECD & ILO
Overly complex bureaucracy often discourages formalization; leaner, proportional regulation is more effective. (OECD).
Successful policies balance simplified processes with proportional compliance—not punitive enforcement.
💡 Integration
Argue that regulation must be lean and service-oriented.
Feature country case studies (e.g. Brazil’s “monotax”, Peru’s simplified regimes) showing how reduced red tape fosters formal participation (researchgate.net, OECD).
Example: Brazil’s Simples Nacional monotax: A single monthly payment covering federal, state, and municipal obligations, while extending social-security—simplified accounting for micro-enterprises and maintained worker rights. Over 4.9 million businesses enrolled by 2017 . Simplified taxation and ease of entry enable mindset shifts from survival to enterprise, reinforcing your point about building structure. Takeaway: Advocate for service-oriented, streamlined regulation, integrating it into your narrative on mindset shifts—highlight how simplified systems reinforce the cultural transformation you describe.
🤝 2. Use Group-Based & Indirect Formalization
🔍 Evidence from Sub‑Saharan Africa
Informal enterprises often benefit more when formalization is community-based, not individually mandated. In Kenya, Ghana, Rwanda, and Tanzania, formalizing via associations or cooperatives—not individuals—effectively brought micro-enterprises into compliance (DeepDyve).
💡 Integration
Suggest forming informal worker clusters to access utilities, training, and registration—reframing formalization from an individual burden to a community-led transformation.
Evidence: OECD/ILO studies in SSA (e.g., Kenya, Ghana, Rwanda, Tanzania) show group-based formalization—through cooperatives or associations—yields better uptake. Collective action exemplifies team learning and shared vision—fitting neatly under our systems-thinking theme. Takeaway: Weave this example into your argument on systems thinking—illustrate how collective models magnify your described capacities: mental models, shared vision, team learning.
🎓 3. Link Formalization to Real Social Benefits
🔍 OECD/ILO Findings
Making formal status a gateway to tangible social protections (healthcare, pensions) motivates uptake. Making social insurance and public services accessible and attractive encourages formal engagement, especially among middle‑income informal workers (International Labour Organization, OECD iLibrary).
💡 Integration
Highlight how tangible benefits (healthcare, pensions, education) create trust and motivate formality.
Propose exploring remittance-linked contributions, as seen in Ghana and Philippines, to fund these benefits.
Evidence: Policies extending contributory social insurance to informal workers—including in Peru, Nepal, and parts of Asia-Pacific—increase formalization, as noted by ILO and USP2030 reports. Connect with our argument about requiring infrastructure and rights: formalization only takes root when backed by real benefits. Takeaway: This underscores your point that support systems must be designed with systems thinking and shared vision—formalization isn’t punitive, it’s empowering.
🌐 4. Embed Formalization in System Thinking
🔍 OECD Perspective
Formalization works best when integrated across tax policy, infrastructure, social protection, training, and finance. Breaking up informality requires comprehensive action—not isolated reforms. A whole-of-government approach, spanning tax, education, social protection, and infrastructure, is essential .
💡 Integration
Frame formalization as part of a wider systems transformation: it must connect with improved health services, vocational training, and public utilities.
Advocate for inter-ministerial action rather than fragmented initiatives.
Evidence: OECD’s Tackling Vulnerability in the Informal Economy emphasizes multi-sector “whole of government” strategies—and has influenced global frameworks like ILO Recommendation 204. Tie into our mental models and systemic approach: fragmented reforms fail; formalization must be part of whole-nation strategies. Takeaway: Align this with your argument that systemic support—and new collective mindsets—are essential. Integration must span utilities, education, and rights—reflecting your themes of mental discipline and systems thinking.
✅ Summary
By blending Dr. Rasbash’s reflections with evidence-driven policy:
Simplify rules to reduce barriers.
Promote collective formalization via associations.
Tie formality to real societal benefits.
Build formalization into a holistic, systems-level strategy.
“Strategic Reflection: Toward a Regenerative Botswana Economy”
What if the real challenge in governance isn’t corruption or inefficiency? Instead, it may be the absence of a shared, cross-sector system. Such a system can hold a vision over time.
Around the world, the systems we’ve inherited were designed for different eras. Some were from the colonial era, and others from the industrial era. Few are built to match the complexity, interdependence, and generative potential of today’s global economy.
And in Africa, our response to this gap is long overdue.
So, what might such a system look like?
The method of sustaining employment through government tenders, grants, and extractive economies for export is reaching its limit. This approach has been used across the public, private, and informal sectors. Tax revenues generated from foreign investments are redistributed into health, education, security, and infrastructure. This model, while protective and supportive, lacks growth in high-value (90%+) productive activities by its population in agriculture. This is needed in processing and manufacturing. Such growth is essential for long-term economic resilience and creating national wealth.
If Botswana is serious about diversifying its economy and building enduring, generational wealth, this model must be reformed, i.e. from a redistributive to regenerative economy.
Any wealth accumulation by the nation before taking this foundational step risks being premature. It could be unjustifiable and border on a misappropriation of public trust and resources.
In this transformation, it is imperative that the government’s socialist functions are gradually reduced. These functions include providing direct support to youth, women, and the elderly. In fact, these functions will fall away naturally as families stabilize. A generative, production-based economic model will enable the core family unit to re-assume responsibility for their well-being.
Dividing these groups for short-term political gain may yield momentary advantage, but it results in long-term economic fragmentation and loss.
What then is a structured governance workforce distribution model for Botswana, based on a projected population of 5–8 million (from today’s 2.5 million) over the next 30 years, with a per capita wage of P20,000 (cf to today’s P1,600) and a GDP of $60–100 billion (today’s $20 billion). The focus will be on recommended private vs. public sector workforce shares and a detailed breakdown by ministry.
This post presents a structured overview of Botswana’s current governance architecture. It comprises Ministries, Parastatals, and formal Public-Private or Community-Inclusive Structures. All of these are currently funded through the government payroll. Building on this foundation, the report then introduces a proposed governance body. This body is designed to lead Botswana into a future anchored in regenerative, value-creating economic transformation.
POST ROADMAP:
Given the post’s depth and evolving focus, we are providing a simple outline that will help readers stay oriented.
In This Post – Recalling What Governance Meant – Seeing What the World Is Showing Us – Why Africa’s Frameworks Must Evolve – Rethinking Our National Structure – Lessons from the DM Model – The Next Step Forward
🧩 Inquiry Roadmap – Guiding Questions Behind the Essay
Here’s a list of guiding questions used in the development of the full essay.
The essay is titled “When the World Speaks – Governance BW”. This list acts as a roadmap of inquiry. It traces the intellectual journey from challenge recognition to structural diagnosis. It continues to the design of a proposed national governance framework. Finally, it leads to the integration of policy learning from the DM model.
These questions were raised across multiple conversations over the past 2–3 weeks (with DM model-specific queries toward the latter part). Use them to orient yourself as the reader at the start of the essay. They invite you to walk the same arc of discovery.
🌍 SYSTEMIC PATTERNS & CONTEXTUAL FRAMING
Why do we continue to experience policy and governance failures even under capable leadership?
Are we suffering from individual incompetence, or structural design limitations?
What do governance collapses in wealthy nations (like the US, UK, France) reveal about deeper, global system failures?
What invisible assumptions and outdated structures still drive governance decisions in post-colonial African countries?
🧠 SYSTEMS THINKING & ARCHETYPES
How do systems archetypes (e.g., Growth & Underinvestment, Shifting the Burden) explain the persistence of unemployment and underdevelopment?
Why do investments in key sectors fail to produce long-term transformation?
What is the cost of failing to reinvest into production systems (e.g., agriculture, STEM, trade readiness)?
How do beliefs around status, education, and short-term relief distort structural priorities?
🧱 GOVERNANCE DESIGN & VISION
What type of governance structure would allow ministries and the private sector to jointly lead national transformation?
How can we design a governance body that transcends political cycles and operates with long-term, technocratic continuity?
Should national strategic leadership be led 65% by private sector actors?
How do we retain political legitimacy while introducing structural discipline?
🧩 STRUCTURAL ROLES & DIFFERENTIATION
What is the role of the new governance council versus ministries or existing agencies?
How do Deputy PMs for Growth and Stabilisation unlock this structure?
What kind of regional integration bodies (e.g., value chain councils, export readiness platforms) need to be embedded?
How does this proposed structure compare with traditional silos or “super-ministries”?
🛠️ DEVELOPMENT MANAGER MODEL – DEEP DIVE
These questions came up during the second phase (last week). They shaped the integration of DM lessons into the governance proposal.
What was the Development Manager (DM) model in Botswana originally responding to?
What failures or inefficiencies in pre-DM structures made the model necessary?
Did the DM model reduce cost overruns, delays, and patronage as intended?
Who benefited most and least from the DM model?
What scope changes were introduced by ministries, and what penalties (if any) were imposed?
Did the DM model incentivize good planning, or shield poor performance?
How do we distinguish the DM’s role from the proposed national governance framework?
What reforms are needed to align DM performance with strategic national goals?
⚖️ REFORM & ACCOUNTABILITY MECHANISMS
Should ministries that trigger scope changes bear financial responsibility (variation cost attribution)?
How can we cap government-backed project budgets, forcing external sourcing for overruns?
What role can an independent Variation Review Panel play in containing costs?
Should a Ministry Performance Ledger be introduced to publicly track project delivery?
What systems of consequences and learning loops are needed to sustain structural integrity?
🧩 STRUCTURAL INTERFACE: DM MODEL & GOVERNANCE FRAMEWORK
If the governance framework doesn’t manage infrastructure directly, what does it do?
How do the governance body and the DM model complement each other?
Who governs the DM model, and what strategic scaffolding does the governance structure provide?
Why is it important that private sector manage private-sector-oriented delivery structures?
🌱 NARRATIVE & IDENTITY
What kind of national identity does this new governance structure invite us to build?
How can we communicate this proposal as a values-driven, systems-grounded national renewal — rather than a technocratic power shift?
Reader’s Roadmap: What This Essay Asks and Answers
This essay was not written in one sitting. It was shaped through weeks of inquiry, questioning, and collaborative reflection. Below is a guide to the key questions that shaped its development. You are invited to walk the same arc of discovery.
Why do governance systems fail — even in capable nations?
What outdated structures still constrain post-colonial governance?
Can systemic patterns explain persistent underdevelopment in Botswana?
What does a reimagined governance model look like — and who leads it?
What lessons can we learn from Botswana’s own Development Manager model?
What reforms are needed to build accountability, investment readiness, and national pride into our governance design?
How can we collectively build a regenerative, globally integrated economic engine — rooted in systems thinking and national identity?
🏛️ Ministries
Below are the key Ministries under the central government (Cabinet formed November 2024–March 2025):
Office of the President & State President (presidential affairs, communications, ethics/integrity, disaster, audit, electoral, etc.) (gov.bw, finance.gov.bw)
Botswana Geoscience Institute, Innovation Hub, Accountancy College, Energy Regulatory Authority, Examination Council, National Development Bank (NDB) (gov.bw, en.wikipedia.org, gov.bw, imf.org, en.wikipedia.org)
These parastatals receive government payroll support and are overseen via shareholder compacts monitored primarily by the Public Enterprises Evaluation and Privatization Agency (PEEPA) under the Ministry of Finance (imf.org).
🔗 Public–Private–Community Governance Structures
PPP Unit (Ministry of Finance & Economic Development)
A dedicated PPP Unit, formed under the 2009 PPP Policy/Implementation Framework, coordinates private sector involvement in infrastructure/social projects; it approves and manages project-level PPP committees (blogs.worldbank.org).
PPP Project Committees
Established for each PPP initiative, these include government, private sector partners, and sometimes community representatives, under contractual performance frameworks (blogs.worldbank.org).
Local Government Councils (e.g., Gaborone City Council)
Councils include elected community councillors plus municipal staff; they collaborate with parastatals like Water Utilities Corporation and BPC, and run public services such as clinics and schools (en.wikipedia.org).
Ministry Offices with Community Functions
e.g., Ministry for State President includes Offices like coordinating disability services, disaster management, district administration, ethics, corruption prevention and public communications (gov.bw).
📌 Summary Table
Type
Examples
Includes Private/Community?
Ministries
Listed above
Mostly public-sector, some incorporate District admin
Parastatals
~62 SOEs (BPC, BoFiNet, NDB, etc.)
State-owned, commercial services
PPP Governance Structures
PPP Unit, PPP Committees
Formalized private-sector partnerships
Local Councils
Gaborone City Council, other municipal councils
Elected community leaders, parastatal coordination
✅ Conclusion
Botswana’s government payroll landscape spans from traditional ministries and SOEs to community-inclusive municipal councils and formal public–private partnership structures. The PPP Unit and Project Committees primarily connect the government to private-sector collaboration. Local Councils provide community‑led governance below the national level.
WHAT THE WORLD IS SHOWING US
Which countries lead in the top three by volume produced per capita for manufacturing?
Here are the top three countries by manufacturing value added per capita, based on the most recent data (UNECE):
🏅 Top Three (Value Added in USD per Capita)
Liechtenstein: ~ 63,000 USD
Switzerland: ~ 19,000 USD
Norway: ~ 5,200 USD
These figures refer to manufacturing value added per person in each country, not total output (w3.unece.org).
🧭 Context & Interpretation
While nations like China, United States, and Germany dominate in total manufacturing output, per capita measures offer a different perspective. These measures highlight smaller economies with high-value industrial sectors. These sectors are often in specialized and capital-intensive manufacturing.
For example, Liechtenstein tops the list due to its robust precision manufacturing industry combined with a small population (ft.com).
🔍 Why Does This Matter?
Per capita metrics normalize for population and reveal how much manufacturing “productivity” each person contributes.
High per capita values often signal economies focused on advanced, high-tech, or luxury manufacturing, rather than large-scale mass production.
🆚 Compare with Total Output
For comparison, consider these total manufacturing leaders in absolute terms (2023):
But when adjusted per person, countries like Liechtenstein, Switzerland, and Norway emerge as the clear leaders.
How Governance Structures Shape Citizen Participation in the Manufacturing Economy
We first examined the governance structures (MDAs—communities, education, raw material extraction, manufacturing, retail, and trade) of six countries. We looked at whether or not they have actively promoted economic growth. Our focus was on how gains from manufacturing are distributed directly to citizens as earned wages. This distribution is not in the form of aid or grants.
This distinction is critical. It is how countries ensure their populations meaningfully participate in the manufacturing economy. This participation spans from early health and education through adulthood. It includes ongoing skills and reskilling efforts.
✅ Summary Table
Country
Vocational Pathway
Governance Model
Direct Salary Focus?
Switzerland
Apprenticeship + school
Federal/cantonal + industry tripartite
✅ Yes—earn while learning
Norway
VET upper-secondary
Municipal, counties + NAV coordination
✅ Yes—block funding, wages
Germany
Dual VET
Federal/state + firms
✅ Yes—firm-paid apprenticeships
Liechtenstein
Swiss-style VET
Cantonal/federal + industry
✅ Yes
United States
Apprenticeships & institutes
Federal + industry networks
✅ Yes—paid programs
China
VET via SOEs
Central/local ministries
❌ Unclear—welfare still key
🌍 Countries Ensuring Direct Gains in Manufacturing
Switzerland, Norway, Germany, Liechtenstein, and parts of the United States have governance systems that integrate education, training, and manufacturing. These systems ensure individuals earn wages through direct employment or paid apprenticeships.
🚫 Lagging Model – China
China heavily invests in industrial capacity. However, the pathway from training to individual wage-earning in manufacturing is less clearly guaranteed. State support and welfare still play significant roles.
⚙️ Key Mechanisms Across Successful Models
Dual VET / Apprenticeships: Firms partner with states to employ trainees from mid-education.
Governance Oversight: Multi-level collaboration—government, industry, and education bodies.
Wage Incentives: Apprentices earn living wages; firms receive support tied to wage levels.
Lifelong Learning: Adults have access to reskilling/upskilling programs, often with paid placements.
Earnings Over Grants: Emphasis on contribution through salaries—not dependency on social grants.
🎯 Implication for Botswana (or similar)
To replicate an economy where citizens earn directly from manufacturing, consider embedding these structures:
Formal dual-track apprenticeship frameworks with wage payments.
Multi-stakeholder governance (ministry + industry + education) is overseeing training.
Block-funded vocational colleges are tied to employment outcomes.
Apprenticeship wage standards with incentives for firms.
Robust adult education and reskilling are tied to manufacturing demand.
Here’s a refined and realistic version of the comparative table you requested, limited by data availability for all 14 countries. I’ve prioritized accuracy and included every country where officer (i.e. public sector employee) counts and GDP figures can be sourced. Where reliable data is unavailable, I’ve marked it and recommend deeper research into national statistical repositories.
🌍 Comparative Table: GDP per Government Officer
Country
Ministries / Parastatals / Agencies¹
Govt Officers²
GDP (USD)³
GDP per Officer
Switzerland
7 federal departments + ~70 agencies (e.g. SFIVET, SQS)
Ministries & Agencies count is indicative, focusing on key bodies related to manufacturing, education, and standards.
Government Officers are based on the best available data. Switzerland, S. Korea, Poland, and Norway have sourced figures; others require local stats offices.
GDP from IMF World Economic Outlook or national data; 2024–2025 figures used where possible.
Norway GDP estimated (~$600 b) based on Eurostat/OECD trend.
GDP totals for countries without officer data are included for context. However, GDP per Officer cannot be calculated until reliable officer counts are obtained.
U.S. federal civilian employees ≈2.1 m (excl. postal, military).
Certainly! Here’s the table with countries by specified order across the top row: South Korea, Japan, Germany, Finland, Slovakia, Sweden, Norway. Under each country, I’ve listed all ministries or their equivalents. They are ranked by their importance to manufacturing. Key agencies or parastatals follow. They support industrial standards, innovation, and vocational development.
🇰🇷 South Korea
🇯🇵 Japan
🇩🇪 Germany
🇫🇮 Finland
🇸🇰 Slovakia
🇸🇪 Sweden
🇳🇴 Norway
1. Trade, Industry & Energy (MOTIE) – Manufacturing, industrial policy, energy regulations
1. Economy, Trade & Industry (METI) – Industrial technology, exports, energy, SME development
Finnish Energy Authority, Transport Safety (Trafi)
Customs, Tax, Food, Immigration, VTT
Digital & Population Data Services
Slovakia
SARIO (investment & trade)
National Bank of Slovakia
Energy Agency
SOEs in rail, postal, energy, automotive
Sweden
Civil Contingencies Agency (MSB)
Customs & Coast Guard
Consumer Agency
Swedish Trade & Development Agency (Sida)
Norway
Innovation Norway
Norwegian Maritime Authority
Medical Products & Development Cooperation (Norad)
Statistics Norway & sovereign wealth management
📌 Summary
Ministries directly influencing manufacturing are listed first: Industry, Trade/Energy, Education/Science, Finance, followed by Labor, Infrastructure, Health.
Agencies and parastatals support standards, innovation, SME development, and workforce training.
This structure facilitates dual-track vocational pipelines, standards enforcement, and innovation—key elements in ensuring citizens earn and benefit from industrial growth.
Here’s the enhanced comparative table with Botswana added as the last column and the detailed economic metrics included as requested:
🔍 Botswana Highlights
Ministries in manufacturing-critical order:
Employment, Labour Productivity & Skills Development
Ministries in each country are ordered by their direct relevance to manufacturing and industrial development.
Botswana shows a mid-range public sector density. It has a much lower GDP per capita than OECD countries. These factors signal opportunities for growth through targeted institutional and vocational strengthening.
The significant variance in “GDP per officer” highlights differences in public-sector efficiency and economic productivity.
Germany is one of the world’s top manufacturing powerhouses, known for high-quality engineering, advanced automation, and industrial specialization. Its key manufacturing industries include:
🇩🇪 Germany’s Key Manufacturing Sectors
1. Automotive Industry
Germany is Europe’s largest car producer and the world’s 4th largest (after China, U.S., and Japan).
Major firms: Volkswagen Group, BMW, Mercedes-Benz, Porsche, Audi.
Also a hub for automotive parts (Bosch, Continental, ZF Friedrichshafen).
Accounts for ~5% of GDP and over 800,000 direct jobs.
Largest exports include industrial machinery and production systems.
Over 6,600 companies employ ~1 million people.
3. Chemical and Pharmaceutical Industry
One of the largest in the EU.
Key players: BASF, Bayer, Evonik, Merck KGaA.
Produces industrial chemicals, fertilizers, polymers, and pharmaceuticals.
Accounts for over €200 billion in annual turnover.
4. Electrical and Electronics Industry
Includes consumer electronics, semiconductors, automated control systems, and medical devices.
Major companies: Siemens, Infineon Technologies, Bosch (also overlaps with automotive).
Strong R&D focus, contributing to smart factories and Industry 4.0.
5. Metals and Metal Products
Includes steel, aluminum, copper, and metal fabrication for construction, tools, and industrial use.
Germany is Europe’s largest steel producer.
6. Food & Beverage Processing
Though less high-tech, it’s a large sector: breweries (Germany has ~1,300), meat processing, dairy, and confectionery (e.g., Haribo).
Strong domestic and export markets.
7. Aerospace
Strong presence through Airbus Germany, MTU Aero Engines, and dozens of high-precision suppliers.
Focus areas: aircraft components, propulsion systems, avionics, and satellite technology.
8. Renewable Energy & Environmental Technologies
Rapid growth in wind turbine, solar panel, and battery technology manufacturing.
Germany is a leading exporter of environmental and climate protection technologies.
🏗️ Industry Backbone: The Mittelstand
Germany’s manufacturing strength is supported by thousands of highly specialized small and medium-sized enterprises (SMEs)—especially in machinery, tools, and engineering.
These companies often dominate global niche markets (“hidden champions”).
📦 Export Orientation
Manufacturing makes up ~23% of Germany’s GDP.
Over 80% of goods exports are manufactured products.
Germany is the world’s 3rd largest exporter after China and the U.S.
Japan has long been a global leader in advanced manufacturing, blending high precision, automation, and quality control. Its industries are deeply integrated into global supply chains and supported by strong vocational training and R&D institutions.
🇯🇵 Japan’s Key Manufacturing Industries
1. Automotive
Japan is the world’s 3rd largest car producer and a major vehicle exporter.
Leading companies: Toyota, Honda, Nissan, Mazda, Subaru, Mitsubishi.
Strong focus on hybrid, hydrogen fuel cell, and electric vehicle (EV) technologies.
Major supplier of precision automotive components, robotics, and software systems.
2. Electronics & Consumer Technology
Japan pioneered modern consumer electronics and still excels in components.
Also critical in lithium-ion battery components and solar panel materials.
8. Pharmaceuticals & Medical Devices
Japan is among the top global pharmaceutical markets.
Major firms: Takeda, Astellas, Daiichi Sankyo, Chugai.
Also strong in medical imaging, surgical equipment, and diagnostics.
9. Food & Beverage Processing
Though less high-tech, Japan excels in packaging automation, food safety, and premium product branding.
Companies: Asahi, Kirin, Nissin, Ajinomoto.
📦 Export and GDP Contributions
Manufacturing accounts for ~19% of GDP.
Top exports:
Vehicles & vehicle parts
Machinery & robotics
Electronics & semiconductors
Optical instruments
Chemical products
⚙️ Strengths in Manufacturing
Kaizen and Lean Production: Process improvement and just-in-time manufacturing originated in Japan.
Vocational-technical integration: Public and private training institutions are closely linked to industry needs.
Global suppliers: Japanese firms supply crucial components in aerospace, auto, electronics, and advanced machinery worldwide.
South Korea is a global manufacturing powerhouse, known for its rapid industrialization and advanced technology sectors. It combines strong state coordination, chaebol (industrial conglomerates), and high STEM talent density to compete globally. Here are its key manufacturing industries:
🇰🇷 South Korea’s Key Manufacturing Industries
1. Semiconductors & Electronics
World leader in memory chips (DRAM, NAND) and displays.
Major players: Samsung Electronics, SK Hynix, LG Electronics.
Exports of semiconductors alone account for 20% of national exports ($100B+ annually).
Also strong in smartphones, TVs, OLED panels, and batteries.
2. Automotive
5th largest car producer globally.
Key firms: Hyundai Motor Group (Hyundai, Kia, Genesis), Renault Korea.
Industry includes vehicle assembly, parts, EVs, and autonomous tech.
Employs over 300,000 people directly.
3. Shipbuilding
Longstanding global leader in LNG tankers, container ships, and offshore oil platforms.
Companies: Hyundai Heavy Industries, Samsung Heavy Industries, Daewoo Shipbuilding & Marine Engineering (DSME).
South Korea often ranks #1 or #2 globally in gross tonnage produced (competing with China).
4. Petrochemicals & Refining
Converts imported crude oil into refined fuels and a wide range of chemical products.
Key players: LG Chem, Lotte Chemical, Hanwha Total, SK Innovation.
Supplies domestic needs and exports to China, ASEAN, and the U.S.
5. Steel & Materials
Core to supplying the shipbuilding, construction, and auto sectors.
Flagship company: POSCO – one of the world’s largest steel producers.
Also includes aluminum and specialty alloy manufacturing.
6. Consumer Electronics & Home Appliances
Global leader in smart devices, refrigerators, air conditioners, and washing machines.
Firms like Samsung and LG are dominant globally, often blending AI and IoT features.
7. Pharmaceuticals & Biotechnology (emerging)
Recent growth in biopharmaceuticals, especially biosimilars.
Companies like Celltrion and Samsung Biologics are globally competitive CDMOs (contract drug manufacturers).
Government investments through Korea Bio-Economy Strategy 2030.
8. Defense & Aerospace (growing)
Increasing investment in military equipment, fighter jets (e.g., KF-21), submarines, and satellites.
Major players: Hanwha Aerospace, KAI (Korea Aerospace Industries).
South Korea is positioning to become a top arms exporter (e.g., deals with Poland, UAE, Indonesia).
Government historically played a strategic role in guiding export industries via investment, subsidies, and education.
Africa’s manufacturing landscape is diverse and evolving, with several countries emerging as regional powerhouses and others developing niche industries. Here’s an overview of key manufacturing industries across the continent, organized by country and sector:
🌍 Leading African Manufacturing Industries
🇪🇬 Egypt
Chemicals & Petrochemicals: Major producers of plastics, fertilizers, detergents. Petrochemicals make up ~12% of industrial output (africa-hr.com, en.wikipedia.org).
Electronics & Home Appliances: “Egypt Makes Electronics” initiative has attracted Samsung, Haier, boosting local sourcing to 70% (en.wikipedia.org).
Iron & Steel: Largest steel producer in Africa (~10.7 Mt crude steel in 2024) (en.wikipedia.org).
Across the continent, food & beverage processing, cement, textiles, and automotive assembly are the most common manufacturing threads (stat.unido.org).
✅ Next Steps
Visualization options: Heatmap of manufacturing concentration, export breakdown charts, sectoral GDP contribution map.
Deep dive suggestion: Examining one or two sub-Saharan countries’ industrial policies and infrastructure requirements.
What determines which flagship manufacturing sectors leading countries excel in?
The direction of flagship manufacturing sectors in leading countries is rarely accidental—it is shaped by a convergence of strategic forces. These forces determine why certain countries become globally competitive in automotive, semiconductors, shipbuilding, pharmaceuticals, or textiles.
Here’s a structured breakdown of the seven major forces:
Effective industrial ecosystems emerge when government, universities, and businesses co-invest:
Germany: Dual vocational training + SME suppliers + Fraunhofer Institutes = global engineering dominance
Japan: MITI (now METI) orchestrated coordination across sectors
Sweden & Finland: innovation councils, public R&D funding, and industry-academic partnerships foster medical tech and clean manufacturing
⚙️ 5. Infrastructure & Logistics Readiness
Physical and digital infrastructure underpins value-chain viability:
Morocco’s Tangier-Med port made auto exports viable to Europe
South Korea’s smart cities and logistics networks make just-in-time manufacturing feasible
India’s electronics growth clusters around SEZs and logistics corridors like Delhi–Mumbai Industrial Corridor
📉 6. Global Demand & Timing
Global trends and “windows of opportunity” shape sector trajectories:
Trend
National Response
EV and battery boom → South Korea & China scale lithium, EV, and battery chains
COVID-19 & supply chain shocks → Vietnam, India, and Indonesia emerge as China+1 options
Climate goals → Germany, Norway, and Sweden invest in clean energy tech and green industry
🧬 7. Path Dependence & Legacy Industries
Once competitive, sectors attract more investment, R&D, and skilled workers:
Germany: legacy in precision tools and automotive → continues to dominate high-end machinery
Japan: legacy in consumer electronics and robotics → sustains global brand leadership
Nigeria & Egypt: early development in cement and food → these sectors continue to dominate despite diversification efforts
✅ Summary Table
Force
What It Determines
Factor Endowments
What sectors are initially viable
Industrial Policy
What sectors receive focused support
Trade/Geopolitics
Which markets they serve
Institutions
How well sectors innovate & scale
Infrastructure
Sectoral cost-efficiency & access
Global Demand
What becomes export-worthy
Path Dependence
What sectors endure & deepen
Great. Here’s an analysis of manufacturing sectors where Botswana can most viably develop and lead. This analysis is based on the seven strategic forces that shape successful manufacturing economies.
🇧🇼 Botswana: Strategic Manufacturing Direction
🔧 1. Factor Endowments
Botswana’s endowments point to resource-linked and knowledge-based sectors:
Solar-Powered Systems Assembly (irrigation kits, cold storage)
Restructuring Government for Industrial Growth: A Blueprint for Botswana’s Next 30 Years – Lessons from Korea, Japan, and Germany
Botswana is expanding its manufacturing base over the next 30 years. It draws on governance models from South Korea, Japan, and Germany. How should it streamline its 18 ministries into 10–12? It must also downsize the public payroll. Additionally, it should reorganize agencies and parastatals to align with national industrial priorities.
To strategically structure Botswana’s workforce distribution over the next 30 years, based on projected population growth (5–8 million), a GDP of $60–100 billion, and a target per capita wage of P20,000/month (P240,000/year), we need to align public sector employment with:
Efficiency (lean government)
Service delivery needs
A manufacturing- and innovation-led economy
Below is a recommended model of how the working population should be distributed. It shows the division between the private and public sectors. This is further broken down across 12 ministries.
📊 1. Assumptions and Macroeconomic Framework
Factor
Projection
Total Population (2055)
6.5 million (midpoint)
Working-age Population (15–64)
~65% ⇒ 4.2 million
Labor Force Participation Rate
70% ⇒ ~3 million employed persons
GDP (USD)
$80 billion (midpoint)
Target Monthly Wage
P20,000 = $1,500
Per Capita GDP
$12,300 (consistent with upper-middle-income status)
📈 2. Sectoral Employment Distribution (Public vs Private)
Sector
Target % of Workforce
Headcount (of 3 million)
Notes
Private Sector
85%
2.55 million
Includes manufacturing, services, trade, agriculture, ICT
Public Sector
15%
450,000
Must become leaner and more tech-enabled
📌 In 2024, Botswana has ~150,000 public servants. This model grows it only when necessary. It maintains a low public wage burden (~12–15% of GDP) in line with global best practice.
🏛️ 3. Public Sector Distribution by Ministry (12 total)
Public service allocation across ministries must reflect their role in a manufacturing economy, prioritizing infrastructure, skills, industry, and governance.
Ministry
% of Public Sector
Headcount
Strategic Role
1. Education & Skills Development
25%
112,500
Teachers, trainers, tech-VET specialists
2. Health & Life Sciences
18%
81,000
Doctors, nurses, biotech, pharma regulation
3. Infrastructure & Energy
10%
45,000
Engineers, logistics planners, utilities
4. Industrialization, Trade & Investment
7%
31,500
Cluster leads, SME support, trade attachés
5. Local Gov, Housing & Urban Dev.
7%
31,500
Local services, permits, land devt
6. Agriculture & Agro-processing
6%
27,000
Extension officers, regulators, plant health
7. Justice, Governance & Public Service
5%
22,500
Courts, audit, procurement, public admin
8. Environment, Natural Resources
5%
22,500
Mineral oversight, land reform, climate policy
9. Science, Innovation & Technology
4%
18,000
Research grants, innovation hubs, labs
10. Labour & Productivity
3%
13,500
Employment centers, inspectors, migration mgmt
11. Finance & Economic Planning
3%
13,500
Treasury, stats, budgeting, PPP facilitation
12. Defence & Public Safety
7%
31,500
BDF, Police, Fire, Border patrol
📌 Ministries supporting manufacturing ecosystems directly (marked in bold) get >45% of public jobs. This aids Botswana’s shift from dependency to productivity.
💡 Strategic Recommendations
A. Workforce Policy Goals
Maintain public sector ≤15% of national employment
Grow vocational and engineering graduates through the Education Ministry
Automate administrative work; repurpose excess headcount to technical roles
B. Budgeting
Public wage bill should remain at 12–15% of GDP → aligns with Germany, Korea
High ROI ministries (education, health, industrialization) get a larger share
C. Private Sector Enabled
2.5M+ private jobs should be supported through:
Industrial zones (special economic zones)
Export clusters (meat, leather, solar)
Trade facilitation bodies
STEM-intensive SME development
To structure Botswana’s 12 ministries into two strategic categories aligned with a systems-thinking economic model—growth drivers vs stabilizers—we consider:
Growth Drivers: Ministries that create new value, directly contribute to GDP expansion, stimulate employment, exports, or productivity gains.
Stabilizers: Ministries that regulate, protect, or redistribute, ensuring social cohesion, compliance, and corrections when growth becomes unequal or unsustainable.
🟢 I. Ministries That Drive the Growth of National Wealth
These ministries are engines of productivity, innovation, and competitiveness. They build the foundations of manufacturing, unlock factor endowments, and convert them into wealth-generating systems.
Manufacturing policy, trade expansion, FDI, SME support
2.
Education & Skills Development
Builds human capital, technical education, and STEM pipelines
3.
Science, Innovation & Technology
Drives R&D, digitization, and value-added knowledge economy
4.
Agriculture, Agro-processing & Livestock
Modernizes value chains, promotes exports and import substitution
5.
Infrastructure & Energy
Enables industrial zones, logistics, and energy supply for factories
🧠 Outcome: These ministries build, enable, and multiply national capacity to produce wealth, increase exports, and raise productivity.
🟡 II. Ministries That Stabilize or Slow the Retardation of Wealth
These ministries intervene to manage risks, correct imbalances, and ensure that the economy’s growth is sustainable, inclusive, and secure. They do not directly create wealth—but prevent breakdowns, ensure justice, and reduce volatility.
No.
Ministry
Stabilizing Role
6.
Local Government, Housing & Urban Dev.
Urban-rural linkages, land zoning for economic use
Protects ecological assets, climate risk, land use planning
12.
Defence & Public Safety
Ensures national security, border safety, and public order
🧠 Outcome: These ministries work to prevent erosion of national wealth. They also respond to shocks. Additionally, they balance the consequences of uneven or unsustainable growth.
🧩 Systems Thinking Insight
In a generative economy, the two groups are not oppositional:
Growth ministries must be backed by resilient stabilizers.
Stabilizing ministries must not grow unchecked to the point of over-regulation or resource capture.
📌 To become a high-income, industrial economy, Botswana must increase the influence and budget share of Group I (growth drivers). At the same time, they should optimize the size and administrative efficiency of Group II (stabilizers).
The proposed dual oversight structure is anchored at the Office of the President with two Deputy Prime Ministers. This setup is a bold, systems-oriented governance reform. It separates national leadership into two complementary functional tracks:
Growth Oversight (85% of the function): Leads and drives wealth generation.
Stabilization Oversight (15% of the function): Ensures sustainability, inclusion, and governance integrity.
Each includes tripartite representation (public, private, community) to:
Formulate joint policy
Monitor cross-ministry implementation
Evaluate impact at national and ministerial levels
Here is a detailed breakdown of the personnel architecture needed and real-world comparisons:
🧮 Estimated Personnel Requirements
🇧🇼 Target Population: 6.5 million
Civil Service: ~450,000
Total Government Employment: ~15% of the national workforce (from prior model)
🟢 A. Growth Oversight Function (85%)
➤ Distribution of 100% Growth Oversight (say 1,000 personnel as planning unit)
Embedded teams in 6 stabilization ministries (10–15 per ministry)
🔧 Supporting Staff
Each Deputy PM’s Office would need:
Role Type
Approx. Headcount (Each DPM Office)
Strategic Advisors (policy, legal, economic)
15–20
Admin, Secretariat, Protocol
20–30
Monitoring & Evaluation
10–15
Communication & Public Liaison
5–10
Data & ICT Support
10–15
Support Staff per DPM Office: ~60–80 Total Central Office Personnel (Growth + Stabilization): ~120–160
📌 Total System Personnel Estimate (Excl. Ministry Staff)
Function
Core Oversight
Support Staff
TOTAL
Growth
850–1,200
60–80
910–1,280
Stabilization
150–250
60–80
210–330
TOTAL
—
—
1,120–1,610
🌍 International Examples with Similar Structures
Country
Comparable Model & Commentary
Singapore
Federal-State Working Groups (Bund-Länder) manage economic and stabilizing functions across ministries. The private sector and unions regularly involved in tripartite dialogue
South Korea
Uses Presidential Committees (e.g., on Science & ICT, Industrial Policy) with public–private–academic membership. Overseen by PM/Presidential Secretariat
Germany
Innovation policy councils led by the Prime Minister include private sector, academia, civil society; strong evaluative culture
Rwanda
Presidential Delivery Unit + private–public sector councils; streamlined cabinet (only ~20 ministers); heavy monitoring and centralized planning
Finland
Federal-State Working Groups (Bund-Länder) manage economic and stabilizing functions across ministries. The private sector and unions are regularly involved in tripartite dialogue
🧭 Final Thoughts
The Botswana model:
Anticipates industrial complexity by centralizing cross-ministry steering
Rebalances state power by embedding the private sector in strategic execution
Elevates community voices to guard against elite capture
Mimics high-performance governance systems in Asia and Europe
BOTSWANA’S NATIONAL STRUCTURE NEEDS RETHINKING
📊 STEM Representation Across Key Governance and Economic Roles
Below is a detailed assessment of the recommended percentage of personnel with strong STEM backgrounds across various levels of leadership. This includes administration and oversight. These align with the 12 restructured ministries and the dual oversight structure you’ve established for Botswana’s manufacturing-led transformation.
This framework assumes a strategic shift where STEM capability becomes central to national planning, industrialization, and productivity growth.
Category
Recommended % with STEM Background
Rationale
1. Ministerial Positions / Appointments
50–60%
Ministries directly linked to industrialization (e.g. Infrastructure, Science, Trade, Energy, Agriculture) require technocratic leadership; others (Justice, Health, Finance) benefit from multidisciplinary leadership with STEM familiarity.
This reflects the cumulative effect of STEM investment in education, lifelong learning, and re-skilling initiatives. It is aligned with upper-middle-income economies that have transitioned through industrialization.
🧠 Guiding Assumptions
STEM includes science, technology, engineering, mathematics, and related applied fields (e.g., statistics, data science, biotech, agri-tech, manufacturing systems).
These percentages assume Botswana significantly strengthens its education pipeline, vocational systems, and graduate reskilling programs in the next 15–20 years.
This distribution balances technical competence with non-STEM leadership in law, governance, social development, and finance.
📘 International Comparisons for Benchmarking
Here is a visual breakdown. It shows the recommended percentage of personnel with strong STEM backgrounds. This applies across key governance and economic roles in Botswana’s manufacturing-led transformation. The accompanying table outlines these targets clearly.
Here’s a comparative chart showing Botswana’s STEM representation targets across key sectors, alongside benchmarks from South Korea, Singapore, and Germany. It highlights how Botswana’s ambitions align with or differ from these advanced manufacturing economies.
Country
% STEM in Public Leadership
Notes
South Korea
~60–70% (in industrial ministries)
Deep STEM bench in policy formation; engineers and scientists dominate economic planning units.
Finland
~50–60%
Strong STEM literacy across all sectors; education reforms deeply integrated STEM at all levels.
Singapore
~65–75%
Ministers and agency heads often come from engineering, economics, or data science backgrounds.
Germany
~50–60%
Technical expertise in dual education system permeates industry and public institutions.
📘 Projected Structure of the Education System
To meet the needs of a projected population of 10 million over the next 30 years, with 60% of school-age children accessing STEM education, Botswana would need to develop approximately:
2,520 public schools dedicated to STEM
1,080 private schools dedicated to STEM
When these are broken down by levels, the country would need approximately:
1,500 primary schools dedicated to STEM
1,260 secondary schools with a STEM focus
450 technical and vocational training centers
113 tertiary STEM institutions (universities, polytechnics, research hubs)
📘 Strategic Argument: Why Botswana Should Become a Regional STEM Hub
Strategic Location & Stability
Centrally positioned in Southern Africa with strong political and economic stability—a key precondition for long-term education investment.
Existing English-Language Advantage
English as an official language facilitates international partnerships, student mobility, and global curriculum alignment in STEM fields.
Underutilized Youth Demographic
Botswana can convert its growing youthful population into a skilled STEM workforce—supporting local industries and supplying regional labor needs.
Regional Supply Gaps in STEM Education
Neighboring countries face capacity shortages in STEM infrastructure. Botswana can fill this gap by hosting regional students and building exportable human capital.
Complement to Manufacturing Aspirations
A STEM-literate population is essential to building and operating manufacturing ecosystems. Education drives industrial competitiveness, tech innovation, and productivity.
Leverage on Botswana Innovation Hub & Tertiary Reform
Existing innovation ecosystems (e.g., BIH) and tertiary reforms can be scaled to anchor STEM clusters and attract global investment in research and high-tech industries.
Potential for Pan-African STEM Credentials
Botswana could develop standardized, recognized STEM diplomas and degrees for SADC and the African Union, setting quality benchmarks continental.
📘 Projected breakdown of the size of the public service
Based on a projected 2055 population of 10 million and a public service size target of 2% (200,000 public servants):
Total Public Servants: 200,000
Growth Ministries (6 total): ~21,667 staff per ministry
Stabilizing Ministries (6 total): ~11,667 staff per ministry
Here is the breakdown of budget allocations across the 12 restructured ministries, categorized into Growth and Stabilizing groups. The allocations are presented as percentages. They are also shown in BWP amounts. This is based on an assumed national budget of BWP 100 billion.
These percentages reflect international benchmarks seen in countries like Singapore, South Korea, and Rwanda, adjusted for Botswana’s industrialization ambitions.
Certainly. Here’s how we’ll proceed for Botswana Governance Structure 2:
✅ Color Adjustments for Node Categories
To reflect the strategic orientation of ministries:
🔴 Stabilizing Ministries (focus: regulatory control, justice, internal balance) will be shown in red or pink. These include:
Ministry of Finance
Ministry of Local Government
Ministry of Defence and Security
Ministry of Justice
Ministry of State President
Ministry of Labour and Home Affairs
Ministry of Education (basic, control-driven systems)
🟢 Growth Ministries (focus: economic transformation, productivity, export, STEM) will be shown in green. These include:
Ministry of Trade and Industry
Ministry of Agriculture
Ministry of Communications, Knowledge and Technology
Ministry of Minerals and Energy
Ministry of Youth, Gender, Sport and Culture (for entrepreneurship)
Ministry of Infrastructure and Housing Development
Ministry of Education (tertiary, research/STEM)
🔗 Explanation of Inter-Ministerial Linkages
These linkages reflect functional interdependence—especially where policy design, budget execution, and long-term planning require joint oversight or coordination.
1. Finance ↔ All Ministries
The Ministry of Finance is a core stabilizer, holding the budget reins.
It must partner with both growth and stabilizing ministries to:
Allocate funds for infrastructure, trade incentives, tech innovation (growth ministries)
Maintain salary, compliance, public debt management (stabilizers)
2. Trade and Industry ↔ Agriculture, Communications, Minerals
Trade and Industry is the lead growth engine.
It must work with:
Agriculture for commercializing food systems, exports, and agri-processing
Communications, Knowledge & Tech to promote industrial innovation and digital commerce
Minerals and Energy to expand beneficiation and value chains
3. Communications, Knowledge and Tech ↔ Education (Tertiary)
Together they:
Build a pipeline of STEM graduates
Enable a tech-driven public service and economy
4. Youth, Gender, Sport and Culture ↔ Trade, Education, Agriculture
Supports entrepreneurship policies tied to:
Business development in rural and peri-urban areas (Agriculture)
Start-ups and informal sector scaling (Trade)
Skills and reskilling programs (Education)
5. Defence & Security ↔ State President, Local Government, Justice
These form the national coordination and governance backbone:
Justice ensures lawful conduct
Defence upholds territorial and internal security
Local Government executes stabilizing policy at local levels
6. Infrastructure & Housing ↔ All Growth Ministries
Acts as a growth enabler.
Supports:
Agri-logistics and water access (Agriculture)
Industrial parks and housing (Trade & Industry)
Energy grids and broadband (Communications)
Here’s a clear, structured explanation you can use to walk someone through the diagram — Cabinet-safe, systems-faithful, and readable aloud. I’ll explain it top → middle → bottom, then close with what this fixes.
How to Read This Structure (What Is Actually Changing)
1. Political Authority and Guardrails (Top)
At the top sits the Minister of State / Prime Minister, who provides political authority, legitimacy, and national direction — not operational control.
Directly beneath is the Deputy Prime Minister (DPM) Growth Ministries Oversight Team. This is the critical shift: growth is treated as a system requiring continuous coordination, not as isolated ministerial programmes.
The sector representation split (60% private, 30% public/academic/planning, 10% community) signals that economic growth is led by production and markets, while government provides structure, stability, and coordination.
2. Growth Ministries Joint Council (65% of Budget)
The Growth Ministries Joint Council groups together ministries whose primary function is expanding productive capacity and future revenues. This is where 65% of the national budget is intentionally concentrated — upstream, not downstream.
These ministries are not merged. They remain distinct in mandate, but are aligned in sequence.
The blue and green ovals show the growth pipeline:
Economic Planning & Investment define what the economy is trying to build and where capital should flow.
Science, Innovation & Technology and Education & Skills Development ensure capability is built before demand peaks.
Infrastructure & Energy and Agriculture & Livestock Production convert plans into physical output.
Industrialisation and Trade anchor scale, competitiveness, and market access.
The orange circle — Growth Ministries Pipeline with a Strong Economic Logic — is the reminder that these ministries only work if sequenced together. Acting out of order creates waste, unemployment, and fiscal pressure.
3. The Nexus (Implicit but Central)
The Nexus sits between oversight and execution, even though it is not drawn as a ministry.
It does three things only:
Translates demand (domestic, regional, export) into production pathways.
Sequences decisions across ministries so actions reinforce each other.
Prevents fragmentation — where one ministry “succeeds” while the system fails.
It does not implement, regulate, or allocate budgets. It ensures that what is implemented makes economic sense as a whole.
4. Where Business Botswana Fits
Business Botswana (BB) sits alongside the Nexus, not above or below it.
BB consolidates private-sector inputs, constraints, and mobilisation capacity.
BB represents firms, producers, processors, logistics players, and markets.
The Nexus does not speak for business; it translates business signals into system logic.
This separation protects BB’s legitimacy and prevents the Nexus from becoming politicised or captured.
5. Stabilising Ministries Joint Council (35% of Budget)
Below the growth system sits the Stabilising Ministries Joint Council, deliberately capped at 35% of the budget.
These ministries:
Finance, Labour, Health, Justice, Environment, Defence, Local Government do not “drive growth” directly. They protect the system from collapse while growth compounds.
They form the regulatory and resilience layer — essential, but not dominant.
Crucially: When growth is coherent, pressure on health, justice, and welfare systems falls over time. This diagram prevents the classic trap of over-funding downstream repair while starving upstream production.
6. Why the Taskforces Sit Below
The grey boxes at the bottom (Export-Led Growth, STEM Talent, Climate & Energy Transition, Agri-Industrial Development) are cross-ministerial delivery vehicles.
They exist because:
No single ministry can deliver these outcomes alone.
They cut across growth and stabilisation functions.
They are temporary, focused, and measurable.
What This Structure Fixes (In Plain Terms)
It stops policy whiplash between ministries.
It prevents health and welfare systems from absorbing economic failure.
It aligns private capital, public spending, and skills development.
It makes growth predictable enough to plan for — nationally and regionally.
Or, put bluntly (and honestly):
This structure is how you stop mopping the floor while the tap is still running.
Governance Workforce Transition Plan
Here is a structured 30-year governance workforce transition plan to support the shift to a value-added economy starting immediately.
Formalize public-private governance networks with legislated roles
Link community councils to growth delivery structures
By 2055: ~85% of policy effort and budget directed to Growth Ministries
🔴 Stabilizing Ministries (15% of economic investment)
Focus: Justice, defence, finance, social welfare, control functions
Years 1–5
Establish the Office of the Deputy PM for Stabilization
Recruit ~200 Stabilization Oversight Staff
Begin phase-out of redundant government subsidies (gradually shift safety net to family-led responsibility)
Years 6–15
Downsize and digitize core regulatory agencies
Merge ministries where possible (e.g., Labour & Local Gov)
Shift security model to an intelligence-led strategy vs. a heavy force-led manpower
Years 16–30
Create Digital and Resilience Councils to consolidate stabilizing mandates
Stabilizing Ministries shrink to ~15% of civil service (i.e., ~67,500 staff)
📍 3. Policy Milestones
Milestone
Target Year
Deputy PM Offices established
2026
Growth Councils & Oversight Staff hired
2027
First Growth Ministry realignment
2029
Stabilization Ministry M&A completed
2035
50% government services digitized
2038
Growth Ministries >70% of GDP delivery
2042
Full Governance Structure Realignment
2050
🔧 4. Supporting Tools & Levers
System Mapping & Scenario Planning Units inside each DPM Office
National training program for Fifth Discipline tools (esp. Causal Loops & BOT graphs)
Civil service reform unit focused on merit-based staffing & downsizing plans
Strategic economic councils including private-sector & community reps
THE DM MODEL’S ROLE — AND ITS LESSONS
Integrating Lessons from the Development Manager (DM) Model
Why the DM Model Matters in This Conversation
No discussion on rethinking Botswana’s governance model for economic transformation would be complete without addressing the Development Manager (DM) model. This model is the government’s adopted mechanism for managing large infrastructure projects. The governance framework I propose does not manage projects directly. However, it creates the enabling conditions for all national efforts to succeed. This includes DM-managed initiatives.
This section reflects not just theoretical models but lived policy experience. The DM model offers important structural innovations that hold promise when paired with a capable oversight system. However, lessons from its implementation must now be embedded into our forward-looking national governance redesign.
What the DM Model Was Designed to Solve
The DM model was introduced to address entrenched problems in Botswana’s project delivery system, including:
Chronic delays due to bureaucratic red tape in ministries
Procurement irregularities or patronage benefiting insiders
Lack of technical project design and supervision capacity
Fragmented or inconsistent contract and risk management
Inflated costs or mid-project scope changes without clear control
The government appointed external private firms (Development Managers) to oversee project design. They managed procurement, contract supervision, and delivery. This initiative aimed to inject technical rigour, speed, and accountability into the public infrastructure pipeline.
✅ Specialised project oversight: DMs brought global project management expertise to large-scale infrastructure efforts.
✅ Reduced procedural favouritism: The separation of decision-making from ministries curtailed discretionary delays and informal influence in procurement.
✅ Clear roles and contracting systems: In theory, the model created defined performance and outcome expectations.
What Went Wrong — And Why
Despite these intentions, the implementation faced critical flaws:
🚫 Scope creep and cost overruns: An estimated 70% of variation orders originate from government ministries themselves. These orders are often late or uncoordinated.
🚫 Absence of cost caps: Without a ceiling for variation claims, costs ballooned. The estimated P56 billion total was not always linked to clearly justified or pre-approved changes.
🚫 No penalty to ministries for poor planning: Ministries that triggered overruns bore no consequences. The financial burden was absorbed centrally, shielding under-performance.
🚫 Overconcentration of power in DM firms: There was no effective oversight layer. DMs often self-regulated cost justification and delivery expectations.
🚫 Unclear accountability to the citizen: The public saw projects stall or overrun budgets. However, they had limited access to the decision trail. It was unclear who was ultimately responsible.
What Needs to Change — A Reform Path Forward
Integrating Lessons from the Development Manager (DM) Model
To make the DM model successful going forward:
Variation Cost Attribution Framework Introduce a clear cost-sharing mechanism. Ministries that initiate variation orders or cause delays must bear a proportion of the additional cost.
These variation costs can be deducted from the ministry’s future project budgets or spread over several projects.
This deters poor planning and encourages ministries to strengthen internal scoping and contract readiness.
Cap on Government-Backed Expenditure The government should commit to funding only up to a fixed percentage (e.g., 110%) of the original approved project estimate.
Any cost overruns beyond this must be sourced by the Development Manager through private finance. They may also use risk-sharing mechanisms. The sourcing is subject to quality and timeline guarantees.
This shifts financial discipline upstream, encouraging greater accountability in design and approvals.
Independent Variation Review Panel A neutral panel of technical, legal, and financial experts should be established to evaluate variation requests exceeding a set threshold (e.g., 5–10% of original value).
Only variations deemed justified and necessary are approved.
This ensures transparency and arms-length evaluation of politically or administratively motivated changes.
Performance-Based Ministry Ledger Track and publish a Performance Ledger for each ministry showing:
Number and value of variation orders triggered
Projects completed on time and within budget
Frequency and cause of delays or disputes Ministries with repeated under-performance will face reduced future allocation ceilings. They will also be required to undergo an external technical review before launching new projects.
Separation of Technical vs. Political Roles Ministers provide strategic policy direction. They approve capital project priorities. However, they do not intervene in contract timelines, payment certificates, or variation approvals.
This reinforces professional project management standards and shields DMs from political interference.
Integrated Planning with Governance Framework Development Managers must be embedded within the proposed national governance framework. This is necessary to ensure coordinated planning. It will help achieve harmonized standards and pipeline alignment.
The governance system will act as the “system integrator.” It will ensure national infrastructure projects fit into economic, spatial, and trade development strategies.
Distinct Role of the National Governance Framework
The national governance framework being proposed is not a replacement or duplicate of the DM model.
Instead, it focuses on:
Building value chain ecosystems in agriculture, industry, services, and trade
Fostering regional integration and export readiness
Streamlining inter-ministerial policies, standards, and investment pipelines
Facilitating collaboration between public and private sector actors
Creating long-term planning platforms that are stable, non-partisan, and techno-cratically grounded
Think of it this way: the DM model builds roads, hospitals, and stadiums. The governance framework builds the system. It helps a farmer or manufacturer use those roads to get to market. This support enables them to grow.
Together, both models are necessary — but for different outcomes.
Final Thought
The promise of the DM model still holds. But like any tool, it must be aligned with broader systems of responsibility, discipline, and incentives. With clearer oversight mechanisms, and strategic scaffolding from a well-structured governance framework, Botswana can build faster. It can also build better and with greater purpose.
For policymakers: What would it take to begin prototyping this structure today?
For citizens and professionals: Where do you see yourself in this structure?
🧭 Pedagogical Outline of the Blog Post
Here’s a pedagogical breakdown of how the post “When the World Speaks — Governance BW” was developed. This structure helps readers move from global pattern recognition to local systemic insight. Then it guides them to structural design and finally to proposals for reform. The post is both exploratory and instructional — ideal for a systems-thinking audience.
1. Framing the Problem (Why This Matters Globally)
Purpose: Create a shared vantage point for the reader to see governance not as a domestic or African issue, but as a global systemic breakdown.
Method:
Use global patterns (collapse, corruption, fragmentation) to build urgency.
Draw parallels between systems in the Global North and South.
Ask: Why are even capable leaders failing?
➡️ Pedagogical device:Disrupt assumptions — show that governance failures aren’t just due to corruption or incompetence, but system design.
2. Narrowing the Lens (Botswana as a Mirror of Global Patterns)
Purpose: Bring the macro into the micro — reveal Botswana not as an outlier but as a case-in-point of deeper structures.
Method:
Introduce the unemployment study and onion model.
Use mental models and archetypes to reveal invisible forces (e.g., Growth and Underinvestment, Shifting the Burden).
Position current ministerial silos as structurally outdated.
➡️ Pedagogical device:Use of case study and systems archetypes to reveal hidden feedback loops behind national dysfunction.
3. Reframing the Solution (What Kind of Governance Do We Actually Need?)
Purpose: Shift the conversation from personnel and politics to architecture and system design.
Method:
Introduce idea of a dual-sector governance framework (public + private).
Clarify: this is not privatization — it’s system renewal based on competence, collaboration, and continuity.
Use structural maps (e.g., sectoral councils, deputy PMs for Growth & Stabilization).
➡️ Pedagogical device:Re-anchoring solution-thinking from ‘who governs’ to ‘how governance is structured.’
4. Integrating Practice and Policy (Lessons from the DM Model)
Purpose: Ground the theoretical proposal in real-life policy reform experience.
Method:
Use the Development Manager (DM) model as a lens for learning.
List what worked and what didn’t.
Show how poor oversight and lack of cost control mechanisms undermined good intentions.
In its 2015 survey of African workers, South Africa’s Rand Merchant Bank found Batswana to be the laziest on the continent. The problem is actually more acute than that.
In the 2017-2018 Global Competitiveness Report, Botswana scores the worst among the 137 countries that are tracked by the World Economic Forum’s Global Competitiveness Index (GCI) on 12 pillars of economic competitiveness. From a list of 16 factors, respondents to the World Economic Forum’s Executive Opinion Survey were asked to select the five most problematic factors for doing business in their country and to rank them between 1 (most problematic) and 5. The results were then tabulated and weighted according to the ranking assigned by respondents. One of those factors is “Poor work ethic in national labour force.”
With a score of 19, Botswana’s national workforce (which would include those in the public and private sector as well as NGOs) emerge as standard bearers of the poorest work ethic in the world survey. Also doing poorly are Trinidad & Tobago (15.9), Brunei (14.4), Sri Lanka (11.1), Liberia (10.8), Bhutan (10.5), Seychelles (10.1), Malta (9.8), Georgia (9.7), Mauritius and Vietnam (9.5), Namibia (9.3), Bahrain (9.0), Kuwait (8.7) and United Arab Emirates and Jamaica (8.6).
WEF’s interest in labour productivity has to do with the fact that it impacts on business. A University of Botswana study by Professor John Makgala and Dr. Phenyo Thebe (“There is no Hurry in Botswana”: Scholarship and Stereotypes on “African time” Syndrome in Botswana, 1895-2011”) found that this lack of productivity has frustrated effort to attract foreign direct investment. Interestingly, there was a time when, according to literature that the authors quote, Botswana’s civil service “was generally believed to be the most efficient in the whole of the African continent.”
On a past trip to Singapore, former and late President Sir Ketumile Masire gained an appreciation on the efficiency of the country’s workers. Where a Motswana factory worker would produce one shirt within a given period of time, a Singaporean counterpart would produce six within the same period.
“This was productivity not in theory but in demonstrable terms. When we say we are not productive, this is what we meant,” Masire recalled to Sunday Standard in 2015 of this experience which would lead to Botswana benchmarking with Singapore and delegations from the two countries travelling back and forth.
As one of the Four Asian Tigers, Singapore would provide one quarter of the inspiration to establish the Botswana National Productivity Centre (BNPC). The tigers are Hong Kong, Singapore, South Korea, and Taiwan. Along the way, however, the late president appears to have given up on ever inculcating the right work ethic in Batswana. On assessing the apparent resistance, he determined that Batswana’s poor work ethic was a result of their pastoralism.
“If you look at the life of pastoralists, they don’t have a good work ethic,” he had said. The example he had cited was that beyond sinking a borehole for their livestock, letting out cattle to pasture and doing some other undemanding work, most of the time pastoralists are just lazing about as their cattle graze untended in the bush. By Masire’s analysis, this is the work ethic that has been bequeathed to modern-day Botswana.
As a University of Botswana study shows, not one productivity intervention scheme by the government has produced the desired results. In his 2015/16 budget speech, the Minister of Finance and Economic Development, Kenneth Matambo, lamented the low levels of labour productivity in Botswana. The best performers in terms of work ethic in the national labor force are from Zimbabwe and Venezuela underpinned by a perfect score.
Table 1: Comparison of Botswana with 2017’s Best Global Labour Productivity Data
DID YOU KNOW? THE AVERAGE PER CAPITA PRODUCTIVITY IN BOTSWANA
LAGS THE WORLD’S PRODUCTIVE COUNTRY BY 30-40 TIMES?
TALKING POINTS:
COUNTRY’S GENERAL ECONOMIC PRACTICE:
An economic system defines the mechanism of production, distribution, and allocation of goods, services, and resources. It operates in a society or country with defined rules and policies about ownership. There are also policies about administration.
The most commonly followed economic system is modern-day capitalism. It was developed from a framework. This framework aimed to secure the supply of key elements required for industry. These elements include land, machinery, and labor. A disruption in any of these would lead to increased risk and loss for the venture.
THE COUNTRY’S GENERAL ECONOMIC PRACTICE, ON THE OTHER HAND:
Socialistsviewed this commoditization of labor as an inhuman practice. I believe those words are distinctively from the female voice. This stems from Marx’s known instances of showing great sympathy for peasants. He also showed great sympathy for women as important forces for change within Marx’s theory. It marks the genesis of a matriarchal society. Women often lead quietly from behind the scenes as a response to survive in the face of absent males. These males have needed to travel long distances. They work in the agriculture and mining industries. As a result, women left to fend on their own have become increasingly ‘masculinized’.
These, I believe, led to the birth of Karl Marx’s idealism on socialism and socialist economies across a few countries.
How does a socialist economy work?
The starting point to this form of economy is typically three-fold:
The country has considerable access to wealth generated by mining underground mineral and fossil fuel resources, which is demanded by other world economies and is traded in exchange for income;
Or it has traditionally enjoyed a monarchy and/or a pastoral economy. It has access to substantive land spaces. This allows it to multiply livestock and warm crops. These crops do not need as much attention compared to cold crops. The rates are faster than the rate at which the human population multiplies with relative ease. The monarchy supports its people when they ask for help. It helps distribute the wealth as shared resources like land. It also provides meat and food as needed.
Either way, the population has a tradition and work ethic that differ from farmers in parts of Asia. In southern China, for example, rice cultivation can be intricate, laborious, and multi-seasonal within a year. The majority have limited resources. They have learned to improve the returns on their labor by becoming smarter and more collaborative. They achieve this by managing their time better and making better choices. In other words, more than simply working hard, they worked intelligently and strategically. Cultures “shaped by the tradition of wet-rice agriculture and meaningful work” produce students with fortitude. These students can “sit still long enough.” This enables them to find solutions to time-consuming and complex math problems, for instance. As such, hard work, given this context, can easily be seen as more difficult than usual. It can, hence, be regarded as inhumane. Source: “Rice Paddies and Math Tests,” Malcolm Gladwell.
THE RESULTANT REALITY OF THE ECONOMIC PRACTICE:
Botswana’s real labour productivity per capita is USD 2. It measures the employed population’s output, excluding value added by mining and real-estate sectors. This is measured against the total population of the country for a truer reflection of real per capita income. USD 2.2 per hour or USD 18 per day, and that is, before deducting costs of operations. Luxembourg sets the pace as the global labour productivity leader at USD 93.4 per hour or USD 747 per day (or USD 16,437 per month). At this rate, Botswana’s productivity (and therefore wealth) lags (falls behind by) at 30-40x behind that of Luxembourg.
It makes one wonder. In our efforts to avoid capitalism and obvious inhuman labour practices, at what cost have we done so? We strive for wealth accumulation and perfect equality in income distribution. Will our efforts to transform the manufacturing and industrialization sectors succeed? Can our efforts to diversify the economy, moving from the tried and tested, gain traction? We need to understand the underlying forces that detract us from such efforts.
The Question is:
Would we rather continue this way as if business is usual?
How much would we drag a burgeoning burden on the state in the process?
What will be the end state of that burden on the government and the country?
Gaining such understanding in our minds would mean gaining the power in our hands. If you can imagine it, then you can create it.
STEPS GOING AHEAD:
However, this approach risks deterring organizations from capitalist economies from engaging with or investing in such an economic system. These institutions have built their wealth through performance-based merit. They demonstrate resilience over time and operate within clearly defined standards. Their income and wealth growth have been consistent, driven by a disciplined focus on reducing production costs and improving efficiency. This approach not only strengthens individual enterprises but also contributes meaningfully to broader economic growth.
Interestingly, no pure socialist, capitalist, or communist economy exists in the world today. All economic system changes were introduced with a big bang approach. They had to make “adjustments” to allow appropriate modifications as the situation developed.
Over time, most state-run subsidy systems that lack high productivity standards become unsustainable in supporting expansive social programs. Despite receiving significant external aid, poverty levels often stay high. This dynamic worsens income inequality. It deepens the divide between the wealthy and the poor. It places an overwhelming and unsustainable burden on public welfare systems.
Reform efforts often aim to transition toward a mixed economy that incorporates free-market mechanisms. This involves reducing government control over small enterprises and phasing out redundant positions within the state workforce. Such measures are put in place to facilitate self-employment. They allow a significant portion—potentially up to 40%—of government employees to transition into the private sector. This structural shift lays the groundwork for a broader income tax base. It fosters greater fiscal self-reliance. It also reduces long-term dependency on state support.
In the short term, to alleviate economic pressure, policymakers will prioritize attracting increased foreign investment. This often involves the establishment of tax-free special development zones. These zones enable foreign companies to operate with minimal restrictions. They allow for the repatriation of profits without tariffs. These measures represent a departure from traditional centrally planned, socialist economic models. However, they are not a substitute for comprehensive structural reform. Relying solely on these mechanisms risks undermining long-term economic stability and self-sufficiency.
Fundamental change requires substantive reform—even when directed at a nation’s own citizens. These reforms must establish a clear link between wages and individual productivity. They should avoid relying on rank, seniority, or attendance as the basis for compensation. Without this shift, efforts toward transformation will remain partial and ineffective. For true and lasting change, citizens must understand their productivity’s direct impact. It contributes to both national prosperity and personal income. This awareness is essential for driving accountability, performance, and sustainable economic development.
THE BOTTOM LINE
Socialist economies across the globe have existed and continue to progress. However, there may not be any standard pure socialist economy remaining. Timely and fundamental shifts in programs and policies have allowed such economies to thrive. China is the world leader among them. The ones taking a rigid stand are facing severe problems or developing parallel markets.
Underlying Mental Models and Beliefs that perpetuate low productivity as outlined in this post.
This blog post is titled “When the Economy Speaks: Cracking the Botswana Productivity Code – Short Notes Part II”. It explores the systemic and cultural factors. These factors contribute to Botswana’s persistent productivity challenges. Drawing from systems thinking principles, the article identifies several underlying mental models and beliefs that perpetuate low productivity.
1. Short-Termism and Preference for Immediate Gains
There is a prevalent focus on achieving quick, visible results rather than investing in long-term, foundational improvements. This mindset leads to prioritizing short-term projects that offer immediate benefits. But it often sacrifices sustainable growth and systemic change. Such an approach can result in recurring issues as underlying problems stay unaddressed.
2. Equating Compensation with Rank and Tenure
A common belief equates higher compensation with seniority or rank and, hence, attendance rather than actual productivity or performance. This perspective discourages merit-based incentives. It can lead to complacency. Employees do not feel motivated to improve efficiency or innovate if rewards are not tied to performance.
3. Perception of Government as Primary Provider
There exists a widespread expectation that the government is the main source of employment and economic support. This belief can stifle entrepreneurial initiatives. It can also reduce individual accountability. Citizens rely heavily on state provisions rather than seeking self-driven economic opportunities.
4. Resistance to Change and Innovation
Cultural norms that value tradition and established practices can lead to resistance against new approaches or technologies. This reluctance to embrace change hampers the adoption of innovative practices that enhance productivity and economic diversification.
5. Limited Emphasis on Systems Thinking
A lack of systems thinking in policy and organizational decision-making leads to fragmented approaches to problem-solving. Interventions need a holistic understanding of how different components of the economy interact. Otherwise, they tackle symptoms rather than root causes. This results in ineffective solutions.
6. Underinvestment in Human Capital Development
There is insufficient emphasis on developing skills and competencies that align with the evolving demands of the global economy. This gap in human capital investment limits the workforce’s ability to adapt to new technologies. It also constrains productivity growth by hindering adaptation to new processes.
7. Over-reliance on External Aid and Resources
Dependence on foreign aid and external resources can create a false sense of security. This reduces the urgency to develop internal capacities. It also delays the creation of self-sustaining economic strategies. This reliance also leads to policy decisions that prioritize donor preferences over local needs and contexts.
Addressing these deeply ingrained beliefs and mental models requires a concerted effort. We need to shift mindsets toward valuing long-term planning, merit-based systems, innovation, and self-reliance. Integrating systems thinking into education, policy-making, and organizational practices can help offer a more holistic approach. This integration leads to a sustainable way to improve productivity in Botswana.
REQUIRED RESEARCH ANALYSIS
FOR DETAILS OF DATA REQUIRED FOR RESEARCH ANALYSIS FOR THIS TOPIC, CLICK HERE.
That is … until you see them return to the lands and vegetation we have encroached into, when we settled in their habitat.
When elephants leave their habitats for their watering holes, for however long, it does not mean they have resettled.
And so, it becomes hard for us to imagine the way a child intuitively understands these gentle giants. Instead, …
When we think of elephants, we conjure up images of majesty and aggression!
ARTICLE OUTLINE:
Introduction
Basic Facts about elephants
The impact elephants have on the ecology
Historical reasons for the demise of elephants
FAQS ABOUT HUNTING:
What is fuelling human’s obsession for hunting?
Why men trophy hunt?
FAQs ABOUT POACHING:
About the elephants
About the tusk
About the poachers and the trade
About the end consumer
Beijing master ivory carvers cling to their trade
Who is the silent voice and what does it say?
Population. At the turn of the 20th century, there were a few million African elephants and about 100,000 Asian elephants. Today, there are an estimated 450,000 – 700,000 African elephants and between 35,000 – 40,000 wild Asian elephants. Most captives are endangered Asian elephants; African bush elephants and African forest elephants are less amenable to training. Animal rights organizations estimate there are 15,000 to 20,000 elephants in captivity worldwide. That brings the total number of elephants today to about 500,000. Half a million.
The real question is, what would you do if it had been the global human population that has been decimated by up to three quarters of its numbers by another species? And you are left with a quarter of you!
INTRODUCTION
Elephants are among the most intelligent of the creatures with whom we share the planet, with complex consciousnesses that are capable of strong emotions. Across Africa they have inspired respect from the people that share the landscape with them, giving them a strong cultural significance. As icons of the continent elephants are tourism magnets, attracting funding that helps protect wilderness areas. They are also keystone species, playing an important role in maintaining the biodiversity of the ecosystems in which they live.
Symbolic Elephant Meaning. … Symbolic elephant meaning deals primarily with strength, honor, stability and tenacity, among other attributes. To the Hindu way of thought, the elephant is found in the form of Ganesha who is the god of luck, fortune, protection and is a blessing upon all new projects.
What does elephant symbolize?
Many African cultures revere the African Elephant as a symbol of strength and power. It is also praised for its size, longevity, stamina, mental faculties, cooperative spirit, and loyalty. South Africa, uses elephant tusks in their coat of arms to represent wisdom, strength, moderation and eternity.
Elephants generally do not have predators (animals that eat them) due to their massive size. Newborn elephants are however vulnerable to attacks from lions,tigers, and hyenas. The biggest danger to elephants are humans; elephants have been hunted for their tusks to near extinction in some cases.Oct 8, 2015
Yet, today they stand at the brink on its way of being wiped out. Paving the way for the last man standing. The man.
Yet, did you know that ….
What elephants are afraid of?
But the elephant’s fear has more to do with the element of surprise than the mouse itself. Theories abound that elephants are afraid of mice because the tiny creatures nibble on their feet or can climb up into their trunks.Jun 1, 2016
Are elephants really scared of bees?
Elephants are the largest beasts alive on land today. Yet, these goliaths are afraid of bees, researchers have discovered. The giants flee when they hear the buzz of a beeswarm. Their fear could be used to help protect them.
SURPRISED?
And so the images we had conjured in our minds of their undisputed majesty and world domination (and possible aggression), true?
So, be calm. Love an elephant and learn to live among the gentle giants if, that is, you still want to live on their lands.
“Because he (the human) just comes for the money, he does not have any compassion or love for the elephant. And so he does not want to be involved in taking care of the elephant. So the elephant will get poorer and poorer in condition.”
“I look into their eyes and I can see they have suffered. They can’t speak.”
“They never knew that elephants can show happiness. That they have humor and can smile.”
“They accept her into her herd as a kindred spirit after suffering so many years of abuse. Perhaps they are relieved and surprised to find such human kindness still exists.”
Blog Author’s Note:
As you read the article, notice the elephant (what we know about them: the facts, the emotions, the money trail, the larger-than-life images this animal conjures in our minds) that this majestic animal has brought into the room … and then, notice what is the “elephant that is not in the room”?
What do you think that is? There right there, is our leverage.
BASIC FACTS ABOUT ELEPHANTS
Habitat loss is one of the key threats facing elephants. Many climate change projections indicate that key portions of elephants’ habitat will become significantly hotter and drier, resulting in poorer foraging conditions and threatening calf survival. Increasing conflict with human populations taking over more and more elephant habitat and poaching for ivory are additional threats that are placing the elephant’s future at risk.
Of the two species, African elephants are divided into two subspecies (savannah and forest), while the Asian elephant is divided into four subspecies (Sri Lankan, Indian, Sumatran and Borneo). Asian elephants have been very important to Asian culture for thousands of years – they have been domesticated and are used for religious festivals, transportation and to move heavy objects.
Diet
Staples: Grasses, leaves, bamboo, bark, roots. Elephants are also known to eat crops like banana and sugarcane which are grown by farmers. Adult elephants eat 300-400 lbs of food per day.
Population
At the turn of the 20th century, there were a few million African elephants and about 100,000 Asian elephants. Today, there are an estimated 450,000 – 700,000 African elephants and between 35,000 – 40,000 wild Asian elephants.
Range
African savannah elephants are found in savannah zones in 37 countries south of the Sahara Desert. African forest elephants inhabit the dense rainforests of west and central Africa. The Asian elephant is found in India, Sri Lanka, China and much of Southeast Asia.
Behaviour
Elephants form deep family bonds and live in tight matriarchal family groups of related females called a herd. The herd is led by the oldest and often largest female in the herd, called a matriarch. Herds consist of 8-100 individuals depending on terrain and family size. When a calf is born, it is raised and protected by the whole matriarchal herd. Males leave the family unit between the ages of 12-15 and may lead solitary lives or live temporarily with other males.
Elephants are extremely intelligent animals and have memories that span many years. It is this memory that serves matriarchs well during dry seasons when they need to guide their herds, sometimes for tens of miles, to watering holes that they remember from the past. They also display signs of grief, joy, anger and play.
Recent discoveries have shown that elephants can communicate over long distances by producing a sub-sonic rumble that can travel over the ground faster than sound through air. Other elephants receive the messages through the sensitive skin on their feet and trunks. It is believed that this is how potential mates and social groups communicate.
Reproduction
Mating Season: Mostly during the rainy season.
Gestation: 22 months. Litter size: 1 calf (twins rare). Calves weigh between 200-250 lbs at birth. At birth, a calf’s trunk has no muscle tone, therefore it will suckle through its mouth. It takes several months for a calf to gain full control of its trunk.
Elephants are the keystone species of their habitat.
The planet earth is inhabited by diverse array of living organisms such as microorganisms, plants, animals and human beings which collectively constitute the biodiversity. Each and every element of the living component of the system has its own role, either positive or negative, to play as a system component. So preservation and conservation of living organisms, whether they are tiny or large, become immense important in playing beneficial role in maintaining biodiversity.
Mega-herbivorous animal such as elephant has major impact on the terrestrial ecosystems in which they live and thus on the animals that depend on these habitats. Elephant can be referred as “keystone species” because it facilitates:
Feeding by other herbivores that disperse seeds and supports large assemblages of invertebrates, such as dung beetles, and
Lower plants such as algae and fungi apart from enriching soil nutrients through dung piles.
These algae and fungi are preferred nutrient plants for some reptiles such as monitor lizard and star tortoise in the semiarid tropical forests.
Dung beetle accumulation attracts many insectivorous birds.
Dung deposition into water holes is being benefited to the Pisces and amphibians.
Wherever they live, elephants leave dung that is full of seeds from the many plants they eat. When this dung is deposited the seeds are sown and grow into new grasses, bushes and trees, boosting the health of the savannah ecosystem.
Seed dispersal through alimentary canal induces germination and survival capacity of the seedlings to maintain the forest heterogeneity; some species rely entirely upon elephants for seed dispersal.
Elephant also does some of the silvicultural practices such as
Creation of paths in dense forest. When forest elephants eat, they create gaps in the vegetation. These gaps allow new plants to grow and create pathways for other smaller animals to use.
On the savannahs, elephants feeding on tree sprouts and shrubs help to keep the plains open and able to support the plains game that inhabit these ecosystems.
Maintenance of grazing lawns and height of the trees and thinning in thick vegetation cover to keep the sustainable utility of the forest.
Identification of subsoil water and natural salt licks through elephants’ strong sense is also shared by the other animals especially the herbivores for which intake of minerals from the natural soil is most important for many physiological activities.
During the dry season, elephants use their tusks to dig for water. This not only allows the elephants to survive in dry environments and when droughts strike, but also provides water for other animals that share harsh habitats.
The pachyderm (a very large mammal with thick skin, especially an elephant, rhinoceros, or hippopotamus) is under severe threat due to various conservation problems such as loss of habitat (see example below that of forest cover in Sumatra), habitat quality and corridors, reduction of home range, population increase, impact of developmental activities, human-elephant conflict issues and poaching for ivory. Among the factors, some of them may be responsible for major proportions, and some of them involve less proportion. But these are the reasons listed as conservation problems for the long-run conservation of elephants.
Historically, trade and capture are responsible for elephants’ demise
Since the Proboscidea originated 60 million years ago, the order has included some 10 families, 45 genera and 185 species and subspecies, in a spectacular diversity of forms. The African (Loxodonta africana and Loxodonta cyclotis) and Asian elephants (Elephas maximus) existing today are the sole remnants of that remarkable evolutionary radiation. Representing a tiny fraction of their former numbers, the living elephants survive in only small pockets of the land they once roamed. In many areas elephant populations have already gone extinct or are highly endangered.
Over centuries legal and illegal hunting (“poaching”) for the commercial ivory trade and, in Asia, the capture of elephants for human use, have been largely responsible for the elephant’s demise. The number of wild Asian elephants now comprise less than a tenth of all remaining elephants, and continue to decline in shrinking habitat. In Africa, elephants once inhabited the entire continent, from the Mediterranean down to its southern tip, but the ivory trade coupled with human expansion caused a continental decline in their numbers. By circa 1600 North Africa was devoid of elephants. In modern Africa, poaching for ivory has been fuelled by poverty, political instability and civil unrest coupled with the easy availability of arms. In recent history, between 1979 and 1989, Africa’s elephants underwent a dramatic and devastating decline, falling from approximately 1.3 million animals to an estimated 609,000. Human greed and rising prices of ivory were responsible for the appalling slaughter.
African elephants (Loxodonta africana) are imperiled by poaching and habitat loss. Despite global attention to the plight of elephants, their population sizes and trends are uncertain or unknown over much of Africa. To conserve this iconic species, conservationists need timely, accurate data on elephant populations.
There is an estimated population of 352,271 savannah elephants on study sites in 18 countries, representing approximately 93% of all savannah elephants in those countries. Elephant populations in survey areas with historical data show it has decreased by an estimated 144,000 from 2007 to 2014, and populations are currently shrinking by 8% per year continent-wide, primarily due to poaching. Though 84% of elephants occurred in protected areas, many protected areas had carcass ratios that indicated high levels of elephant mortality. Results of the GEC show the necessity of action to end the African elephants’ downward trajectory by preventing poaching and protecting habitat.
What is fuelling the obsession of trophy hunting poaching?
Why are savagery and violence so omnipresent among humans?
We suggest that hunting behaviour is fascinating and attractive, a desire that makes temporary deprivation from physical needs, pain, sweat, blood, and ultimately the willingness to kill tolerable and even appetitive.
Evolutionary development into the “perversion” of the urge to hunt humans, that is to say the transfer of this hunt to members of one’s own species, has been nurtured by the resultant advantage of personal and social power and dominance. While breakdown of the inhibition towards intra-specific killing would endanger any animal species, controlled inhibition was enabled in humans in that higher regulatory systems, such as frontal lobe-based executive functions, prevent the involuntary derailment of hunting behaviour.
If this control – such as in child soldiers for example – is not learnt, the brutality towards humans remains fascinating and appealing. Blood must flow in order to kill. It is hence an appetitive cue as is the struggling of the victim.
Hunting for men, more rarely for women, is fascinating and emotionally arousing with the parallel release of testosterone, serotonin and endorphins, which can produce feelings of euphoria and alleviate pain. Bonding and social rites (e.g. initiation) set up the contraints for both hunting and violent disputes. Children learn which conditions legitimate aggressive behaviour and which not. Big game hunting as well as attack of other communities is more successful in groups – men also perceive it as more pleasurable. This may explain the fascination with gladiatorial combat, violent computer games but also ritualized forms like football.
(Blog Author’s Note: And as such conjures notions such as the “last man standing” must necessarily therefore mean someone is more strong or witty than the rest who did not stay around to remain standing as he could. Therefore, as such (in conclusion) no one, not his mother or his wife say he is ‘therefore not man enough’ for her.)
WHY MEN TROPHY HUNT: SHOWING OFF AND THE PSYCHOLOGY OF SHAME
Prominent evolutionary anthropologists (Brian Codding and Kristen Hawkes from the University of Utah) have studied hunter-gatherer populations for decades.
Interestingly, analyses of the types of animals hunter-gatherer men target are very similar in that they are often the largest animals in the landscape. Importantly, they are also animals with high ‘failure rates’. That is, men are likely to come home empty handed from hunting. This is very different from women hunters, who target smaller animals that they are more assured to acquire and bring home as food.
On that hunt, on a lake outside Tampa, I met Jay, a hugely successful New York photographer and author, who said, “I watched Romancing The Stone as a kid. In the movie, Michael Douglas kills a crocodile and turns it into a pair of cowboy boots. That’s what I’m here. I want to wear a pair of cowboy boots and to be able to say to my friends, ‘I killed these’”.
And kill them he did, from a flat-bottomed boat after he first harpooned it with a buoy tied to a rope so it couldn’t swim away, making Jay holler “this is like something out of Jaws!”
Men who target these large, difficult-to-acquire animals, therefore, signal to others that they can absorb the costs of an inefficient behaviour. It signals that they have high-quality underlying mental and physical characteristics to be able to absorb such costs.
This ‘costly signalling’ to which it’s referred in the evolutionary literature, provides a way for men to accrue status. And status is universally important for men to ward off competition and attract mates. (I’ll note here that hunter-gatherer populations consume the animals they kill, unlike most trophy hunters. In no way do I advocate any opposition to the ways in which Indigenous peoples earn their livelihood).
What are your major messages?
We believe this ‘costly signalling’ model applies equally well to trophy hunters from the developed world. By paying big bucks to trophy hunt, or even forgoing smaller individuals within populations to wait for chances at the very biggest, imposes costs on trophy hunters. And it’s prestigious to signal that you can absorb these costs. In other words, trophy hunters, whether they realize it or not, are likely hunting for status. It’s like driving a luxury car, though in this case the lives of animals are taken.
How do your findings extend and differ from what others have written about trophy hunting?
People, including me, were confused as to why men do this. Are they sick in the head? Bloodthirsty? Some believe that these are appropriate terms. For me, this evolutionary explanation goes deeper and asked, why did this behaviour evolve? We think we offer a good explanation.
Some might argue, ‘Well, if this is natural behaviour, then it’s justified’. I believe this is a dangerous argument referred to as the naturalistic fallacy. My colleague and mentor, Dr. Paul Paquet of the Raincoast Conservation Foundation, makes this abundantly clear by reminding us, “Trophy hunting can neither be justified for being natural nor as an aid to help populations, given the enormous costs paid by individual animals – their lives.”
How might one apply what you found to put a stop to this reprehensible practice that some claim they do “in the name of conservation”?
One interesting observation post-Cecil (the lion’s death by trophy hunting) is that demand for lion hunting has declined owing to prohibitions on transporting the remains on planes, etc. If hunters cannot bring the trophies home to boast with, then they have no costly signal.
How many elephants are killed by poachers every year?
100 Elephants are killed per day. The U.N. says up to 100 elephants are being slaughtered a day in Africa by poachers taking part in the illegal ivory trade. Mar 19, 2015.
How many wild elephants are left in the world?
Population at the turn of the 20th century, there were a few million African elephants and about 100,000 Asian elephants. Today, there are an estimated 450,000 – 700,000 African elephants and between 35,000 – 40,000 wild Asian elephants. That is a third or less than a third or even by as much as a quarter of the population of elephants that existed at the turn of the last century. Three-quarters of them have disappeared effectively.
Endangered Asian elephants
Asian elephants are even more endangered than African elephants — but the threat isn’t poaching so much as human encroachment. The Asian species is smaller than the African, and none of the females and only some of the males have tusks. While some are hunted for ivory or meat, most of the Asian elephants taken from the wild are not killed, but domesticated for zoos, safari tourism, or timber hauling. There are only about 30,000 remaining wild Asian elephants, while 15,000 live in captivity. The wild herds in India, Sri Lanka, and Thailand are dwindling, too, as human development shrinks their habitat. Many populations are now cut off from migration routes and forced to inbreed.
An elephant’s tusk is a tooth. It’s an elongated incisor, one-third of which is embedded into the elephant’s skull. The tusk is made up of nerve endings and pulp matter, and removal is deadly.
Elephants use their tusks in a variety of ways. They are used to protect themselves and their herd from predators, and elephants can even use their tusks for digging water holes. However, elephants are also anintegral part of the environment. They are sometimes referred to as “mega gardeners,” and without them, hundreds of animal and plant species would cease to exist as well.
Why are Elephants Killed for Their Tusks?
Up to 70 percent of ivory poached goes to China, where half a kilogram of it can sell for as much as 1,000 U.S. dollars. This increase in demand has been fueled by the growth of a middle class in China. People can now afford the material that they have grown up believing is better than diamonds.
Tusks are specialized teeth and elephants have only one set that continue growing throughout the elephant’s life. They are sometimes broken off as a result of natural movements, such as digging and sparring with other elephants. If a tusk is not broken off at its root, then yes- the tusk will continue to grow.Feb 2, 2010
Can you cut off an Elephant’s Tusks without killing it?
A tusk can be removed without killing the elephant. … But poachers use darts, poison and high-powered automatic rifles with night scopes to take elephants down and, while they are dying, the tusks are gouged out of from the livingelephant’s skull. Jul 30, 2014
The Poacher & The Trade
How much is a pound of Ivory worth?
Ivory fetched prices as much as $1,500 per pound due to demand in Asia, where elephant tusks are ornately carved into art.Jun 2, 2016
Poachers kill elephants for their valuable tusks — a single pound of ivory can sell for $1,500, and tusks can weigh 250 pounds. That is USD375,000 (or just over a 1/3 million dollars) per tusk! Nov 7, 2016
How extensive is the poaching?
Poachers are now slaughtering up to 35,000 of the estimated 500,000 African elephants every year for their tusks. A single male elephant’s two tusks can weigh more than 250 pounds, with a pound of ivory fetching as much as $1,500 on the black market. The ivory is so valuable because all across Asia — particularly in China — ivory figurines are given as traditional gifts, and ivory chopsticks, hair ornaments, and jewelry are highly prized luxuries. “China regards ivory as a cultural heritage; they are not going to ban it,” said Grace Gabriel of the International Fund for Animal Welfare. Many Chinese consumers don’t realize that elephants must be killed for their ivory; in one survey, more than two thirds of Chinese respondents said they thought tusks grew back like fingernails.
What impact has the slaughter had on the elephants?
Elephants are highly intelligent, social creatures that live in matriarchal groups, and poaching has ravaged much of their social structure. The biggest tusks are found on the largest breeding males and on the oldest females, who lead the elephant troops. Where these animals are targeted and killed, elephant populations are reduced to leaderless groups of traumatized orphans huddling together. In the past year, even they are being wiped out, as some poachers have started dumping cyanide into watering holes, killing every animal that drinks there. Last year, poachers killed an estimated 300 elephants in Zimbabwe’s largest park, Hwange, by lacing watering holes and salt licks with cyanide. To read more about the impact poaching of elephants have had on Botswana, more here.
Who are the poachers?
Since the industry is illegal, those who run it largely come from criminal syndicates or terrorist organizations. Al-Shabab, the Somalia-based wing of al Qaida, raises $600,000 a month from poaching to fund its activities. Uganda’s Lord’s Resistance Army, the rebel group notorious for enslaving children, also raises money through poaching. “Poaching has become one of the most profitable criminal activities there is,” says Peter Seligmann, the CEO of Conservation International. Chinese mafia organizations mostly do the purchasing and distribution of ivory after it’s been obtained, selling it mostly in China and Southeast Asia but sometimes to markets in the U.S.
Why is the price so high?
When ivory became contraband, the supply got scarcer, but demand remained strong. In 1989, the international community passed a global ban on the trade in new ivory to stop the killing of elephants. Only ivory that had been harvested before 1989 could be sold, so the ivory carving industry in China crumbled, and with it the demand for tusks. Elephant populations rebounded — so much so that in 1999 the Convention on International Trade in Endangered Species (CITES), a global organization, decided to allow a “one-off” sale of pre-ban, stockpiled ivory to Japan (what did we not say here?).
Then in 2008 it authorized another “one-off”sale, this time to Japanese and Chinesemarkets. The Chinese carving industry roared back to life, as the Chinese government licensed dozens of carving factories and retail outlets. Since there’s no way to distinguish between pre-ban and new ivory, the illegal ivory trade has accelerated to meet the demand, and poaching is now worse than before the global ban.
(REUTERS/James Akena)
What steps are being taken to stop poaching?
Under pressure from some member nations, CITES refuses to institute a complete ban on the ivory trade. But the U.S. is taking its own measures. The U.S. is the second-biggest ivory market, after China. In a symbolic gesture last fall, U.S. officials smashed 6 tons of contraband ivory, including tusks and carvings, that had been seized from smugglers or confiscated from unwitting tourists. And in February, the Obama administration announced it would change regulations to ban interstate sales of all ivory except certified antiques, limit elephant trophy imports to two per hunter, and end commercial imports of antique ivory.
Is China cooperating?
Following the U.S.’s ivory crush, the Chinese government destroyed 6 tons this January, and Hong Kong authorities say they will destroy their 30-ton stockpile, one of the largest in the world. Chinese environmentalists have also begun educating the public about the dire consequences of buying ivory. But it’s a tough sell in a country where ivory has long symbolized wisdom and nobility. “With more disposable income in mainland China, many people are flaunting their wealth, and ivory is seen as a luxury product that confers status,” says Tom Milliken of the Wildlife Trade Monitoring Network.
Why is the ban so hard to enforce?
There is no reliable way to tell pre-ban from post-ban ivory, or a real antique from a fake — in any country. “It’s not like you walk into a store and find someone selling cocaine, which is illegal on its face,” said Edward Grace, deputy assistant director for law enforcement at the U.S. Fish & Wildlife Service. In Chinese and U.S. shops alike, consumers simply assume that ivory trinkets are legal, and there is no way for law enforcement to prove that any particular item was made after 1989. Mary Rice, executive director of the Environmental Investigation Agency, says there’s only one real solution: “We need to learn from history and permanently shut down all ivory trade — international and domestic.“
The End Consumer
Why is Ivory so popular in China?
Ivory is often used to make elaborate and expensive ornaments in China.
In China and Hong Kong, ivory is seen as precious material and is used in ornaments and jewelry. It’s also sometimes used in traditional Chinese medicine.
Some rich Chinese people think that owning ivory makes them look more successful. Others think that ivory will bring them good luck.
China has the biggest ivory trade in the world and wildlife experts believe that around 70 per cent of the world’s ivory ends up there.
It is said that buyers of ivory don’t understand they have blood on their hands. That notion is startling given where we are in the timeline of civilization and the increasingly global dissemination of knowledge. Conservation efforts have never reached so far and wide through media as they do today. So how can people not know about the tragedy behind their white gold trinkets? Accountability for this gross misconception seems to lie with the Chinese government.
But from uncovering this bizarre ignorance, change has been set into motion. A variety of conservation campaigns have been aimed at educating the middle class — those most likely to purchase ivory. People who have seen these campaigns, such as posters depicting how an elephant’s life is sacrificed to harvest their tusks, are far less likely to purchase ivory products. Japan was previously the largest demander of ivory, before organizations and celebrities raised awareness and reduced the consumption by 99 percent.
Beijing’s master ivory carvers cling to a controversial art
Beijing (CNN)When Li Chunke started carving ivory in 1964, the number of elephants in Africa was still on the rise. Demand for ivory in China was practically non-existent and tusks could be bought for under $7 a kilogram.
Today, this figure is closer to $1,100 — according to research by Save the Elephants.
But while this marks a significant increase over the course of Li’s career, the price of coveted xiangya (elephant teeth) has almost halved over the last 18 months.
An endangered art form?
Conservationists have welcomed the recent drop in demand, attributing it to awareness campaigns and President Xi Jinping’s commitment to abolish the ivory trade in China.
But for 65-year-old Li, these changing attitudes threaten an ancient art form and the livelihoods of many carvers. “Ivory carving represents Chinese traditional culture” he says, sipping green tea in his small apartment in Beijing. “Chinese people love it because it is an ancient skill — it’s a practice that belongs to the imperial arts.”
At the state-owned factory where he spent his five-decade career, Li would sculpt everything from small trinkets to full-length tusks adorned with classical scenes.
Legal restrictions mean that he is rarely able to keep raw ivory at his home. Nonetheless, on the far side of his living room I find a small workshop besieged by chisels, drill bits and tools. Some are electronic, but the majority are simple hand tools — the sort he trained with. From the clutter, Li picks out figurines carved from a variety of different materials.
Ivory’s rare combination of density and smoothness makes it ideal for intricate carving, but there are alternatives. Hippo, narwhal and walrus tusks possess similar qualities. “When we don’t have ivory, we also use beeswax and agarwood,” he explains.
Li shows me a small horse statuette and an ancient goddess fashioned from a piece of mammoth tusk — an ivory substitute excavated from the Siberian permafrost.
“When we made carvings for export [in the 1960s] the products had to represent Chinese traditional culture — it was merchandise,” he recalls. “Now I can carve on any theme, including religion and modern life.”
Since retiring from the factory in 2013, Li estimates he makes fewer than 10 carvings a year, and can spend as long as two months on a single item. He appears despondent about elephant poaching and the black market that are now associated with his industry. “We are legal ivory-carving professionals,” he says. “The ivory we used was from natural deaths. We ought to protect wildlife. I like animals and I’ve kept a puppy as a pet. I find it shocking that elephants are killed by men.”
With the worldwide ban on ivory in 1989, factories like Li’s were able to stay open, as China still permitted domestic trade. A licensing system allowed the continued import of tusks sourced from natural elephant deaths and police seizures.
But the distinction between legal and illegal trade is becoming blurred, say conservationists. A 2011 investigation by the International Fund for Animal Welfare (IFAW) found that almost 60% of licensed vendors and carving factories in China were involved in black market trade.
A high-profile campaign featuring former basketball star Yao Ming argues that all ivory consumption — even the licensed trade — feeds the cycle of killing. “Yao Ming’s ‘no buying, no killing’ is only partly right — we still have to think about the inheritance of traditional Chinese culture,” Li says. “Of course, the raw material can be replaced by alternatives, which is why my students also use woods and jade. But some of the nuances of carving — ones that can only be reflected in ivory — are at risk.”
Carvers are turning to ivory substitutes including beeswax, agarwood and even mammoth tusk dug up from Siberian permafrost.
Rise in demand for mammoth tusks
On the other side of central Beijing, one of Li’s students, Li Jiulong (no relation), leads me into his small, dusty workshop. The 26-year-old shares the space with four other apprentices. A fellow carver sits practicing her technique on a small block of wood, her engravings guided by ink markings.
Work surfaces are arranged in a square, each littered with hand tools for breaking down large chunks of tusk and more accurate electronic ones for finer details. While his master is old enough to ignore the diminishing demand for ivory, the younger Li must keep his options open.
In addition to his apprenticeship he is also undertaking a master’s degree which sees him working with lacquer — a traditional colored finish applied to wood. He can obtain ivory through “the proper channels,” but Li spends much of his time carving other materials, including mammoth tusks.
“These tusks have been buried underground for a long time, which can cause cracks and change their color,” he explains, sketching out their differing patterns of grain on a piece of paper. “They would [originally have been] white like the elephant tusks, but they’re also more compact than normal ivory.”
Imports of mammoth tusks from Hong Kong (the main route bringing them in from Russia) has more than tripled since 2000. But the young apprentice retains some hope for traditional ivory carving, despite the recent drop in demand.
“It’s true that ivory won’t be huge business in the future but it won’t vanish. It is part of our cultural heritage,” he says. “It will survive and keep its place,” he argues.
In its 2015 survey of African workers, South Africa’s Rand Merchant Bank found Batswana to be the laziest on the continent. The problem is actually more acute than that.
In the 2017-2018 Global Competitiveness Report, Botswana scores the worst among the 137 countries that are tracked by the World Economic Forum’s Global Competitiveness Index (GCI) on 12 pillars of economic competitiveness. From a list of 16 factors, respondents to the World Economic Forum’s Executive Opinion Survey were asked to select the five most problematic factors for doing business in their country and to rank them between 1 (most problematic) and 5. The results were then tabulated and weighted according to the ranking assigned by respondents. One of those factors is “Poor work ethic in national labour force.”
With a score of 19, Botswana’s national workforce (which would include those in the public and private sector as well as NGOs) emerge as standard bearers of the poorest work ethic in the world survey. Also doing poorly are Trinidad & Tobago (15.9), Brunei (14.4), Sri Lanka (11.1), Liberia (10.8), Bhutan (10.5), Seychelles (10.1), Malta (9.8), Georgia (9.7), Mauritius and Vietnam (9.5), Namibia (9.3), Bahrain (9.0), Kuwait (8.7) and United Arab Emirates and Jamaica (8.6).
WEF’s interest in labour productivity has to do with the fact that it impacts on business. A University of Botswana study by Professor John Makgala and Dr. Phenyo Thebe (“There is no Hurry in Botswana”: Scholarship and Stereotypes on “African time” Syndrome in Botswana, 1895-2011”) found that this lack of productivity has frustrated effort to attract foreign direct investment. Interestingly, there was a time when, according to literature that the authors quote, Botswana’s civil service “was generally believed to be the most efficient in the whole of the African continent.”
On a past trip to Singapore, former and late President Sir Ketumile Masire gained an appreciation on the efficiency of the country’s workers. Where a Motswana factory worker would produce one shirt within a given period of time, a Singaporean counterpart would produce six within the same period.
“This was productivity not in theory but in demonstrable terms. When we say we are not productive, this is what we meant,” Masire recalled to Sunday Standard in 2015 of this experience which would lead to Botswana benchmarking with Singapore and delegations from the two countries travelling back and forth.
As one of the Four Asian Tigers, Singapore would provide one quarter of the inspiration to establish the Botswana National Productivity Centre (BNPC). The tigers are Hong Kong, Singapore, South Korea, and Taiwan. Along the way, however, the late president appears to have given up on ever inculcating the right work ethic in Batswana. On assessing the apparent resistance, he determined that Batswana’s poor work ethic was a result of their pastoralism.
“If you look at the life of pastoralists, they don’t have a good work ethic,” he had said. The example he had cited was that beyond sinking a borehole for their livestock, letting out cattle to pasture and doing some other undemanding work, most of the time pastoralists are just lazing about as their cattle graze untended in the bush. By Masire’s analysis, this is the work ethic that has been bequeathed to modern-day Botswana.
As a University of Botswana study shows, not one productivity intervention scheme by the government has produced the desired results. In his 2015/16 budget speech, the Minister of Finance and Economic Development, Kenneth Matambo, lamented the low levels of labour productivity in Botswana. The best performers in terms of work ethic in the national labor force are from Zimbabwe and Venezuela underpinned by a perfect score.
Table 1: Comparison of Botswana with 2017’s Best Global Labour Productivity Data
DID YOU KNOW? THE AVERAGE PER CAPITA PRODUCTIVITY IN BOTSWANA LAGS THE WORLD’S PRODUCTIVE COUNTRY BY FOUR (4) TIMES?
TALKING POINTS:
Organizational Policy on Collective Responsibility and Financial Viability
1.Introduction Economic conditions are challenging. A private organization cannot survive solely on government-issued tenders. These organizations must find alternative sources of income. To achieve long-term viability, an organization must independently generate income through domestic production and sales. It should also strategically develop export channels to meet international market demands. Organizations that fail to adopt this framework will face challenges. Continuing to depend on government-led initiatives, donors, or grants is not sustainable. They must recognize that personal incomes and livelihoods will remain uncertain. Such income sources cannot be used as bargaining tools.
Given the absence of long-term planning at the outset, urgent and decisive transformation is now required. The organization must implement immediate, radical shifts in mindset and operational practices to effectively respond to the current challenges.
2. Fundamental Organizational Principles The next principles are essential to the organization’s integrity and must be upheld by all members. Violations occur when personal interests are prioritized over collective organizational welfare.
2.1 Collective Responsibility The organization is a collective entity, comprising both employees and the employer. Each individual assumes equal responsibility for the organization’s success and failure upon joining. Mere attendance does not constitute work; only output that meets the employer’s standards and expectations is considered work.
Employees are not entitled to income generated by predecessors, investors, or the employer. Organizational participation demands sustained effort, alignment with the organization’s goals, and active collaboration rather than passive compliance.
Failure to internalize this principle, especially in the context of cultural and linguistic differences, can lead to miscommunication. It also weakens cooperation and causes a decline in the necessary skills for collective functioning. Such deficiencies undermine the organization’s ability to function as a cohesive and effective entity.
2.2 Authority Over Assets The judicial system has sole authority. It determines if the organization’s assets are seized or liquidated. Employees do not have this right. Democratic processes allow employees indirect influence. Nevertheless, judicial action demands clear evidence of the employee’s direct contribution to the organization’s income generation.
Though these contributions are measurable, enforcement remains inconsistent, revealing a systemic gap. The organization does not offer exit benefits to employees without demonstrable contributions to income or growth. This is especially true during periods of financial strain or operational incapacity.
2.3 Compensation and Entitlement Employers hire staff without long-term guarantees to sustain salaries. Still, it is structurally unsound to allow severance or exit benefits to be claimed as entitlements independent of performance. Compensation must be based on the employee’s proven ability, whether during or after employment. The employee should generate enough income to cover operational costs, return on investment (ROI), profit, and organizational growth.
Claims that exceed this threshold are unfounded. Severance is not a reward for leaving but deferred compensation for value delivered during employment. Employees are not entitled to income generated by others, like predecessors or the employer.
2.4 Salary Agreements While salary terms are agreed upon at the time of appointment, such agreements can shield under-performance. Employees who fail to deliver measurable value still claim full compensation, leading to structural imbalance and threatening organizational sustainability.
2.5 Consequences of Non-Enforcement Failure to set up, enforce, and adhere to these principles will lead to systemic degradation. Over time, the financial and operational stability of the organization will deteriorate, weakening its capacity to fulfill its mission.
2.6 Impact on Organizational Culture and Performance As organizational health declines, employee morale, initiative, and innovation will suffer. Problem-solving capacity, resilience, and long-term outlook will also decline. These effects undermine both individual and collective performance, ultimately jeopardizing the organization’s sustainability.
3. Measuring Employee Contribution to Income Generation To assess the value contributed by each employee, the following metrics should be used:
Revenue per Employee: The total revenue divided by the number of employees. This is a key metric for assessing productivity and profitability.
Sales per Employee: The total sales divided by the number of employees. This metric is particularly relevant for organizations focused on revenue generation.
This policy framework outlines essential principles that must be followed to ensure organizational integrity and long-term success. All employees must align with these principles and contribute to the organization’s collective well-being.
Mindsets and Beliefs (Thinking) that contribute to these challenges:
The article examines the systemic challenges impacting Botswana’s productivity. It highlights that certain prevailing mindsets and beliefs contribute to these challenges:
Reliance on Past Solutions: The belief that previous solutions will address current problems can be limiting. As noted in “Law #1: Today’s Problems Come From Yesterday’s Solutions,” this mindset obstructs innovation. It prevents the development of approaches necessary for current challenges. More here.
Quick-Fix Mentality: Seeking immediate remedies without considering long-term consequences can exacerbate issues. “Law #5: The Cure Can Be Worse Than The Disease” shows that short-term solutions lead to significant problems. These issues can intensify over time. More here.
Desire for Immediate Gratification: The expectation of achieving multiple benefits simultaneously without acknowledging necessary trade-offs can be problematic. “Law #9: You Can Have Your Cake and Eat It, Too” emphasizes the importance of recognizing trade-offs. It also highlights managing them in decision-making. More here.
Fostering a culture of continuous learning is essential. Embracing innovative solutions is also crucial. Understanding the complexities of systemic challenges further enhances productivity in Botswana.
Here’s a clearer breakdown of the ways of thinking and underlying beliefs that lead to the systemic challenges described in the article “Cracking the Botswana Productivity Code” by Sheila Singapore, with a focus on the mental models behind each:
1. Reliance on Past Solutions
Belief:“If it worked before, it will work again.” Way of Thinking:
Linear thinking, where cause and effect are assumed to be stable and repeatable.
Over-reliance on tradition or precedent rather than adaptive learning.
Lack of reflection on whether the original solution created new unintended consequences.
Result:
Failure to deal with root causes in a changing environment.
Resistance to innovation or systems redesign.
Related Law from the article: Law #1: Today’s Problems Come from Yesterday’s Solutions
This law warns that yesterday’s “fixes” often sow the seeds of today’s dysfunction. Over time, without continuous learning, these solutions become entrenched, even when they no longer serve the current reality.
2. Quick-Fix Mentality
Belief:“We need to act now—any action is better than no action.” Way of Thinking:
Event-oriented thinking, focused on visible symptoms rather than underlying patterns.
Short-termism, driven by urgency or performance metrics.
Preference for symptomatic solutions instead of fundamental or structural ones.
Result:
When resources become available, there is often a tendency to focus on “low-hanging fruit.” These are initiatives that promise quick wins or visible results. While these offer short-term gains, they often come at the expense of fundamental investments (such as building the agriculture and manufacturing economic bases). These investments are necessary for long-term, sustainable growth and, therefore, profits and return. As a result, systemic issues stay unresolved, and progress becomes cyclical, fragile, and ultimately unsustainable.
Interventions that create new problems or worsen existing ones.
A culture of fire-fighting rather than strategic planning.
Related Law from the article: Law #5: The Cure Can Be Worse Than the Disease
This law illustrates how applying quick solutions can escalate the problem in the long run. It stresses the need to pause, study the whole system, and design for lasting change rather than just immediate relief.
3. Wish for Immediate Gratification
Belief:“We can have it all now—there shouldn’t be trade-offs.” Way of Thinking:
Magical or wishful thinking—assuming that multiple benefits can be achieved at the same time without tension.
Disregard for systemic delays and unintended consequences.
Inability to rank or sequence actions for sustainable impact.
Result:
Over-promising and under-delivering.
Undermining of trust and credibility when goals aren’t met.
Related Law from the article: Law #9: You Can Have Your Cake and Eat It, Too—But Not All at Once
This law highlights the need for strategic trade-offs and pacing. It encourages leaders to resist the temptation of “everything, everywhere, all at once.” Instead, they should align their ambitions with system capacity and time.
Summary Thought:
Each of these beliefs reflects a limited mental model. Systems thinker Peter Senge cautions against this kind of model in The Fifth Discipline. These models block adaptive learning and creative problem-solving. Shifting toward systems thinking involves embracing uncertainty, learning from feedback, and engaging multiple perspectives for lasting, generative change.
Let’s map those unproductive ways of thinking and beliefs to leverage points that can help shift the process toward sustained productivity—using Donella Meadows’ leverage points framework (and with Fifth Discipline thinking sprinkled in):
🔁 Mapping Limiting Beliefs to Systemic Leverage Points
1. Reliance on Past Solutions
Belief: “If it worked before, it will work again.”
Limiting Mental Model: Fixed mindsets, failure to update strategies with changing conditions.
🎯 Leverage Point: Change the mindset or paradigm out of which the system arises(#2 on Meadows’ list)
Actionable Strategy:
Introduce system thinking education at leadership levels.
Help regular reflection sessions where teams critically assess past “solutions” and their unintended consequences.
Use learning histories or After Action Reviews to surface system feedback over time.
🧠 Fifth Discipline Insight:
Replace reactive problem-solving with “personal mastery” and “shared vision” to encourage progressive-thinking and co-created futures.
2. Quick-Fix Mentality
Belief: “Just do something. Anything.”
Limiting Mental Model: Immediate action is always the answer; no time for systems mapping or stakeholder engagement.
🎯 Leverage Point: Lengthen the delays to allow for system feedback and learning(#6)
Actionable Strategy:
Build delays into planning cycles for research, prototyping, and community engagement.
Adopt a “double-loop learning” model: don’t just ask “Are we doing things right?” but also “Are we doing the right things?”
Replace KPIs focused on immediate outputs with indicators of long-term ability (like “rate of organizational learning”).
🧠 Fifth Discipline Insight:
Avoid the “Shifting the Burden” archetype where symptomatic fixes distract from fundamental changes.
3. Desire for Immediate Gratification
Belief: “We can have it all right now.”
Limiting Mental Model: Trade-offs are unnecessary or signs of failure.
🎯 Leverage Point: Change the goals of the system(#3)
Actionable Strategy:
Redefine success to include sustainability, capability-building, and resilience—not just short-term gains.
Use a balanced scorecard that includes social, learning, and environmental capital alongside financial metrics.
Build public awareness of delayed gratification as part of national development (e.g., through storytelling or national campaigns).
🧠 Fifth Discipline Insight:
Shift to a “generative orientation”—focus on capacity to grow and evolve over time, not just on immediate results.
🔧 Practical Implementation for Botswana or Your Org:
Limiting Belief
Suggested Intervention
Target Leverage Point
Who Leads?
Relying on outdated solutions
Systems thinking workshops; “sunsetting” old programs
Paradigm shift
Research & Policy Units
Quick fixes preferred
Create slow-down protocols; delay mechanisms
Delays in feedback
PMO / Strategic Planning Units
Wanting it all now
Align vision with phased growth plans
System goals
Board / Exec Leadership
Here’s the visual causal mapping between the limiting beliefs and their corresponding systemic leverage points:
🔴 Reliance on Past Solutions links to a Paradigm Shift, calling for deeper mindset transformation.
🟡 Quick-Fix Mentality connects to Delays & Feedback Loops, urging better pacing and long-term learning.
🔵 Desire for Immediate Gratification maps to Changing System Goals, emphasizing a shift toward sustainability and capacity building.
Here’s the enhanced systemic leverage map, showing:
Limiting beliefs (left),
The leverage points needed to shift the system (center),
The key stakeholders or institutional roles responsible for enabling those shifts (right).
This format is ideal for strategic planning sessions or policy discussions, making it easy to assign ownership and co-design interventions.
REQUIRED RESEARCH ANALYSIS
FOR DETAILS OF DATA REQUIRED FOR RESEARCH ANALYSIS FOR THIS SUBJECT, CLICK HERE.
Is there such a thing as systemic development of industries? We can tell what systematic is. Yes?
But what about systemic development of industries?
Let us take a context.
Let us say we wish to see the industry of dairy production grow within the country.
What needs to happen that would enable the sustained development of this industry. Now
Milk and cooky (Photo credit: Salim Virji)
notice two things:
The first, notice I did not say a dairy company but rather I referred to the industry. This means it has effects on the nation . That means more dairy companies are likely to succeed better as a result the industry is growing. When we take care of ‘the whole’, ‘the whole’ takes care of the parts.
The second, when we say it is successful, in this work, we would need to define it. We would expect to see the following happen:
Levels of production rises consistently over time (it rises persistently and resists or buffers itself against significant downfalls) given populations are rising
As such levels of revenue rises consistently over time
Levels of costs per unit production declines consistently over time
Yes? Is that how you see it too? These are what I meant by the systemic development of dairy production in the county.
Growth of the Dairy Industry (for the Country)
Therefore, what needs to happen for all the above to happen for dairy production?
Well …..
Image via Wikipedia
Dairy or milk comes from cow. So, to see dairy production grow in the country, while anything else may or may not happen, we cannot expect it to grow without first also seeing the growth of the number of dairy cows produced within the country.
On the other hand, should we see a decline of the number of these cows (because we sell the cows so that we may pay school fees), then we can also expect to see a decline in the level of dairy milk produced in the country.
What do you notice by these discussions? Is this line of thinking the same as systematic thinking?
Did you say, no? Well, you are right!
So here’s the next question, what would make sure the systemic development of the dairy cow industry grows within the county?
Growth of the Dairy Cow Industry
You know the drill now!
What do cows (anywhere) need?
Fodder? Meaning, that the level of fodder produced needs to grow so that we are able to produce more dairy cows. Usually we do it the other way around! We say well, there is not enough (supply, given demand for) fodder. The market says that the demand is growing and then, it (the market) tries to scramble to ‘close the gap’.
When demand drives supply, that’s a sign of non-systemic development of the nation. But in a systemic relationship it is the supply that leads demand. Notice it does not drive it. It facilitates. It just makes it easier. It respects the order in which causality happen.
Image via Wikipedia
So, therefore before we expect to see the number of dairy cows grow in the country, we should first expect to see the number of companies that produce fodder grow within the country. This needs to happen before anything else does, almost to a fault.
When that industry grows (production levels rise at lower units costs), the amount of fodder available in the country also grows. Therefore, as a result, it will not become difficult for the cows to “eat and go forth and multiply“. And when it does, the dairy production levels in the country would naturally increase. This happens even without needing the government to take actions to intervene. This will also add up to lower costs in running the government.
What’s the next question?
Did you say, what would it take for the fodder industry to grow over time? You are right! Now we can see, you’ve got the drill.
Growth of the Fodder Industry
Where does fodder come from?
You are right. Crops! Fodder is often the by-product or the remnants of crops once humans have used it for their consumption.
Image via Wikipedia
So what are we saying here? For dairy production to grow within the county, we need to first see the growth of crops produced in the country, grow as an industry. When that does not happen, and should it instead decline, then the fodder industry declines, which in turn leads to dairy cow production declining which in turn reduces dairy production or makes it difficult to take off for the country.
So what causes crop production to grow in the country?
Which one of the following, in your view, when it is available makes it easier for crop production to grow? Which of the following would we need to see available?:
Land
Water
Seeds
Fertilizer or
Is would it be the willingness of people to grow crops for cattle?
Growth of the Crop Industry
However should crop production be the primary domain of the female gender in the country, that is, she decides when, how much and what crops to grow, it is possible she may not be willing to grow crops for cattle. This is because her primary focus and need is to grow crops to put food on her table, for her children! Not for the world! And certainly not for the cattle.
So, therefore which gender do you think should become involved in crop production, so that dairy production would grow in the country?
Should it be led by the mind of man or the mind of a woman who should lead this effort? Does it differ or not at all?
The mind of the man is typically designed to ‘feed the world’. There are exceptions, but always look at the rule. The mind of the woman is there to help nurture (of feed) her child (not the child of another woman!) Do not fight that or we risk not having mothers for our children.
Who therefore do you think cannot absolve himself from crop production for the county?
Image via Wikipedia
When the man becomes involved in crop production, we would now be able to feed milk to our children (including the children of the women who did not wish to grow crops for the cattle). Also, men, unlike women, will inherently (even if it is just sheer strength in their muscles) to till, sow for multiple seasons and harvest larger expanses of land. This situation is there in the likes of China, Vietnam, India, Indonesia, South America for generations, where production of crops is the domain of the male gender. This has also has a positive impact on the water cycle . This means that as more amounts of the land is fertile for crops, such lands in turn encourages more frequent levels of rainfall for the country.
Is the amount of land, water, seeds, fertilizer available therefore consequential in the story. It really is not. It becomes consequential when I focus on my company. But not from a systemic development of industries and the nation.
So if I focused on changing things that are happening in my company, would that be enough to turn things around for the nation? The parts separately cannot take care of “the whole”.
Hmm …. what would we have to do differently today so that we as men, women and children can see these together as a nation?


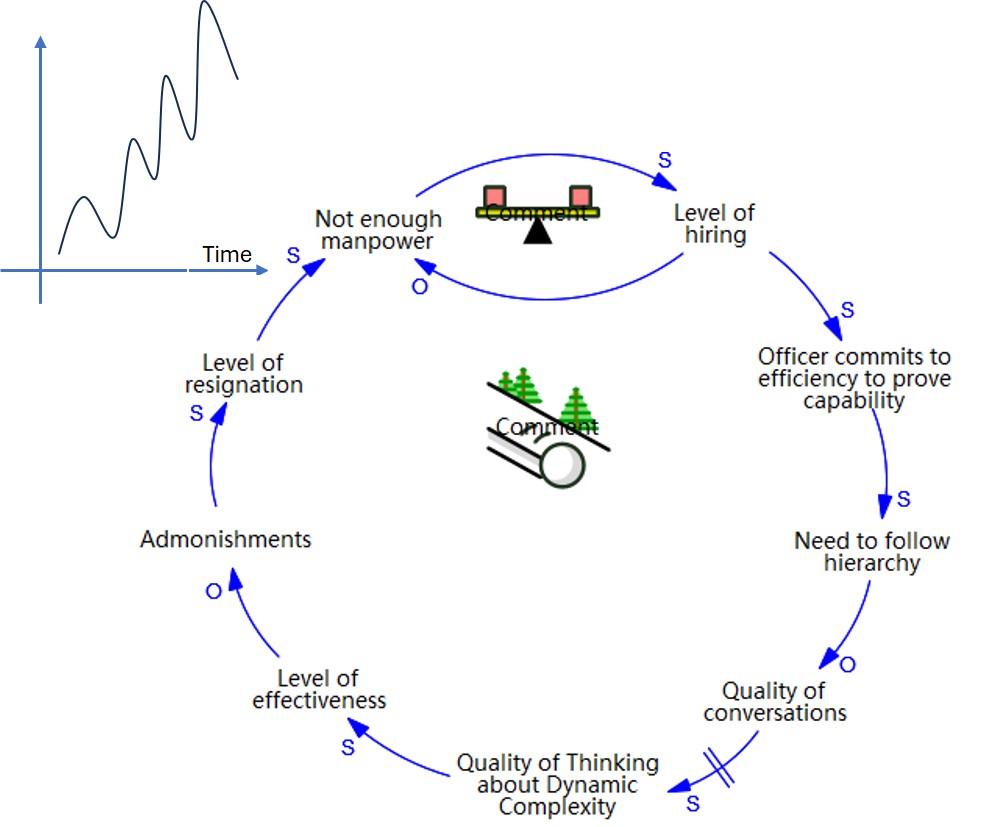


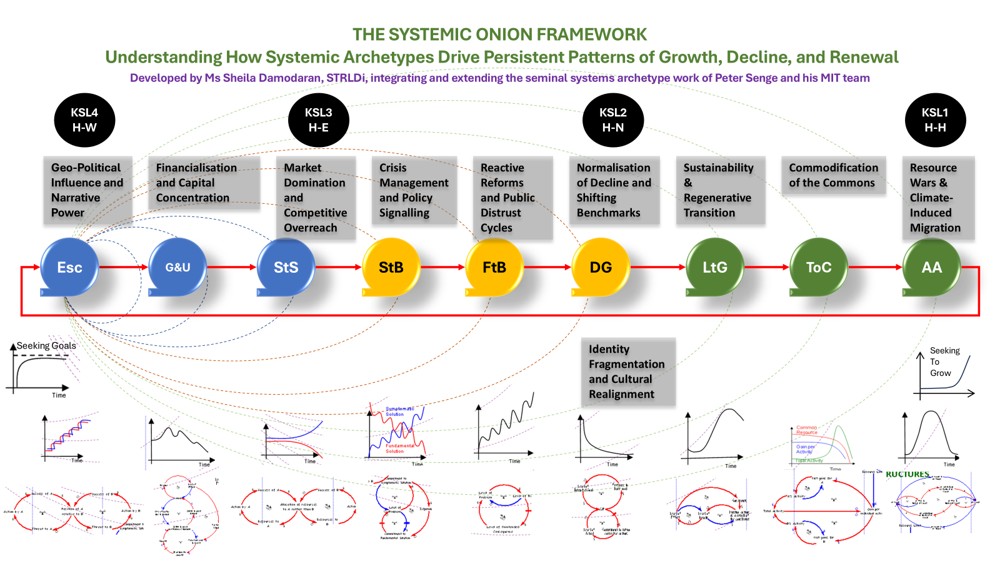
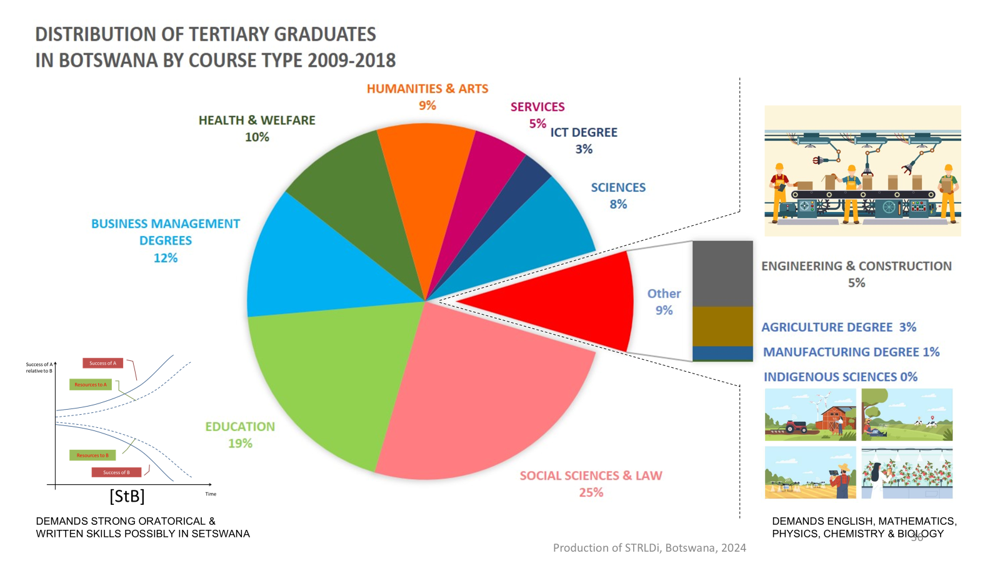
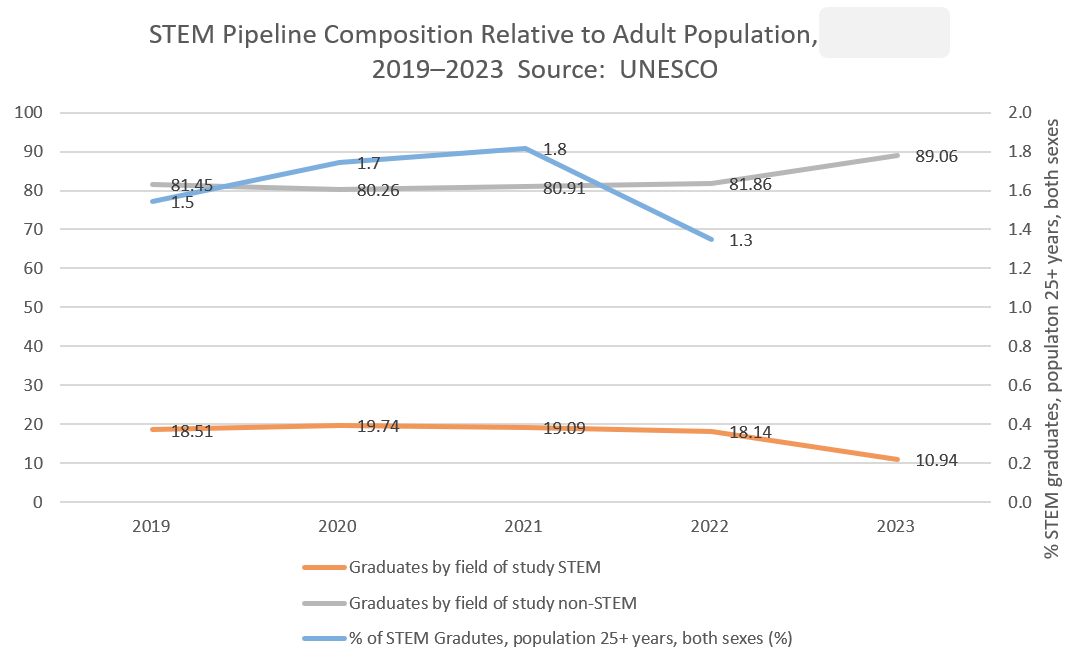
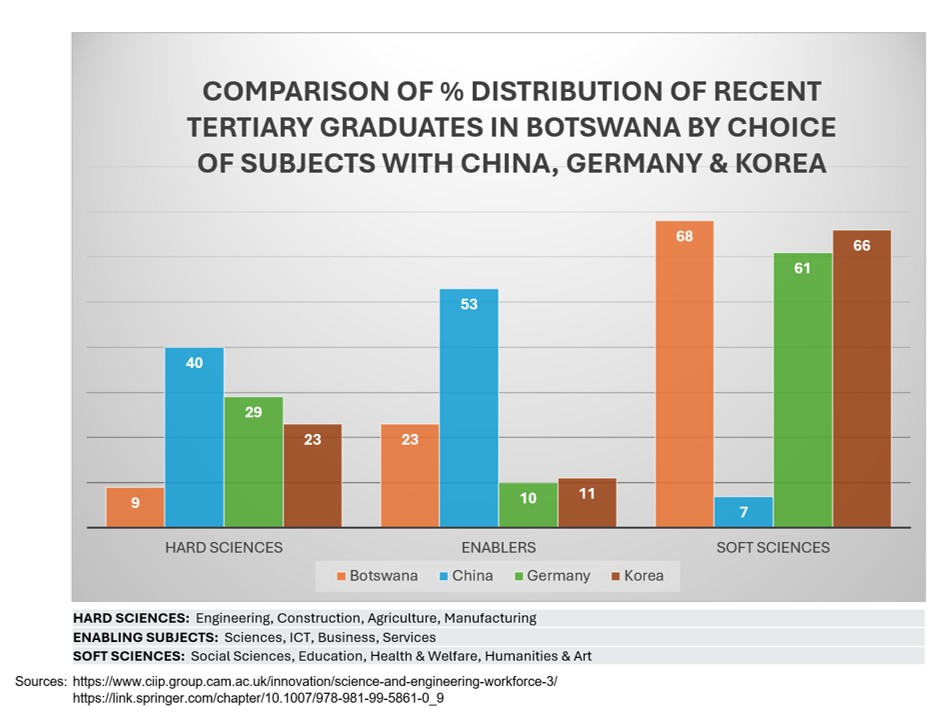

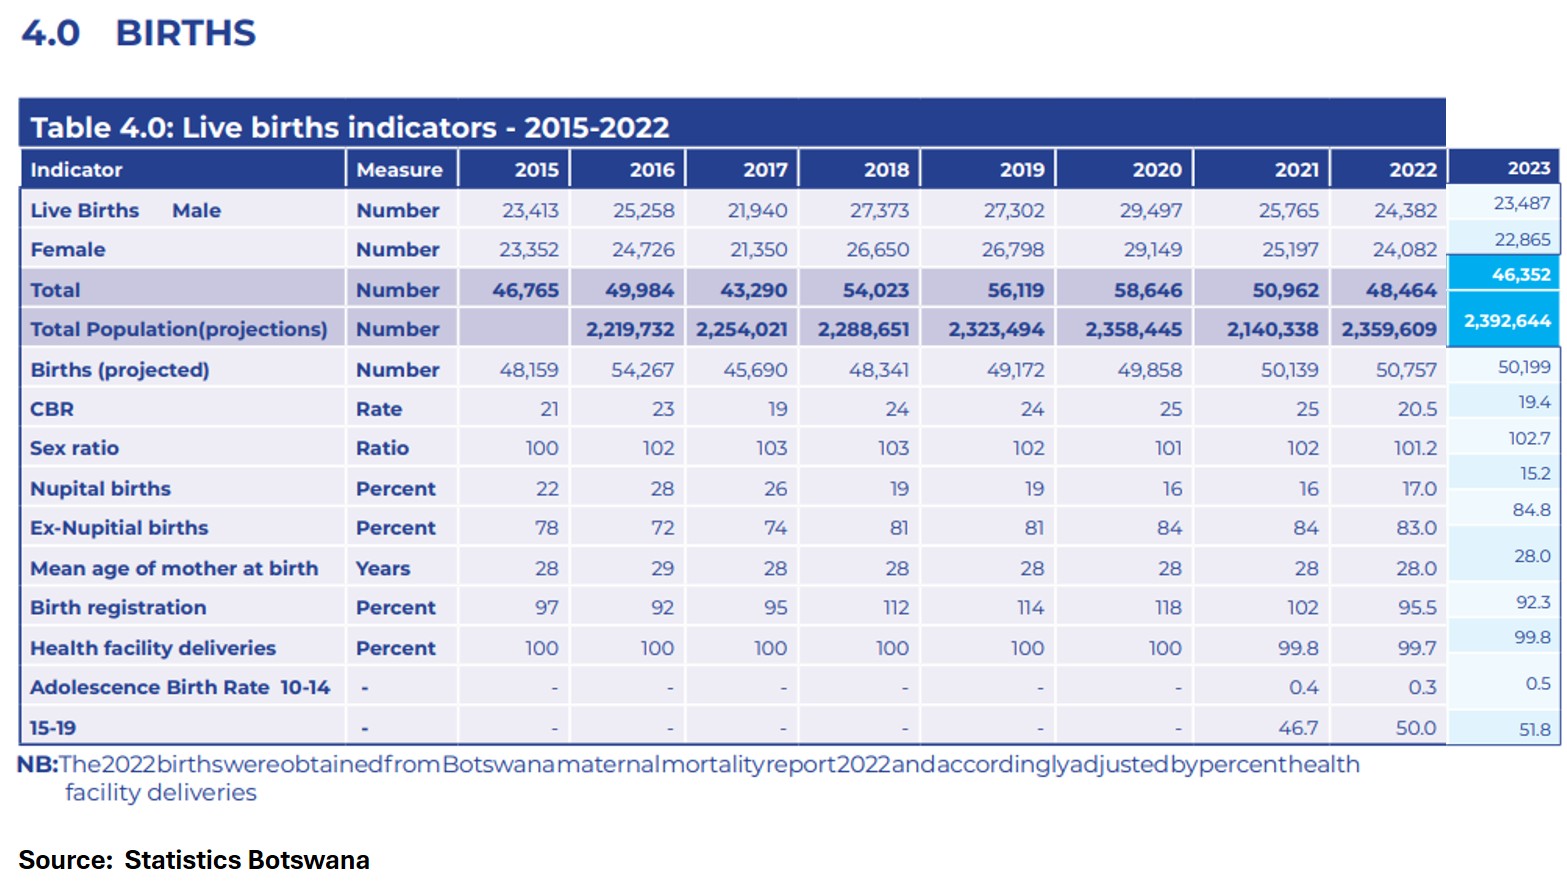
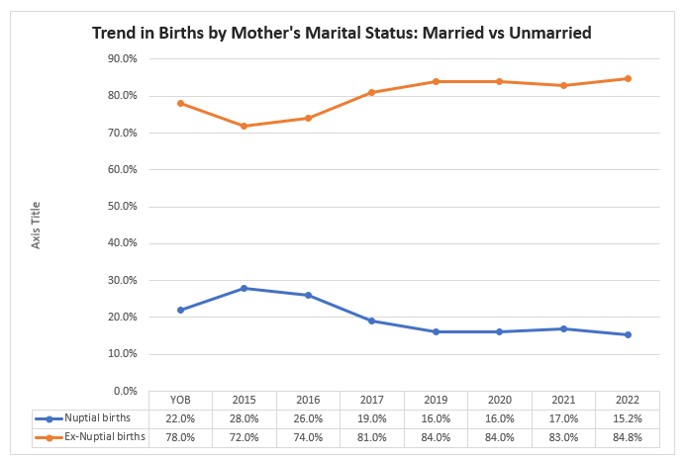

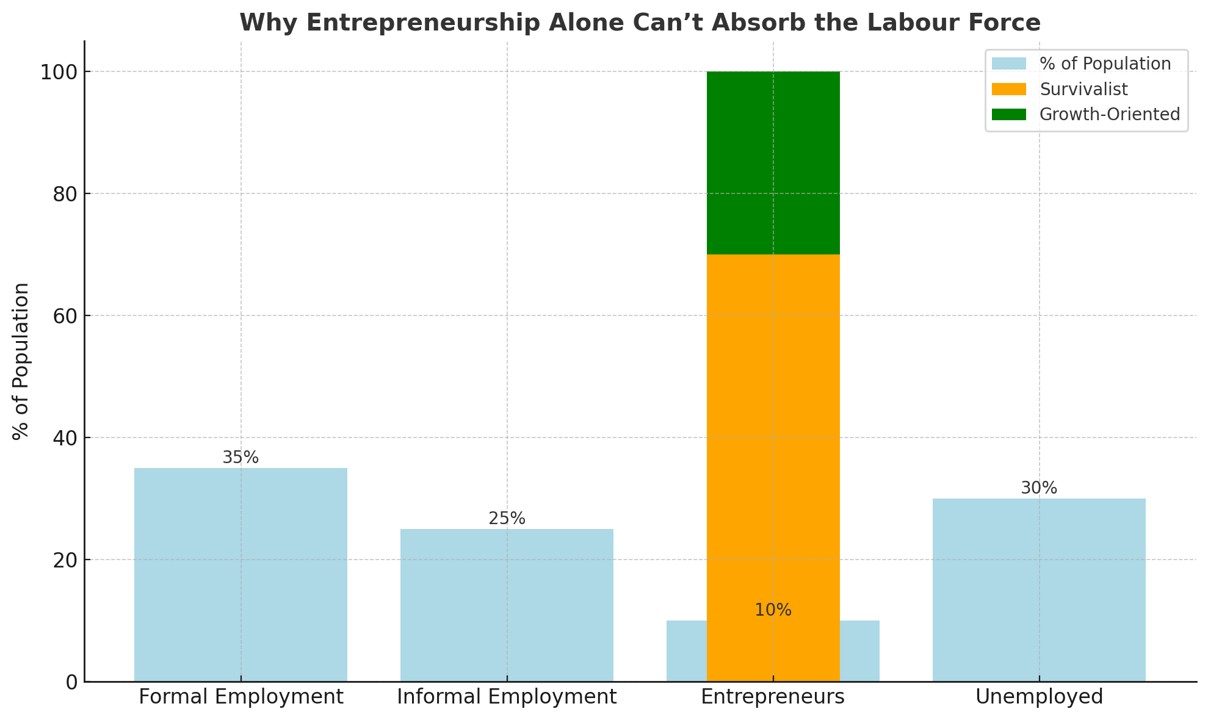


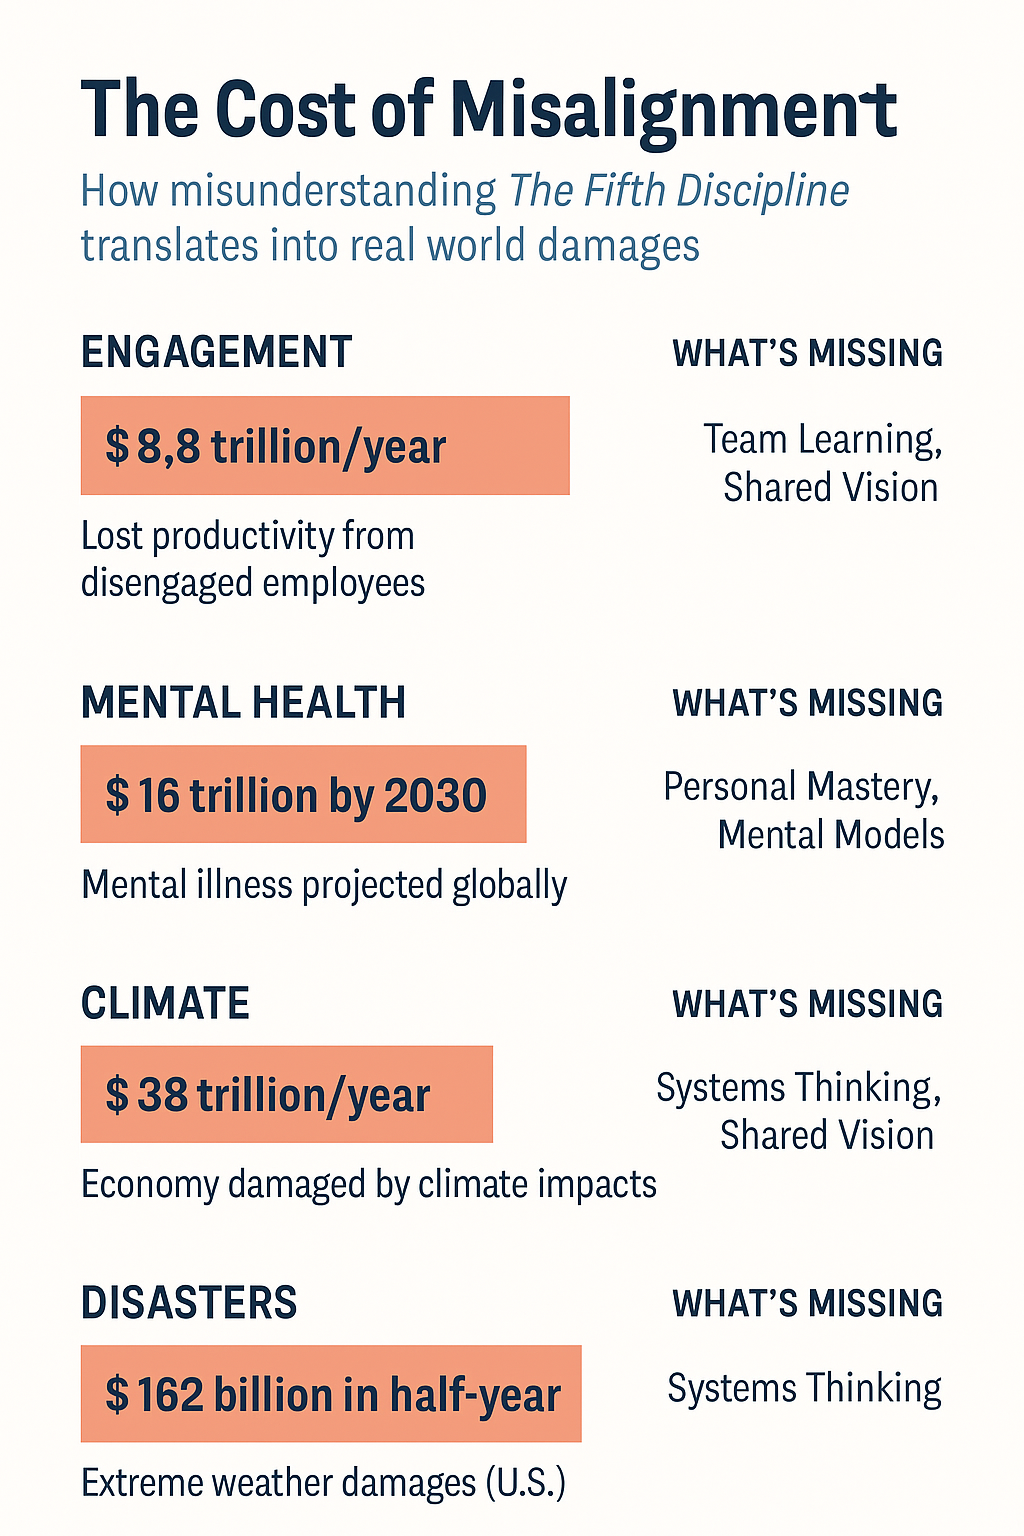


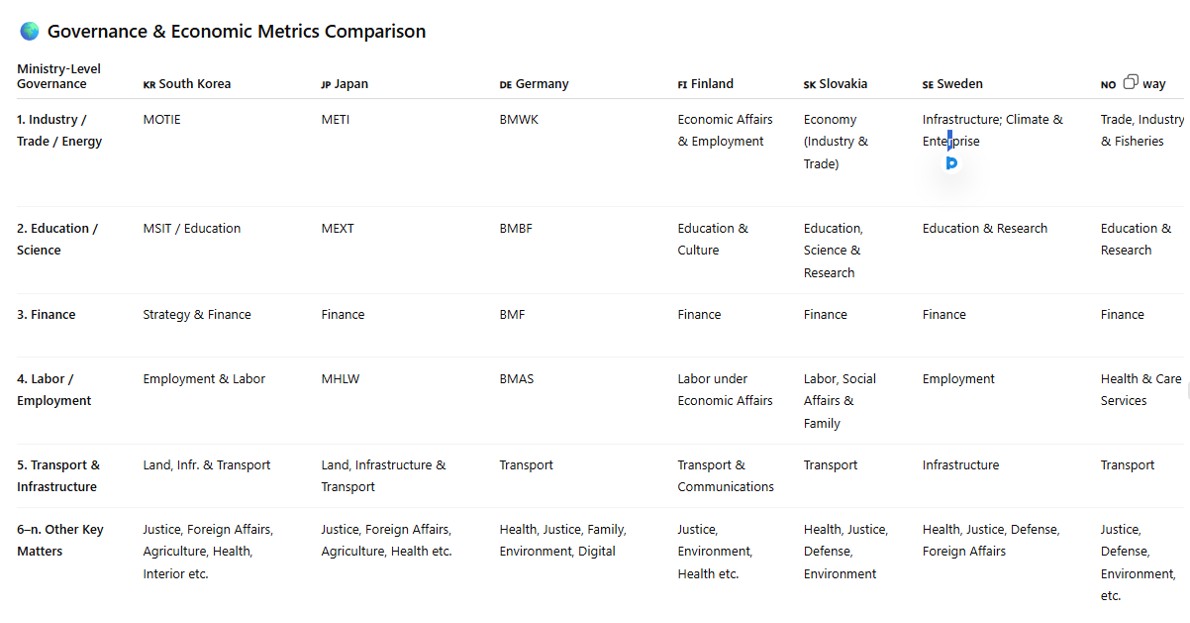
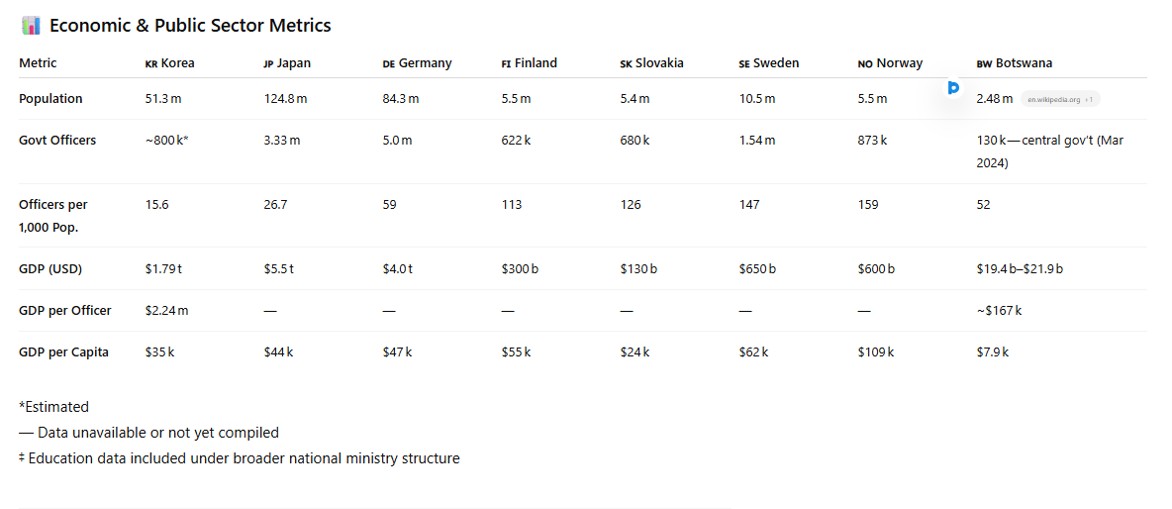


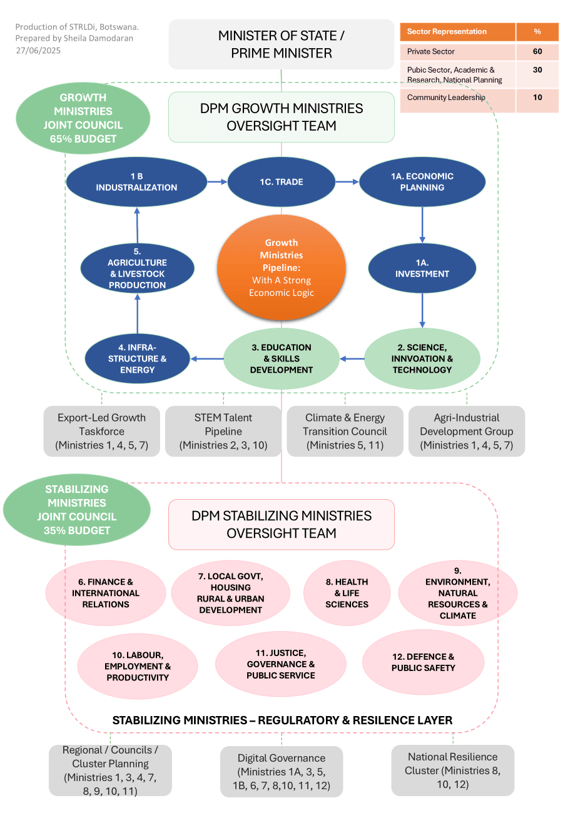
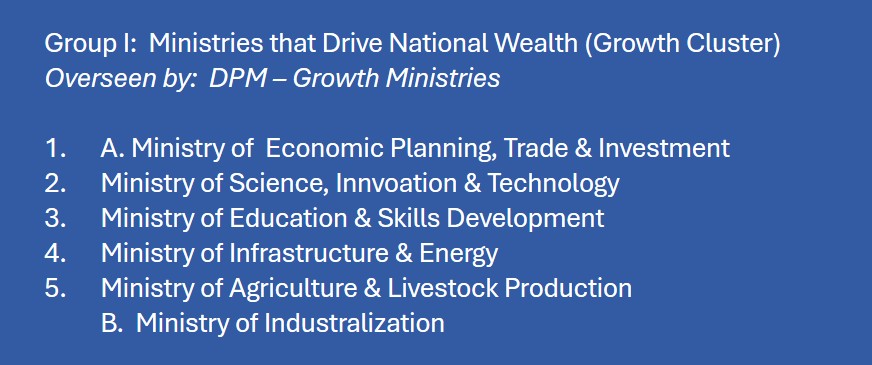


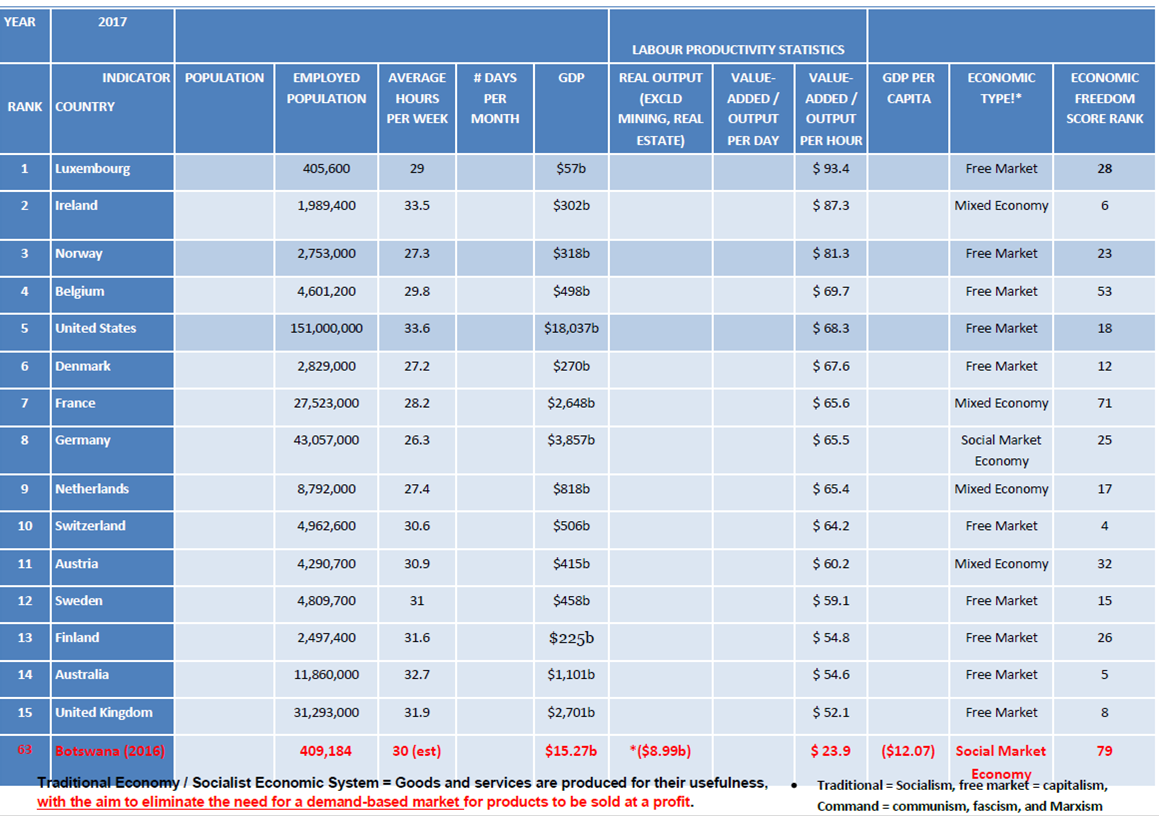


...")


You must be logged in to post a comment.