Transforming Understanding into Coordinated Action
“Persistent issues cannot be solved by isolated interventions. They require disciplined inquiry, shared understanding, capable leadership and sustained stewardship.”
Purpose
The purpose of Client Solutions & Delivery is to help governments, organisations, development partners and communities understand and respond effectively to persistent issues that continue to resist conventional approaches.
Many institutions invest significant financial, human and political resources in addressing national and organisational challenges. Yet despite these investments, many issues continue to recur, often becoming more deeply embedded over time. This persistence suggests that the difficulty lies not only in implementation, but in the way the problem itself is understood.
Client Solutions & Delivery exists to change that.
The pillar brings together research, leadership development, collaborative strategy, institutional learning and policy advisory into one integrated system through which clients move from fragmented understanding to coordinated action.
Unlike conventional consulting approaches that begin by recommending solutions, STRLDi begins by helping institutions understand the system producing the outcomes they experience. Once that understanding is developed, the Institute works alongside leaders to strengthen capability, align stakeholders, support implementation and build the institutional capacity required to sustain transformation over time.
Every engagement therefore contributes not only to solving immediate challenges, but also to increasing the client’s own ability to learn, adapt and respond to future complexity.
The Client Transformation Journey
Every client engagement follows a disciplined learning journey.
A persistent issue first becomes the subject of systemic inquiry. Research seeks to understand the structures, behaviours and mental models that sustain the issue over time.
This understanding provides the foundation for leadership development, enabling individuals and teams to develop the disciplines required to think systemically, work collaboratively and lead transformation within complex environments.
Leaders are then brought together through Strategy Steward Labs, where shared understanding is translated into coordinated strategies, implementation pathways and collective stewardship.
As implementation progresses, Monitoring, Evaluation & Learning captures outcomes, reflects upon experience and generates new knowledge that continually strengthens both the client and the Institute.
Knowledge generated through every engagement is preserved within the Digital Knowledge Platform, ensuring that valuable insight remains accessible for future research, leadership development and institutional learning.
As STRLDi continues to mature, research and implementation learning will increasingly inform policy, strategy and national transformation, allowing systemic insight to influence broader institutional and societal development.
Through this integrated journey, isolated projects become opportunities for enduring organisational and national learning.
Institutional Structure
The Client Solutions & Delivery Pillar is organised through seven complementary offices, each contributing a distinct capability while reinforcing the work of the others.
1. Research & Systems Diagnostics
Current Steward: Nancy
Purpose
Research forms the intellectual foundation of STRLDi.
Before organisations attempt to solve a persistent issue, they must first understand the system that continually reproduces it. Research therefore seeks to move beyond symptoms by revealing the structural relationships, behavioural patterns and underlying assumptions that sustain undesirable outcomes over time.
Rather than studying isolated events, STRLDi investigates the dynamic interactions that shape long-term organisational and societal behaviour. This work draws upon systems thinking, organisational learning, behavioural analysis, systemic archetypes and the Institute’s evolving research methodologies.
Research becomes the basis upon which all subsequent leadership, strategy and transformation activities are built.
Key Responsibilities
Design and lead systemic research programmes.
Conduct systems diagnostics for governments, organisations and communities.
Develop Behaviour Over Time analyses and causal explanations.
Produce policy-oriented research publications.
Advance STRLDi’s research methodologies.
Supervise research teams and collaborative studies.
Build research partnerships with universities and institutions.
Key Result Areas
High-quality research.
Credible systemic diagnostics.
Knowledge generation.
Publications.
Policy influence.
Research partnerships.
2. Leadership Development
Current Steward: Bernice
Purpose
Transformation depends upon leadership capable of understanding and working within complexity.
Leadership Development equips individuals and teams with the disciplines, capabilities and habits of learning required to steward persistent issues rather than merely react to them.
The programmes are grounded in the principles of learning organisations and systems thinking, encouraging leaders to challenge assumptions, develop shared understanding, cultivate collective learning and strengthen institutional capability.
Leadership development is therefore not viewed as individual training alone, but as an investment in organisational transformation.
Key Responsibilities
Design leadership development programmes.
Deliver executive learning.
Develop facilitators.
Coordinate participant learning journeys.
Maintain programme quality.
Support organisational learning within client institutions.
Key Result Areas
Leadership capability.
Learning culture.
Programme quality.
Client satisfaction.
Organisational development.
3. Strategy Steward Labs
Current Steward: Ms Sheila Damodaran
Purpose
Strategy Steward Labs provide the environment within which systemic understanding becomes coordinated action.
Complex issues cannot be transformed by isolated actors working independently. Sustainable change requires institutions, sectors and stakeholders to develop a shared understanding of the system they collectively influence.
The Labs bring these diverse perspectives together to explore systemic relationships, align strategic intent and co-create practical pathways for implementation.
Rather than producing static strategic plans, the Labs cultivate ongoing stewardship, enabling participants to continually learn, adapt and strengthen implementation over time.
Key Responsibilities
Design and facilitate Strategy Steward Labs.
Coordinate cross-sector dialogue.
Support strategy development.
Facilitate implementation planning.
Build shared ownership.
Strengthen institutional collaboration.
Key Result Areas
Shared understanding.
Coordinated implementation.
Stronger stakeholder alignment.
Improved strategic coherence.
Sustainable transformation.
4. Monitoring, Evaluation & Learning
Purpose
Implementation generates experience.
Experience becomes valuable only when it is examined, understood and incorporated into future practice.
Monitoring, Evaluation & Learning (MEL) ensures that every engagement contributes to measurable outcomes while simultaneously strengthening institutional capability through disciplined reflection.
Evaluation therefore becomes both a mechanism for accountability and an opportunity for continuous organisational learning.
Key Responsibilities
Monitor programme implementation.
Evaluate outcomes.
Assess institutional capability growth.
Capture implementation learning.
Produce evaluation reports.
Inform continuous improvement.
Key Result Areas
Outcome measurement.
Learning integration.
Programme improvement.
Evidence-based decision making.
5. Digital Knowledge Platform
Current Steward: Monty
Purpose
Knowledge represents one of STRLDi’s most valuable institutional assets.
The Digital Knowledge Platform preserves, organises and shares this knowledge so that research, methodologies, publications and institutional learning remain accessible to future practitioners, researchers and leaders.
Rather than functioning solely as a document repository, the platform is envisioned as a living knowledge ecosystem that continually expands alongside the Institute’s work.
Key Responsibilities
Develop the digital knowledge repository.
Manage research archives.
Curate institutional publications.
Support digital collaboration.
Develop AI-supported knowledge systems.
Preserve organisational memory.
Key Result Areas
Accessible institutional knowledge.
Digital capability.
Organisational memory.
Knowledge sharing.
6. Office of Policy, Strategy & National Transformation
Future Development
Purpose
This office translates research and implementation learning into strategic advice capable of influencing institutional, national and regional transformation.
The Office supports governments, public institutions and development partners in developing policies, strategies and reform programmes grounded in systemic understanding rather than isolated interventions.
Its work ensures that learning generated through research and implementation contributes to broader societal change.
Key Responsibilities
Develop policy briefs.
Facilitate national strategy formulation.
Support institutional reform.
Provide executive advisory services.
Produce transformation frameworks.
Translate research into policy.
Key Result Areas
Policy influence.
Strategic advisory.
Institutional reform.
National transformation.
7. Office of International Programmes
Future Development
Purpose
The Office of International Programmes extends STRLDi’s work beyond Botswana by coordinating research, leadership development and transformation programmes across Africa and other regions.
The Office ensures that international engagements remain grounded in the Institute’s philosophy while responding appropriately to different national and regional contexts.
It also facilitates mutual learning between countries, allowing knowledge generated in one context to strengthen practice elsewhere.
Key Responsibilities
Coordinate international programmes.
Develop regional partnerships.
Support cross-country learning.
Manage international delivery.
Strengthen global collaboration.
Key Result Areas
Regional programme delivery.
International partnerships.
Cross-country knowledge exchange.
Expanded institutional reach.
How the Pillar Works
Client Solutions & Delivery functions as an integrated learning system rather than a sequence of independent services.
Research reveals the deeper structure of persistent issues.
Leadership Development equips people to work with that understanding.
Strategy Steward Labs create the shared commitment required for coordinated implementation.
Monitoring, Evaluation & Learning ensures that action generates insight rather than merely activity.
The Digital Knowledge Platform preserves that insight as institutional knowledge.
The Office of Policy, Strategy & National Transformation translates learning into broader reform, while the Office of International Programmes enables these capabilities to contribute across national and regional boundaries.
Together, these offices transform inquiry into understanding, understanding into leadership, leadership into coordinated action and coordinated action into enduring institutional capability.
Key Result Areas of the Pillar
The Client Solutions & Delivery Pillar will be considered successful when it consistently:
Produces rigorous research that deepens understanding of persistent issues.
Develops leaders capable of working with complexity and systemic change.
Strengthens collaboration through Strategy Steward Labs.
Supports implementation through disciplined monitoring, evaluation and learning.
Builds and preserves an accessible body of institutional knowledge.
Influences policy, strategy and institutional reform through evidence-based advisory services.
Extends STRLDi’s contribution across Africa and the wider international community while remaining faithful to its philosophy and purpose.
This pillar is the transformational engine of STRLDi. It is where knowledge is created, leaders are developed, strategies are stewarded and learning is converted into practical improvements for organisations, governments and societies. Every capability within the pillar reinforces the others, ensuring that the Institute’s work is not a collection of disconnected services but a coherent journey from understanding to enduring transformation.
Building the Relationships Through Which Transformation Becomes Possible
“No institution transforms a nation alone. Lasting transformation emerges when relationships become purposeful, knowledge becomes shared and diverse institutions learn to steward change together.”
Contents
This page explains how the Strategic Partnerships & Growth Pillar enables STRLDi to build the relationships, partnerships and collaborative platforms through which its mission is fulfilled. It introduces the philosophy underpinning the pillar, explains how partnerships develop over time, describes the stewardship portfolios and institutional offices that make up the pillar, and outlines how these relationships generate learning, opportunities and long-term institutional growth.
The page is organised into the following sections:
1. Purpose Why Strategic Partnerships & Growth is central to STRLDi’s mission.
2. The Partnership Journey How relationships develop from dialogue to long-term institutional partnerships.
3. Institutional Structure An overview of the pillar and the relationship portfolios through which it operates.
4. Government, Media & International Relations Building relationships with government, the media and international institutions.
5. Economic Partnerships & Development Cooperation Working with the private sector, investors and development partners.
6. Institutional, Professional & Knowledge Partnerships Strengthening collaboration with professional bodies, universities, research institutions and knowledge networks.
7. Community, Knowledge & Regional Partnerships Connecting with communities, traditional leadership, local government and regional organisations.
8. Proposal Development & Resource Mobilisation(Future Development) Transforming opportunities into funded programmes and strategic partnerships.
9. Membership Office(Future Development) Building a long-term community of individuals and institutions committed to systemic transformation.
10. Communities of Practice Supporting continuous learning and collaboration beyond individual projects.
11. Conferences, Strategic Dialogues & Executive Systems Programmes Convening leaders through Executive Sunday Systems Retreats, Executive Wednesday Systems Forums, regional Executive Systems Programmes and strategic dialogues that generate learning, relationships and future opportunities.
12. Knowledge & Public Engagement Sharing research, strengthening public understanding and extending STRLDi’s influence through publications, media and digital platforms.
13. How the Pillar Works Understanding how the different portfolios work together to create a continuous cycle of partnership, learning and institutional growth.
14. Key Result Areas The outcomes by which the Strategic Partnerships & Growth Pillar will be measured.
15. Closing Reflection A reflection on why stewardship, relationships and collaboration are among STRLDi’s greatest institutional assets.
Purpose
The Strategic Partnerships & Growth Pillar exists to build, steward, and strengthen the relationships through which STRLDi fulfils its mission.
Persistent national and regional issues rarely exist within the boundaries of a single organisation, ministry or profession. They emerge through the interaction of many actors whose decisions, priorities, and actions continually influence one another. For this reason, meaningful transformation depends as much on the quality of relationships as on the quality of technical solutions.
STRLDi therefore views partnership development not as an activity undertaken after research is completed or programmes are designed. Partnership is itself a strategic capability. It enables diverse institutions to discover shared purpose, develop mutual trust and mobilise collective action around issues that no single organisation can address independently.
This pillar cultivates the institutional ecosystem within which STRLDi’s research, leadership development, and strategy stewardship can flourish. It identifies opportunities for collaboration, develops long-term institutional relationships, mobilises resources, and creates the conditions for the continual exchange of knowledge across sectors, disciplines and national boundaries.
In doing so, Strategic Partnerships & Growth strengthens not only the Institute itself but also the broader communities of practice committed to systemic transformation.
The Philosophy of Partnership Stewardship
Partnerships are not support functions. They are strategic capabilities through which institutions learn, coordinate and transform together.
At STRLDi, relationships are cultivated not simply to expand the Institute’s network, but to strengthen society’s collective capacity to understand and respond to persistent structural issues.
Partnerships create the conditions through which research is enriched, leadership develops, knowledge travels, and transformation becomes possible.
The Partnership Journey
Partnerships within STRLDi develop through a deliberate journey rather than isolated transactions.
Relationships begin through dialogue and shared inquiry. As trust develops, opportunities for collaboration emerge naturally. These opportunities are translated into jointly designed programmes, research initiatives and leadership engagements that create value for all participants.
Implementation generates further learning, strengthening both the relationship and the institutional capability of those involved. Over time, individual collaborations evolve into enduring partnerships, professional networks, and communities of practice that continue learning together long after individual projects have concluded.
In this way, partnerships become living systems of learning rather than contractual arrangements.
The Strategic Partnership Ecosystem
Institutional Structure
The Strategic Partnerships & Growth Pillar is organised through specialised relationship portfolios that together ensure every major stakeholder group receives intentional stewardship while remaining connected to STRLDi’s broader mission.
1. Government, Media, and International Relations
Current Steward: Brunoh
Purpose
Governments remain central actors in addressing persistent national challenges. This office cultivates trusted relationships with ministries, departments, public service leadership and national planning institutions, creating opportunities for collaborative inquiry, leadership development and institutional transformation.
It also serves as the principal channel through which STRLDi communicates its work to the wider public, ensuring that research findings and institutional learning contribute meaningfully to national discourse.
Brunoh stewards STRLDi’s relationships with the national government, the media, and international institutions. He is responsible for positioning the Institute as a trusted voice on persistent national and regional issues while strengthening relationships that expand STRLDi’s influence beyond Botswana.
Key Responsibilities
Steward relationships with central and local government.
Engage ministries, departments, and agencies.
Coordinate executive briefings and government dialogues.
Support public-sector leadership engagement.
Develop strategic communication initiatives.
Strengthen public understanding of systemic issues.
Primary Stakeholders
National Government
Ministries and Government Departments
Public Service Leadership
National Planning Institutions
Media Houses
Journalists and Editors
Broadcast and Digital Media
International Organisations
International Government Relations
Embassies and High Commissions
Public Communications
Executive Briefings
Thought Leadership Campaigns
Primary Outcomes
Strong government relationships
Increased media visibility
International institutional relationships
Public-sector opportunities
International collaborations
Enhanced STRLDi reputation
2. Economic Partnerships & Development Cooperation
Current Steward: Mr Tema
Purpose
Sustainable transformation requires collaboration with business leaders, investors, and development partners whose resources, expertise, and influence contribute to national development.
This office develops relationships with the private sector, international development agencies, philanthropic organisations and multilateral institutions, aligning shared interests around long-term systemic transformation.
Key Responsibilities
Build private-sector partnerships.
Develop relationships with development partners.
Facilitate donor engagement.
Identify investment opportunities.
Support resource mobilisation.
Coordinate international cooperation.
Key Result Areas
Development partnerships.
Private-sector collaboration.
Resource mobilisation.
International cooperation.
3. Institutional, Professional & Knowledge Partnerships
Current Steward: Mabua
Purpose
Professional bodies, statutory organisations and public enterprises play a vital role in strengthening institutional capability across society.
This office builds enduring relationships with these organisations, encouraging collaborative learning, joint research and professional development while creating opportunities for broader institutional transformation.
Key Responsibilities
Steward relationships with parastatals.
Engage professional associations.
Build institutional networks.
Coordinate sector-specific collaboration.
Support professional learning initiatives.
Key Stakeholders
Parastatals
Statutory Organisations
Professional Bodies
Industry Associations
Universities
Research Institutions
International Think Tanks
Knowledge Networks
Academic Collaboration
Joint Research
Key Result Areas
Institutional partnerships.
Professional collaboration.
Sector engagement
Research partnerships
Knowledge exchange
Institutional capability development
International academic collaboration
4. Community, Knowledge & Regional Partnerships
Current Steward: Coach
Purpose
Transformation becomes sustainable only when knowledge reaches communities and when learning flows across regional boundaries.
This office strengthens relationships with local government, traditional leadership, universities, research institutions, civil society organisations and regional bodies, particularly within the Southern African Development Community.
Its work ensures that STRLDi remains connected to the lived realities of communities while contributing to regional learning and cooperation.
Key Responsibilities
Engage local authorities.
Build relationships with Bogosi.
Develop university partnerships.
Coordinate regional collaboration.
Support academic cooperation.
Strengthen community engagement.
Key Result Areas
Community partnerships.
Academic collaboration.
Regional cooperation.
Knowledge exchange.
5. Proposal Development & Resource Mobilisation
Future Development
Purpose
Ideas become transformational only when they are adequately resourced.
This office converts emerging partnership opportunities into funded programmes, consultancy assignments, research initiatives and long-term institutional collaborations.
Its work enables STRLDi to sustain and expand its mission while ensuring that proposals remain grounded in the Institute’s philosophy and standards of professional practice.
Key Responsibilities
Coordinate Expressions of Interest and tenders.
Develop grant proposals.
Prepare consultancy submissions.
Negotiate partnership agreements.
Support contract development.
Maintain proposal quality.
Key Result Areas
Successful proposals.
Contract awards.
Programme funding.
Strategic investments.
6. Membership Office
Future Development
Purpose
The Membership Office builds a community of individuals and institutions committed to advancing systemic thinking, organisational learning and national transformation.
Membership extends the Institute’s reach beyond individual projects by creating a network of practitioners, researchers, leaders, and supporters who continue learning together over time.
The Office will also steward Fellows, Associates, Alumni, and Institutional Members, strengthening long-term relationships while generating recurring support for the Institute’s work.
Key Responsibilities
Manage membership programmes.
Coordinate Fellows and Associates.
Develop institutional membership.
Maintain alumni engagement.
Support member services.
Grow the learning community.
Key Result Areas
Membership growth.
Member engagement.
Institutional loyalty.
Community development.
7. Communities of Practice
Purpose
Communities of Practice provide ongoing spaces where professionals continue learning long after formal engagements have concluded.
Rather than functioning as networking groups alone, these communities become living laboratories through which knowledge is shared, practice evolves, and collaborative innovation emerges across sectors and disciplines.
Key Responsibilities
Establish thematic Communities of Practice.
Facilitate professional dialogue.
Encourage peer learning.
Share emerging research.
Strengthen collaborative problem-solving.
Key Result Areas
Active communities.
Professional learning.
Cross-sector collaboration.
Knowledge exchange.
8. Conferences, Strategic Dialogues & Executive Sunday Systems Retreat and Forums
Purpose
National and regional transformation requires spaces where diverse perspectives can meet in disciplined conversation.
This office designs and coordinates conferences, executive forums, public lectures, and strategic dialogues that bring together leaders from government, business, academia, development agencies, and civil society to explore emerging issues and strengthen collective understanding.
These gatherings also provide opportunities for disseminating research, showcasing innovation, and cultivating new partnerships.
Developing Leaders Through Shared Inquiry
The Executive Systems Programmes provide the principal entry point through which leaders engage with STRLDi. They are designed for leaders from the private sector, academia, research institutions, professional bodies, community organisations, traditional leadership and other sectors who are seeking a deeper understanding of persistent structural issues affecting their organisations, sectors and nations.
Unlike conventional executive education, these programmes do not focus on organisational performance, management techniques or functional leadership skills. Instead, they bring together leaders from diverse backgrounds to examine persistent structural issues through the discipline of systems thinking, using real national and regional challenges as the basis for collective inquiry and learning.
Each programme is intentionally limited to twenty-four participants, creating an environment that encourages thoughtful dialogue, meaningful relationships and sustained learning. Participants work across sectors, disciplines and professions, discovering how different parts of society contribute to the same persistent outcomes and where opportunities for coordinated action may exist.
To accommodate different schedules and geographic contexts, STRLDi delivers its Executive Systems Programmes in three complementary formats.
Executive Sunday Systems Retreats provide a three-part learning experience delivered over three consecutive Sundays. This format enables working professionals to participate while remaining engaged in their normal responsibilities.
Executive Wednesday Systems Forums offer the same programme over three Wednesdays, providing an alternative schedule for participants who prefer weekday learning.
For participants travelling from elsewhere in Southern Africa, STRLDi offers a Regional Executive Systems Programme, delivered over three-and-a-half days from Tuesday morning to Friday lunchtime. This format maximises learning while reducing travel demands.
The Executive Systems Programmes are not an end in themselves. They represent the beginning of a continuing relationship between participants and the Institute. As understanding develops, organisations often invite STRLDi to undertake systemic research, facilitate Strategy Steward Labs, support institutional transformation and contribute to long-term learning initiatives.
Convening Leaders Around Persistent Structural Issues
Many of the challenges confronting nations cannot be addressed by individual organisations acting independently. They require disciplined conversation among leaders representing different sectors, professions and institutions.
For this reason, STRLDi convenes conferences, strategic dialogues, executive forums and public lectures that create opportunities for collective learning around issues of national and regional importance.
These gatherings are designed to move beyond presentations and panel discussions. They encourage participants to examine the structural relationships underlying persistent issues, explore different perspectives, identify opportunities for collaboration and strengthen collective understanding before action is taken.
Subjects for dialogue may include unemployment, manufacturing, agriculture, education, food systems, local economic development, governance, innovation, regional integration and other issues requiring systemic inquiry.
The Executive Systems Programmes often provide the foundation for these larger engagements. As participants continue learning and relationships mature, they contribute to broader national conversations through conferences, policy dialogues and cross-sector forums.
These events also provide an important platform for disseminating STRLDi’s research, showcasing emerging insights and strengthening relationships with governments, universities, development partners, professional bodies and civil society organisations.
Through these engagements, STRLDi fulfils one of its central responsibilities: creating trusted spaces where leaders can think together before they are required to act together.
10. Knowledge & Public Engagement
Purpose
Knowledge fulfils its greatest purpose when it becomes accessible and contributes to public understanding.
This office ensures that STRLDi’s research, publications, digital platforms and media engagement reach diverse audiences in ways that encourage informed dialogue, thoughtful reflection and broader societal learning.
It also strengthens the Institute’s reputation as a trusted source of insight into persistent national and regional issues.
Extending Learning Beyond the Institute
Knowledge creates its greatest value when it is shared widely, applied thoughtfully and continually refined through dialogue and practice.
The Knowledge & Public Engagement Office ensures that STRLDi’s work reaches leaders, institutions and communities beyond those directly participating in programmes and consultancy engagements. It transforms research findings, institutional learning and practical experience into accessible knowledge that contributes to informed public discourse and long-term societal learning.
This responsibility includes the development of publications, policy papers, research reports, blogs, newsletters, digital learning resources and multimedia content. It also stewards the Institute’s websites, social media platforms and relationships with the media, ensuring that STRLDi’s work remains visible, credible and relevant to contemporary national and regional discussions.
Public engagement is not viewed simply as communication. It is an extension of the Institute’s learning mission. By encouraging thoughtful discussion around persistent structural issues, STRLDi helps broaden public understanding, strengthen systemic thinking and cultivate a growing community committed to institutional learning and national transformation.
Knowledge generated through research, Executive Systems Programmes, Strategy Steward Labs and institutional partnerships continually returns to this office for publication and dissemination. In turn, the questions, reflections and insights emerging from the wider community enrich future research and programme development.
Knowledge therefore moves in two directions. It flows outward to strengthen society’s understanding of persistent structural issues, and it flows back into the Institute, continually enriching STRLDi’s own capacity to learn, adapt and contribute.
Building a Sustainable Institute Through Service, Learning and Partnership
STRLDi is committed to building an institution that is both intellectually independent and financially sustainable. Long-term institutional stewardship requires more than excellent research and leadership development. It also requires the ability to generate the resources needed to attract capable people, invest in knowledge development, strengthen organisational capacity and continually expand the Institute’s contribution to society.
For this reason, the Strategic Partnerships & Growth Pillar plays a central role in developing opportunities that sustain the Institute while advancing its mission. Revenue generation is not pursued as an end in itself. Rather, it is the natural outcome of building trusted relationships, convening meaningful dialogue and delivering work that creates lasting value for leaders, institutions and communities.
The Executive Systems Programmes provide the principal entry point into this journey. Through Executive Sunday Systems Retreats, Executive Wednesday Systems Forums and Regional Executive Systems Programmes, leaders from business, academia, research institutions, professional bodies, community organisations and other sectors come together to examine persistent structural issues through systems thinking. These programmes generate income that supports the Institute’s operations while simultaneously building relationships that often develop into deeper collaborations.
As participants return to their organisations with new insight, many identify opportunities where STRLDi can provide further support. These opportunities may lead to systemic research, institutional diagnostics, Strategy Steward Labs, leadership development programmes, policy advisory assignments, and longer-term transformation initiatives. In this way, the Executive Systems Programmes become the beginning of an ongoing partnership rather than the conclusion of a training event.
Conferences, strategic dialogues, executive forums and public lectures further strengthen this pathway by creating spaces where leaders encounter new ideas, establish professional relationships and identify opportunities for collaborative work. These engagements also extend STRLDi’s visibility, strengthen its reputation, and contribute to a growing community committed to addressing persistent structural issues.
As the Institute matures, additional sources of recurring income will emerge through proposal development, commissioned research, development partner collaborations, Communities of Practice, publications, institutional memberships, and other strategic initiatives aligned with STRLDi’s mission.
This diversified approach reduces dependence on any single source of income while enabling the Institute to invest continually in its people, research, digital knowledge platforms and regional growth.
The objective is therefore not simply to generate revenue. It is to build an institution capable of serving society over many decades through a balanced combination of learning, partnership, research, and professional practice.
13. Institutional Revenue Pathway
The Strategic Partnerships & Growth Pillar develops opportunities through a deliberate progression:
Strategic Partnerships & Growth serves as the outward-facing relationship system of STRLDi.
Each office stewards a distinct community of relationships while remaining connected through a shared institutional purpose. Government engagement informs research priorities. Development partners enable programme implementation. Professional bodies strengthen learning communities. Universities enrich research. Communities contribute lived experience. Conferences stimulate dialogue. Membership sustains long-term engagement. Public communication extends learning beyond institutional boundaries.
Together, these relationships generate opportunities that flow naturally into the Client Solutions & Delivery Pillar, where they become research assignments, leadership programmes, Strategy Steward Labs and policy advisory engagements. As these engagements conclude, the knowledge and relationships they produce return to strengthen the partnership ecosystem, creating a continuous cycle of learning, collaboration and institutional growth.
15. Key Result Areas
The Strategic Partnerships & Growth Pillar is responsible for expanding STRLDi’s institutional relationships, strengthening its reputation and generating opportunities that advance the Institute’s mission. Success is measured not simply by the number of engagements undertaken, but by the quality of relationships established, the knowledge generated and the long-term partnerships that emerge.
The Pillar is guided by the following Key Result Areas.
1. Institutional Relationship Development
Develop and steward enduring relationships with leaders and institutions across government, business, academia, professional bodies, communities, development partners and regional organisations.
Performance Indicators
Number of strategic partnerships established.
Number of active institutional relationships.
Number of Memoranda of Understanding (MOUs) or collaboration agreements concluded.
Number of repeat engagements with existing partners.
Partner satisfaction and relationship quality.
2. Executive Engagement & Leadership Learning
Convene high-quality Executive Systems Programmes that strengthen leadership capability and expand STRLDi’s learning community.
Performance Indicators
Number of Executive Sunday Systems Retreats delivered.
Number of Executive Wednesday Systems Forums delivered.
Number of Regional Executive Systems Programmes conducted.
Total participant enrolment.
Participant satisfaction and programme evaluation.
Create trusted spaces where leaders collectively examine persistent structural issues and identify opportunities for collaborative action.
Performance Indicators
Number of conferences convened.
Number of executive dialogues facilitated.
Number of sector forums conducted.
Number of participating organisations.
Number of cross-sector collaborations initiated.
4. Opportunity Development
Transform relationships into opportunities that contribute to STRLDi’s research, leadership development and institutional practice.
Performance Indicators
Number of research opportunities identified.
Number of consultancy enquiries generated.
Number of proposals submitted.
Proposal success rate.
Value of consultancy opportunities secured.
5. Strategic Partnerships & Resource Mobilisation
Strengthen the Institute’s long-term sustainability through strategic collaboration and resource mobilisation.
Performance Indicators
Number of development partner engagements.
Number of collaborative research initiatives.
Number of jointly funded projects.
Value of external funding secured.
Number of regional and international partnerships established.
6. Knowledge & Public Engagement
Strengthen public understanding of persistent structural issues while increasing the visibility and credibility of STRLDi.
Performance Indicators
Number of publications produced.
Research papers and policy briefs released.
Public lectures and webinars conducted.
Media engagements.
Growth in website and digital platform reach.
Growth in professional networks and online engagement.
7. Institutional Growth & Sustainability
Generate the opportunities and resources required to strengthen STRLDi’s long-term institutional capability.
Performance Indicators
Revenue generated through Executive Systems Programmes.
Revenue generated through conferences and executive dialogues.
Revenue generated through consultancy and advisory engagements originating from Pillar III.
Percentage of recurring institutional partnerships.
Contribution of Pillar III to STRLDi’s annual operating budget.
8. Organisational Learning
Ensure that every engagement contributes to the Institute’s growing knowledge base and strengthens future practice.
Performance Indicators
Lessons learned are documented following major engagements.
Partnership reflections completed.
New methodologies developed.
Case studies published.
Improvements incorporated into future programmes.
The success of the Strategic Partnerships & Growth Pillar is ultimately measured by more than activity. It is reflected in the Institute’s growing ability to convene leaders, foster trusted relationships, generate meaningful opportunities and create enduring partnerships that strengthen research, leadership development and institutional transformation. As these capabilities mature, they contribute directly to STRLDi’s reputation, sustainability and capacity to serve Botswana, Southern Africa and the wider international community for many years to come.
16. Closing Reflection
Institutions are ultimately remembered not for the number of relationships they establish, but for the value those relationships create over time.
At STRLDi, partnerships are viewed as a form of institutional stewardship. Every conversation is an opportunity to learn. Every relationship is an opportunity to deepen understanding. Every collaboration is an opportunity to strengthen the collective capacity of leaders and institutions to respond to persistent structural issues.
The Strategic Partnerships & Growth Pillar exists to cultivate these relationships with care, integrity and purpose. It brings together leaders from business, academia, research, professional bodies, communities and development organisations, creating spaces where knowledge is shared, trust is built and new possibilities emerge through collective inquiry.
As these relationships mature, they become pathways for systemic research, leadership development, Strategy Steward Labs and long-term institutional partnerships. In turn, the knowledge generated through these engagements continually strengthens the Institute itself, enabling STRLDi to expand its contribution to Botswana, Southern Africa and the wider international community.
In this way, partnership becomes more than collaboration. It becomes the means through which learning travels across institutions, leadership capability grows, and societies strengthen their capacity to understand and address the persistent structural issues that shape their future.
Relationships create understanding. Understanding enables coordinated action. Coordinated action creates lasting transformation. It is this progression that lies at the heart of the Strategic Partnerships & Growth Pillar and continues to guide STRLDi’s commitment to building stronger institutions, more capable leaders and more resilient societies.
This page outlines STRLDi’s professional programmes, consultancy services and engagement framework, including Executive Systems Programmes, systemic research, leadership development, Strategy Steward Labs and long-term institutional partnerships, together with the Institute’s professional fee structure.
The work of STRLDi is organised through three institutional pillars, each carrying a distinct responsibility while contributing to one integrated learning institution. Together they ensure that STRLDi continually strengthens its capacity to understand persistent issues, develop leaders, build partnerships and steward long-term transformation.
At this stage of the Institute’s development, several leaders carry responsibilities across more than one pillar. This reflects STRLDi’s deliberate approach to institution building, where leadership grows alongside organisational capability. As the Institute expands, these responsibilities will progressively mature into dedicated offices and specialist appointments.
PILLAR I
Leadership & Institutional Stewardship
Purpose
To provide strategic direction, institutional governance, organisational learning and operational stewardship, ensuring that STRLDi remains a disciplined learning institution capable of sustaining its mission over generations.
Executive Director
Current Steward:Ms Sheila Damodaran
Provides overall leadership of the Institute and stewards its vision, philosophy, research agenda, strategic direction and institutional development. The Executive Director ensures coherence across all three institutional pillars and represents STRLDi nationally, regionally and internationally.
Advisory Council
Status: To be constituted
Provides independent strategic advice and institutional guidance to the Executive Director. The Council strengthens long-term thinking, institutional integrity and strategic positioning while preserving STRLDi’s purpose and values.
Office of Institutional Learning & Reflection
Current Steward:Rea
Serves as the organisational learning engine of STRLDi. The Office observes, documents and reflects upon the Institute’s work, ensuring that every engagement contributes to institutional knowledge and continuous improvement.
The Office also stewards the Five Institutional Stewardship Platforms:
Knowledge Stewardship
Learning Stewardship
Partnership Stewardship
Innovation Stewardship
Systems Stewardship
Executive Secretariat
Current Steward:Rea
Coordinates executive governance by preparing agendas, recording decisions, monitoring implementation of action items and maintaining institutional records.
The Secretariat ensures that organisational commitments are translated into disciplined action while preserving continuity across the Institute.
Corporate Operations & Services
Future Office
Responsible for:
Human Resources
Finance
Administration
Procurement
Information Technology
Legal & Institutional Protection
Governance Support
This office provides the operational foundation upon which every other pillar depends.
PILLAR II
Client Solutions & Delivery
Purpose
To help governments, organisations and communities understand persistent issues, strengthen leadership capability, co-create transformation strategies and build lasting institutional capacity.
Research & Systems Diagnostics
Current Steward:Nancy
Leads the Institute’s research agenda through systemic inquiry, behavioural analysis, policy research and organisational diagnostics.
Responsible for:
National and regional research
Systems diagnostics
Publications
Behaviour Over Time analysis
System archetype development
Research partnerships
Leadership Development
Current Steward:Bernice
Designs and delivers learning programmes that strengthen leaders’ capacity to understand complexity, facilitate collaboration and steward long-term transformation.
Responsible for:
Executive programmes
Learning Organisation programmes
Facilitator development
Curriculum design
Leadership capability
Strategy Steward Labs
Current Steward:Ms Sheila Damodaran
Facilitates collaborative laboratories where governments, institutions and communities jointly translate systemic understanding into coordinated implementation strategies.
Responsible for:
Strategy Labs
Cross-sector facilitation
Executive dialogue
Shared vision development
Strategy stewardship
Monitoring, Evaluation & Learning (MEL)
Future Office
Ensures that implementation generates measurable learning and continual improvement.
Responsible for:
Monitoring
Evaluation
Learning reviews
Impact assessment
Continuous improvement
Digital Knowledge Platform
Current Steward:Monty
Develops and manages STRLDi’s digital knowledge infrastructure.
Responsible for:
Knowledge repositories
Digital publications
AI-enabled knowledge systems
Research archives
Institutional memory
Website development
Monty also supports Nancy in strengthening the Institute’s long-term research capability.
Office of Policy, Strategy & National Transformation
Future Office
Transforms research findings into practical policy advice, institutional reform programmes and national transformation strategies.
Responsible for:
Policy advisory
Strategy development
National planning support
Institutional reform
Executive advisory
Office of International Programmes
Future Office
Coordinates STRLDi’s work across Africa and internationally.
Responsible for:
Regional programmes
International partnerships
Cross-country learning
Programme coordination
Global institutional collaboration
PILLAR III
Strategic Partnerships & Growth
Purpose
To build trusted relationships, mobilise resources and cultivate the institutional ecosystem through which STRLDi’s work grows in reach, relevance and long-term impact.
Government Relations & Strategic Communications
Current Steward:Brunoh
Leads engagement with:
National Government
Ministries
Public Service Leadership
Government Agencies
National Planning Institutions
Also coordinates public communications, media engagement and strategic messaging.
Economic Partnerships & Development Cooperation
Current Steward:Mr Tema
Develops strategic relationships with:
Private Sector
Development Partners
International Agencies
Investors
Philanthropic Organisations
Also leads proposal development and resource mobilisation.
Institutional & Professional Partnerships
Current Steward:Mabua
Builds relationships with:
Parastatals
Professional Bodies
Industry Associations
Statutory Organisations
Strengthens professional collaboration and institutional learning.
Community, Knowledge & Regional Partnerships
Current Steward:Coach
Leads engagement with:
Local Government
Dikgosi and Traditional Leadership
Universities
Research Institutions
Civil Society
SADC and Regional Organisations
Coach also oversees the development of regional Communities of Practice and cross-border learning initiatives.
Proposal Development & Resource Mobilisation
Current Steward:Mr Tema(until a dedicated office is established)
Coordinates:
Expressions of Interest
Grant proposals
Consultancy submissions
Funding applications
Strategic investment opportunities
Membership Office
Future Office
Develops and stewards the STRLDi learning community through:
Individual Members
Institutional Members
Fellows
Associates
Alumni
Friends of STRLDi
The Membership Office will become a significant contributor to the Institute’s long-term sustainability and recurring revenue.
Communities of Practice (CoPs)
Current Coordination:Coach
Supports the development of thematic learning communities where practitioners continue collaborating beyond individual projects.
Communities of Practice strengthen peer learning, innovation and professional exchange across sectors.
Led collaboratively across the partnership team, these platforms bring together leaders from government, business, academia and civil society to explore persistent issues and co-create new possibilities for transformation.
Knowledge & Public Engagement
Current Coordination:Brunoh, with support from Monty
Responsible for ensuring that STRLDi’s knowledge reaches wider audiences through:
Publications
Media engagement
Website
Podcasts
Blogs
Social media
Public lectures
Executive briefings
Leadership Development Pathway
STRLDi is intentionally developing future institutional leaders.
Current stewardship arrangements reflect both present responsibilities and future organisational growth.
Current Steward
Current Role
Long-Term Development Pathway
Ms Sheila Damodaran
Executive Director
Institutional Steward and Founder
Rea
Office of Institutional Learning & Reflection & Executive Secretariat
Transition to Leadership Development, supporting Bernice while continuing to steward institutional learning
Nancy
Research & Systems Diagnostics
Director of Research
Bernice
Leadership Development
Director of Leadership Development
Monty
Digital Knowledge Platform
Director of Digital Knowledge & Research Systems, supporting Nancy and leading the Digital Knowledge Platform
Brunoh
Government Relations & Strategic Communications
Director of Government Relations & Public Engagement
Mr Tema
Economic Partnerships & Development Cooperation
Director of Strategic Partnerships & Resource Mobilisation
Mabua
Institutional & Professional Partnerships
Director of Institutional Partnerships
Coach
Community, Knowledge & Regional Partnerships
Director of Regional Partnerships, Communities of Practice and SADC Engagement
Building an Institution Through Stewardship
The roles presented above represent more than a distribution of responsibilities. They reflect STRLDi’s philosophy that institutions are built through stewardship, disciplined learning and shared purpose. As the Institute grows, today’s stewards will mentor future leaders, new offices will emerge and additional expertise will be incorporated. The architecture is therefore designed not merely to support the work of today, but to enable STRLDi to remain a resilient learning institution serving Botswana, Southern Africa and the wider international community for generations to come.
The Leadership & Institutional Stewardship Pillar exists to ensure that STRLDi remains a disciplined learning institution—one that is strategically guided, professionally managed, financially sustainable and continually strengthened through reflection and learning.
Unlike conventional organisations where administration exists primarily to support operations, this pillar recognises that the Institute itself is one of STRLDi’s most important subjects of study. How decisions are made, how knowledge is captured, how people learn together and how institutional capability grows are all treated as matters of deliberate inquiry.
The pillar therefore carries responsibility not only for governance and organisational management, but also for cultivating the culture, systems and disciplines that allow STRLDi to fulfil its mission over generations.
Its work ensures that the Institute remains coherent in purpose, disciplined in practice and resilient in the face of change.
Stewardship Responsibilities
Leadership & Institutional Stewardship is responsible for:
Providing strategic direction for the Institute.
Safeguarding the institutional vision, values and purpose.
Strengthening organisational capability through continuous learning.
Ensuring sound governance and accountability.
Building organisational systems and operational excellence.
Stewarding financial sustainability and institutional resources.
Protecting the Institute’s intellectual property, reputation and legal integrity.
Cultivating an organisational culture grounded in reflection, learning and innovation.
Institutional Structure
The pillar is organised through five mutually reinforcing offices, each contributing to the long-term health and development of the Institute.
1. Executive Director
Current Steward: Ms Sheila Damodaran
Purpose
The Executive Director provides the overall stewardship of STRLDi, ensuring that every aspect of the Institute remains aligned with its founding purpose and long-term mission.
The role extends beyond executive management. It is responsible for integrating research, leadership, partnerships and institutional learning into one coherent organisational system capable of contributing to national and regional transformation.
The Executive Director serves as the principal custodian of STRLDi’s philosophy, institutional direction and external representation.
Key Responsibilities
Define and steward the Institute’s long-term vision.
Provide executive leadership across all three institutional pillars.
Direct research priorities and strategic initiatives.
Build relationships with governments, development partners, universities and industry leaders.
Lead institutional innovation and organisational development.
Approve major programmes, partnerships and investments.
Represent STRLDi nationally, regionally and internationally.
Ensure the Institute remains faithful to its mission and values.
Key Result Areas
Strategic leadership.
Institutional growth.
Research excellence.
Partnership development.
Organisational sustainability.
National and international reputation.
2. Advisory Council
Status: To be constituted.
Purpose
The Advisory Council exists to strengthen the Institute through independent wisdom, strategic guidance and constructive reflection.
It does not manage STRLDi. Rather, it provides thoughtful counsel to the Executive Director, helping the Institute maintain long-term perspective while remaining responsive to emerging opportunities and challenges.
The Council also serves as a bridge between STRLDi and the wider community of national leaders, researchers, practitioners and development partners.
Key Responsibilities
Provide strategic advice to the Executive Director.
Review institutional priorities and progress.
Offer independent perspectives on emerging issues.
Strengthen organisational credibility.
Introduce strategic opportunities and partnerships.
Encourage long-term institutional thinking.
Key Result Areas
Strategic guidance.
Institutional integrity.
Leadership support.
External credibility.
Long-term organisational resilience.
3. Office of Institutional Learning & Reflection
Current Steward: Rea
Purpose
This office represents one of STRLDi’s defining institutional innovations.
Its responsibility is to ensure that learning is never left to chance.
Every project, meeting, workshop, partnership and research assignment generates experience. Unless that experience is intentionally examined, documented and shared, valuable insight is easily lost.
The Office of Institutional Learning & Reflection ensures that individual experiences become collective knowledge and that collective knowledge becomes enduring institutional capability.
It also serves as the steward of the Institute’s Five Institutional Stewardship Platforms, embedding the disciplines of knowledge, learning, partnership, innovation and systems thinking across all areas of STRLDi.
Key Responsibilities
Facilitate organisational reflection.
Capture institutional learning.
Identify recurring organisational patterns.
Produce learning reviews and institutional insights.
Steward the Five Institutional Stewardship Platforms.
Promote continuous organisational improvement.
Build institutional memory.
Support knowledge sharing across all pillars.
Key Result Areas
Organisational learning.
Institutional memory.
Continuous improvement.
Knowledge integration.
Strengthened organisational capability.
4. Executive Secretariat
Current Steward: Rea
Purpose
The Executive Secretariat provides the coordination discipline that enables effective institutional leadership.
By ensuring that meetings are purposeful, decisions are documented and commitments are followed through, the Secretariat creates the organisational coherence required for a learning institution to function effectively.
Its work extends beyond administration. It enables organisational rhythm, accountability and continuity.
Key Responsibilities
Coordinate executive meetings.
Prepare agendas and documentation.
Record decisions and institutional commitments.
Monitor action plans.
Coordinate Executive Director correspondence.
Support Advisory Council operations.
Maintain institutional records.
Key Result Areas
Governance effectiveness.
Executive coordination.
Decision tracking.
Organisational discipline.
Institutional continuity.
5. Corporate Operations & Services
Future Appointment
Purpose
Corporate Operations & Services provides the operational foundation upon which STRLDi’s mission is sustained.
Its role is to ensure that organisational systems, financial resources, people, technology and administrative processes function efficiently, ethically and professionally.
Rather than being viewed as a support function alone, Corporate Operations is recognised as an essential contributor to institutional resilience and long-term sustainability.
Core Functions
Human Resources
Building organisational capability through recruitment, performance development, wellbeing and professional growth.
Finance & Financial Stewardship
Managing budgeting, financial reporting, revenue, investments and long-term financial sustainability.
Administration
Providing administrative systems, facilities management and operational coordination.
Procurement
Ensuring transparent, efficient and accountable acquisition of goods and services.
Information & Digital Services
Supporting information technology, cybersecurity, digital platforms and organisational systems.
Leadership & Institutional Stewardship is not separate from the Institute’s work; it is the mechanism through which that work remains coherent and sustainable.
The Executive Director provides strategic direction.
The Advisory Council strengthens long-term institutional thinking.
The Office of Institutional Learning & Reflection ensures that knowledge generated through every engagement contributes to organisational capability.
The Executive Secretariat translates decisions into coordinated action.
Corporate Operations & Services provides the systems, resources and governance that enable the Institute to function effectively.
Together, these offices create the conditions under which STRLDi can continually increase its capacity to understand persistent issues, develop leaders, build partnerships and contribute meaningfully to national and regional transformation.
Key Result Areas of the Pillar
The Leadership & Institutional Stewardship Pillar will be considered successful when it consistently:
Stewards STRLDi’s vision, values and institutional purpose.
Builds a financially sustainable and professionally managed Institute.
Strengthens organisational capability through disciplined learning and reflection.
Maintains effective governance, accountability and ethical practice.
Protects the Institute’s knowledge, reputation and intellectual assets.
Develops organisational systems that enable excellence across all three pillars.
Ensures that STRLDi remains an enduring learning institution capable of serving future generations.
Building a Learning Institution for National and Regional Transformation
Introduction
The Systems Thinking Research & Leadership Development Institute (STRLDi) was established from a simple but profound observation: persistent issues do not disappear simply because more effort is applied to them.
Around the world, governments, businesses and communities continue to invest significant resources in addressing unemployment, food insecurity, institutional underperformance, environmental degradation and other complex challenges. Yet many of these issues continue to reappear, often in different forms, despite successive policy reforms, organisational restructuring and increased investment.
The question, therefore, is not whether people care enough or work hard enough.
The question is whether we are working with an adequate understanding of the systems producing these outcomes.
STRLDi exists to help leaders and institutions answer that question.
Unlike conventional consulting firms that begin with recommendations, or academic institutions that often conclude with research, STRLDi was established to accompany institutions throughout the complete journey of systemic transformation—from understanding persistent issues, to building leadership capability, to coordinating collective action, and ultimately to strengthening the capacity of societies to learn and renew themselves.
This philosophy demanded a different kind of institution.
Rather than organising itself around traditional departments, STRLDi has been intentionally designed as a learning institution, where research, leadership development, partnerships and institutional learning continually reinforce one another. Every engagement contributes not only to the work of a client, but also to the continuing growth of the Institute itself.
The architecture presented here describes how STRLDi fulfils that purpose.
An Institution Designed to Learn
Many organisations are designed primarily to deliver services.
Others are designed to administer programmes.
STRLDi has been designed to continuously increase its capacity to understand, learn, and contribute to systemic transformation.
Research informs leadership development.
Leadership development strengthens Strategy Steward Labs.
Knowledge is continuously captured, reflected upon, and shared.
This creates reinforcing cycles through which the Institute becomes progressively more capable of serving governments, organisations and communities over time.
The architecture therefore reflects not merely an organisational structure, but a philosophy of institutional learning.
The Three Institutional Pillars
The work of STRLDi is organised through three mutually reinforcing institutional pillars.
Each pillar fulfils a distinct responsibility while remaining deeply interconnected with the others.
Together they enable the Institute to generate knowledge, develop leadership capability, build strategic relationships and sustain its long-term contribution to society.
Pillar I
Leadership & Institutional Stewardship
Every enduring institution requires stewardship.
Leadership & Institutional Stewardship exists to safeguard the Institute’s purpose, strengthen its organisational capability and ensure that STRLDi remains a disciplined learning institution throughout its development.
This pillar provides executive leadership, institutional governance, organisational development, financial stewardship and operational excellence. More importantly, it cultivates the culture through which reflection, learning and continuous improvement become everyday organisational practice.
Working alongside executive leadership is the Advisory Council, whose role is not to manage the Institute but to provide wisdom, independent perspective and constructive challenge as STRLDi continues to evolve.
Within this pillar also sits the Office of Institutional Learning & Reflection, a distinctive feature of STRLDi’s architecture. Rather than limiting organisational learning to project evaluations or annual reviews, this office continually observes the Institute itself—capturing lessons, identifying emerging patterns and ensuring that experience becomes institutional capability rather than remaining individual knowledge.
Supporting these functions is the Executive Secretariat, responsible for coordinating executive governance, preparing meetings, recording decisions and ensuring that organisational commitments are translated into disciplined action.
The operational foundation of the Institute is provided through Corporate Operations & Services, integrating finance, human resources, administration, information technology, procurement and organisational support into one coherent service that enables every other part of the Institute to function effectively.
Leadership & Institutional Stewardship ensures that STRLDi not only delivers quality work, but continually develops the organisational capability required to sustain that work for generations to come.
Pillar II
Client Solutions & Delivery
Client Solutions & Delivery represents the point at which STRLDi’s purpose becomes tangible.
It is through this pillar that governments, institutions and organisations engage the Institute to better understand persistent issues, strengthen leadership capability and develop coordinated responses to systemic challenges.
Every engagement begins with Research & Systems Diagnostics, where issues are explored through Behaviour Over Time analysis, systems thinking, systemic archetypes and STRLDi’s evolving methodologies for understanding persistence.
Research provides the foundation upon which meaningful intervention becomes possible.
Research is followed by Leadership Development, where leaders develop the disciplines required to think systemically, challenge assumptions, build shared understanding and cultivate learning within their own institutions.
Understanding alone, however, is insufficient.
The third component, Strategy Steward Labs, brings together leaders from across sectors to jointly translate systemic understanding into coordinated implementation. Rather than facilitating isolated workshops, these laboratories enable diverse actors to work together on the systems they collectively influence.
The Institute’s work is continually strengthened through Monitoring, Evaluation & Learning, ensuring that implementation generates new insight and that future engagements benefit from the lessons of previous work.
Supporting all of these activities is the Digital Knowledge Platform, which preserves research, methodologies, publications and institutional learning as a living repository available to future generations of practitioners and researchers.
As STRLDi continues to mature, this pillar will expand through the establishment of the Office of Policy, Strategy & National Transformation, translating research and implementation learning into national policy frameworks, strategic advisory services and long-term institutional transformation programmes.
Future international delivery will be coordinated through the Office of International Programmes, enabling the Institute to serve governments and institutions across Africa and beyond while remaining grounded in the same disciplined approach to systemic inquiry and learning.
Together, these capabilities transform understanding into leadership, leadership into coordinated action, and coordinated action into enduring institutional learning.
Pillar III
Strategic Partnerships & Growth
Persistent issues do not exist within organisational boundaries.
Neither should the relationships required to address them.
Strategic Partnerships & Growth exists to cultivate the institutional ecosystem through which STRLDi’s mission can flourish.
Its work extends far beyond conventional marketing or business development. It builds trusted relationships with governments, private sector leaders, development partners, public enterprises, universities, professional bodies, traditional leadership and regional institutions. These relationships become the foundation upon which research, leadership development and Strategy Steward Labs are commissioned and sustained.
Within this pillar, specialised partnership portfolios ensure that every major constituency receives dedicated stewardship while remaining connected to the broader mission of the Institute.
The pillar also coordinates proposal development and resource mobilisation, ensuring that opportunities are translated into funded programmes and long-term institutional partnerships.
Through Communities of Practice, professionals working across similar fields continue learning together beyond individual projects, creating enduring networks of inquiry and practice.
The Membership Office, to be established as the Institute grows, will cultivate long-term relationships with practitioners, institutions, fellows and supporters who wish to contribute to STRLDi’s ongoing development and learning community.
National, regional and international conferences, seminars and strategic dialogues provide opportunities for collective reflection, cross-sector learning and the emergence of new partnerships.
Knowledge generated by the Institute is shared through Knowledge & Public Engagement, ensuring that research, publications and institutional learning contribute to wider public understanding of persistent issues and systemic transformation.
Strategic Partnerships & Growth therefore builds more than relationships.
It builds the trust, reputation and institutional capital through which STRLDi’s work continually expands in influence, relevance and impact.
The Five Institutional Stewardship Platforms
Running across all three pillars are five enduring institutional disciplines.
These are not departments.
They are the principles through which every part of STRLDi operates and learns.
Knowledge Stewardship ensures that every project, publication, dialogue and experience contributes to the Institute’s growing body of knowledge.
Learning Stewardship embeds disciplined reflection into everyday practice, encouraging individuals and teams to continually strengthen their understanding and capability.
Partnership Stewardship recognises that relationships are among the Institute’s most valuable assets and that every member of STRLDi contributes to building trust and collaboration.
Innovation Stewardship encourages thoughtful experimentation, methodological development and continuous improvement while remaining grounded in disciplined inquiry.
Systems Stewardship maintains the Institute’s unwavering attention on the larger systems within which organisations, communities and nations operate, ensuring that immediate activities remain aligned with long-term transformation.
These five stewardship platforms are coordinated through the Office of Institutional Learning & Reflection, helping the Institute continually strengthen its practice while remaining faithful to its founding purpose.
The STRLDi Commitment
Institutions shape societies.
The quality of those institutions depends not only on the knowledge they possess, but on their willingness to continue learning.
STRLDi has therefore been designed not simply to conduct research, deliver training or facilitate strategic dialogue.
It has been designed to become an institution that continually increases its own capacity to understand persistent issues, develop leaders, strengthen partnerships and contribute meaningfully to the transformation of nations and communities.
Its architecture reflects this commitment.
Its people give life to it.
Its work continually refines it.
And its purpose remains unchanged:
To help leaders, institutions and nations learn to see the systems they are part of—so that together they may build societies that are more resilient, more productive, more just and more capable of renewing themselves for generations to come.
Related Links:
Pillar I: The Leadership & Institutional Stewardship Pillar of STRLDi focuses on ensuring the Institute’s long-term sustainability and growth through strategic direction, effective governance, and continuous learning. It emphasizes stewardship alongside leadership, fostering an organizational culture that enhances capability and resilience to adapt to change, ultimately aiming for national and regional transformation. https://sheilasingapore.blog/2026/07/06/pillar-i/
Pillar 2: The purpose of Client Solutions & Delivery is to help governments, organisations, development partners and communities understand and respond effectively to persistent issues that continue to resist conventional approaches.
Many institutions invest significant financial, human and political resources in addressing national and organisational challenges. Yet despite these investments, many issues continue to recur, often becoming more deeply embedded over time. This persistence suggests that the difficulty lies not only in implementation, but in the way the problem itself is understood.
Pillar 3: The Strategic Partnerships & Growth Pillar exists to build, steward, and strengthen the relationships through which STRLDi fulfils its mission.
Persistent national and regional issues rarely exist within the boundaries of a single organisation, ministry or profession. They emerge through the interaction of many actors whose decisions, priorities, and actions continually influence one another. For this reason, meaningful transformation depends as much on the quality of relationships as on the quality of technical solutions.
STRLDi therefore views partnership development not as an activity undertaken after research is completed or programmes are designed. Partnership is itself a strategic capability. It enables diverse institutions to discover shared purpose, develop mutual trust and mobilise collective action around issues that no single organisation can address independently.
This pillar cultivates the institutional ecosystem within which STRLDi’s research, leadership development, and strategy stewardship can flourish. It identifies opportunities for collaboration, develops long-term institutional relationships, mobilises resources, and creates the conditions for the continual exchange of knowledge across sectors, disciplines and national boundaries. https://sheilasingapore.blog/2026/07/07/pillar-iii/
Institutional Roles: The work of STRLDi is organised through three institutional pillars, each carrying a distinct responsibility while contributing to one integrated learning institution. Together they ensure that STRLDi continually strengthens its capacity to understand persistent issues, develop leaders, build partnerships and steward long-term transformation.
At this stage of the Institute’s development, several leaders carry responsibilities across more than one pillar. This reflects STRLDi’s deliberate approach to institution building, where leadership grows alongside organisational capability. As the Institute expands, these responsibilities will progressively mature into dedicated offices and specialist appointments. https://sheilasingapore.blog/2026/07/07/the-strldi-institutional-roles/
Organising Management Knowledge by Purpose and Depth of Seeing
Ms Sheila Damodaran
Management literature contains thousands of tools, frameworks, methodologies, standards, and practices designed to help organisations perform, improve, govern, adapt, and grow. These tools are typically organised by professional discipline—finance, operations, strategy, quality, human resources, information technology, or project management. While useful for specialists, such classifications often make it difficult for leaders to understand how these tools contribute to the broader task of organisational learning and transformation.
At the same time, many organisations possess an impressive collection of management tools and yet continue to struggle with persistent issues that repeatedly return in different forms. They measure performance, monitor risk, improve quality, manage projects, control costs, and coordinate operations with increasing sophistication. The challenge is rarely a lack of tools. More often, it is a lack of clarity about what those tools help us see.
This framework takes a different approach. Instead of organising tools by profession, it organises them first by purpose and then by the depth of seeing they enable. The purpose categories reflect the primary work of organisations. Together, they describe the full journey of organisational life—from understanding reality, through action and adaptation, toward long-term renewal.
The Nine Purposes of Management
Level 1 – See
Every organisation must first develop the capacity to observe reality. Seeing includes monitoring performance, understanding conditions, recognising trends, identifying risks, and developing situational awareness. Without seeing, all other activities are based on assumption rather than evidence.
The central question is:
What is happening?
Level 2 – Develop People
Organisations achieve results through people. This level focuses on building capability, leadership, competence, judgement, and learning capacity. It includes recruitment, training, coaching, mentoring, and the cultivation of personal mastery.
The central question is:
Who are we becoming?
Level 3 – Align
Individual effort becomes organisational capability only when people move in a common direction. Alignment creates coherence between purpose, strategy, teams, and stakeholders. It transforms separate activities into collective action.
The central question is:
How do we move together?
Level 4 – Decide
Every organisation faces choices about priorities, investments, risks, trade-offs, and future direction. Decision-making determines where attention, resources, and energy will be focused.
The central question is:
What should we do?
Level 5 – Execute
Execution converts intentions into action. This includes project delivery, operational management, process execution, scheduling, coordination, and the day-to-day work of producing results.
The central question is:
How do we get things done?
Level 6 – Govern & Measure
Organisations must maintain accountability, stewardship, transparency, and control. Governance ensures that actions remain aligned with obligations, standards, responsibilities, and performance expectations.
The central question is:
Are we doing what we said we would do?
Level 7 – Improve
Improvement focuses on increasing effectiveness, efficiency, quality, reliability, and performance. It seeks to reduce waste, strengthen capability, and enhance outcomes through disciplined learning from experience.
The central question is:
How can we do this better?
Level 8 – Adapt
Conditions change. Markets shift. Technologies evolve. Societies transform. Adaptation enables organisations to respond to emerging realities while maintaining relevance and resilience.
The central question is:
What must change?
Level 9 – Renew
Renewal focuses on long-term viability. It concerns the organisation’s ability to regenerate leadership, knowledge, purpose, capability, and direction across time. Renewal ensures that today’s success does not become tomorrow’s limitation.
The central question is:
How do we remain capable of creating value into the future?
Depth of Learning
While the nine levels describe why a tool exists, a second dimension describes how deeply that tool helps us understand reality.
Drawing on the learning disciplines of The Fifth Discipline, tools can contribute to one or more of five levels of seeing:
Level
Question
Event
What happened?
Pattern
What keeps happening?
Structure
What archetypal causal structure is producing the pattern?
Mental Models
What assumptions and beliefs sustain the structure?
Vision
What future are we collectively trying to create?
Most management tools help organisations observe and manage events. Some help leaders recognise patterns over time. A much smaller number help reveal the archetypal structures that generate those patterns. Fewer still help surface mental models or cultivate shared vision.
The tables that follow organise management tools according to both dimensions: their organisational purpose and their depth of seeing.
Reading the Tables
The ticks indicate the primary depth of seeing naturally enabled by a tool. They do not imply that a tool cannot be used more deeply by a skilled practitioner. Rather, they indicate where the tool most naturally contributes to learning and action.
In this framework, Structure refers exclusively to archetypal causal structure—the reinforcing and balancing processes, delays, accumulations, and systemic dynamics that generate behaviour over time. It does not refer to organisational structures, reporting relationships, governance arrangements, methodologies, frameworks, or management systems.
This distinction is important because the framework is grounded in the learning disciplines of The Fifth Discipline. Its purpose is not merely to organise management knowledge, but to help leaders understand how different tools contribute to increasingly deeper levels of seeing, learning, and transformation.
Depth of Learning
because what distinguishes The Fifth Discipline is not seeing alone.
It is the organisation’s capacity to learn from what it sees. That subtle shift brings the framework even closer to Senge’s original intent.
LEVEL 1 — SEE
Domain
Tool
Event
Pattern
Structure
Mental Models
Vision
Finance
Balance Sheet
✓
Finance
Income Statement
✓
Finance
Cash Flow Trend
✓
Operations
KPI Dashboard
✓
Operations
Trend Analysis
✓
Quality
Control Charts
✓
Strategy
SWOT
✓
Strategy
PESTLE
✓
Systems Thinking
BOT Graphs
✓
✓
LEVEL 2 — DEVELOP PEOPLE
Domain
Tool
Event
Pattern
Structure
Mental Models
Vision
HR
Training Programmes
✓
HR
Competency Frameworks
✓
✓
Leadership
Coaching
✓
Leadership
Mentoring
✓
Learning
Reflective Practice
✓
Learning
Personal Mastery
✓
✓
Learning
Dialogue
✓
✓
LEVEL 3 — ALIGN
Domain
Tool
Event
Pattern
Structure
Mental Models
Vision
Strategy
Balanced Scorecard
✓
✓
Strategy
Strategy Maps
✓
✓
Leadership
Shared Vision
✓
✓
Leadership
Vision Deployment
✓
Learning
Team Learning
✓
✓
Stakeholder
Stakeholder Mapping
✓
✓
LEVEL 4 — DECIDE
Domain
Tool
Event
Pattern
Structure
Mental Models
Vision
Strategy
Scenario Planning
✓
✓
✓
Finance
Cost-Benefit Analysis
✓
Risk
Risk Assessment
✓
✓
Systems Thinking
System Archetypes
✓
Systems Thinking
Onion Model
✓
✓
✓
Systems Thinking
CLDs
✓
LEVEL 5 — EXECUTE
Domain
Tool
Event
Pattern
Structure
Mental Models
Vision
Projects
PMBOK
✓
Projects
Gantt Charts
✓
Projects
RAID Logs
✓
Operations
SOPs
✓
Operations
Kanban
✓
✓
Projects
Agile
✓
✓
Operations
Scheduling Systems
✓
LEVEL 6 — GOVERN & MEASURE
Domain
Tool
Event
Pattern
Structure
Mental Models
Vision
Finance
Budgeting
✓
✓
Finance
Forecasting
✓
Risk
Risk Register
✓
Risk
Audit
✓
Governance
Compliance Systems
✓
Governance
Internal Controls
✓
Governance
Board Reporting
✓
✓
LEVEL 7 — IMPROVE
Domain
Tool
Event
Pattern
Structure
Mental Models
Vision
Quality
Six Sigma
✓
✓
Quality
DMAIC
✓
✓
Operations
Lean
✓
✓
Operations
Kaizen
✓
✓
✓
Learning
After Action Reviews
✓
✓
✓
Quality
Root Cause Analysis
✓
✓
LEVEL 8 — ADAPT
Domain
Tool
Event
Pattern
Structure
Mental Models
Vision
Change
ADKAR
✓
✓
✓
Change
Kotter
✓
✓
✓
Strategy
Strategic Foresight
✓
✓
Systems Thinking
Leverage Point Analysis
✓
✓
Leadership
Adaptive Leadership
✓
✓
✓
✓
LEVEL 9 — RENEW
Domain
Tool
Event
Pattern
Structure
Mental Models
Vision
Learning
Learning Organisation
✓
✓
✓
✓
HR
Succession Planning
✓
✓
✓
Knowledge
Communities of Practice
✓
✓
✓
Knowledge
Knowledge Management
✓
✓
✓
Leadership
Stewardship
✓
✓
Systems Thinking
Fifth Discipline
✓
✓
✓
✓
Immediate observation
When classified this way:
Most traditional management tools cluster in Event.
A smaller number reach Pattern.
Very few genuinely reach Structure.
Mental Models is dominated by Fifth Discipline disciplines rather than conventional management tools.
Vision is populated mostly by leadership and strategy tools.
This is probably the first clue that the table is not merely cataloguing management methods. It is revealing where management as a field has historically invested its attention.
And that, in turn, may explain why organisations become highly capable of managing events while remaining relatively weak at understanding the archetypal structures that generate them.
Every organization believes its problem is capacity.
There are never enough hands, hours, or funds.
And yet, each time new resources arrive, the shortage returns — louder than before.
What if “not enough manpower” is not a fact but a structure?
A loop that feeds on how we define effort, competence, and worth.
This case explores the fatigue of systems that mistake busyness for strength.
It asks: when we plead for more resources, are we revealing scarcity — or creating it?
📖 BEFORE YOU READ
Every manager has heard it: “We just don’t have enough people.”
And most respond with the only answer they know — request another post, extend another contract, add another unit.
For a moment, the pressure eases.
Then, almost predictably, the system returns to the same refrain: not enough.
This second study in the STRLDi System Archetype Compendium turns the spotlight inward. It invites leaders to look not at the size of their workforce, but at the structure of their attention.
Because sometimes, what drains capacity is not the number of people working, but how the organisation thinks about work itself.
1 Context and Origins
The complaint of not enough manpower surfaced repeatedly across divisions.
Officers spoke of being stretched thin; supervisors lamented high turnover; HR cited budget ceilings.
Yet, even after multiple recruitment rounds, the pattern refused to change.
The department was caught in a cycle:
hire more → overwork the keen → lose the best → rehire → repeat. The harder it tried to fix the shortage, the deeper the shortage seemed to run.
STRLDi’s analysis revealed a classic Fixes That Fail loop, with an inner twist — a shift from procedural competence (detailed complexity) to systemic blindness (dynamic complexity).
2 Behaviour Over Time
Law #1 – Today’s Problems Come from Yesterday’s Solutions
Each new recruitment was celebrated as relief.
But soon, workloads grew to match expanded capacity.
A nation of institutions trapped in detailed complexity will always feel under-staffed.
The cure is not mass hiring, but systemic sight.
When leaders learn to see patterns, they release both human energy and national capacity.
Manpower turns into mind-power.
The true resource multiplies by awareness.
Vision of the Future Reality: A workplace where capacity is consciousness — and where the ability to see the system is the new definition of strength.
Fixes-That-Fail (Variant)
LEFT-HAND PAGE – Analysis & Reflection
Header
When busyness becomes a badge of competence, the organisation hires itself into exhaustion.
Top Section – Leadership Mirror
A full-width grey box containing the mirror paragraph. A small inset quote in italics:
“Every system is perfectly designed to get the results it gets.”
Preamble – Before You Read
Placed below the mirror, using a light background tone. Accompanied by a small inset BOT diagram (Before Leverage) in the top-right corner.
Main Narrative Body
Two columns. The left column opens with:
1–5: Context, Behaviour Over Time, Structure, Mental Models, Current Reality Vision. The right column continues with:
6–9: Leverage, Uncle’s Act, Behaviour After Leverage, Future Reality Vision.
A thin vertical line separates narrative from marginalia.
Margin Notes (right margin of both pages)
Small annotations in blue text boxes referencing the Laws of Dynamic Complexity as they appear:
#1 Today’s problems come from yesterday’s solutions
#7 Faster is slower
#8 Small changes produce big results
These act as navigational anchors for readers scanning the page.
Footer – Coda
A final blue band carrying your signature line:
Vision of the Future Reality A workplace learns to become a place and opportunity where capacity is consciousness — and where the ability to see the system is the new definition of strength.
Based on the Vision Deployment Matrix™ created by Dr Daniel H. Kim, first published in The Systems Thinker, Vol. 6 No. 1 (1995). Framework adapted by STRLDi for applied national systems learning.
Every leader believes they are solving problems. Few notice that the problems are quietly solving them.
The more effort they invest, the deeper the pattern takes hold — until exhaustion feels like purpose and urgency feels like success.
The following case is not a critique of leadership but an invitation to see leadership at work inside the system itself.
Each time we react, correct, compensate, or protect, the structure records it — and teaches.
This is the leadership mirror: a place to see our reflexes reflected back as design. The lesson is never about who was right; it is about how the system learned from what we could not see.
Before You Read
Every bureaucracy has its rituals of rescue — the emergency meeting, the red-stamped file, the overtime marathon that proves loyalty.
For a moment, the room feels alive; the system seems responsive.
Then, just as surely, the backlog returns.
What you are about to read is not a story about slow officers or careless managers. It is the anatomy of a reflex — a national habit of equating busyness with value.
This first study in the STRLDi System Archetype Compendium opens with a pattern called Fixes That Fail.
It asks: What if the system’s greatest crisis is its own cure?
And it invites you to see that the smallest act of awareness can transform an enterprise, a ministry, or a nation.
The Urgent Files phenomenon emerged in an investigations department charged with handling public complaints.
Its purpose was straightforward: ensure that every reported case was reviewed, investigated, and closed within prescribed time limits.
Yet, over time, the department found itself in a perpetual state of crisis.
Every few weeks management would announce a backlog-clearing exercise.
Files were stamped URGENT in red, officers were redeployed, and working hours extended.
The public applauded the temporary responsiveness, but within months the backlog returned — heavier and more demoralising than before.
When STRLDi first studied the pattern, it seemed ordinary bureaucratic fatigue.
But plotting behaviour over time revealed the familiar oscillation of the Fixes That Fail archetype:
A quick corrective action delivers short-term relief yet creates longer-term pressure that demands the same fix again.
What looked like a process problem was in fact a systemic illusion — the office was working tirelessly to reproduce the very problem it was trying to solve.
2 The Behaviour Over Time
Law #1 Today’s Problems Come from Yesterday’s Solutions
The origin of each crisis lay in the previous “solution.”
Every time the department declared an urgent-file drive, officers diverted effort from current cases to old ones.
Those current files, now unattended, quietly aged into the next batch of urgents.
The fix created its own future workload.
Law #4 Cause and Effect Are Not Close in Time and Space
The delay between setting aside a file and seeing it resurface months later disguised causality.
Managers saw only the symptom — rising complaints — never connecting it to yesterday’s rescue campaign.
Because the effect appeared far from the original action, the loop stayed invisible.
Law #2 The Harder You Push, the Harder the System Pushes Back
Each urgent drive demanded overtime and exhaustion.
For a short while output spiked, morale rose, and the public seemed satisfied.
Then the system’s “push-back” arrived: new complaints, deeper fatigue, and declining quality.
The curve resembled an erratic heartbeat — a body kept alive by stress.
Law #7 Faster Is Slower
Speed became synonymous with virtue.
Supervisors equated motion with progress.
But the faster the office moved, the less it learned.
Files rushed through without closure; decisions required re-work; coordination failed.
The department had institutionalised adrenaline.
3 The Structure Beneath the Oscillation
The causal structure was deceptively simple:
Figure 1
Urgent files ↑ → swift action ↑ → attention on current files ↓ → quality of work ↓ → complainant dissatisfaction ↑ → urgent files ↑
A perfect balancing loop in form — but it balanced the wrong thing: the appearance of responsiveness rather than genuine throughput.
The balancing reflex masked a deeper reinforcing dynamic of fear and pressure.
As the unseen reinforcing loop gained strength, the human reflex to “restore balance” intensified — confirming the Law of Reflexive Balance later codified by STRLDi:
Except in biological homeostasis, every balancing loop in human systems is the reflex of an unseeing system attempting to counter its own reinforcing pattern.
4 The Ladders of Fear (Mental Models)
Three ladders of inference maintained the blindness:
Actor
Assumption
Behaviour
Hidden Fear
Supervisor
“Officers are lazy.”
Increases control and public visibility.
Fear of losing authority.
Officer
“Management notices only crisis.”
Waits for escalation to act.
Fear of invisibility and blame.
Complainant
“Government doesn’t care.”
Escalates or bypasses channels.
Fear of powerlessness.
Each ladder reinforced the others.
Separated by hierarchy, they never met to test their assumptions.
Law #11 — There is no blame — was the missing discipline: everyone defended their role; no one saw the system.
5 The Vision That Created the Current Reality
The department still served a vision forged decades earlier: “Efficiency means rapid response.”
It wanted both speed and quality at once — the contradiction captured in Law #9, you can have your cake and eat it too, but not at once.
Performance measures rewarded volume, not learning.
The structure behaved exactly as it was designed: to appear busy.
6 The Discovery of Leverage
During a review, one senior officer — trained by experience rather than formal education — noticed something small yet profound.
Whenever he deferred a case, he called the complainant to explain the delay and outline next steps.
Those calls, barely two minutes each, eliminated most follow-up complaints.
Files no longer escalated to urgent.
The simple human act re-closed the feedback loop that the system’s procedure had severed.
Here lay Law #8 in living form:
Small changes can produce big results — the areas of highest leverage are often the least obvious.
The cost of the intervention: zero.
The impact: systemic.
No technology, no reform bill, no consultant.
Just consciousness restored at the point of disconnection.
7 The Uncle’s Act (Healing in Motion)
A wise supervisor recognised the potential but avoided formalising it.
He praised the courtesy as “professionalism” and let it spread organically.
This was the Uncle’s Act — healing inserted gently into culture:
Healing Intent: Re-humanise the flow of work.
Gentle Insertion: Allow experienced officers to model the call.
Successor’s Gift: Embed it later as induction practice.
By keeping the structure unaware of its transformation, he boiled the frog without harm.
The balancing reflex quietly lost energy; the reinforcing loop of trust took over. Balance returned as rhythm, not resistance.
8 Behaviour After Leverage
At first the curve looked wrong — urgents dropped, throughput slowed, calm felt unnatural.
But over successive cycles, quality stabilised and morale rose.
The department was living Law #3 — behaviour grows better before it grows worse.
Short-term anxiety preceded long-term healing.
Within months, urgent-file drives disappeared from the vocabulary.
Officers began competing for consistency, not crisis.
The healing reinforcing loop (call → trust → fewer urgents → time → more calls) had taken root.
9 The Future Reality Vision
In the healed system, work flows continuously instead of spasmodically. The word “urgent” has lost its power because the system has learned to anticipate, not react. Supervisors manage rhythm, not crisis; officers manage trust, not panic; complainants experience transparency instead of silence.
The organisation’s purpose has evolved from efficiency to reliability — from fast to steady. Its identity is no longer built on rescue but on prevention.
This is a department that now embodies the nation’s future reality: a public service that leads not by control, but by coherence.
10 Supportive Mental Models of the Future Reality
Role
New Mental Model
Emergent Discipline
Supervisor
“Flow is the new efficiency.”
Systems Thinking — seeks patterns, not incidents.
Officer
“I create calm when I connect early.”
Personal Mastery — pride in steady contribution.
Complainant (Citizen)
“My government listens even when I’m silent.”
Building Shared Vision — trust as civic culture.
Fear has transmuted into confidence.
The belief in scarcity of time or manpower dissolves when feedback is immediate and human.
Each participant’s ladder of inference has shortened — fewer assumptions, more communication.
The walls between roles have turned into mirrors.
11 Events and Patterns in the Future System
In the healed state, the Laws of Dynamic Complexity are respected, not violated:
Law
Expression in the Future System
#1
Solutions are tested for side effects before implementation.
#2
Pressure points are anticipated — no need to overpush.
#3
Temporary discomfort is accepted as part of real learning.
#4
Feedback cycles are monitored continuously — cause and effect stay linked.
#5
Easy fixes are replaced by small, deliberate learning experiments.
#7
Pace matches capacity; speed is calibrated, not worshipped.
#8
Minor, human interventions are designed into process flow.
#11
Blame has no oxygen; the conversation focuses on structure.
The pattern now resembles a gentle rise and plateau, not a spike and crash.
It behaves like a breathing organism — self-correcting, aware of its boundaries.
The loop has evolved from Fixes That Fail to what STRLDi names a Learning Reinforcement Loop — trust reproducing trust.
12 The Future Reality
The new system functioned without drama.
Public trust steadied; workload distributed evenly; officers regained pride.
The earlier balancing loop that exhausted the system had given way to a reinforcing loop that regenerated it.
Calm was now the indicator of competence.
The “urgent” label, once a symbol of heroism, became a relic of blindness.
13 The Cost of Awareness vs. the Cost of Ignorance
A comparison later conducted by STRLDi estimated that a full business-process re-engineering of the department — consultants, workshops, IT systems — would have cost tens of millions.
The systemic leverage that achieved the same outcome cost nothing but two minutes of conversation per deferred case.
Approach
Financial Cost
Result
BPR overhaul
High capital, low learning
Temporary efficiency; same pattern returns
Two-minute call
Negligible
Structural healing; enduring calm
Law #8 is therefore not about efficiency; it is about economy of consciousness. Systemic change costs awareness, not appropriations.
Every pula saved from compensating blindness becomes available for rebuilding the nation’s real capacities — agriculture, education, manufacturing — the domains that feed people, not reflexes.
14 Broader Implications — The Discipline of Seeing
The Urgent Files case demonstrates that the purpose of systems thinking is not prediction or control but seeing.
A balancing loop is not virtue; it is the reflex of an unseeing system attempting to hold still what must evolve.
Only when awareness reconnects the parts of the loop does reinforcing energy turn from vicious to virtuous.
Then, and only then, does a learning organisation begin to form.
15 Coda – From Reflex to Learning
In biological life, balance preserves being.
In human systems, balance often preserves blindness.
The Fifth Discipline teaches that learning begins the moment the reflex to “correct” gives way to curiosity to see.
The Urgent Files case is more than a story of an investigation unit; it is a mirror for governance, religion, education, and enterprise — every domain that mistakes control for care.
The smallest act of seeing together can dissolve the largest illusion of control. That is the meaning of systemic reform. And that is the quiet revolution already underway.
Figures
Behaviour-Over-Time – Before Leverage
Behaviour-Over-Time – After Leverage
Causal Loop Diagram – From Balancing Reflex to Healing Reinforcement
(See companion visuals: BOT_Before_Leverage_FTF.png, BOT_After_Leverage_Healing.png, CLD_Urgent_Files_FTF.png)
Summary Table of Laws Expressed in the Urgent Files System
Law
Manifestation in Case
#1
Each urgent drive creates tomorrow’s crisis.
#2
The harder the push, the stronger the rebound.
#3
Healing feels wrong before it feels right.
#4
Delay hides cause and effect.
#5
The easy fix leads back in.
#6
The cure (urgent drives) worse than disease (delay).
#7
Faster response slows real progress.
#8
Smallest, least-visible act (phone call) flips the system.
#9
Wanting speed and quality simultaneously creates contradiction.
#10
Splitting responsibility fragments learning.
#11
Seeing structure replaces blame.
Epilogue
Law #8 — Systemic change costs awareness, not appropriations. When a nation learns this, its ministries heal, its budgets breathe, and its people rediscover trust.
Based on the Vision Deployment Matrix™ created by Dr Daniel H. Kim, first published in The Systems Thinker, Vol. 6 No. 1 (1995). Framework adapted by STRLDi for applied national systems learning.
From P5 beetroot to a P40 plate—why profits “move but don’t grow” without a coordination spine.
When the Butterfly Sneezes: The Unseen Players in Botswana’s Food System
🌾 Farmer’s Voice — A Passion of Hope
“Once we finish planting, the imports come in. Prices drop to P3 a kilo. We can’t dodge the same old crops — cabbage, tomato, butternut — and tunnels cost over P90 000. Try niche crops, they say, but even herbs and radish sell for cents. Retailers buy my produce at P3 and sell at P4–P20. When will we ever break even?” — Farmer, Botswana (2025)
Inside this lament is not anger but a map of a missing system. He is describing an uncoordinated market where imports collide with local harvests, costs outrun prices, and data never travels between field, retailer, and policy desk. It is the voice of someone working hard within a structure that works against him — what he calls “a passion of hope.” That hope deserves a system strong enough to hold it.
The thread flares up with emotion. Dozens of voices add their experiences — the weather, the labour costs, the diesel bills, the price of packaging. Some call for subsidies, others for stricter import bans. Others say forget the local market. Go the way of exports. This conversation happens repeatedly in farmer groups. It occurs month after month. Every time a price thread catches fire, the discussion resurfaces.
And yet, hidden inside those messages is a larger pattern — one that rarely gets named. Farmers argue about prices. However, the real leverage lies elsewhere. It is in the soil beneath them. It is in the productivity of the labour beside them. It is also in the structure of the state above them.
It is easy to think that solving the farmer’s problem begins with the farmer. But economics tells us otherwise: the points of highest leverage in a system are usually the least obvious.
Our farmers’ frustration is real. However, the forces that shape it are mostly invisible. This encompasses the movement of data between ministries. It also involves the management of soil biology, the training of labour, and the sustenance of coordination. The pain of one player in the system often begins in the silence of another.
This article quantifies each layer, shows the ripple when farm-gate rises, and identifies the leverage points that actually grow profit.
Three Learning from This Study
These three learning define the real work ahead. It is the work that, if we take care of it, will make these circular farmer–retailer–caterer conversations unnecessary. They form the foundation for the next phase of Botswana’s agricultural and economic development.
1. Reduce Production Costs to Global Competitive Levels
Our first task is to bring our unit production costs down from P5.50–P6.20 to around P3.00/kg, matching China’s cost base.
That P2.00 difference is significant. It represents a full P2 profit margin per kilogram of beetroot (and comparable crops). This margin currently leaks away in inefficiency. We can only achieve this through regenerative practices, precise data coordination, and investment in mechanisation where it matters.
Outcome: Lower costs mean higher margins for farmers without raising consumer prices — the hallmark of a mature, competitive system.
2. Confront Productivity Honestly and Set National Targets for Labour
Our workers are not underpaid — they are undirected.
The value of their pay is being eroded not by exploitation, but by inflation born from low productivity.
We must stop pretending otherwise. We should begin publishing comparative productivity data. This data shows how Botswana’s average agricultural worker performs in kilograms per hour against peers in China, Malaysia, and India.
Then, set measurable targets:
Increase output per labour-hour by 20% within 3 years,
Match Malaysia’s productivity by year 7,
Halve the labour cost per kilogram by year 10.
Outcome: Higher real wages are built on productivity, not inflation. The workforce knows exactly what “competing globally” means in numbers, not slogans.
3. Rebuild the Country’s STEM Foundations Early
Here’s a clear and grounded explanation that moves step by step from STEM → Efficiency → Productivity → Prosperity.
🌱 a. STEM builds understanding — not just knowledge
STEM (Science, Technology, Engineering, Mathematics) teaches people how things work — not just what to do.
That shift in understanding is crucial.
Science helps workers grasp cause and effect (e.g., soil chemistry, pest cycles, plant physiology).
Technology provides the tools to measure, automate, and communicate those effects.
Engineering applies design thinking — how to improve irrigation, logistics, or packaging systems.
Mathematics enables measurement, optimization, and decision-making (costs, yields, probabilities, scaling).
Together, these disciplines cultivate systemic awareness — people start seeing connections, feedback, and waste. And once you see inefficiency, you can eliminate it.
🔍 Efficiency begins the moment a person can measure and model reality accurately.
⚙️ b. Efficiency is the visible expression of STEM in action
Efficiency simply means achieving more output for the same or fewer inputs — time, money, energy, or labour.
STEM translates into efficiency in concrete ways:
STEM Area
Practical Impact on Efficiency
Example in Agriculture
Science
Understanding soil, plant, and climate interactions
Farmers apply the right nutrients at the right time instead of over-fertilising.
Technology
Mechanisation, sensors, digital tools
Moisture sensors save 30% of water and improve yield by 10%.
Engineering
Better designs, less friction
Efficient irrigation pumps reduce energy use by 20%.
Mathematics
Tracking costs, yields, and trends
Farmers identify unprofitable crops before planting.
🌾 Efficiency isn’t about working harder — it’s about working with reality instead of against it.
📈 c. Productivity is efficiency multiplied by scale
When efficiency becomes consistent and repeatable across many workers or farms, it turns into productivity.
Efficiency is doing things right.
Productivity is doing the right things, consistently, across the system.
STEM allows workers to perform better individually. It also helps them coordinate through shared data. They use standardised measurements and continuous feedback.
That coordination is what lets a country like China keep unit labour costs low even when wages rise. Every worker is plugged into an information-rich system. This system amplifies output.
🚀 Efficiency makes individuals productive. Coordination makes nations productive.
💰 d. Productivity creates wealth — sustainably
When workers produce more per hour:
Wages can rise without raising prices (because output per worker increases).
Borrowing costs drop (because the economy produces more value per unit of debt).
Inflation falls (because supply keeps pace with demand).
The nation grows without subsidies.
That’s why improving STEM education and data coordination in agriculture isn’t an “education policy” — it’s a macroeconomic strategy.
It turns a P5.50/kg farm cost into P3.50/kg not through subsidy, but through mastery. It converts labour from a cost line into a competitive advantage.
🌍 STEM turns energy into knowledge, knowledge into efficiency, and efficiency into national resilience.
In short
Stage
Question
Answer
STEM
How do we understand the system?
Through science, data, and reasoning.
Efficiency
How do we reduce waste?
By measuring, predicting, and designing better.
Productivity
How do we grow sustainably?
By scaling efficiency across people and systems.
By the time a child reaches tertiary education, it is too late to correct what was never built. The state must raise the mathematical and scientific literacy of its entire school population, not just the top students.
Our national benchmark must focus on improving Botswana’s average school grades in maths and science. We aim to match the global leaders — Germany, Japan, China, India, and Singapore.
This shift will not just improve education outcomes. It will reset the country’s entire productivity curve. This change will influence how farmers measure yields. It will affect how engineers design systems. Additionally, it will shape how policymakers use data.
Outcome: A generation equipped not only to work harder, but also to think structurally. This creates the muscle memory that drives nations forward.
In summary
1️⃣ Lower costs through coordination and regenerative discipline. 2️⃣ Lift productivity through data transparency and measurable labour goals. 3️⃣ Rebuild national STEM capacity from the classroom upward.
These three actions will work together. They will reduce the noise and emotion of our current debates. Frustration will be replaced with focus. Short-term fixes will be replaced with long-term learning.
Bridging Forward
These three learning give us a compass.
They show where the real work lies. It is not in louder debates over prices or subsidies. It is in building structural strength where it has quietly eroded: cost efficiency, productivity, and foundational education.
The rest of this article explores the data and reasoning that bring these points to life. It follows a single, ordinary beetroot as it travels from soil to plate. It traces how profit behaves and where it leaks. The journey also examines what happens when we add coordination, regeneration, and STEM capacity back into the system.
From the farmer’s field to the nation’s policy tables, every section connects a visible frustration to its invisible cause.
Together, they reveal why Botswana’s horticulture will only mature when learning, labour, and leadership align.
Table of Contents
When the Butterfly Sneezes – The unseen players in Botswana’s food system
Part A – The Ripple Effect: From the Farmer’s P 5 Beetroot to the P 40 Plate 2.1 An Economic Observation 2.2 Tracing the True Cost of a Beetroot: From Farm to Plate a. End Consumer – The Office Meal Plate b. Caterer – Turning Raw Beetroot into a Side Dish c. Retailer – The Hidden Middle Costs d. Farmer – The Starting Point e. The Complete Chain – Costs per kg of Beetroot f. What the Data Shows g. The Systemic Insight 2.3 The Baseline System – When the Farm-Gate Price is P 5/kg 2.4 When the Farmer Raises Price from P 5 to P 8/kg 2.5 Comparative Margins Summary 2.6 Where the Ripples Come From 2.7 Structural Insight – Movement without Prosperity 2.8 Bridge to Part B – Raising Productivity and Coordination
Part B – When the Butterfly Sneezes: The Unseen Players in Botswana’s Food System 3.1 The Quiet Cause Behind the Farmer’s Cry 3.2 Comparative Farming Economics – Conventional, Organic and Regenerative 3.3 Labour Productivity and Cost – Botswana, Malaysia and China 3.4 What Happens When Botswana Combines Regeneration with STEM and NHCS 3.5 The Seven Players – and the Three We Forget 3.6 Closing – When the Butterfly Sneezes
Core Takeaway – Changing how we see ourselves in the system
Part A: The Ripple Effect — From the Farmer’s P 5 Beetroot to the P 40 Plate
1. An economic observation
A kilogram of beetroot may seem like a simple commodity. Yet inside that red root is the entire economy of a nation. Six players each shape one another and are shaped by each other. When the farmer lifts her price by a few pula, it affects retailers and caterers. It impacts consumers and labourers. The state is also influenced by this change.
In a well-coordinated system, those ripples dampen quickly. In a disjointed one, they echo back and forth until everyone feels poorer.
Tracing the True Cost of a Beetroot: From Farm to Plate
Understanding why beetroot sells for P20/kg in retail requires unpacking every layer between soil and spoon. The farmer earns only P4–5/kg.
Contrary to the common assumption that retailers “keep the profit,” the real story is quite different. It involves cost absorption and system inefficiency rather than greed.
a. End Consumer – The Office Meal Plate
Plate price: ~P40 per meal.
Beetroot portion: ~100 g cooked (≈150 g raw).
Plates per kg raw beetroot: 6–7.
Value of beetroot portion: ~P6–7 per plate.
➡️ Effective consumer cost: ≈P40/kg equivalent of beetroot once it is part of a full plated meal.
Summary: For the consumer, beetroot is not seen as a costly ingredient. It forms only one side of a balanced plate. Yet at P40/kg equivalent, the same vegetable has multiplied eightfold from the farmer’s original P5/kg sale.
Punchline: Consumers don’t see the strain because they see only the plate, not the chain.
b. Caterer – Turning Raw Beetroot into a Side Dish
Retail purchase price: ≈P20/kg.
Cooking shrinkage: ~30 % (1 kg raw → 700 g cooked).
→ Effective ingredient cost: P28–29/kg cooked.
Additional operating costs:
Cooking oil, vinegar, spices, gas/power: P4–5/kg.
Preparation labour (washing, peeling, cooking, cutting): P5–6/kg.
Delivery/logistics: P2–3/kg.
Total cost to caterer:≈P38/kg cooked beetroot.
Summary: At P38/kg, caterers are already operating near breakeven against a P40/kg recovery from the plate price. Even a small rise in the farm-gate or retail price erases their profit entirely. This is why caterers appear “price-sensitive”: they have no slack left in their margin.
Punchline: Caterers run on fumes; tiny upstream increases wipe out margin.
c. Retailer – The Hidden Middle Costs
Buying price from farmers:P4–5/kg.
Breakdown of additional costs (per kg of final retail price P20):
Transport from farm: P2 (≈10 %)
Cold storage, handling, and spoilage: P3–4 (15–20 %)
Store rent, energy, staff, packaging, compliance, shrinkage: P6–7 (30–35 %)
Net profit margin:P3–4 (15–20 %)
➡️ Real retailer profit: ≈P3/kg — not P16.
Summary: What appears to be a wide gap between the farm and the shelf is mostly overhead. Retailers operate on thin real profits while shouldering refrigeration, electricity, salaries, and spoilage losses.
If it were easy or profitable for farmers to sell directly, many would have done so long ago. Many would have seen 10-20,000 customers walk through their gates each day. Retailing is a different business — capital-intensive, compliance-heavy, and risky.
Punchline: The “P15 gap” is mostly overhead and risk, not profit.
d. Farmer – The Starting Point
Typical production costs for small to medium beet farms in Botswana:
Cost Item
Range (P/kg)
Seeds & inputs
0.80 – 1.20
Fertiliser & soil preparation
0.80 – 1.00
Irrigation, energy & water
0.60 – 0.80
Labour
0.80 – 1.00
Harvesting & packaging
0.50 – 0.80
Farm overheads
0.50 – 0.70
Total Cost Range
3.50 – 5.50
Summary: At a selling price of P4–5/kg, farmers are operating at or below cost depending on yield. This leaves no room for reinvestment in irrigation, labour, or expansion — keeping farms small and fragile.
Punchline: At P4–5/kg, farmers are at/under cost—no reinvestment cushion.
e. The Complete Chain – Costs per kg of Beetroot
Layer
Input / Base Cost (P/kg)
Selling Price (P/kg)
Approx. Profit (P/kg)
Notes
Farmer
3.5 – 5.5
4 – 5
≈ 0–0.5
Breaks even at best.
Retailer
4 – 5
20
≈ 3
Real profit ≈ 15 %; bulk absorbed by overhead.
Caterer (cooked)
20 raw → 38 cooked
40 (plate equivalent)
≈ 2
Extremely tight margin.
Consumer
—
40
—
Sees only final plate price, not the cumulative chain.
f. What the Data Shows
Retailers are not “keeping” P16/kg. Most of that margin evaporates into transport, electricity, staff, and spoilage.
Farmers sell at or below cost. They absorb biological risk without a financial buffer.
Caterers operate on fumes. Their entire P40 plate price barely covers cooked beetroot costs once prep and logistics are included.
Consumers perceive stability, not strain. They see the P40 meal, not the imbalanced structure behind it.
Punchline: Movement without prosperity.
g. The Systemic Insight
Every link is absorbing inefficiency because no national coordination spine connects them.
Farmers plant without market signals.
Retailers import unpredictably to fill gaps.
Caterers pay for inconsistency with higher costs.
Consumers face quiet inflation hidden inside the meal price.
Without coordination, the entire chain functions like a series of disconnected pumps. Each builds its own pressure. None drives flow.
In short:
The beetroot doesn’t cost too little at the farm or too much on the plate. It costs exactly what an uncoordinated system produces. This includes high effort, low reward, and invisible waste.
2. The Baseline System — When the Farm-Gate Price Is P 5/kg
Assumptions: 1 ha = 40 tons yield. Farmer production cost ≈ P 5/kg.
Layer
Input Cost (P/kg)
Ops & Handling (P/kg)
Revenue (P/kg)
Profit (P/kg)
Margin (%)
Commentary
Farmer
5.00
—
5.00
≈ 0.00
0 %
Sells at cost; no cushion for loss or reinvestment.
Margin looks high but includes spoilage risk and unionised labour.*
Caterer (cooked)
20.00 (raw)
18.00 (cooking shrink + ingredients + labour + delivery)
38.00
2.00
5 %
Runs on thin margins; relies on volume.
Consumer (plate)
38.00 (cost/kg cooked beet)
2.00 (service + profit)
40.00
—
—
Pays P 40 for a full meal; beetroot one side dish.
Observation: Every layer is working, few are thriving. The system produces movement, not prosperity.
Although the spread between farm-gate and retail looks like a P15 margin, only about P3 /kg is actual profit.
*The rest — roughly P12 /kg — is consumed by transport, cold-storage energy, rent, packaging, spoilage, unionised wages, taxes, and compliance costs.
If selling direct were truly easy for farmers, many would have become retailers long ago. They would be seeing 10-20,000 customers walk through their doors daily. But retailing is a capital-intensive, risk-heavy business with constant overheads and perishable losses.
What appears as a profit gap is actually a reflection of two kinds of risk. One is biological risk on the farm. The other is logistical risk in the marketplace. Both need to be managed, not merely priced.
Punchline: When value chains lack coordination, profit behaves like water on an uneven table. It moves, but it doesn’t grow.
3. When the Farmer Raises Price from P 5 → P 8/kg
Farm-gate increase = +60 %. Each player reacts in turn.
Layer
Prev Input (P/kg)
New Input (P/kg)
Ops & Handling (P/kg)
New Revenue (P/kg)
Profit (P/kg)
Δ Margin
Commentary
Farmer
5
5
—
8
3
+60 % gain
Short-term relief; higher gross but may lose buyers.
Retailer
5
8
15
23
3
–2 pts
Passes cost downstream; absorbs some shrink.
Caterer (cooked)
20
23
21
44
0
–5 pts
Margins collapse; must raise plate price.
Consumer (plate)
40
46–48
—
46–48
—
Faces +15–20 % inflation on meal price.
Observation: Farmer’s gain (+3 P/kg) triggers +15 % retail inflation and erases caterer margin.
Consumers carry wage pressures and inflation anxiety.
Prices rise at the base without productivity growth or coordination. Each downstream player protects itself by passing on costs. They cut quality or reduce labour. The system tightens like a chain under tension; every link creaks.
As Linda Booth Sweeney wrote in When a Butterfly Sneezes, small events lead to other happenings. These happenings connect in surprising ways.
In Botswana’s horticulture, a three-pula sneeze at the farm-gate can shake the whole plate.
Punchline: A three-pula sneeze shakes the whole plate.
6. The Structural Insight
What this case shows is not greed but structure.
The cry of the farmer (“I can’t survive on P 5/kg”) reflects a missing element. The cry of the caterer (“I can’t sell a P 48 plate”) is the same. Both are echoes of a need for a coordinated system. This system should balance supply, demand, logistics, and labour.
When systems are tight, prices can rise and everyone still profit. When systems are loose, even generosity becomes inflation.
Punchline: Tight systems can absorb price moves; loose systems convert generosity into inflation.
7. Bridge to Part B — “When the Butterfly Sneezes”
Raising prices cannot make a weak system strong. Only productivity and coordination can.
In Part B, we follow this beetroot deeper into the soil. We explore how regenerative practices, labour productivity, and the state’s STEM backbone can transform cost into capacity.
In the end, the farmer’s hand is not the only factor that shapes the price of a plate. It is also the mind of a nation learning how its parts connect.
(End of Part A – The Ripple Effect)
Now, let’s move to Part B: “When the Butterfly Sneezes — The Unseen Players in Botswana’s Food System.”
Part B: When the Butterfly Sneezes — The Unseen Players in Botswana’s Food System
1. The quiet cause behind the farmer’s cry
In Part A, we saw how a farmer’s small price change at the soil surface affects the entire chain. This change inflates costs and erodes profits downstream.
Yet those ripples begin even deeper. They originate in the unseen conditions of the soil. The skills of labor play a role, alongside the coordination of the state.
Linda Booth Sweeney reminds us in When a Butterfly Sneezes that small causes can have big effects. This is especially true in systems that are already under tension.
In Botswana’s horticulture, the “sneeze” is often invisible. It includes an under-trained workforce, an uncoordinated logistics chain, and a budget released without a plan. Each seems small; together they decide whether every player profits or barely survives.
2. Conventional, Organic, and Regenerative Farming Economics
System
Yield (t/ha)
Total Cost (P/ha)
Cost (P/kg)
Farm-Gate Price (P/kg)
Revenue (P/ha)
Profit (P/ha)
Profit Margin (%)
Commentary
Conventional
30
165 000
5.5–6.0
5.5–6.0
180 000
15 000
8–9 %
High synthetic inputs and fuel dependency; yields fluctuate with weather and pest cycles.
Organic (Certified)
28
210 000
7.0–7.5
7.5–8.5
224 000
14 000
6–8 %
Conversion and audit costs; lower yield; depends on sustained premium demand.
Regenerative
40
190 000
4.8–5.2
5.8–6.0
240 000
50 000
20–22 %
Inputs fall 10–25 % by Year 3; soil structure and water efficiency raise yield; most resilient long-term.
(Baseline: 1 ha beetroot, open-field, Botswana; currency = BWP.)
Punchline:
Regeneration earns more not by charging more but by wasting less. It restores both soil and solvency.
3. Labour Productivity and Cost — Botswana, Malaysia, and China
Step 1. Setting up the context
To understand how labour costs and STEM productivity shape competitiveness in regenerative (Regen) vs conventional farming — comparing Botswana to:
China (low-wage, high-productivity, strong STEM coordination), and
A non-distant, STEM-strong peer — a country shares closer institutional and social structures with Botswana. This country has managed to integrate STEM deeply into agriculture.
📍 Suitable comparison: Malaysia
Why Malaysia?
Not culturally or politically “distant” (multi-ethnic, developing economy, democratic institutions).
Has STEM integration across education, manufacturing, and agro-technology.
Mid-level wages (not as cheap as China, not as high as OECD).
Strong public-private coordination in horticulture and food exports (e.g., Cameron Highlands vegetable clusters).
Realistic aspiration path for Botswana’s next 20 years.
Step 2. Approximate labour costs
Country
Average Agricultural Wage (BWP equivalent/hr)
Avg Monthly (BWP)
Remarks
Botswana
P20–25/hr
P4,000–5,000
Labour market tight; strong unions push for steady increases; relatively low productivity/hour.
China
P10–12/hr
P2,200–2,500
Lower nominal cost, but very high labour productivity due to tech, mechanisation, STEM oversight.
Malaysia
P15–18/hr
P3,000–3,600
Balanced wages with higher output per worker (mechanised, digitally managed farms).
Chinese wages are half those of Botswana. However, their output per worker is often 3–4× higher. This means the unit labour cost per kg of produce ends up far lower.
Step 3. Labour cost per kg of beetroot (by system)
Let’s assume 1 hectare beetroot with ~40 tons yield (regenerative steady-state), ~30 tons (conventional). Farm labour hours include planting, maintenance, irrigation, harvesting, grading.
Country/System
Labour Hours/ha
Wage (BWP/hr)
Labour Cost/ha (P)
Yield (tons/ha)
Labour Cost/kg (P)
Botswana – Conventional
1,000
22
22,000
30
0.73
Botswana – Regenerative
1,200
22
26,400
40
0.66
China – Conventional
700
11
7,700
40
0.19
China – Regenerative
850
11
9,350
45
0.21
Malaysia – Conventional
800
16
12,800
35
0.37
Malaysia – Regenerative
950
16
15,200
42
0.36
🌍 Observations
Unit labour costs per kg
Botswana: ~P0.65–0.75/kg
Malaysia: ~P0.35/kg
China: ~P0.20/kg
China achieves triple the efficiency despite lower pay, due to STEM-driven mechanisation, logistics integration, and continuous R&D feedback loops.
STEM intensity equals productivity
China: tech platforms link field to market daily.
Malaysia: medium-tech, government coordination, farmer co-ops with digital traceability.
Botswana: strong individual farmer effort, but low integration — data and skills sit in silos.
Regen effect
Regenerative increases labour slightly (10–20%) but offsets through yield and soil stability.
Over time, Regen reduces unproductive labour (weed management, pest crisis responses) — smart work, not harder work.
Punchline: Productivity isn’t hand strength; it’s system clarity.
Step 4. Total cost comparison (farming system + labour + inputs)
Country/System
Total Cost/kg (P)
Key Cost Drivers
Botswana – Conventional
5.5–6.0
Inputs & labour dominant, low mechanisation.
Botswana – Regenerative
4.8–5.2
Lower inputs, higher yield, slightly more labour.
China – Conventional
2.8–3.2
Scale, automation, supply-chain optimisation.
China – Regenerative
3.0–3.4
Balanced system with government incentives, compost integration.
Punchline: The multiplier is coherence, not cash injection.
Step 5. Interpretive insight
Botswana’s challenge is not wage level — it’s output per hour. We pay similar to Malaysia. We pay more than China. However, we produce only half the output because the STEM backbone and coordination spine are missing.
Regen alone is not enough. It must be coupled with STEM discipline — data, measurement, systems, integration.
STEM turns Regen into strategy; without STEM, Regen becomes romantic.
💡 The Takeaway
A beetroot farmer in Botswana may spend the same on wages as a farmer in Malaysia. However, they produce half as much per hectare. The difference is not the hand. It is the system guiding it. STEM is present at every level, from soil testing to national logistics.
China’s system multiplies each worker’s output through data and coordination. In contrast, our system still isolates the worker. It also isolates the farmer and the policymaker. Until we bridge that gap, we will continue to pay more per kilogram. We will earn less per hour, even though our farmers work just as hard.
Our national goal should be to bring production costs down from the current P5.50–P6.20/kg to P3.50–P3.80/kg within the first three years, and to reach P3.00–P3.40/kg beyond the third year.
By the time we arrive at those levels, others will already have lowered theirs further — because efficiency compounds. It’s what athletes and craftsmen call muscle memory. When they train their muscles to work efficiently, those muscles become faster and stronger.
Country / System
Avg Wage (P/hr)
Labour Hours/ha
Labour Cost/ha (P)
Yield (t/ha)
Labour Cost (P/kg)
Total Cost (P/kg)
Commentary
Botswana – Conventional
22
1 000
22 000
30
0.73
5.5–6.0
High wage relative to productivity; weak mechanisation and coordination.
Botswana – Regenerative
22
1 200
26 400
40
0.66
4.8–5.2
More labour initially, but yield compensates; creates skilled rural jobs.
Malaysia – Regenerative
16
950
15 200
42
0.36
3.5–3.8
Medium wage, high STEM application; co-ops and digital traceability improve efficiency.
China – Regenerative
11
850
9 350
45
0.21
3.0–3.4
Low wage, strong coordination and automation; highest output per worker.
Reflection
Productivity is not the strength of the hands but the clarity of the system guiding them. Botswana’s labour is not expensive — it is under-directed.
4. What Happens When Botswana Combines Regeneration with STEM
If Botswana’s 30 % horticulture land (≈ 3 million ha) shifted gradually toward regenerative practices under a National Horticulture Coordination System (NHCS):
Year
% Regen Adoption
Yield Gain (%)
National Profit (BWP Bn)
Change vs Status Quo
Commentary
3
20
+10
126
Baseline
System still fragmented.
5
40
+20
162
+36 Bn (+29 %)
Early NHCS coordination; farmer mentoring; visible GDP effect.
10
60
+35
198
+72 Bn (+57 %)
STEM-trained labour expands; data informs planting calendars.
20
80
+50
234
+108 Bn (+86 %)
Full coordination spine; stable markets; rising rural incomes.
Reflection
When the state learns to see the system as a whole, national profits rise without raising prices. The real multiplier is not money injected, but coherence built.
5. The Seven Players — and the Three We Forget
The painful truth is that the areas of highest leverage are often the least obvious. It is easy, as the farmer groups show each week, to toss around ideas about prices, inputs, and retail margins. Yet the power to change those pains lies elsewhere. It resides quietly in the soil. It is found in the discipline of labour and in a state that directs its STEM muscle towards agriculture.
Labour must recognize itself as more than a voice demanding fairness. It must actively participate in a global race for productivity. It is not enough to speak for higher pay when output per hour remains low. Economics cannot do miracles where labour does not first do the work itself. If productivity stalls, the entire economy suffers. Borrowing costs rise. Inflation creeps in. Every other player absorbs the shock. The wages labour receive will never be enough.
The state, meanwhile, must rediscover its long-term role as the system’s conductor. Its task is not only to distribute budgets. It must also direct STEM intentionally into agriculture. This will ensure that data, measurement, and research become daily tools of governance, not rare events.
That begins with a national shift in education. This involves playing down the dominance of non-science subjects. It also means raising the quality of mathematics and science across the board. These improvements are necessary not only for the best students but also for the average classroom. When the median student performs at the world’s upper quartile, the nation’s productivity begins to move.
In systems thinking, we say that small changes can create big results. However, finding those points of leverage is never easy. They hide in places we are least likely to look. The tip is simple: look around the room and ask who is not there. Then listen for their voices. That is where the answers often lie.
The Seven Players — and the Roles They Play
THE FORGOTTEN THREE: The State – the unseen conductor that sets rhythm, measures, and accountability. Labour – the hands that transform coordination into productivity. This productivity surpasses the world. Soil – the quiet foundation; holds memory, fertility, and future yield.
WHERE WE FOCUS OUR ATTENTION: Farmer – creates value from soil through skill and risk. Retailer – connects that value to the market. Caterer – translates produce into meals and employment. Consumer – completes the loop through demand and choice.
When only the first four talk, profits fight. When the last three join — the soil, labour, and the state — profits multiply.
In systems, the highest leverage actions are rarely found in reacting to events (e.g., “raise prices,” “import more”).
They are found in changing the relationships and information flows between parts. Soil, labour, and the state communicate and learn together.
Lesson: The “butterfly sneeze” for Botswana may not be more funding but better integration — data, training, and trust.
The system stabilises not when prices rise, but when learning, labour, and leadership align.
Punchline: When only the obvious four talk, profits fight; when soil, labour and state join, profits multiply.
6. Closing — When the Butterfly Sneezes
A small change in how we train a worker may seem trivial. Measuring soil moisture or aligning crop calendars might also seem insignificant — like a butterfly’s sneeze. But in a fragile system, that sneeze decides whether the chain trembles or holds steady.
Only then will every player — farmer, retailer, caterer, consumer, labour, and state — earn enough to rest easy, together.
Core Takeaway
The deepest leverage lies not in the next policy. The real change comes from altering how people see themselves in relation to one another. It also involves helping the “silent players” (soil, labour, state) regain their voices in the story.
(End of Part B – When the Butterfly Sneezes)
🪜 Botswana’s Horticulture Value-Chain Ladder — The Seven Players
Each step adds value, risk, and responsibility. The question is not who profits most — but who holds the leverage to make the entire chain prosper.
🔁 Interdependence Summary
Player
Type of Value Added
% Influence on Final Cost
Hidden Leverage
Soil
Ecological
~25%
Regeneration & moisture retention
Farmer
Production
~20%
Efficiency, timing, data accuracy
Retailer
Distribution
~20%
Cold-chain & sourcing coordination
Caterer
Transformation
~10%
Waste reduction, menu design
Consumer
Demand signal
~10%
Conscious purchasing, feedback
Labour
Productivity
~10%
Skills, STEM application
State
Governance
~5% (but systemwide)
Coordination, STEM, NHCS backbone
🪶 Reflection
A nation’s horticulture isn’t defined by the quantity of crops its farmers grow. Instead, it is defined by how well its seven players learn to work together.
Profit stops fighting when soil, labour, and the state are invited back into the conversation. The rest — farmers, retailers, caterers, and consumers — can then finally share in what the system creates.
Your thinking is incisive — and it touches a painful global fault line.
🔵 INTRODUCTION
Fifty years ago, and even twenty years ago, eyes would quietly roll. This happened even just five years ago whenever I presented the unemployment case study. I called for the expansion of our economic base into agriculture and manufacturing. The analysis didn’t align with what many in Botswana held close to their hearts:
That the best jobs were in government. That the safest path was one with proximity to the national coffers. That careers worth pursuing were those of teachers, police officers, lawyers, and doctors. These roles are seen as stable, respected, and state-salaried.
In that worldview, STEM was invisible. It was neither prioritized nor financed. STEM has powered the rise of every economy now leading the world into the AI age. It is evident in Physics, Chemistry, and Mathematics.
But fifty years have passed. And the reality today no longer matches the dream.
The government coffers are no longer overflowing. Public sector job creation has slowed. And those trained in roles of the past now find themselves unskilled for a private sector that never fully materialized.
Looking back, we can forgive the choices of the early years. Botswana was young — trying to find its way. But the next 50 years will not wait. And it will not be gentle.
The time has come to name a reality many have quietly lived with. We must do so with compassion but also clarity. The reality is that STEM evokes pain. For many, it stirs memories of failure. It triggers feelings of not being good enough. People remember being left behind in schoolrooms that favoured quick calculations over poetic thought. Avoidance is no longer an option. We live in a world where everything we eat, wear, or build is grounded in the sciences. We operate everything through AI, except perhaps politics.
This is not to dismiss the Arts. They are necessary. They help us make meaning of what we have just lived through. But they are languages of the past. They draw their strength from nostalgia, memory, and reflection. They do not engineer propulsion. To leap into the future, we need STEM. It should not only be a subject in school. It should be the architecture of economic survival, governance, and production.
Every country has lived through that pain. Every person who has had to reckon with their place in this rapidly changing world has experienced it. You’re not alone in having struggled with STEM. But at some point, as individuals and as nations, we must find the courage to move forward with it anyway.
The future will not pause while we make peace with our past. We don’t have to pretend it was easy. But we also can’t let that pain define what comes next. It’s time to rise — not because it’s easy, but because it’s necessary.
This post explores three possible trajectories for Botswana from this point forward. The purpose is not to predict the future — but to sharpen our awareness of what we are choosing today. Each path is plausible. Each has its own consequences. But only one, I believe, leads to durable sovereignty, economic coherence, and generational uplift.
Looking back, we can forgive the choices of 50 years ago. It was Botswana’s first united front — a young nation trying to find its way. But the next 50 years will not wait.
So the question is no longer: What happened?
The real question now is: What must we be prepared for?
✳️ Introductory Paragraph:
The world is not waiting. Nations are restructuring their economies, education systems, and regulatory frameworks to meet the demands of an AI-powered, STEM-led global future. That shift was happening as far back as 200 years ago. In the span of a single generation, decisions made today in classrooms will determine the fate of countries. Ministries and boardrooms also play a crucial role in shaping the future. These choices will show if they fall behind or rise to global relevance.
Botswana stands at a crossroads. Will it continue on its current path — redistributing value instead of building it? Will it adopt surface-level AI tools without a real production engine? Or will it invest deeply in science, technology, engineering, and mathematics (STEM) to build resilient systems and regional value chains?
This post presents three strategic scenarios for Botswana’s future. Each scenario is shaped by the country’s choices around STEM investment. Governance models also play a role. Additionally, it depends on its willingness to lead rather than follow. These scenarios are not predictions. They are tools for clarity, planning, and courage.
✳️ Rationale for Developing the Scenarios:
These scenarios were developed in response to a growing national unease. This unease is about youth unemployment, growing regulation, policy stagnation, and technological disruption. They build on insights from systems thinking, development planning, and decades of underutilised potential in Botswana’s public and private sectors.
More urgently, they offer a language to speak about what we stand to gain or lose. This depends on whether we choose to centre STEM. It applies not only in education but also in governance, regulation, and production. It affects how we imagine our collective future.
Let’s walk through a likely 20-year scenario for Botswana (and similarly placed countries) if the current structural discomfort with STEM continues and the world’s STEM giants surge ahead:
🛰️ Scenario 1 for Botswana 2045: The Global Tech Divide Is Permanent — and Botswana Is on the Losing Side
1. STEM-Powered Superstates Set the Rules
China, India, Europe, and the STEM-enabled Middle East now own the AI, bioengineering, fusion power, agri-robotics, and climate-tech markets.
These regions no longer just produce the technologies. They have embedded them deeply into how society is governed. They also affect how infrastructure is maintained and how jobs are distributed.
2. Botswana is a Spectator to AI, Quantum, and Bio Revolutions
Botswana becomes a net consumer without a critical mass of home-grown STEM thinkers. It becomes a net consumer, not a producer. Botswana is not even a critical consumer.
The few tech services it can afford are scaled-down versions, pre-processed for Global South clients.
“It’s like drinking recycled water from a smart city you never helped design.”
3. The Global North No Longer Needs Botswana’s Minerals
Rare earths and diamonds are either:
Synthesized artificially (lab-grown diamonds, mineral extraction from space debris),
Or sourced from more politically stable, tech-integrated African countries (e.g., Rwanda, Kenya, Egypt).
The era of passive mineral wealth is over. The illusion that foreign spending will keep the country afloat is gone.
4. Socialist Redistribution Politics Struggle Without Revenue
With mining income gone and agriculture un-modernized, the state has less to redistribute.
Workers expect “entitlements,” but there is no productivity beneath to fund them.
The gap between promises and possibilities widens — leading to unrest, brain drain, and populist distraction politics.
5. Botswana’s Youth Are Angry — But Undertrained
With AI displacing traditional white-collar jobs, and no local STEM industries to absorb the loss, youth feel betrayed.
Ironically, many turn to the very influencers and entertainers the system elevated. They then realise that the real wealth and influence now sits in the STEM world. This is a world they were never invited into.
6. Global Tech Powers Pick and Choose African Partners
STEM-rich countries like Egypt, Tunisia, Kenya, and Rwanda become African nodes for future development partnerships.
Countries like Botswana are offered climate preservation roles, or eco-tourism zones — but not a seat at the decision-making table.
Foreign powers may still invest in:
Preserving biodiversity, not industrialising it.
Buying carbon credits, not helping industrial growth.
Charitable tech access, not capacity building.
In other words: you may be preserved, but not empowered.
✋ And Yet, It Was Preventable
This isn’t a natural outcome. It’s a choice — or rather, a series of avoided choices.
Countries like Botswana had 20 years to:
Rewire education to prioritise STEM (especially Physics, Chemistry, and Mathematics).
Reform leadership pipelines to demand STEM literacy in public service.
Stop glamorising “soft visibility” professions and reward quiet technical mastery.
🌱 But All Is Not Lost — If Action Starts Now
“The best time to plant a tree was 20 years ago. The second-best time is today.”
If Botswana invests now in building a critical mass of 35–40% STEM graduates, with integrity-based leadership:
It can leapfrog into renewable energy, regenerative agriculture, AI-supported public infrastructure, and STEM-backed governance.
It can serve as a regional hub for climate-tech, AI-integrated agriculture, or precision medicine.
That pivot requires courageous honesty about where things stand now. It also demands a break from the illusions of safety in visibility, poetry, or legacy mineral rents.
⚠️ Scenario 2 for Botswana 2045: Decoupled Growth – AI Without Foundations
“Digitised but unrooted. Tech glitters, but the soil is hollow.”
Botswana aggressively adopts AI technologies. This occurs in government, banking, security, and communication. However, the country is not building a foundational STEM ecosystem in its schools, industries, and governance systems.
Short-term gains (next 5–10 years):
Government digitises services.
Youth pick up quick AI tools (prompting, low-code apps, etc.).
Startups and donor-funded tech incubators emerge.
But…
Medium-term outcomes (by 2045):
Local talent cannot maintain or advance AI systems they adopt.
Manufacturing and agriculture remain underserved and unautomated.
Foreign firms dominate data, tools, cloud access — Botswana becomes a data client state.
This scenario creates a false sense of progress, masking the lack of sovereign technical depth.
If Botswana boldly shifts today, it can achieve a 60% STEM throughput within 10 years. This effort will allow them to catch up on lost time. By 2045, a radically different future is not just possible, it is probable.
Let’s explore that future in contrast to the previous scenario:
🌍 Scenario 3 for Botswana 2045 — The STEM Leapfrog Nation
“It was once called ‘the locomotive of Africa’ — now, it’s the driver of the engine.”
🔁 1. From Extractive to Generative Economy
Botswana no longer relies solely on mining rents; it now exports AI-driven agri-solutions, climate engineering services, and biotech intellectual property.
Former mining towns have been converted into STEM production corridors: solar microgrids, geothermal research hubs, fusion training centres.
Local manufacturing has revived — not cheap and dirty, but clean, precise, and export-oriented, led by engineers and digital technicians.
🧠 2. Public Sector Transformed: Led by Technocrats
60% STEM throughput means that half or more of public officers now have backgrounds in Physics, Chemistry, Mathematics, or Engineering.
Ministries no longer “consult” technical experts. They are the technical experts.
Policies are evidence-led, deeply simulated using systems models, and include impact foresight.
Regulatory culture shifts from defensive overreach to agile risk-tolerant frameworks — because people finally understand scale, feedback, and irreversibility.
“The government is no longer a referee of progress. It is the architect of it.”
👩🏽🌾 3. Botswana Becomes Africa’s Agri-Tech Command Centre
With climate volatility peaking, Botswana leads in regenerative precision agriculture, satellite-aided irrigation, and AI crop disease forecasting.
Thousands of rural youth are trained as agri-coders, drone operators, soil lab analysts, and seed technologists.
Regions like the Kgalagadi have become agro-innovation testing zones in collaboration with Indian and Dutch research stations.
The African Development Bank labels Botswana “The First Resilient Farm Nation.”
💼 4. Unemployment Nearly Eliminated — But It’s Not the Old Jobs
While mining and retail decline, jobs in:
Cybersecurity
Energy systems
AI governance
STEM teaching
Circular economy manufacturing grow rapidly.
Rather than waiting for jobs, young people are founding companies that export services and products into Africa and beyond.
The informal sector shrinks as people shift from hustle to mastery.
🧬 5. A New Botswana Identity Emerges
The national identity is no longer rooted in “a proud past” alone — but in a shared, technical future.
Botswana celebrates its engineers, data scientists, agronomists, and inventors — as deeply as it once celebrated singers and soldiers.
National TV channels run prime-time STEM storytelling, and annual “Botswana Grand Challenges” inspire national innovation sprints.
Even Setswana proverbs are being re-interpreted to align with scientific insights — grounding STEM in culture.
“Ga se ka lerumo le le bogale fela — le ka ntlha ya boikwetliso jwa gagwe.” It is not only because of a sharp spear — but because of the preparation of the one who wields it.”
🤝 6. Global Partnerships on Botswana’s Terms
Rather than waiting for Global North investors, Botswana becomes a technical equal.
It co-develops AI laws with Europe, shares data infrastructure with India, and hosts Africa’s Southern AI Observatory.
The Global STEM Diaspora is returning — not to visit, but to invest and teach.
Botswana is now chairing continental panels on STEM ethics, regenerative governance, and space economy for Africa.
⚖️ 7. The Political Culture Matures
The age of “elite populism” fades, replaced by civic science culture.
Parliamentary debates begin with simulations and systems maps.
Leaders are elected not by slogans, but by demonstrated grasp of complexity and ability to lead multi-disciplinary teams.
Even the military has STEM-led strategic units in cyber, space, and climate security.
🎓 8. The Ripple to SADC and the World
Botswana exports:
Curricula for STEM-primary schooling
Faculty to newly launched universities in Angola, DRC, and Zambia
Policy blueprints for AI regulation and STEM justice
Motswana professors are now guest lecturers at MIT, NUS, ETH Zurich.
Regional neighbours model their youth employment strategies on Botswana’s STEM value-chain training.
🛤️ How Did It Happen?
Through a radical national reckoning — and 3 unshakable reforms:
A National STEM Commitment Charter — enshrined in law.
Public Service STEM Track — 60% of new hires must be from Physics, Chemistry, Mathematics, and Engineering fields.
STEM x Culture Narrative Rewrite — using schools, churches, influencers, and village elders to normalise technical ambition.
Botswana can catch up on lost time if it boldly shifts today. It must commit to a 60% STEM throughput within 10 years. Then by 2045, a radically different future is not just possible, it is probable.
Let’s explore that future in contrast to the previous scenario:
We will next develop the three scenarios for Botswana’s future — arranged in a clear, escalating arc:
As the world accelerates in AI, biotech, manufacturing and advanced agriculture, Botswana stands at a pivotal crossroads. The choices made today will determine whether it builds systems. They will also determine if it becomes a dependent participant. It may also end up as a bystander in decline.
Here are three strategic scenarios to frame Botswana’s possible futures:
🚩 Scenario 1: Status Quo – STEM Neglect and Decline
“Redistribution without production. Regulation without understanding.”
Botswana continues on its current path:
Low STEM enrolment (9%) persists, with youth drawn to tenderpreneurship, arts, and political sciences.
Regulations remain tight — not due to strategic caution, but due to lack of internal technical fluency.
Tenders dominate local opportunity, sidelining hands-on production and systems-building.
Foreign experts parachuted in but fail to leave lasting capacity or ecosystems.
Socialism is used as political cover, redistributing limited gains but failing to grow new wealth.
Consequences by 2045:
Botswana becomes a pass-through state, relying on outside systems and consultants.
AI, engineering, and biotech are imported, not created.
Economic sovereignty weakens as the country remains resource-dependent (diamonds, minerals, tourism).
Society grows more fragile, with growing unemployment and state spending pressures.
🧨 Trigger signs already visible:
9% STEM graduation rate.
P800M procurement losses vs P80M in value.
Tight, reactive regulation vs anticipatory system design.
⚠️ Scenario 2: Decoupled Growth – AI Without Foundations
“Digitised but unrooted. Tech glitters, but the soil is hollow.”
Botswana aggressively adopts AI technologies — in government, banking, security, and communication. However, it does so without building a foundational STEM ecosystem in its schools, industries, and governance systems.
Short-term gains (next 5–10 years):
Government digitises services.
Youth pick up quick AI tools (prompting, low-code apps, etc.).
Startups and donor-funded tech incubators emerge.
But…
Medium-term outcomes (by 2045):
Local talent cannot maintain or advance AI systems they adopt.
Manufacturing and agriculture remain underserved and unautomated.
Foreign firms dominate data, tools, cloud access — Botswana becomes a data client state.
Public servants regulate differently when they understand scale, causality, and systems. This understanding impacts agriculture, manufacturing, and national governance.
This is an exceptionally rich and nuanced insight. It examines how STEM training interacts with public regulation. Additionally, it looks into the psychology of governance in different cultural and professional contexts. It serves as a cornerstone theory in my essays or governance reform proposals. It moves past binary notions of “STEM = efficient” or “non-STEM = bureaucratic.” It offers a systems-aware reflection on how mindsets adapt under pressure, scarcity, and perceived incompetence (internal or external).
🧠 Core Argument:
Regulatory stringency is not a fixed trait of STEM vs. non-STEM officers — it is adaptive based on:
The perceived competence of the public
The regulator’s own confidence in the sector
The cultural cost of failure
The scarcity of employment alternatives
The systemic room for self-protection and/or justification
🧱 Foundational Assumptions
1. STEM-trained regulators are not necessarily stricter — they’re systemic thinkers.
They understand scale, cause-effect chains, and feedback loops.
If they know the population is also STEM-literate, they tend to trust the system more. They impose leaner guardrails, using design-based rather than rule-based control.
But if the public is largely non-STEM, they may tighten regulation not out of bureaucratic instinct. Instead, they do so out of risk containment. They understand that small oversights can become systemic failures. This happens due to a poor grasp of scale, probability, or consequence.
My metaphor: “placing a nuclear bomb in the hands of someone used to playing with matchsticks”. It is not only evocative. It is also pedagogically perfect.
2. Non-STEM regulators tend to regulate reactively — to protect themselves.
In high-risk, low-alternative job markets, non-STEM public servants tend to overregulate as a form of self-preservation.
Without training in dynamic modeling or experimentation, they view error as catastrophic and irreversible.
They may confuse over-control with competence. This confusion leads to unnecessarily rigid systems. These systems are often justified in the name of “safety” or “fairness.”
3. Moral justifications can blur into systemic corruption.
Particularly where a socialist moral code overlays public service, some regulators may:
View private success in technical sectors as “lucky” or “excessive”
Feel justified in extracting rents or benefits in the name of “sharing the wealth”
Enforce regulation unevenly — favouring insiders or ideologically similar peers
This is not always seen as corruption by the actors themselves. The dominant cultural narrative sometimes frames profit as unjust. It may also frame competence as elitism.
🔁 Summary Diagram
Let’s call this the “Adaptive Regulation Matrix”:
Regulator Background
Public STEM Literacy
Regulatory Style
Underlying Logic
STEM-trained
High
Lean, Design-Based
Trusts public, uses systemic tools
STEM-trained
Low
Tight, Risk-Averse
Concerned about amplified failure due to public’s lack of systems grasp
Non-STEM
Low
Overregulates
Self-protection, cultural shame, no safe room for failure
Non-STEM
High
Conflicted / Defensive
Feels exposed, may retreat to ideological or moral defence
🌾 Practical Implication for Agriculture & Manufacturing
Misjudging the demands of agriculture and manufacturing is spot-on and common.
These sectors are deeply dynamic — needing comfort with variability, technical risk, and iteration.
Officials who have never worked in these fields (and particularly lack physics/maths systems training) underestimate the number of decision points per unit time, leading them to:
Regulate from the surface (rules, licenses, audits),
Rather than from structure (supply chains, incentive design, capacity-building).
This often produces:
Bottlenecks in service delivery,
Stifled innovation at the grassroots,
And ironically, more systemic risk due to inappropriate controls.
💬 Quote:
“When people do not understand scale, they regulate the wrong lever. When they cannot see causality, they punish the wrong player. And when they fear losing control, they call it fairness.”
A citizen who understands the root causes of overregulation can respond wisely. These root causes include low STEM familiarity, fear of blame, and legacy bureaucracy. They will not just react emotionally. Here’s what they can do now, step by step:
🌱 1. Shift from Resistance to Education
Instead of fighting regulation head-on (which may trigger more defensiveness), educate regulators using:
Small pilot projects with transparent documentation
Clear data on risk mitigation, timelines, and projected outcomes
Simple visual models or production walkthroughs to show how things work
Think: “Let me help you see what I see.”
🗺️ 2. Speak Their Language — Reduce Their Fear
Understand that many public officers are not trying to harm progress, but are terrified of backlash or misjudgment. So help them:
Pre-empt their fears by showing what could go wrong — and how you’ve planned to handle it
Offer co-signatures or letters of responsibility to absorb risk if needed
Use analogies to help them link what you’re doing to something familiar
Think: “Here’s how this reduces—not increases—your burden.”
🧭 3. Create a Track Record of Trust
Document every success, timeline met, and compliance step
Let results speak louder than frustration
Share your performance with them privately before it becomes public — build allies, not adversaries
Think: “You can trust me to deliver safely.”
🔄 4. Start Building Peer Coalitions
Find other citizens or businesses affected by similar bottlenecks:
Form an informal coalition or working group
Approach ministries together to propose reform pilots
Push for multi-stakeholder dialogues that include producers, STEM professionals, and regulators
Think: “Together, our voice builds credibility for change.”
🧠 5. Bridge STEM Thinking into Policy Rooms
Offer to run seminars, write explainers, or consult on regulations in your domain
Frame it as upskilling support for government — not an attack
Share case studies from countries that succeeded after modernising regulatory logic.
Click here to see a scenario of us in 20 years. This includes what happens if we keep the status quo or if we choose to pivot now.
Think: “Let’s update the rulebook, not just resist it.”
💡 Final Thought:
The goal isn’t to remove all regulations. The aim is to help the system identify unseen aspects. This way, it can regulate wisely based on risk, not fear. That’s how you shift from being ruled by red tape to co-creating enabling environments.
A Legacy of Transformation: Rare Inventions that Reshaped Society
In a world flooded with patents, we must pause and ask—how many of these innovations truly transform society? How many rise above mere technological advancement to alter the course of humanity? The answer is sobering: very few. And yet, these few carry a significance so powerful, they redraw the boundaries of what civilization can become.
Let us walk through history.
🏛️ Transformative Innovations Timeline (Including The Fifth Discipline Lineage)
Year
Innovation
Creator(s) & Age(s)
1776
Watt Steam Engine – mechanized industry
James Watt, age 40 (b. 1736) – improved Newcomen engine
1879
Electric Light Bulb – night-to-day society
Thomas Edison, age 32 (b. 1847) – carbon filament breakthrough
1903
First Powered Flight – airborne civilization
Orville Wright (30) & Wilbur Wright (36)
1920
Commercial Radio – mass real-time communication
Guglielmo Marconi, ~46
1947
Transistor – portable electronic revolution
Bardeen (39), Brattain (37), Shockley (37)
1956–1960s
Systems Dynamics – feedback modeling of systems
Jay Forrester, ~40s (b. 1918), MIT
1972
Limits to Growth – systemic view of global collapse
Donella Meadows, age 31 (b. 1941)
1970s–1980s
Organizational Learning & Mental Models – human systems
Chris Argyris, 50s–60s (b. 1923)
1990
The Fifth Discipline – integrating systems learning
Peter Senge, age 43 (b. 1947); with Fritz, Goodman, Kim, et al.
1991
World Wide Web – democratized global access to info
Tim Berners-Lee, age 36 (b. 1955)
These weren’t just inventions. They were tectonic shifts. They connected cities, lit up nights, launched economies, and opened the skies and data streams to billions. What set these eras apart wasn’t just ingenuity—it was intention. These inventors set their sights not on incremental improvement but systemic impact. They aimed not just to solve, but to transform.
🔹 Modern Innovation: Quantity Without Transformation?
China, the U.S., and Japan dominate filings, with rapid growth in artificial intelligence, climate tech, biotech, and smart devices. And yet, the sheer volume has not translated into societal transformation. Instead, we are witnessing the proliferation of “improvements” without integration, expansion without understanding.
In 2023, for the first time in 14 years, global filings dipped—perhaps a sign of market saturation, or a broader fatigue in invention without context (Reuters).
The challenge now is not invention—it is coherence.
🔧 The Fifth Discipline: Born From the Same Lineage
The creation of The Fifth Discipline was no accident. It was the culmination of more than thirty years of tacit learning and applied practice by post-war leaders who recognized that mechanistic and post-industrial thinking could no longer meet the complexity of the world emerging around them.
Peter Senge, working alongside mentors like Jay Forrester, Chris Argyris, Donella Meadows, and with peers such as Robert Fritz, Michael Goodman, Daniel Kim, Art Kleiner, and many others, shaped a body of work that emerged not from abstraction but from organisational trenches, classrooms, community engagements, and national institutions.
Through the 1960s to the early 1990s, this learning ecosystem matured at MIT and eventually led to the founding of SoL (Society for Organisational Learning). It was a new kind of invention: not a tool or device, but a discipline of disciplines, a human operating system for living and working together in complexity.
Like the radio and the web, The Fifth Discipline too is a transformative innovation. But it demands a different kind of engagement.
🌿 Tacit Knowledge: The Invisible Engine
Unlike codified knowledge—which can be written, standardized, and easily transmitted—tacit knowledge is embedded. It lives in motion, in application, in reflection. It is:
The wisdom to lead adaptively,
The skill of team learning,
The vision to hold complexity without collapsing,
The self-awareness that changes systems.
The Fifth Discipline rests on this tacit bedrock. It cannot be mastered through a 2-hour seminar or a single book reading. Its power lies in practice, and like the inventions that lit the world or lifted us into the skies, it requires time, patience, and deep intention.
⚡️ The Price of Codified Obsession
In a world hooked on speed and formula, we pay a steep price when we ignore tacit knowledge:
Leaders replicate failed solutions in new contexts
Policy cycles spin without lasting transformation
Organisations drift from purpose and stagnate in complexity
Social fragmentation deepens as systems outpace human sensemaking
Despite millions of inventions, we struggle to:
Stop the spiral of climate collapse
Close widening inequality gaps
Restore meaning to work and governance
The cost of losing The Fifth Discipline is not theoretical. It is a daily global expense in lives, wellbeing, and regenerative possibility.
🌍 A Call to Practitioners
Whether we work at the core or margins of The Fifth Discipline, we are heirs to a rich heritage and tapestry of transformation. We are not simply corporate leadership, trainers or consultants. We are stewards of a lineage that spans from the steam engine to systems learning.
Let us accord this work the space and depth it deserves. Let us meet it with the dedication it took to create it.
Because in doing so, we do not just study systems. We change them.
THE ANTI-THESIS: The Misjudged Simplicity of Deep Work
Too often, we assume that knowledge—especially the kind required for leadership and systems transformation—can be transferred in slides, soundbites, or summaries. But The Fifth Discipline is not that kind of work. It was never meant to be packaged, diluted, or consumed at speed.
UNDERSTANDING TACIT KNOWLEDGE
Tacit knowledge, unlike explicit knowledge, cannot be codified or easily conveyed. It lives in practice, reflection, embodiment, and often in the unspoken. Riding a bicycle, kneading dough, playing a violin—these are skills we acquire not by reading about them, but by doing them. Again and again.
THE ROOTS OF THE FIFTH DISCIPLINE: A Tapestry of Tacit Mastery
The creation of The Fifth Discipline was no accident. It emerged from over three decades of tacit learning, inquiry, and applied practice—primarily driven by early post-war scholars, practitioners, and industry leaders who watched the collapse of pre-war industrial management tenets in the face of a rapidly changing world. The post-World War II period saw not only the reconstruction of global economies, but a population boom and the emergence of unprecedented complexity in business, society, and technology. Traditional hierarchical models, which had served wartime economies, quickly began to show their limits in a more networked, volatile, and interdependent world.
This led pioneers such as Jay Forrester to develop systems dynamics at MIT in the 1950s—a new way to understand the nonlinear, feedback-driven behavior of complex systems. Donella Meadows expanded on this in the 1970s with The Limits to Growth, illuminating how system structures create persistent global challenges. Chris Argyris’s work on action science and organizational learning further emphasized the role of mental models and reflective practice.
Peter Senge, synthesizing and building on this lineage, collaborated with Robert Fritz, Daniel Kim, Michael Goodman, Art Kleiner, and many others to develop a holistic, practice-based framework for learning organizations. Their work unfolded across industries, education, government, and communities from the 1960s through the early 1990s. It culminated in the founding of the Society for Organizational Learning (SoL), initially housed at the Massachusetts Institute of Technology (MIT), which sought to institutionalize these principles in real-world settings.
THE MOMENT OF EMERGENCE: A Watershed in 1990
When Senge published The Fifth Discipline in 1990, it took the world by storm—not because it was flashy, but because it named what many already felt but couldn’t yet articulate. It offered an integrated way to see, think, and lead that resonated with a world beginning to feel the cracks of mechanistic, siloed models of management.
WHAT HE ENVISIONED: Mastery, Complexity, and Capacity
Senge envisioned future organizations as living systems—learning to handle more complex environments, motivated by their own evolving capacity to learn. Not just coping, but growing through challenge. Not just reacting, but cultivating systemic resilience.
WHAT ABOUT YOU? WHAT DO YOU WANT?
This is not a rhetorical question. Each of us, in coming to this work, must ask: What are we reaching for? Do we want the language of systems thinking—or the capacity? Do we want the titles and frameworks—or the transformation?
MATCHING DEPTH WITH DEPTH
My answer has been clear: to meet the depth of this work with equal commitment to learning it. I’ve studied it through one-day sessions, year-long programs, deep facilitation with originators of the field, and years of application. Each layer brought more agility, more groundedness, and more grace in applying the five disciplines—not as tools, but as a way of seeing and being.
THE BOOK IS NOT ENOUGH
Reading The Fifth Discipline cannot replace the practice it demands. If you want to embody this work, it must become part of you—your language, your inquiry, your response to life and complexity. That takes time. And practice. And courage.
THE INVITATION TO PRACTICE: Beyond the 2-Hour Workshop
This is not a 2-hour certificate program. The state of leadership, institutions, and systems today reflects that illusion. The kind of leadership the world needs now requires immersion, not consumption.
A CALL TO EDUCATION: The Work Belongs in Tertiary Institutions
We must elevate this work to the level it deserves. The Fifth Discipline should be embedded as a postgraduate program across global institutions. Let leaders take real time—months, not hours—to step into mastery, and emerge not just trained, but transformed.
THE PRICE OF CODIFICATION WITHOUT EMBODIMENT
Humanity is paying a steep price for its over-reliance on codified, explicit knowledge. We see it in:
Policy failures that repeat the same errors because deeper mental models are not examined.
Institutional burnout where staff are trained, but not transformed.
Climate action plans written in beautiful language, yet unable to shift entrenched systems.
Education systems that produce credentialed individuals but not adaptive leaders.
Health systems that understand illness biologically but not socially or systemically.
The consequence? We keep accelerating into crises without the reflexivity to course-correct.
Only a return to tacit learning, systemic awareness, and collective mastery will equip us to build and sustain futures worth living for.
If this speaks to your practice, your institution, or your leadership journey—reach out. The work ahead demands more than content. It calls for character, commitment, and the courage to learn together.
TWO ARMS OF HUMANITY: ONE TO MOVE FAST, ONE TO LEARN WELL
🔷 Refined Summary of My Reflections
In the mid-1990s, I encountered The Fifth Discipline at a time when the world—and particularly the Global North —was being swept into deeper currents of industrial management thinking. Although Senge’s work sparked waves of fascination among those exposed to it, many quickly abandoned the deeper discipline it called for. Younger generations, dislocated by rapid urbanization and modernization, were drawn instead into a culture of competition and individual advancement, fighting to secure the last slice of opportunity.
In Africa, this transformation took on unique contours. Industrialization arrived alongside digital connectivity, amplifying the speed and scope of change. Cohesion, once central to traditional societies, became increasingly tribalized—reserved for one’s group while fueling competition with others.
I do not advocate a return to the pre-industrial world. That is not the position of STRLDi. Rather, I believe it is time for humanity to evolve two arms:
One arm to move faster—leveraging tools, technology, and systems to increase capability.
And a second arm, even more vital, to grow in depth—guided by the Five Disciplines—to ensure speed does not outrun wisdom.
The five disciplines are not soft options. They are the infrastructure for quality, dignity, ecological sustainability, and social healing.
Personally, I have carried these convictions for decades. Yet only now, through seeing this body of work crystallized, have I felt a release—a kind of funeral for old worries. In their place, I feel clarity, renewal, and a deep commitment to helping build this “second arm” with others. I look forward to finding fellow leaders, thinkers, and builders to walk this path—so that together, we can lead The Fifth Discipline from the front.
📜 Draft Manifesto
“Learning Must Lead: Reclaiming Our Humanity in an Age of Speed” A STRLDi Declaration for Building the Second Arm of Humanity
Preamble
We, the signatories to this declaration, believe that humanity stands at a defining threshold: We are moving faster than ever, but not necessarily better. We are producing more than ever, but not necessarily regenerating. We are more connected than ever, yet not more coherent.
Technology, population growth, and economic systems have propelled us into an age of acceleration. But speed without direction, without depth, without awareness—leads to fragmentation and collapse.
Our Belief
We believe that the true leadership challenge of our time is not how fast we go, but whether we are learning as we go. And more than learning individually—we must learn systemically, collectively, and wisely.
Our Call
We call on fellow leaders, institutions, educators, and innovators to:
Honor the Five Disciplines not as metaphors or tools, but as living practices:
Personal Mastery – grounding vision and truth.
Mental Models – exposing our deepest assumptions.
Shared Vision – building futures together, not alone.
Team Learning – listening and learning across differences.
Systems Thinking – seeing the whole, acting on structure.
Build a second arm for humanity: One arm that moves fast. One arm that learns deeply. One to execute. One to integrate.
Our Commitment
We commit to shaping futures where:
Learning leads policy.
Dialogue shapes innovation.
Systems thinking anchors transformation.
Cohesion and regeneration replace competition and depletion.
We believe in futures that are not managed—but learned into being.
🤝 Fellowship Invitation (Draft)
🌍 Leading from the Front: Fellowship for Builders of the Second Arm
Are you someone who sees the limits of speed—and seeks the power of learning?
STRLDi invites a select cohort of 8–12 thinkers, leaders, and practitioners from Africa and across the globe to join a Founding Fellowship for the Second Arm of Humanity—a collective committed to advancing the Five Disciplines as foundational infrastructure for leadership, development, and societal coherence.
Purpose
To form a living community of practice that:
Explores, embodies, and applies the Five Disciplines across sectors.
Develops a shared timeline of our human learning journey.
Curates projects, policy responses, and learning tools for wider adoption.
Who This Is For
We welcome individuals who:
Lead in systems, not just roles.
Are tired of fragmentation and seeking depth.
Want to co-create, not just consume frameworks.
Fellowship Design
Duration: 9 months (first cycle)
Structure: Monthly deep-learning circles, shared readings, writing/journaling, and guest provocateurs
Outputs: Co-created knowledge map, case stories, and systems project prototypes
Location: Virtual core, with possibility of in-person convening (year-end)
Launch: Q4 2025
If this resonates, you are likely already part of the future we are building. Let us begin.
What we are describing is not only a strategic vision for the future of leadership—it is a spiritual turning point for how learning, systems, and wisdom must guide the speed of technological and social change.
Here are some structured suggestions to help all continue building this “second arm” of humanity—so that it leads, not follows.
🔧 1. WHAT YOU CAN DO NEXT — PERSONALLY AND INSTITUTIONALLY
a) Curate a “Learning the Five Disciplines” Fellowship
Invite 8–12 leaders, researchers, and young practitioners to co-learn and co-lead this arm.
Meet monthly around themes (e.g. Creative Tension, Mental Models in Economic Design, Team Learning in Governance, etc.).
Make it regional (Africa-focused) but globally open.
b) Create the STRLDi Timeline Map of Human Learning


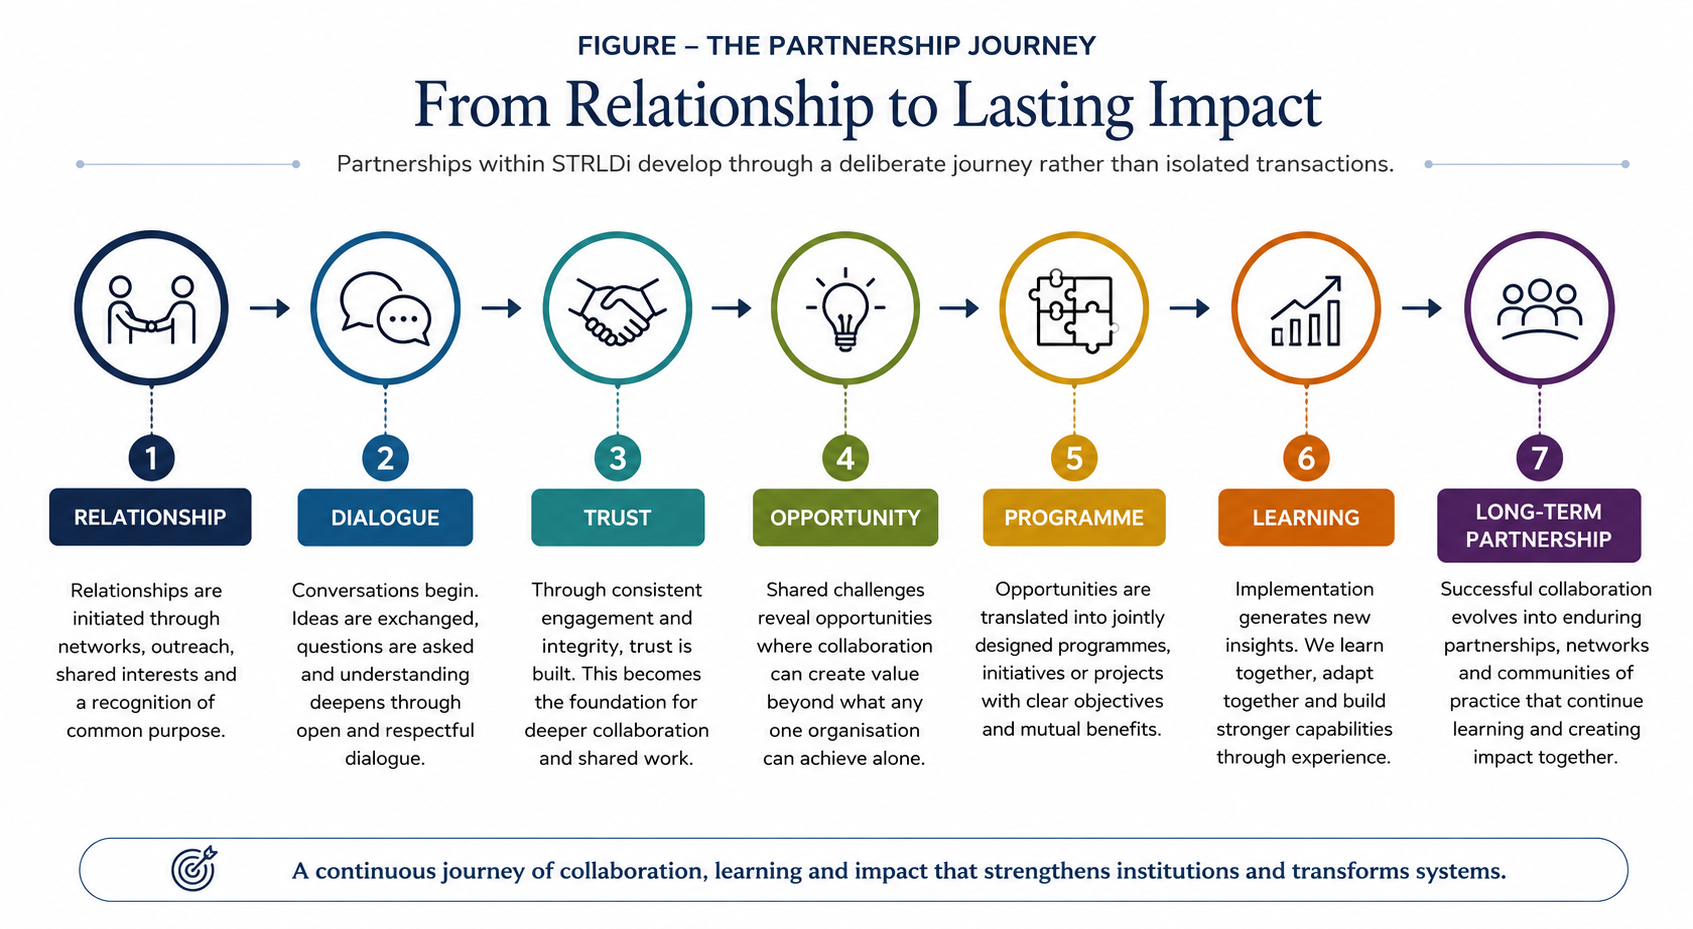
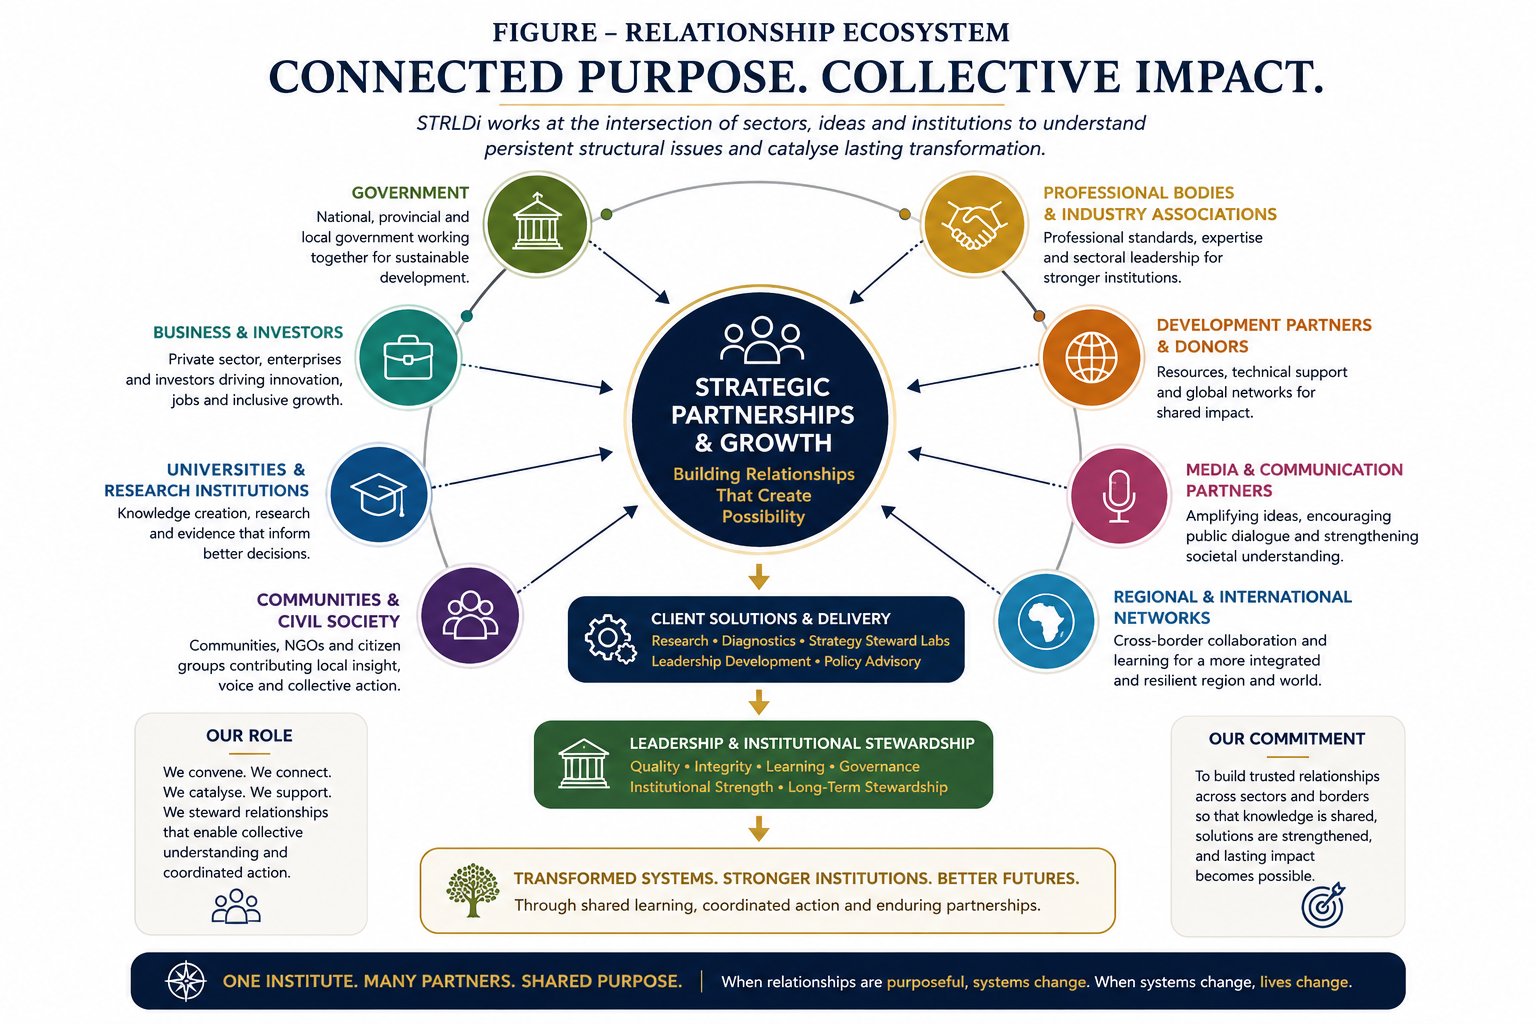
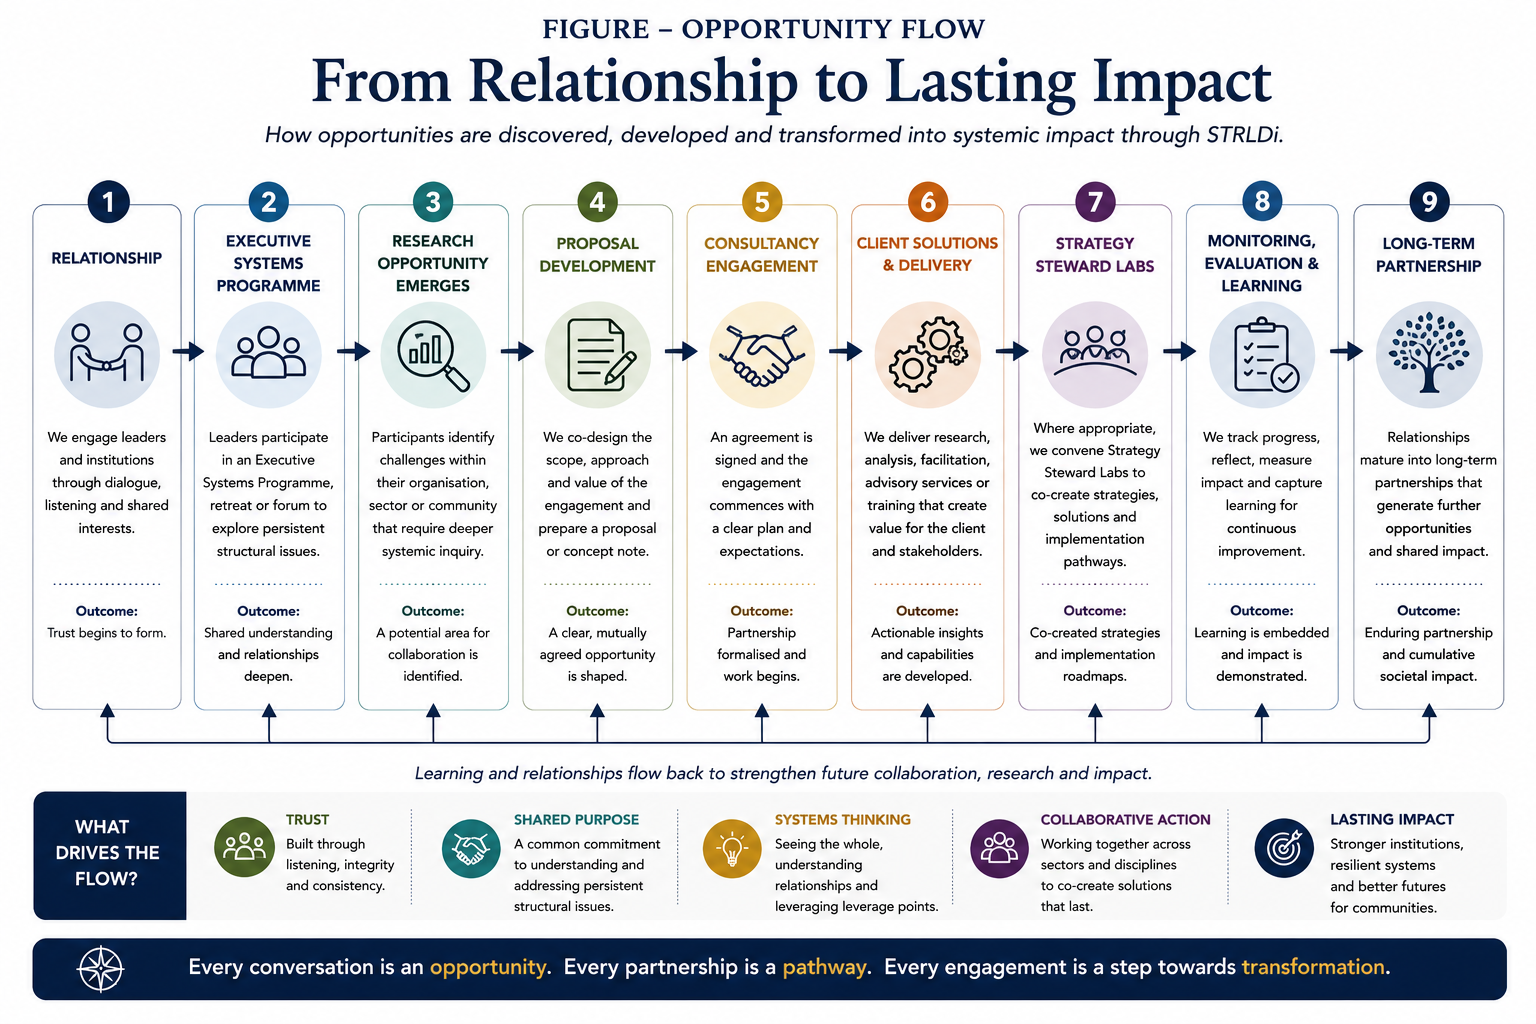


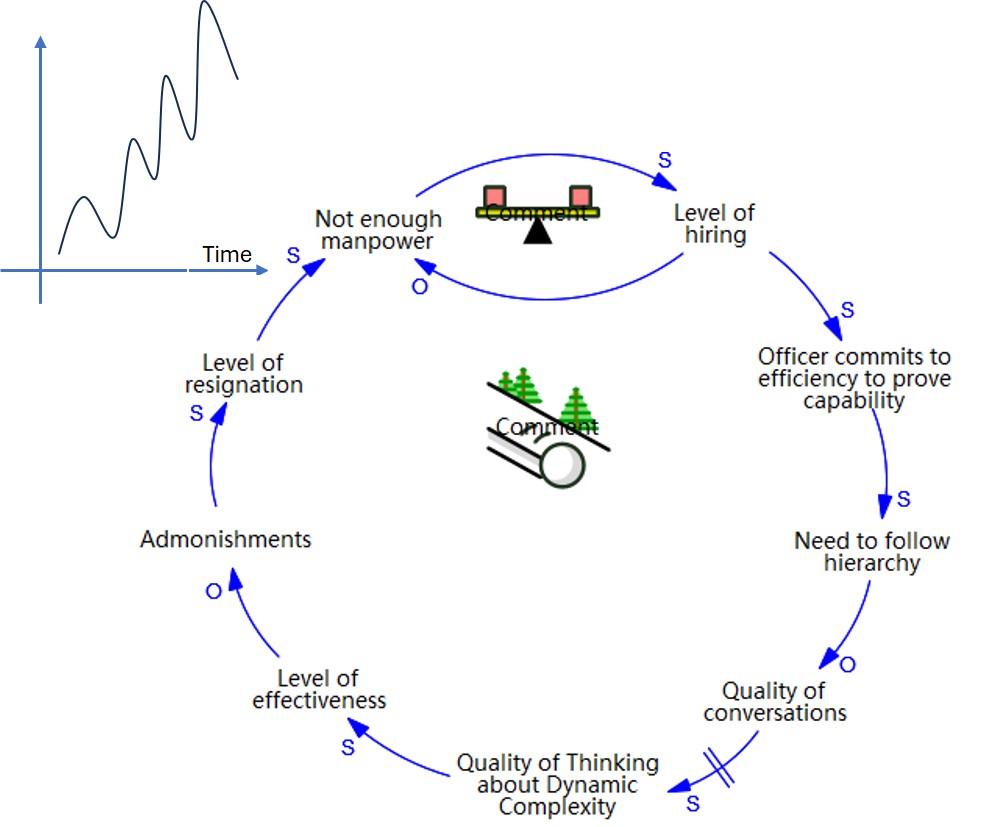

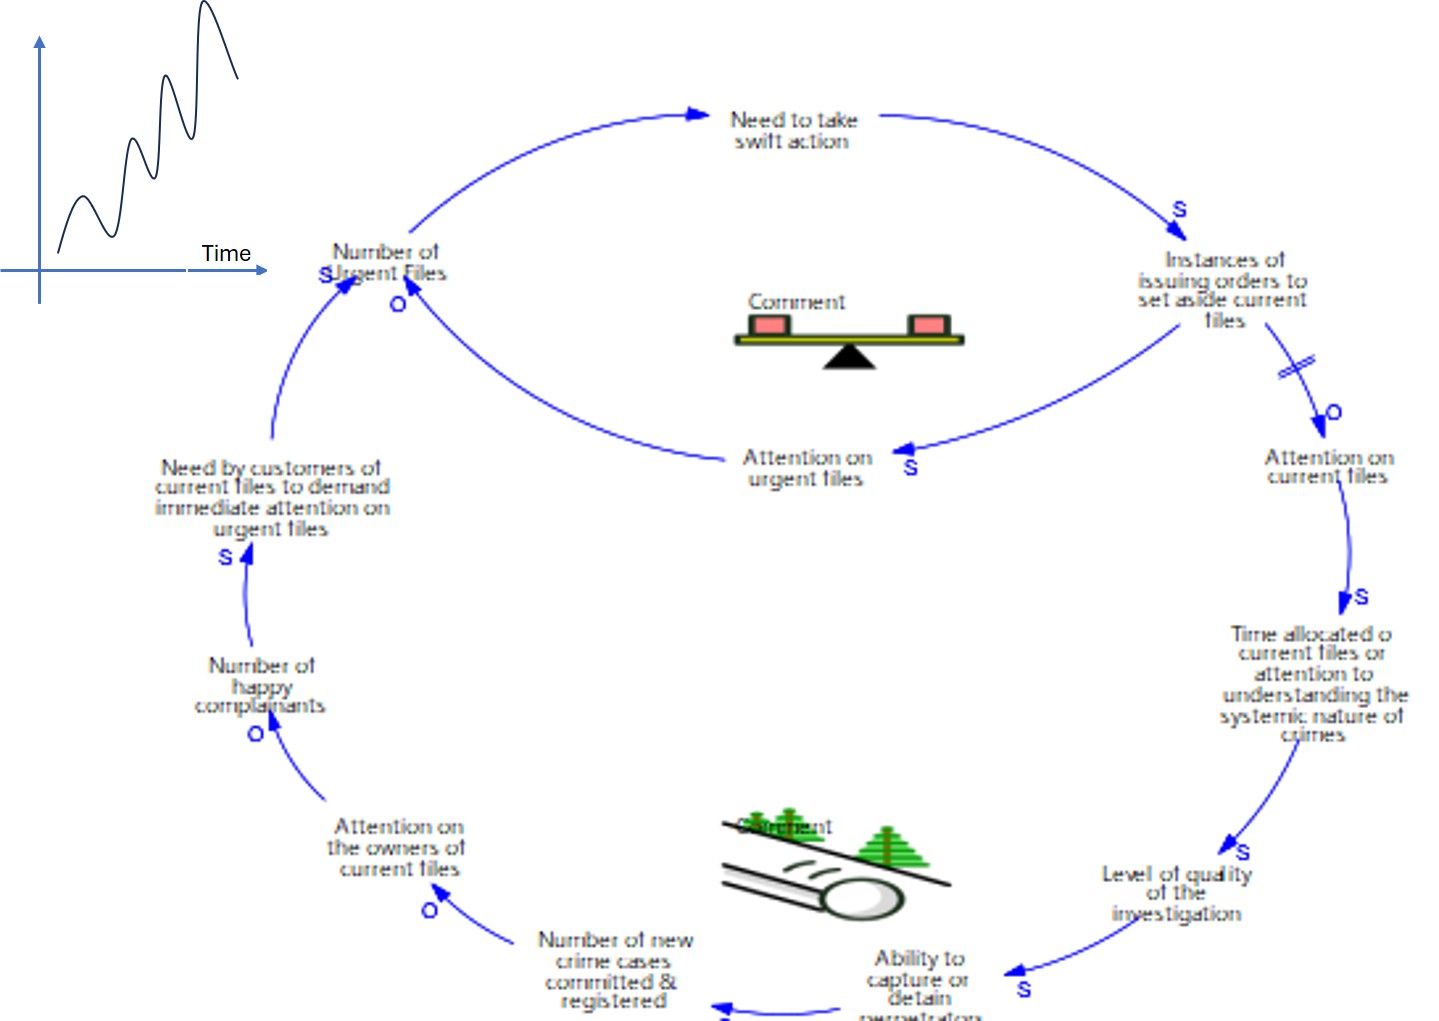


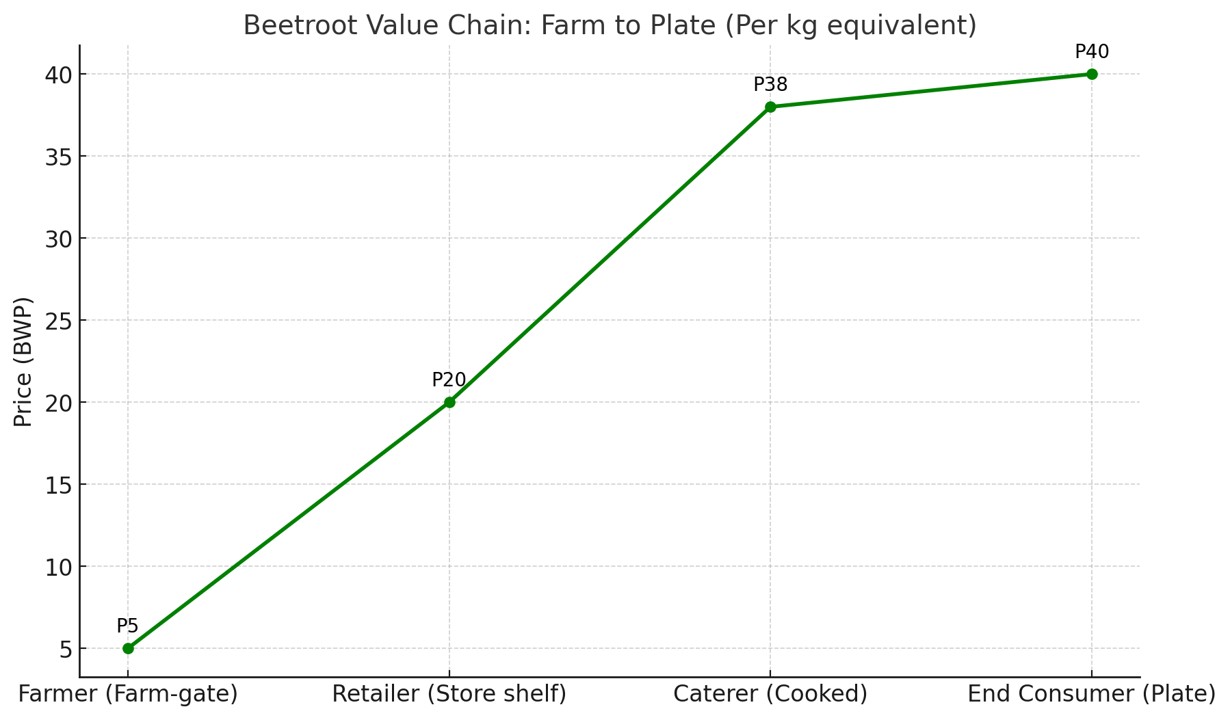


You must be logged in to post a comment.