Understanding Botswana’s Horticulture: Profit Dynamics Explained


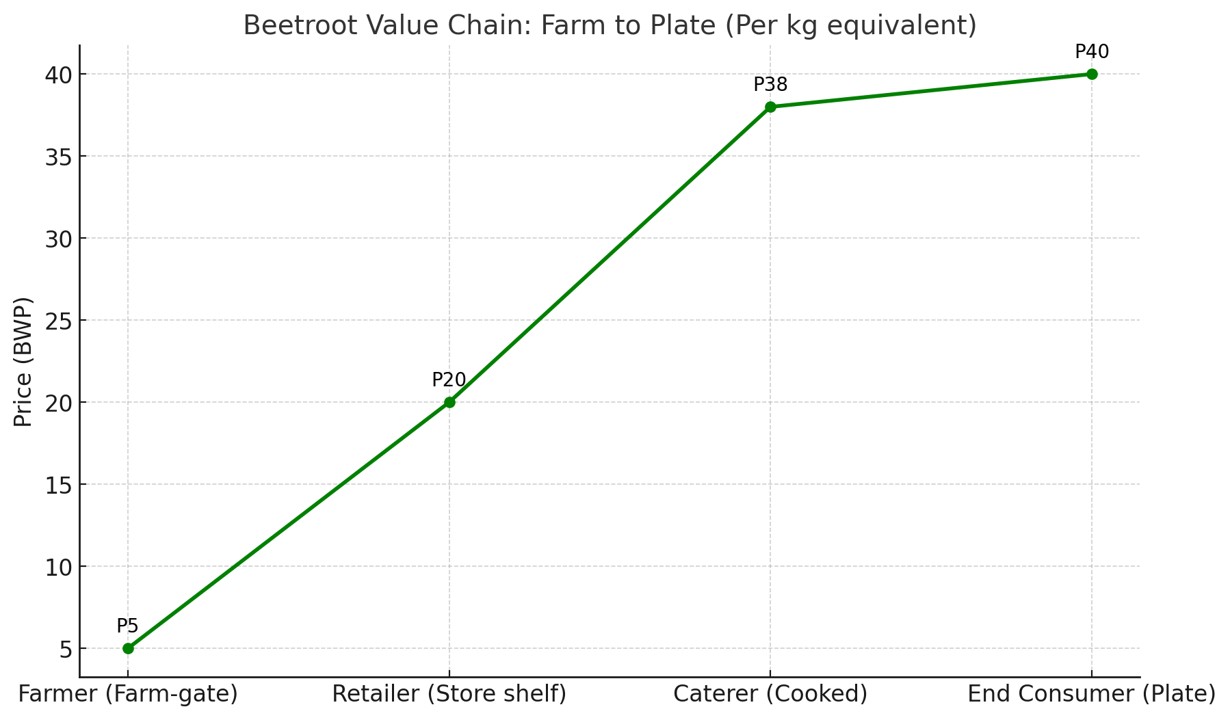
From P5 beetroot to a P40 plate—why profits “move but don’t grow” without a coordination spine.


When the Butterfly Sneezes: The Unseen Players in Botswana’s Food System


🌾 Farmer’s Voice — A Passion of Hope

“Once we finish planting, the imports come in. Prices drop to P3 a kilo.
We can’t dodge the same old crops — cabbage, tomato, butternut — and tunnels cost over P90 000.
Try niche crops, they say, but even herbs and radish sell for cents.
Retailers buy my produce at P3 and sell at P4–P20.
When will we ever break even?”
Farmer, Botswana (2025)

Inside this lament is not anger but a map of a missing system.
He is describing an uncoordinated market where imports collide with local harvests, costs outrun prices, and data never travels between field, retailer, and policy desk.
It is the voice of someone working hard within a structure that works against him — what he calls “a passion of hope.”
That hope deserves a system strong enough to hold it.


The thread flares up with emotion. Dozens of voices add their experiences — the weather, the labour costs, the diesel bills, the price of packaging. Some call for subsidies, others for stricter import bans. Others say forget the local market. Go the way of exports. This conversation happens repeatedly in farmer groups. It occurs month after month. Every time a price thread catches fire, the discussion resurfaces.

And yet, hidden inside those messages is a larger pattern — one that rarely gets named. Farmers argue about prices. However, the real leverage lies elsewhere. It is in the soil beneath them. It is in the productivity of the labour beside them. It is also in the structure of the state above them.

It is easy to think that solving the farmer’s problem begins with the farmer. But economics tells us otherwise: the points of highest leverage in a system are usually the least obvious.

Our farmers’ frustration is real. However, the forces that shape it are mostly invisible. This encompasses the movement of data between ministries. It also involves the management of soil biology, the training of labour, and the sustenance of coordination. The pain of one player in the system often begins in the silence of another.

This article quantifies each layer, shows the ripple when farm-gate rises, and identifies the leverage points that actually grow profit.


Three Learning from This Study

These three learning define the real work ahead. It is the work that, if we take care of it, will make these circular farmer–retailer–caterer conversations unnecessary. They form the foundation for the next phase of Botswana’s agricultural and economic development.


1. Reduce Production Costs to Global Competitive Levels

Our first task is to bring our unit production costs down from P5.50–P6.20 to around P3.00/kg, matching China’s cost base.

That P2.00 difference is significant. It represents a full P2 profit margin per kilogram of beetroot (and comparable crops). This margin currently leaks away in inefficiency.
We can only achieve this through regenerative practices, precise data coordination, and investment in mechanisation where it matters.

Outcome: Lower costs mean higher margins for farmers without raising consumer prices — the hallmark of a mature, competitive system.


2. Confront Productivity Honestly and Set National Targets for Labour

Our workers are not underpaid — they are undirected.

The value of their pay is being eroded not by exploitation, but by inflation born from low productivity.

We must stop pretending otherwise. We should begin publishing comparative productivity data. This data shows how Botswana’s average agricultural worker performs in kilograms per hour against peers in China, Malaysia, and India.

Then, set measurable targets:

  • Increase output per labour-hour by 20% within 3 years,
  • Match Malaysia’s productivity by year 7,
  • Halve the labour cost per kilogram by year 10.

Outcome: Higher real wages are built on productivity, not inflation. The workforce knows exactly what “competing globally” means in numbers, not slogans.


3. Rebuild the Country’s STEM Foundations Early

Here’s a clear and grounded explanation that moves step by step from STEM → Efficiency → Productivity → Prosperity.


🌱 a. STEM builds understanding — not just knowledge

STEM (Science, Technology, Engineering, Mathematics) teaches people how things work — not just what to do.

That shift in understanding is crucial.

  • Science helps workers grasp cause and effect (e.g., soil chemistry, pest cycles, plant physiology).
  • Technology provides the tools to measure, automate, and communicate those effects.
  • Engineering applies design thinking — how to improve irrigation, logistics, or packaging systems.
  • Mathematics enables measurement, optimization, and decision-making (costs, yields, probabilities, scaling).

Together, these disciplines cultivate systemic awareness — people start seeing connections, feedback, and waste.
And once you see inefficiency, you can eliminate it.

🔍 Efficiency begins the moment a person can measure and model reality accurately.


⚙️ b. Efficiency is the visible expression of STEM in action

Efficiency simply means achieving more output for the same or fewer inputs — time, money, energy, or labour.

STEM translates into efficiency in concrete ways:

STEM AreaPractical Impact on EfficiencyExample in Agriculture
ScienceUnderstanding soil, plant, and climate interactionsFarmers apply the right nutrients at the right time instead of over-fertilising.
TechnologyMechanisation, sensors, digital toolsMoisture sensors save 30% of water and improve yield by 10%.
EngineeringBetter designs, less frictionEfficient irrigation pumps reduce energy use by 20%.
MathematicsTracking costs, yields, and trendsFarmers identify unprofitable crops before planting.

🌾 Efficiency isn’t about working harder — it’s about working with reality instead of against it.


📈 c. Productivity is efficiency multiplied by scale

When efficiency becomes consistent and repeatable across many workers or farms, it turns into productivity.

  • Efficiency is doing things right.
  • Productivity is doing the right things, consistently, across the system.

STEM allows workers to perform better individually. It also helps them coordinate through shared data. They use standardised measurements and continuous feedback.

That coordination is what lets a country like China keep unit labour costs low even when wages rise. Every worker is plugged into an information-rich system. This system amplifies output.

🚀 Efficiency makes individuals productive. Coordination makes nations productive.


💰 d. Productivity creates wealth — sustainably

When workers produce more per hour:

  • Wages can rise without raising prices (because output per worker increases).
  • Borrowing costs drop (because the economy produces more value per unit of debt).
  • Inflation falls (because supply keeps pace with demand).
  • The nation grows without subsidies.

That’s why improving STEM education and data coordination in agriculture isn’t an “education policy” — it’s a macroeconomic strategy.

It turns a P5.50/kg farm cost into P3.50/kg not through subsidy, but through mastery.
It converts labour from a cost line into a competitive advantage.

🌍 STEM turns energy into knowledge, knowledge into efficiency, and efficiency into national resilience.


In short

StageQuestionAnswer
STEMHow do we understand the system?Through science, data, and reasoning.
EfficiencyHow do we reduce waste?By measuring, predicting, and designing better.
ProductivityHow do we grow sustainably?By scaling efficiency across people and systems.

By the time a child reaches tertiary education, it is too late to correct what was never built.
The state must raise the mathematical and scientific literacy of its entire school population, not just the top students.

Our national benchmark must focus on improving Botswana’s average school grades in maths and science. We aim to match the global leaders — Germany, Japan, China, India, and Singapore.

This shift will not just improve education outcomes. It will reset the country’s entire productivity curve. This change will influence how farmers measure yields. It will affect how engineers design systems. Additionally, it will shape how policymakers use data.

Outcome: A generation equipped not only to work harder, but also to think structurally. This creates the muscle memory that drives nations forward.


In summary

1️⃣ Lower costs through coordination and regenerative discipline.
2️⃣ Lift productivity through data transparency and measurable labour goals.
3️⃣ Rebuild national STEM capacity from the classroom upward.

These three actions will work together. They will reduce the noise and emotion of our current debates. Frustration will be replaced with focus. Short-term fixes will be replaced with long-term learning.


Bridging Forward

These three learning give us a compass.

They show where the real work lies. It is not in louder debates over prices or subsidies. It is in building structural strength where it has quietly eroded: cost efficiency, productivity, and foundational education.

The rest of this article explores the data and reasoning that bring these points to life.
It follows a single, ordinary beetroot as it travels from soil to plate. It traces how profit behaves and where it leaks. The journey also examines what happens when we add coordination, regeneration, and STEM capacity back into the system.

From the farmer’s field to the nation’s policy tables, every section connects a visible frustration to its invisible cause.

Together, they reveal why Botswana’s horticulture will only mature when learning, labour, and leadership align.


Table of Contents

When the Butterfly Sneezes – The unseen players in Botswana’s food system

Part A – The Ripple Effect: From the Farmer’s P 5 Beetroot to the P 40 Plate
 2.1 An Economic Observation
 2.2 Tracing the True Cost of a Beetroot: From Farm to Plate
  a. End Consumer – The Office Meal Plate
  b. Caterer – Turning Raw Beetroot into a Side Dish
  c. Retailer – The Hidden Middle Costs
  d. Farmer – The Starting Point
  e. The Complete Chain – Costs per kg of Beetroot
  f. What the Data Shows
  g. The Systemic Insight
 2.3 The Baseline System – When the Farm-Gate Price is P 5/kg
 2.4 When the Farmer Raises Price from P 5 to P 8/kg
 2.5 Comparative Margins Summary
 2.6 Where the Ripples Come From
 2.7 Structural Insight – Movement without Prosperity
 2.8 Bridge to Part B – Raising Productivity and Coordination

Part B – When the Butterfly Sneezes: The Unseen Players in Botswana’s Food System
 3.1 The Quiet Cause Behind the Farmer’s Cry
 3.2 Comparative Farming Economics – Conventional, Organic and Regenerative
 3.3 Labour Productivity and Cost – Botswana, Malaysia and China
 3.4 What Happens When Botswana Combines Regeneration with STEM and NHCS
 3.5 The Seven Players – and the Three We Forget
 3.6 Closing – When the Butterfly Sneezes

Core Takeaway – Changing how we see ourselves in the system


Part A: The Ripple Effect — From the Farmer’s P 5 Beetroot to the P 40 Plate

1. An economic observation

A kilogram of beetroot may seem like a simple commodity. Yet inside that red root is the entire economy of a nation. Six players each shape one another and are shaped by each other. When the farmer lifts her price by a few pula, it affects retailers and caterers. It impacts consumers and labourers. The state is also influenced by this change.

In a well-coordinated system, those ripples dampen quickly. In a disjointed one, they echo back and forth until everyone feels poorer.


Tracing the True Cost of a Beetroot: From Farm to Plate

Understanding why beetroot sells for P20/kg in retail requires unpacking every layer between soil and spoon. The farmer earns only P4–5/kg.

Contrary to the common assumption that retailers “keep the profit,” the real story is quite different. It involves cost absorption and system inefficiency rather than greed.


a. End Consumer – The Office Meal Plate

  • Plate price: ~P40 per meal.
  • Beetroot portion: ~100 g cooked (≈150 g raw).
  • Plates per kg raw beetroot: 6–7.
  • Value of beetroot portion: ~P6–7 per plate.

➡️ Effective consumer cost: ≈P40/kg equivalent of beetroot once it is part of a full plated meal.

Summary:
For the consumer, beetroot is not seen as a costly ingredient. It forms only one side of a balanced plate. Yet at P40/kg equivalent, the same vegetable has multiplied eightfold from the farmer’s original P5/kg sale.

Punchline: Consumers don’t see the strain because they see only the plate, not the chain.


b. Caterer – Turning Raw Beetroot into a Side Dish

  • Retail purchase price: ≈P20/kg.
  • Cooking shrinkage: ~30 % (1 kg raw → 700 g cooked).
    • Effective ingredient cost: P28–29/kg cooked.
  • Additional operating costs:
    • Cooking oil, vinegar, spices, gas/power: P4–5/kg.
    • Preparation labour (washing, peeling, cooking, cutting): P5–6/kg.
    • Delivery/logistics: P2–3/kg.
  • Total cost to caterer: ≈P38/kg cooked beetroot.

Summary:
At P38/kg, caterers are already operating near breakeven against a P40/kg recovery from the plate price.
Even a small rise in the farm-gate or retail price erases their profit entirely.
This is why caterers appear “price-sensitive”: they have no slack left in their margin.

Punchline: Caterers run on fumes; tiny upstream increases wipe out margin.


c. Retailer – The Hidden Middle Costs

  • Buying price from farmers: P4–5/kg.
  • Breakdown of additional costs (per kg of final retail price P20):
    • Transport from farm: P2 (≈10 %)
    • Cold storage, handling, and spoilage: P3–4 (15–20 %)
    • Store rent, energy, staff, packaging, compliance, shrinkage: P6–7 (30–35 %)
    • Net profit margin: P3–4 (15–20 %)

➡️ Real retailer profit: ≈P3/kg — not P16.

Summary:
What appears to be a wide gap between the farm and the shelf is mostly overhead.
Retailers operate on thin real profits while shouldering refrigeration, electricity, salaries, and spoilage losses.

If it were easy or profitable for farmers to sell directly, many would have done so long ago. Many would have seen 10-20,000 customers walk through their gates each day.
Retailing is a different business — capital-intensive, compliance-heavy, and risky.

Punchline: The “P15 gap” is mostly overhead and risk, not profit.


d. Farmer – The Starting Point

Typical production costs for small to medium beet farms in Botswana:

Cost ItemRange (P/kg)
Seeds & inputs0.80 – 1.20
Fertiliser & soil preparation0.80 – 1.00
Irrigation, energy & water0.60 – 0.80
Labour0.80 – 1.00
Harvesting & packaging0.50 – 0.80
Farm overheads0.50 – 0.70
Total Cost Range3.50 – 5.50

Summary:
At a selling price of P4–5/kg, farmers are operating at or below cost depending on yield.
This leaves no room for reinvestment in irrigation, labour, or expansion — keeping farms small and fragile.

Punchline: At P4–5/kg, farmers are at/under cost—no reinvestment cushion.


e. The Complete Chain – Costs per kg of Beetroot

LayerInput / Base Cost (P/kg)Selling Price (P/kg)Approx. Profit (P/kg)Notes
Farmer3.5 – 5.54 – 5≈ 0–0.5Breaks even at best.
Retailer4 – 520≈ 3Real profit ≈ 15 %; bulk absorbed by overhead.
Caterer (cooked)20 raw → 38 cooked40 (plate equivalent)≈ 2Extremely tight margin.
Consumer40Sees only final plate price, not the cumulative chain.

f. What the Data Shows

Retailers are not “keeping” P16/kg.
Most of that margin evaporates into transport, electricity, staff, and spoilage.

Farmers sell at or below cost.
They absorb biological risk without a financial buffer.

Caterers operate on fumes.
Their entire P40 plate price barely covers cooked beetroot costs once prep and logistics are included.

Consumers perceive stability, not strain.
They see the P40 meal, not the imbalanced structure behind it.

Punchline: Movement without prosperity.


g. The Systemic Insight

Every link is absorbing inefficiency because no national coordination spine connects them.

  • Farmers plant without market signals.
  • Retailers import unpredictably to fill gaps.
  • Caterers pay for inconsistency with higher costs.
  • Consumers face quiet inflation hidden inside the meal price.

Without coordination, the entire chain functions like a series of disconnected pumps. Each builds its own pressure. None drives flow.

In short:

The beetroot doesn’t cost too little at the farm or too much on the plate. It costs exactly what an uncoordinated system produces. This includes high effort, low reward, and invisible waste.


2. The Baseline System — When the Farm-Gate Price Is P 5/kg

Assumptions: 1 ha = 40 tons yield. Farmer production cost ≈ P 5/kg.

LayerInput Cost (P/kg)Ops & Handling (P/kg)Revenue (P/kg)Profit (P/kg)Margin (%)Commentary
Farmer5.005.00≈ 0.000 %Sells at cost; no cushion for loss or reinvestment.
Retailer5.0015.00 (transport + storage + staff + shrink + margin)20.003.0015 %Margin looks high but includes spoilage risk and unionised labour.*
Caterer (cooked)20.00 (raw)18.00 (cooking shrink + ingredients + labour + delivery)38.002.005 %Runs on thin margins; relies on volume.
Consumer (plate)38.00 (cost/kg cooked beet)2.00 (service + profit)40.00Pays P 40 for a full meal; beetroot one side dish.

Observation: Every layer is working, few are thriving. The system produces movement, not prosperity.

Although the spread between farm-gate and retail looks like a P15 margin, only about P3 /kg is actual profit.

*The rest — roughly P12 /kg — is consumed by transport, cold-storage energy, rent, packaging, spoilage, unionised wages, taxes, and compliance costs.

If selling direct were truly easy for farmers, many would have become retailers long ago. They would be seeing 10-20,000 customers walk through their doors daily. But retailing is a capital-intensive, risk-heavy business with constant overheads and perishable losses.

What appears as a profit gap is actually a reflection of two kinds of risk. One is biological risk on the farm. The other is logistical risk in the marketplace. Both need to be managed, not merely priced.


Punchline: When value chains lack coordination, profit behaves like water on an uneven table. It moves, but it doesn’t grow.


3. When the Farmer Raises Price from P 5 → P 8/kg

Farm-gate increase = +60 %. Each player reacts in turn.

LayerPrev Input (P/kg)New Input (P/kg)Ops & Handling (P/kg)New Revenue (P/kg)Profit (P/kg)Δ MarginCommentary
Farmer5583+60 % gainShort-term relief; higher gross but may lose buyers.
Retailer5815233–2 ptsPasses cost downstream; absorbs some shrink.
Caterer (cooked)202321440–5 ptsMargins collapse; must raise plate price.
Consumer (plate)4046–4846–48Faces +15–20 % inflation on meal price.

Observation: Farmer’s gain (+3 P/kg) triggers +15 % retail inflation and erases caterer margin.

Punchline: Farmer gains +P3/kg, caterer margin collapses, plate inflates +15–20%.


4. Comparative Margins Summary

LayerProfit (P/kg) @ P 5Profit (P/kg) @ P 8Change (%)Winner / Loser
Farmer03+ ∞Winner (short-term)
Retailer330Neutral
Caterer20–100 %Loser
Consumer+15–20 % costLoser
SystemNet –Weaker overall

Reflection: > Profit shifted location, not magnitude. Without coordination, the system cannot create new value — it only reshuffles scarcity.

Punchline: Price hikes shift profit location; coordination grows profit magnitude.


5. Where the Ripples Come From

Every pula that changes hands carries invisible costs:

  • Retailers carry storage, energy, staff, compliance.
  • Caterers carry shrinkage, prep labour, logistics.
  • Consumers carry wage pressures and inflation anxiety.

Prices rise at the base without productivity growth or coordination. Each downstream player protects itself by passing on costs. They cut quality or reduce labour.
The system tightens like a chain under tension; every link creaks.

As Linda Booth Sweeney wrote in When a Butterfly Sneezes, small events lead to other happenings. These happenings connect in surprising ways.

In Botswana’s horticulture, a three-pula sneeze at the farm-gate can shake the whole plate.

Punchline: A three-pula sneeze shakes the whole plate.


6. The Structural Insight

What this case shows is not greed but structure.

The cry of the farmer (“I can’t survive on P 5/kg”) reflects a missing element. The cry of the caterer (“I can’t sell a P 48 plate”) is the same. Both are echoes of a need for a coordinated system. This system should balance supply, demand, logistics, and labour.

When systems are tight, prices can rise and everyone still profit.
When systems are loose, even generosity becomes inflation.

Punchline: Tight systems can absorb price moves; loose systems convert generosity into inflation.


7. Bridge to Part B — “When the Butterfly Sneezes”

Raising prices cannot make a weak system strong. Only productivity and coordination can.

In Part B, we follow this beetroot deeper into the soil. We explore how regenerative practices, labour productivity, and the state’s STEM backbone can transform cost into capacity.

In the end, the farmer’s hand is not the only factor that shapes the price of a plate. It is also the mind of a nation learning how its parts connect.


(End of Part A – The Ripple Effect)

Now, let’s move to Part B: “When the Butterfly Sneezes — The Unseen Players in Botswana’s Food System.”


Part B: When the Butterfly Sneezes — The Unseen Players in Botswana’s Food System

1. The quiet cause behind the farmer’s cry

In Part A, we saw how a farmer’s small price change at the soil surface affects the entire chain. This change inflates costs and erodes profits downstream.

Yet those ripples begin even deeper. They originate in the unseen conditions of the soil. The skills of labor play a role, alongside the coordination of the state.

Linda Booth Sweeney reminds us in When a Butterfly Sneezes that small causes can have big effects. This is especially true in systems that are already under tension.

In Botswana’s horticulture, the “sneeze” is often invisible. It includes an under-trained workforce, an uncoordinated logistics chain, and a budget released without a plan.
Each seems small; together they decide whether every player profits or barely survives.


2. Conventional, Organic, and Regenerative Farming Economics

SystemYield (t/ha)Total Cost (P/ha)Cost (P/kg)Farm-Gate Price (P/kg)Revenue (P/ha)Profit (P/ha)Profit Margin (%)Commentary
Conventional30165 0005.5–6.05.5–6.0180 00015 0008–9 %High synthetic inputs and fuel dependency; yields fluctuate with weather and pest cycles.
Organic (Certified)28210 0007.0–7.57.5–8.5224 00014 0006–8 %Conversion and audit costs; lower yield; depends on sustained premium demand.
Regenerative40190 0004.8–5.25.8–6.0240 00050 00020–22 %Inputs fall 10–25 % by Year 3; soil structure and water efficiency raise yield; most resilient long-term.

(Baseline: 1 ha beetroot, open-field, Botswana; currency = BWP.)

Punchline:

Regeneration earns more not by charging more but by wasting less.
It restores both soil and solvency.


3. Labour Productivity and Cost — Botswana, Malaysia, and China

Step 1. Setting up the context

To understand how labour costs and STEM productivity shape competitiveness in regenerative (Regen) vs conventional farming — comparing Botswana to:

China (low-wage, high-productivity, strong STEM coordination), and

A non-distant, STEM-strong peer — a country shares closer institutional and social structures with Botswana. This country has managed to integrate STEM deeply into agriculture.

📍 Suitable comparison: Malaysia

Why Malaysia?

  • Not culturally or politically “distant” (multi-ethnic, developing economy, democratic institutions).
  • Has STEM integration across education, manufacturing, and agro-technology.
  • Mid-level wages (not as cheap as China, not as high as OECD).
  • Strong public-private coordination in horticulture and food exports (e.g., Cameron Highlands vegetable clusters).
  • Realistic aspiration path for Botswana’s next 20 years.

Step 2. Approximate labour costs

CountryAverage Agricultural Wage (BWP equivalent/hr)Avg Monthly (BWP)Remarks
BotswanaP20–25/hrP4,000–5,000Labour market tight; strong unions push for steady increases; relatively low productivity/hour.
ChinaP10–12/hrP2,200–2,500Lower nominal cost, but very high labour productivity due to tech, mechanisation, STEM oversight.
MalaysiaP15–18/hrP3,000–3,600Balanced wages with higher output per worker (mechanised, digitally managed farms).

Chinese wages are half those of Botswana. However, their output per worker is often 3–4× higher. This means the unit labour cost per kg of produce ends up far lower.


Step 3. Labour cost per kg of beetroot (by system)

Let’s assume 1 hectare beetroot with ~40 tons yield (regenerative steady-state), ~30 tons (conventional).
Farm labour hours include planting, maintenance, irrigation, harvesting, grading.

Country/SystemLabour Hours/haWage (BWP/hr)Labour Cost/ha (P)Yield (tons/ha)Labour Cost/kg (P)
Botswana – Conventional1,0002222,000300.73
Botswana – Regenerative1,2002226,400400.66
China – Conventional700117,700400.19
China – Regenerative850119,350450.21
Malaysia – Conventional8001612,800350.37
Malaysia – Regenerative9501615,200420.36

🌍 Observations

Unit labour costs per kg

Botswana: ~P0.65–0.75/kg

Malaysia: ~P0.35/kg

China: ~P0.20/kg

China achieves triple the efficiency despite lower pay, due to STEM-driven mechanisation, logistics integration, and continuous R&D feedback loops.

STEM intensity equals productivity

China: tech platforms link field to market daily.

Malaysia: medium-tech, government coordination, farmer co-ops with digital traceability.

Botswana: strong individual farmer effort, but low integration — data and skills sit in silos.

Regen effect

Regenerative increases labour slightly (10–20%) but offsets through yield and soil stability.

Over time, Regen reduces unproductive labour (weed management, pest crisis responses) — smart work, not harder work.

Punchline: Productivity isn’t hand strength; it’s system clarity.


Step 4. Total cost comparison (farming system + labour + inputs)

Country/SystemTotal Cost/kg (P)Key Cost Drivers
Botswana – Conventional5.5–6.0Inputs & labour dominant, low mechanisation.
Botswana – Regenerative4.8–5.2Lower inputs, higher yield, slightly more labour.
China – Conventional2.8–3.2Scale, automation, supply-chain optimisation.
China – Regenerative3.0–3.4Balanced system with government incentives, compost integration.
Malaysia – Conventional3.8–4.2Efficient mid-cost structure, cooperative marketing.
Malaysia – Regenerative3.5–3.8Integrated supply systems, stable yields, lower loss.

Punchline: The multiplier is coherence, not cash injection.


Step 5. Interpretive insight

  • Botswana’s challenge is not wage level — it’s output per hour.
    We pay similar to Malaysia. We pay more than China. However, we produce only half the output because the STEM backbone and coordination spine are missing.
  • Regen alone is not enough. It must be coupled with STEM discipline — data, measurement, systems, integration.
  • STEM turns Regen into strategy; without STEM, Regen becomes romantic.

💡 The Takeaway

A beetroot farmer in Botswana may spend the same on wages as a farmer in Malaysia. However, they produce half as much per hectare. The difference is not the hand. It is the system guiding it. STEM is present at every level, from soil testing to national logistics.


China’s system multiplies each worker’s output through data and coordination. In contrast, our system still isolates the worker. It also isolates the farmer and the policymaker. Until we bridge that gap, we will continue to pay more per kilogram. We will earn less per hour, even though our farmers work just as hard.

Our national goal should be to bring production costs down from the current P5.50–P6.20/kg to P3.50–P3.80/kg within the first three years, and to reach P3.00–P3.40/kg beyond the third year.

By the time we arrive at those levels, others will already have lowered theirs further — because efficiency compounds. It’s what athletes and craftsmen call muscle memory. When they train their muscles to work efficiently, those muscles become faster and stronger.


Country / SystemAvg Wage (P/hr)Labour Hours/haLabour Cost/ha (P)Yield (t/ha)Labour Cost (P/kg)Total Cost (P/kg)Commentary
Botswana – Conventional221 00022 000300.735.5–6.0High wage relative to productivity; weak mechanisation and coordination.
Botswana – Regenerative221 20026 400400.664.8–5.2More labour initially, but yield compensates; creates skilled rural jobs.
Malaysia – Regenerative1695015 200420.363.5–3.8Medium wage, high STEM application; co-ops and digital traceability improve efficiency.
China – Regenerative118509 350450.213.0–3.4Low wage, strong coordination and automation; highest output per worker.

Reflection

Productivity is not the strength of the hands but the clarity of the system guiding them.
Botswana’s labour is not expensive — it is under-directed.


4. What Happens When Botswana Combines Regeneration with STEM

If Botswana’s 30 % horticulture land (≈ 3 million ha) shifted gradually toward regenerative practices under a National Horticulture Coordination System (NHCS):

Year% Regen AdoptionYield Gain (%)National Profit (BWP Bn)Change vs Status QuoCommentary
320+10126BaselineSystem still fragmented.
540+20162+36 Bn (+29 %)Early NHCS coordination; farmer mentoring; visible GDP effect.
1060+35198+72 Bn (+57 %)STEM-trained labour expands; data informs planting calendars.
2080+50234+108 Bn (+86 %)Full coordination spine; stable markets; rising rural incomes.

Reflection

When the state learns to see the system as a whole, national profits rise without raising prices.
The real multiplier is not money injected, but coherence built.


5. The Seven Players — and the Three We Forget

The painful truth is that the areas of highest leverage are often the least obvious. It is easy, as the farmer groups show each week, to toss around ideas about prices, inputs, and retail margins. Yet the power to change those pains lies elsewhere. It resides quietly in the soil. It is found in the discipline of labour and in a state that directs its STEM muscle towards agriculture.

Labour must recognize itself as more than a voice demanding fairness. It must actively participate in a global race for productivity. It is not enough to speak for higher pay when output per hour remains low. Economics cannot do miracles where labour does not first do the work itself. If productivity stalls, the entire economy suffers. Borrowing costs rise. Inflation creeps in. Every other player absorbs the shock. The wages labour receive will never be enough.

The state, meanwhile, must rediscover its long-term role as the system’s conductor. Its task is not only to distribute budgets. It must also direct STEM intentionally into agriculture. This will ensure that data, measurement, and research become daily tools of governance, not rare events.

That begins with a national shift in education. This involves playing down the dominance of non-science subjects. It also means raising the quality of mathematics and science across the board. These improvements are necessary not only for the best students but also for the average classroom. When the median student performs at the world’s upper quartile, the nation’s productivity begins to move.

In systems thinking, we say that small changes can create big results. However, finding those points of leverage is never easy. They hide in places we are least likely to look. The tip is simple: look around the room and ask who is not there. Then listen for their voices. That is where the answers often lie.


The Seven Players — and the Roles They Play

THE FORGOTTEN THREE:
The State – the unseen conductor that sets rhythm, measures, and accountability.
Labour – the hands that transform coordination into productivity. This productivity surpasses the world.
Soil – the quiet foundation; holds memory, fertility, and future yield.

WHERE WE FOCUS OUR ATTENTION:
Farmer – creates value from soil through skill and risk.
Retailer – connects that value to the market.
Caterer – translates produce into meals and employment.
Consumer – completes the loop through demand and choice.

When only the first four talk, profits fight.
When the last three join — the soil, labour, and the state — profits multiply.

In systems, the highest leverage actions are rarely found in reacting to events (e.g., “raise prices,” “import more”).

They are found in changing the relationships and information flows between parts. Soil, labour, and the state communicate and learn together.

Lesson: The “butterfly sneeze” for Botswana may not be more funding but better integration — data, training, and trust.

The system stabilises not when prices rise, but when learning, labour, and leadership align.

Punchline: When only the obvious four talk, profits fight; when soil, labour and state join, profits multiply.


6. Closing — When the Butterfly Sneezes

A small change in how we train a worker may seem trivial. Measuring soil moisture or aligning crop calendars might also seem insignificant — like a butterfly’s sneeze.
But in a fragile system, that sneeze decides whether the chain trembles or holds steady.

The path ahead is clear:

Only then will every player — farmer, retailer, caterer, consumer, labour, and state — earn enough to rest easy, together.

Core Takeaway

The deepest leverage lies not in the next policy. The real change comes from altering how people see themselves in relation to one another. It also involves helping the “silent players” (soil, labour, state) regain their voices in the story.


(End of Part B – When the Butterfly Sneezes)

🪜 Botswana’s Horticulture Value-Chain Ladder — The Seven Players

Each step adds value, risk, and responsibility. The question is not who profits most — but who holds the leverage to make the entire chain prosper.

🔁 Interdependence Summary

PlayerType of Value Added% Influence on Final CostHidden Leverage
SoilEcological~25%Regeneration & moisture retention
FarmerProduction~20%Efficiency, timing, data accuracy
RetailerDistribution~20%Cold-chain & sourcing coordination
CatererTransformation~10%Waste reduction, menu design
ConsumerDemand signal~10%Conscious purchasing, feedback
LabourProductivity~10%Skills, STEM application
StateGovernance~5% (but systemwide)Coordination, STEM, NHCS backbone

🪶 Reflection

A nation’s horticulture isn’t defined by the quantity of crops its farmers grow. Instead, it is defined by how well its seven players learn to work together.

Profit stops fighting when soil, labour, and the state are invited back into the conversation.
The rest — farmers, retailers, caterers, and consumers — can then finally share in what the system creates.


I Can Sleep When the Wind Blows: What Botswana’s Horticulture Needs Beyond Funding & Allocations


There is an old parable titled “I Can Sleep When the Wind Blows.”

I Can Sleep When the Wind Blows | Shayne M. Bowen | 2018

A farmer hires a young hand. Each night, no matter the weather, the young man goes to bed early. When a storm finally breaks, the farmer panics. He runs to check the fields. However, he discovers that the barn doors are fastened. The tools are secured. The animals are sheltered. The hay is tied down. Everything had been prepared. The young man could sleep when the wind blew, because his work was already in order.


Budgets without backbone

Currently, I observe the following trends in the country. All governments, past and present, have focused mainly on budgeting and disbursing the funds they receive. The machinery is geared to release money and “create a conducive environment.” It monitors. But it does this without actually planning the industry itself.

That is a shame. Because when we avoid planning the industry, we trap ourselves in an endless cycle:

  • cash allocations that don’t yield repayment,
  • borrowers who appear to build assets with money that does not belong to them,
  • and a country that thickens its skin the next time it seeks funding — all without seeing real economic growth.

There is also an unspoken hope that we will be let off the hook because “we are Africans.” But finance does not forgive weak structures.


Dividing what should be united

Each cycle, allocations are trumpeted to youth, women, and farmers. But in reality, these three are not separate categories — they are a family. Women and youth are embedded in family farms. To slice them into compartments for the sake of budgeting is not only wasteful, it is divisive.

True industry planning does not start with who gets the allocation. It starts with building the backbone that ensures profitability for all: demand mapping, planting calendars, logistics, markets, and reinvestment. Once this spine is in place, the benefits naturally flow to every farmer — whether woman, youth, or elder.


Why the backbone is ignored

The deeper reason this backbone is overlooked is the dichotomy we live with as a nation. We underplay the role of STEM in our economy and agriculture. Yet agriculture is one of the industries that most demands a STEM-disciplined approach. This ranges from governance structures down to the farmer’s choice of seed.

When land and GDP are tended by hands guided by STEM discipline, they produce predictability, scaling, and growth. When managed without it, results fluctuate with the weather, pests, and luck.


One hectare, two futures

To make this real: take two farmers, each with 1 hectare.

  • The STEM-hardwired farmer runs soil tests and balances water precisely. She selects the right seed for climate and disease. She also manages pests with foresight. Over five years, her profits grow steadily from BWP 80,000 to over 100,000.
  • The non-STEM farmer plants by habit and intuition. Some seasons bring decent returns, others collapse under shocks. Over the same period, his profits swing wildly, sometimes as low as BWP 5,000.

One farmer can reinvest and scale. The other cannot.


STEM as the Backbone

Agriculture is not only about soil and seed — it is about systems, and systems require STEM discipline. From governance down to the individual farmer, STEM makes the difference between sustained growth and endless frustration.

On the farm — with STEM

  • Seed selection: Matching varieties to soil type, climate, and disease resistance using agronomic trials and data.
  • Water management: Irrigation calibrated to evapotranspiration rates, soil moisture sensors, and seasonal rainfall models.
  • Fertilisation: Nutrient application based on soil chemistry analysis, preventing both waste and depletion.
  • Pest management: Integrated pest management (IPM) using monitoring thresholds and biological controls rather than reacting late with chemicals.
  • Scaling: Precision data provides confidence to expand from 1 ha to 2, then 10 — with predictable margins.

On the farm — without STEM

  • Seeds chosen by habit or availability, vulnerable to climate shifts.
  • Irrigation by “eye” — too much or too little water.
  • Fertiliser applied reactively, causing soil exhaustion.
  • Pests noticed too late, leading to crop loss or costly sprays.
  • Scaling is a gamble; banks are hesitant to lend.

The result? Inconsistent yields, poor profitability, and farmers dropping out of horticulture.


In the system — with STEM

  • Data pipelines: Retailers share weekly SKU-level demand, analysed and published as crop calendars.
  • Forecasting: National dashboards project shortfalls or surpluses, triggering clear import or storage policies.
  • Logistics design: Cold chain hubs placed using flow models of supply vs. demand, not guesswork.
  • Finance: Lenders and insurers trust the system because data reduces risk.

In the system — without STEM

  • Ministries working in silos — Agriculture with farmers, Trade with retailers, no shared demand–supply map.
  • Imports opened or closed arbitrarily, undercutting local farmers.
  • Collection centres built as afterthoughts, often underused because produce doesn’t match demand.
  • Credit extended, but repayment fails because profitability was never secured.

The absence of STEM discipline is what gets in the way of building the coordination systems horticulture requires. Without it, money flows — but growth stalls.


👉 This section shows concretely: STEM is not just a “nice-to-have” in farming. It is the backbone of both productivity and coordination.


Scaling to the nation

Now imagine horticulture taking 30% of Botswana’s crop land (≈3 million ha), with STEM adoption rising over time.

YearSTEM Area (ha)Non-STEM Area (ha)STEM Profit (BWP Bn)Non-STEM Profit (BWP Bn)Total Profit (BWP Bn)
3600,0002,400,00054.072.0126.0
51,200,0001,800,000108.054.0162.0
101,800,0001,200,000162.036.0198.0
202,400,000600,000216.018.0234.0

With a STEM backbone, national profits rise steadily and reinvestment becomes possible. Without it, volatility, waste, and default persist.


What leadership requires

The leader who takes this on will not just fix horticulture. They will demonstrate that Botswana can move from funding to building industries that plan and re-fund themselves.

That leader will be remembered for building the industry spine. It was the system that allowed farmers, families, and the nation to reinvest. It let them scale and finally sleep when the wind blows.


Closing thought

Botswana does not lack hardworking farmers. It lacks the discipline of coordination and STEM-driven planning that secures the barns before the storm. If we build that spine, we can turn volatility into predictability, allocations into industries, and families into investors.

Then, and only then, will we all be able to say:

“I can sleep when the wind blows.”


Horticulture Farmers Can’t Plant Blind: Why Botswana Needs a National Horticulture Coordination System


She had done everything right.

Bought the seeds. Paid for inputs. Hired labour. Measured every drop of water. Watched over her crop with the kind of personal care only farmers understand. After weeks of nurturing, her cherry tomatoes gleamed on the vines — plump, red, and ready.

She took them to the retailer who once told her, “When you have them, bring them.”
But when she arrived with her harvest, the same buyer turned her away.

“Who placed an order for cherry tomatoes?” the retailer asked.

No order meant no sale. Hours of sweet labour, investment, and determination — side-stepped.

And here’s the bitter twist (and a true story). Those very tomatoes had just won first prize at the national agricultural show. The nation had applauded her produce, yet her local retail shelves never saw it. By the time the retail chain placed its order, it was for imported cherry tomatoes. They simply did not know that, in their own backyard, a farmer was already producing prize-winning fruit.


Why this matters

This is not just one farmer’s story. It is a mirror of the system we all work within.

  • Horticulture farmers plant blind, not knowing what demand will look like when the crop matures.
  • Retailers scramble, relying on imports because there is no coordinated calendar of who is growing what, where, and when.
  • Policymakers toggle between bans and openings, without a real-time picture of supply gaps or gluts.

The result? Crops are wasted in fields. Empty shelves in shops. Rising import bills. And declining confidence among the very farmers we need to carry this sector forward.

The bigger issue

This story is not about one farmer. It is about a system where demand lives with Trade. Supply oversight sits with Agriculture. The bridge in between is missing. Farmers plant in hope, retailers stock in panic, and national policy oscillates between bans and openings.


How did other countries solve this?


How other countries broke the cycle

  • Netherlands: transparent flower and vegetable auctions give growers and buyers the same daily data.
  • Spain’s Almería region: cooperatives coordinate planting schedules, logistics, and marketing so no farmer is left stranded.
  • Kenya: a single horticulture directorate oversees both production and marketing, ending the “split brain” between ministries.
  • India’s Operation Greens: real-time demand intelligence and price stabilization prevent wipeouts from gluts and shortages.

This picture (which shows the split between Ministry of Agriculture and Ministry of Trade, and the missing coordination in the middle):

Note:
This picture highlights a critical gap in Botswana’s horticulture sector.

  • On one side of each vertical line, the Ministry of Agriculture oversees farmers, extension, and production.
  • On the other, the Ministry of Trade manages retail, imports, and demand data.
  • In the interim, there is no coordinating mechanism. It is unclear who grows what, where, and when to match the actual demand in shops and institutions.

The result is wasted crops, empty shelves, and farmers discouraged from investing further.

A National Horticulture Coordination Unit can bridge this gap. It links production to market demand. It publishes clear crop calendars. This unit ensures imports are guided by real data—not guesswork.

Without this bridge, farmers will continue to plant blind. With it, Botswana can move from meeting 70% of its demand to achieving 100% and beyond.


Each of these countries built what Botswana lacks. It is a coordination spine that maps demand to supply. This gives both farmers and retailers a reliable compass.


What Botswana can do

Establish a National Horticulture Coordination Unit – jointly housed by Trade and Agriculture, with clear legal authority.

Publish a Horticulture Market Observatory – weekly retailer data (sales, volumes, gaps) made visible to farmers and policymakers.

Issue crop calendars by district – so farmers know when and how much to plant.

Invest in packhouses and cold chain hubs – so produce doesn’t die at the farm gate.

Set transparent import triggers – clear rules on when imports open and close, avoiding last-minute surprises.


We found several existing or emerging initiatives in Botswana. They partly touch on what we’re describing. Some are close to the supply-demand pipeline we want to build. Others are still missing elements. These might be things you can link into or build upon.


Snapshot: what exists, strengths, and gaps

Initiative (owner)What it coversStrengths we can leverageGap vs. “coordination spine”Quick next step
Letsema Horticulture Market (Gaborone, Block 3)Centralized wholesale-style market; farmer aggregation; quality/price transparency ambitions.Physical node; recognizable brand; farmer access; early digital footprint. (Letsemahm)Not yet a nationwide demand-forecast or pre-order system; weak link to retailer SKU forecasts and planting calendars.Pilot weekly pre-orders from major retailers + simple demand dashboard posted every Friday.
Tokafala Horticulture Programme (Debswana)A 3-year, demand-driven horticulture program to support SMMEs.Explicit demand orientation; private-sector discipline; delivery capacity. (Debswana)Not yet publicly tied to national import rules or district planting calendars.Invite Tokafala to share anonymized demand signals to a public Market Observatory (see below).
PYEC – Horticulture Readiness (OP/PSRU)TVET + change-management workshop to stream youth into horticulture.National convening power; change-management tooling; youth pipeline. (Your doc.)On-ramp for talent, but no market-signal backbone—risk of youth repeating old frustrations.Make “Market Observatory + crop calendars” a deliverable of PYEC’s action plan.
NAMPAADD (MoA)Long-standing plan to modernize arable agriculture; identifies under-used horticulture potential and calls for coordinated cropping.Policy legitimacy; extension footprint; precedent for coordination. (FAOLEX Database)Never fully operationalized into weekly demand data, rules-based imports, or public calendars.Refresh NAMPAADD’s horticulture chapter with district-level sow/harvest targets tied to retailer data.
FAO Hand-in-Hand (HiH)Evidence-based, country-led investment planning; typology tools.Data tools & geospatial analytics that can power targeting and calendars. (FAOHome)Not yet configured as retail demand → farm supply pipeline for Botswana SKUs.Request FAO HiH support to stand up a lightweight Market Observatory (see below).
NDB / Grants & Finance windowsCredit & recent horticulture grant guidelines; blended finance possibilities.Can nudge compliance (e.g., finance only when farmer slots align to calendars). (NDB)Finance currently decoupled from demand forecasts and import triggers.Make finance conditional on calendar-aligned offtake (pre-order or market slot).
IFAD / FAO field schools & ASSP-type supportCapacity, “farming as a business,” climate-smart practices.Training backbone that can teach market-aligned production. (IFAD)Training often production-centric, not demand-calibrated.Add a Market Intelligence module + weekly planning ritual.

What’s still missing (and how to add it quickly)

The missing piece is a public, rules-based, demand→supply pipeline that everyone can see.

Horticulture Market Observatory (public web page + PDF weekly)

Retailers/markets submit weekly SKU volumes, price bands, stockouts (simple template).

Publish a Friday snapshot + 8-week rolling forecast by district/crop.

Use FAO HiH tooling for the analytics layer. (FAOHome)

District Crop Calendars & Planting Targets

Start with top 8–10 veg; publish sow/harvest windows + target tonnage per district (refresh monthly).

Base targets on the Observatory forecast + Letsema/Tokafala signals. (Letsemahm)

Transparent Import Trigger Bands

Example: if projected supply <85% of demand for 4–6 weeks, open imports; >110% triggers processing/price-stabilization measures.

Announce changes via the Observatory (predictability for farmers and retailers).

Finance/Grant Conditionality

NDB/other windows require an assigned market slot (pre-order or auction) or alignment to district targets. (NDB)

90-day stitching plan (practical)

  • Week 0–2: Form a small Working Cell (MoA, MoT, Letsema, Tokafala, two retailers, NDB, FAO HiH).
  • Week 2–6: Stand up v1 Market Observatory (Google Sheet → public webpage); collect first 4 weeks of retailer SKUs.
  • Week 4–8: Publish draft crop calendars for two corridors (Gaborone–South, Francistown–North); recruit 50 pilot farmers via PYEC/TVET.
  • Week 6–10: Pilot Friday pre-order window at Letsema (listing + minimum volumes); Tokafala farmers prioritize listed SKUs. (Letsemahm)
  • Week 10–12: Announce import-trigger bands for those SKUs; align NDB grant/loan approvals to calendar slots.

The prize-winning tomatoes that never reached the shelf

The farmer in our story is not unique. Across Botswana, farmers are working with grit, faith, and long hours. They produce quality food. This food too often fails to meet the market. It is not because of their shortcomings. It is because the system has no bridge between production and demand.

Her cherry tomatoes were good enough to win the nation’s top prize. Yet they could not win a spot on the nation’s dinner tables.

That gap is what a National Horticulture Production Management System is meant to close.


Closing thought

Farmers can’t plant blind.
Retailers can’t stock empty shelves.
Policymakers can’t steer an economy on partial data.

Botswana’s farmers have already reached about 70% of local demand under difficult conditions. With coordination, transparency, and investment in the missing middle, that 70% can become 100% — and beyond.

The prize-winning tomatoes are proof that quality is here. Now it’s time to build the system that ensures such produce doesn’t just win awards. It must also win its rightful place on our tables.


Centrally Coordinated Agricultural Production – What That Means For Botswana


🧠 The Rotten Test: Ask of Any Policy

“Does this system give the farmer clear, real-time information about how much to produce, when to produce, and where it will go?”

If the answer is no, the policy—like the food systems exposed in Rotten—may be setting them up for failure.

What I am describing is not nationalization in the strict sense (i.e. state ownership of farms), but rather centrally coordinated agricultural production — where the government, in partnership with national farmer associations, plans production to meet national needs and organized export targets, while the land and operations remain privately or corporately owned.

This model aligns more with:

  • Coordinated market economies (e.g., in parts of Europe)
  • Export-led agricultural systems (e.g., in Asia and Latin America)
  • Public-private agriculture governance structures

Below is a list of countries (or regional blocs) that most closely reflect this model, where government and farmer associations work together to ensure supply meets aggregated national and global demand without owning the farms:


🌾 Countries with Strong National Coordination in Agriculture (Non-Nationalized)

1. Netherlands

  • Model: Highly planned and tech-enabled production.
  • Coordination body: Ministry of Agriculture works closely with farmer cooperatives (e.g., LTO Nederland).
  • Export focus: Major exporter of vegetables, flowers, meat.
  • Tools used: Digital farm registries, production quotas, national R&D targets, and organized market access through co-ops.

2. France

  • Model: Strong Common Agricultural Policy (CAP) alignment.
  • Coordination body: Ministry of Agriculture + National Interprofessional Councils (interprofessions).
  • Mechanisms: Strategic sector plans, quotas, and export agreements within EU and globally.

3. Denmark

  • Model: Export-oriented cooperative model.
  • Coordination body: Ministry + Danish Agriculture & Food Council.
  • Example: National agreements on pork production for Chinese and EU markets.

4. Israel

  • Model: State-supported planning with strong research-industry links.
  • Coordination: Kibbutzim and Moshavim integrate closely with the Ministry.
  • Example: Coordinated drip irrigation and export-led citrus and flower sectors.

5. China

  • Model: Mixed economy with quotas and central guidance.
  • Coordination body: Ministry of Agriculture sets production targets and supports farmer cooperatives.
  • Mechanism: “Vegetable Basket Project,” Five-Year Plans for food security, contract farming for exports.

6. Vietnam

  • Model: Post-reform socialist market economy.
  • Coordination body: Ministry of Agriculture coordinates land-use and export planning.
  • Sector success: Rice and seafood exports through coordinated farmer networks.

7. Brazil

  • Model: Government-backed agribusiness export strategy.
  • Coordination: Ministry of Agriculture + Embrapa (agricultural research) + national crop boards (e.g., ABPA for poultry).
  • Tools: Satellite monitoring, national zoning laws, and crop forecasts for soy, beef, sugar, etc.

8. India

  • Model: Large-scale crop planning with farmer incentives.
  • Coordination: Central and state governments work with cooperatives and marketing boards (e.g., NAFED, FCI).
  • Challenges: Implementation complexity due to scale, but export crops like basmati rice, spices, cotton are heavily coordinated.

9. Thailand

  • Model: Coordinated value chains for rice, rubber, and fruit exports.
  • Coordination: Ministry + farmer groups + contract farming for export fulfillment.

10. South Korea

  • Model: Government sets supply and demand forecasts, supports cooperatives.
  • Example: Korea Agro-Fisheries & Food Trade Corporation (aT) facilitates exports and sets production planning.

🔄 Common Features Among These Countries:

  • Centralized data on supply & demand, often real-time.
  • Institutionalized partnerships between government, farmers, and exporters.
  • Use of permits, quotas, and forward contracts to stabilize markets.
  • Heavy investment in agricultural R&D, extension services, and export facilitation.
  • Sometimes involve minimum price guarantees or subsidies tied to national plans.

🌍 Notable Regional Example:

European Union (CAP – Common Agricultural Policy)

  • Supranational coordination of agricultural production.
  • Uses production planning, environmental standards, and trade negotiations collectively.
  • Member states develop National Strategic Plans under an EU umbrella.

❗️Where This Is Not Common:

  • Most of Sub-Saharan Africa: Lacks centralized systems due to fragmentation, lack of digital traceability, weak farmer cooperatives, and limited export integration.
  • United States: While subsidies and crop insurance exist, production decisions are mostly private. There’s no national production permit system based on demand forecasts.

✅ So to answer the question:

At least 10–15 countries today have strong, centralized coordination systems that match your description — though they do not own farms. These systems are more about:

Orchestrated agriculture – where national production is planned, monitored, and aligned with export strategies in partnership with organized farmer associations.


What Stops a Country From Adopting Coordinated Demand-driven Agricultural Production?

A country is often not able to adopt coordinated, demand-driven agricultural production (without nationalizing farms) for six major reasons, each with multiple layers of structural and systemic inertia.


❶ Weak or Fragmented Farmer Organizations

Why it matters:
Coordinated production requires organized producers (e.g., cooperatives, associations) that can receive quotas, participate in planning, and supply consistently.

What stops it:

  • Historical mistrust in cooperatives
  • Politicization or elite capture of farmer groups
  • Fragmentation: Too many small, uncoordinated actors
  • Weak leadership or lack of technical capacity in associations

Example: In Botswana, farmers often operate individually or in loose groups without strong aggregation mechanisms for production or marketing.


❷ Poor Agricultural Market Intelligence & Data Systems

Why it matters:
Governments need real-time data on local production, global prices, weather, input access, and demand forecasts to guide decisions.

What stops it:

  • Absence of centralized production databases
  • Lack of investment in agricultural statistics and remote sensing
  • Disconnection between research bodies and policy decisions
  • Low digital infrastructure in rural areas

Without data, there’s no basis to permit, predict, or plan.


❸ Lack of Institutional Coordination

Why it matters:
Coordinated production requires alignment across:

  • Ministries (Agriculture, Trade, Finance, Infrastructure)
  • Export councils
  • Research and extension services

What stops it:

  • Turf wars and siloed operations
  • Frequent leadership changes or policy reversals
  • Weak coordination platforms (e.g., inactive agriculture councils)
  • Absence of a national agriculture command-and-control dashboard

❹ Absence of National and Export Market Contracts

Why it matters:
Export-led production thrives on forward contracts and pre-negotiated quotas with international buyers. These guide local production volumes and timing.

What stops it:

  • Limited international trade negotiations in agriculture
  • Poor branding of national produce (quality, consistency, certifications)
  • Weak or non-existent export councils for agriculture
  • Lack of investment in post-harvest handling and cold chains

In short: no buyers, no reason to scale production.


❺ Insecure Land Tenure and Weak Investment Incentives

Why it matters:
Farmers need to feel secure to invest in scaling production to meet quotas. Private capital needs clear property rights to engage.

What stops it:

  • Customary or leased land not usable as collateral
  • Unclear title deeds or long delays in land allocation
  • Inconsistent tax and subsidy policies
  • Fear of state interference or lack of trust in public agencies

❻ Skills Gaps: STEM, Management, Agronomy

Why it matters:
Coordinated production needs a skilled backbone — both in government planners and farmer-managers — who understand:

  • Market systems
  • Agribusiness logistics
  • Crop science and climate-smart production
  • Systems thinking for scaling

What stops it:

  • Education systems focus on “agriculture” but not core STEM
  • Extension workers lack upskilling in global trends
  • Low digital fluency across the agri-value chain

🧩 Underneath It All: A Missing Mental Model

At the heart of all these constraints is a mental model of agriculture as a:

  • Subsistence sector (not a commercial production industry)
  • Social policy tool (employment & land access) rather than an economic engine
  • Politically risky sector to regulate, due to voter sensitivities

Until this mental model shifts, efforts at coordination often stall.


✅ What It Takes to Shift

To transition to coordinated agriculture like the Netherlands, Denmark, or Vietnam, a country must:

Build national crop & livestock registries (traceability)

Mandate digital reporting of land use and yields

Empower farmer associations with planning & market access roles

Set up joint public-private Export Market Councils

Negotiate bulk purchase/export contracts regionally & internationally

Link national education to agribusiness STEM fields

Reorganize the Ministry into a strategy + data + extension nucleus


A transformation map for Botswana

Here’s a Botswana-Specific 10-Year Transformation Map to move from fragmented, input-subsidy-dependent farming to coordinated, demand-driven agricultural production that enables both food sovereignty and organized export markets — without nationalizing farms.

🇧🇼 BOTSANA AGRICULTURE TRANSFORMATION MAP (2025–2035)

Goal: Shift to a system where production is guided by national demand + structured export contracts, via strong public-private coordination.
Principle: Farms stay private; coordination becomes public.


🟩 PHASE 1: 2025–2027 – Foundation & Visibility

Theme: “See the System” – Map, Aggregate, Connect

Priority AreaKey ActionsLead Entities
🧭 1. National Production Mapping– Build digital registry of farms (land, crops, size, irrigation) – Use satellite + mobile reporting – Identify agro-climatic zones per cropMoA, Statistics Botswana, Land Board, UNDP
🤝 2. Empower Farmer Associations– Legal & capacity reform for existing associations – Support formation of national-level boards per major commodity (e.g., Potatoes, Horticulture, Poultry)Registrar of Societies, Farmers Unions, Business Botswana
📊 3. Market Intelligence Platform– Establish a digital dashboard for crop price, demand, weather, input availability – Run national demand studies & baseline exportsMinistry of Trade, MoA, SEZA
🔎 4. Rethink Subsidies– Begin shifting ISPAAD & LIMID from blanket inputs to targeted support based on crop priorities and agrozonesMoA Policy Division, MFED

🟨 PHASE 2: 2027–2030 – Coordination & Control

Theme: “Guide the System” – Aggregate Demand, Set Targets

Priority AreaKey ActionsLead Entities
📈 5. National Crop & Livestock Council– Form a legally mandated multi-stakeholder council (Govt + Farmer Boards + Exporters + Researchers) – Use council to approve seasonal production quotas and export targetsOffice of the President, MoA, Business Botswana
🔐 6. Contract Farming Expansion– Pilot export-oriented contracts in garlic, potatoes, chilies, and beef – Sign regional procurement contracts (e.g., SADC school feeding, GCC retailers)BITC, MoFAIC, Trade Attachés
📉 7. STEM-Agri Curriculum Reform– Integrate data analysis, systems thinking, and agribusiness into SHS and tertiary agri courses – Establish internship placements on export farmsMoESD, BIUST, BUAN
💼 8. Professionalise Extension Officers– Upskill officers in market systems, contract farming, regenerative production – Make performance linked to farmer productivity & supply alignmentMoA Training Department, LDF

🟥 PHASE 3: 2030–2035 – Export Reliability & Resilience

Theme: “Run the System” – Export with Confidence, Invest with Trust

Priority AreaKey ActionsLead Entities
🛫 9. National Export Board for Agriculture– Consolidate oversight of agri-export promotion, standards, marketing – Align with customs, veterinary permits, cold chain logisticsMoA, BAMB, Botswana Bureau of Standards
🏭 10. Value Chain Finance & Insurance– Develop crop insurance linked to production permits – Channel NDB and citizen equity funds through farmer boards – Attract private agri-finance via forward contractsNDB, CEDA, BITC, BoB
🧠 11. Systems Research & Forecasting– Use weather, market, soil, and input data to run production simulations – Use archetype-based insights to prevent overproduction, glut cyclesSTRLDi, BUAN, MoA
🔄 12. Legislative Backing– Revise National Agriculture Policy to reflect coordinated production model – Anchor it in Food Security and Economic Diversification strategyParliament, Attorney General’s Office

🧩 SYSTEM FEATURES ENABLED BY 2035:

  • ✅ Production permits based on demand forecasts (not guesswork)
  • ✅ National farm registry and traceability system
  • ✅ Data-driven price stabilization and export contracting
  • ✅ Digital dashboards at MoA and Districts for planning
  • ✅ Professionalized farmer base (similar to manufacturing)
  • ✅ Resilience against import bans and regional shocks

🔄 Optional: 4-Year Electoral Fit (2025–2029)

To align with political cycles, Phase 1 and early Phase 2 deliverables can form part of a presidential or ministerial results agenda, showing clear progress before elections.


My Inspiration for this Post

If you are a farmer or an agriculturalist (at any level), then you should watch this! Now!

Here’s a structured rundown of Netflix’s Rotten—the documentary series that inspired my reflection on farmers caught in volatile price cycles. It exposes how hidden market dynamics, fraud, and corporate systems hurt producers, often those at the very bottom of the chain.


📺 Overview of Rotten

  • A Netflix original investigative series (first season released January 5, 2018; second season October 4, 2019) with a total of twelve episodes across two seasons, each exploring corruption, fraud, and exploitation in global food systems (GQ, Wikipedia).

🔍 Season 1 (6 episodes) – “True Food Crimes”

1. Lawyers, Guns & Honey

Uncovers massive honey adulteration—beekeepers struggling to compete with cheap, syrup‑diluted honey flooding the U.S. market from China and other countries. Domestic producers are squeezed out, and regulators struggle to detect fraud (Garden Culture Magazine).

2. The Peanut Problem

Investigates a surge in peanut allergies in the U.S., linking it to shifts in processing, environment, and early childhood exposure. Highlights how industrial peanut systems affect public health and put pressure on farmers to keep up with opaque demand trends (Allergy Amulet).

3. Garlic Breath

The most gripping episode: a legal and ethical battlefield between Chinese exporters (some using prison labor) and U.S. garlic farmers. It reveals how global supply shocks, trade disputes, and price dumping devastate small producers (GQ).

4. Big Bird

Focuses on poultry production, showing how large-scale consolidation and export-driven demand distort local markets and compress margins for independent growers, often underregulated (GQ).

5. Milk Money

Centers on the raw milk controversy in the U.S., juxtaposing small dairy farm viability with public-health risks. It highlights how fear-based regulation and consumer mistrust can impact livelihoods without clear national strategy or market clarity (David Gumpert, GQ).

6. Cod Is Dead

Explores overfishing, regulatory loopholes, and global demand for seafood, showing how small fishing communities fall prey to industrial fleets and opaque supply chains, often without knowing who consumes their catch or at what price (Los Angeles Times, GQ).


🌍 Season 2 (6 episodes) – Deeper on Commodities & Ethics

Includes stories like:

  • The Avocado War – Supermarket chains squeezing small growers in Latin America.
  • Reign of Terroir – How terroir branding is co-opted by big players.
  • Troubled Water – Bottled water scams that leave communities thirsty.
  • A Sweet Deal, Bitter Chocolate, High on Edibles – covering sugar, chocolate production (including deforestation and labor abuse), and cannabis edibles respectively (Wikipedia).

🧩 Cross‑Cutting Themes

  • Global supply shocks and price volatility leave producers blind to demand, often overinvesting and ending in ruin.
  • Food fraud and adulteration undermine trust and crop value (honey, garlic, chocolate).
  • Corporate consolidation & opaque trade—big buyers and multinationals capturing margins, leaving farmers in informational darkness.
  • Labor exploitation, especially in low-cost producers like prison farms in China or cocoa plantations under slavery-like conditions.
  • Regulatory dysfunction: government bodies failing to protect small producers or clarify demand forecasts.
  • Emotional storytelling draws empathy—but also criticism for dramatizing issues over structural analysis (GQ).

🧑‍🌾 Relevance to Farmer Experience

Your concerns—that small farmers invest blindly, with no real insight into national or export demand, and thus suffer catastrophic losses—mirrors Rotten’s narrative. Farmers often don’t control:

  • Market entry or exit timing,
  • Price contracts,
  • Export pathways or demand data.

They’re typically stuck reacting rather than planning—leaving them vulnerable to price crashes, import floods, and external shocks. The series underscores the human toll of systemic opacity and misalignment.


✅ Summary Table

Episode / ThemeKey InsightImpact on Farmers
Honey adulterationPrice-undercutting by fraudulent syrup importsDomestic beekeepers driven out or starved
Garlic dumpingGlobal trade wars, forced labor, export inequalityU.S. garlic farmers lose ground and market share
Commodity allergiesShifting health trends and processing normsPeanut farmers suffer demand unpredictability
Poultry, fish, dairyExport pressures and consolidationSmall producers edged out, price and demand opaque

Did the documentary reach the conclusions we reached here?

No, the documentary Rotten does not explicitly reach the conclusion we’ve raised here — that coordinated, demand-driven national production planning is a necessary safeguard for farmers.

Instead, Rotten does the following:


🎥 What the Documentary Does Say:

  • It exposes the invisible machinery behind food systems — fraud, monopolies, unfair trade, exploitation, price dumping.
  • It empathizes with small farmers who suffer under market opacity, global trade forces, and power imbalances.
  • It documents farmer bankruptcies, family trauma, and systemic silence that precedes collapse.
  • It often frames these as consequences of deregulated capitalism, consolidation of corporate power, and corruption in trade.

🧠 What It Does Not Do:

  • It does not explicitly propose national production permits, demand forecasting, or farmer-board coordination as solutions.
  • It does not draw a policy systems map or push for governance reforms like those we are advocating.
  • It largely avoids proposing structural solutions, staying in the investigative and emotional storytelling space rather than systemic policy design.

So, What Have We Done Differently?

We have taken Rotten a step further by:

Translating narrative diagnosis into policy prescription.

Where Rotten shows the symptoms, we’ve proposed the systemic cause and a coordinated solution.

The documentary paints the tragedy. We’ve used it to frame the design.

This is precisely the value of the systems thinking lens—where stories like Rotten become entry points to expose structure, delay, loop dynamics, and system traps that can be redesigned.


📄 Policy Memo: From Rotten to Resilient – Why Botswana Must Coordinate Its Agricultural Production

To: Ministry of Agriculture, Trade & Industry, Office of the President
From: [Your Name / STRLDi]
Date: [Insert Date]
Subject: Preventing Farmer Collapse through Coordinated, Demand-Driven Agricultural Planning


🎬 Background Inspiration

The global food documentary series Rotten (Netflix, 2018–2019) offers a sobering account of how disorganized, opaque, and exploitative food systems ruin small producers. While it focuses on the U.S., China, and Latin America, the core lessons are deeply relevant to Botswana’s farmers:

“What destroys the farmer isn’t drought or pest—it’s the silence before the market crashes.”


🚨 Key Lessons from Rotten

Episode ThemeUnderlying FailureResult for Farmers
Honey FraudLack of quality regulation & import controlLocal beekeepers undercut & collapse
Garlic DumpingUnregulated trade, forced labor, price floodingLocal garlic growers sued, outcompeted
Poultry ConsolidationNo control over contract terms, production quotasChicken farmers left with losses
Milk & Fish EpisodesNo demand forecasting, oversupply, regulatory chaosPrices crash; family farms shut down

🇧🇼 The Botswana Parallel

Farmers across Botswana face the same pattern of systemic vulnerability:

  • They produce without visibility into national or global demand.
  • They invest heavily without guaranteed buyers.
  • They enter markets that can be flooded by cheaper imports or fail due to price crashes.
  • Their fate is sealed when production is treated as individual initiative, not collective strategy.

🔑 Policy Recommendation: Coordinate Agricultural Production

Botswana can avoid this fate—not through state ownership, but through central coordination with decentralized production.

What Needs to ChangeHow to Implement It
❌ Farmers produce blindly✅ Establish seasonal production permits & quotas based on national + export demand forecasts
❌ No market visibility✅ Develop a National Agricultural Intelligence Platform (real-time price, supply, demand)
❌ Weak farmer associations✅ Mandate and professionalize crop-specific national producer boards
❌ Reactive policies✅ Use predictive modeling, weather & trade analytics to plan ahead
❌ No export assurance✅ Pre-negotiate contracts via Export Market Councils (public-private)

📈 Strategic Benefits

  • Reduces price volatility for both producers and consumers
  • Prevents overproduction gluts and underproduction shocks
  • Builds investor confidence in agribusiness supply chains
  • Protects smallholder farmers from being the last to know—and the first to suffer

🧠 The Rotten Test: Ask of Any Policy

“Does this system give the farmer clear, real-time information about how much to produce, when to produce, and where it will go?”

If the answer is no, the policy—like the food systems exposed in Rotten—may be setting them up for failure.


📌 Closing Note

The stories of collapsed garlic farms, ruined poultry growers, and poisoned fishers in Rotten show us one thing: a happy family at the breakfast table doesn’t come from heroic individual effort—it comes from a system that plans, protects, and pays. Botswana’s farmers deserve no less.


What Nature Speaks Water Usage and Agriculture


In Cereal, Horticulture & Meat Production

Early Signals, Not Yet a Systemic Map


We do not yet have access to the extensive national data collection that underpinned the unemployment study. However, we have identified substantive datasets for Botswana and the region through FAOStats, which form a solid initial foundation. Using these, we are currently developing a case study to examine these dynamics at a global scale.

That said, the work would benefit significantly from deeper, locally anchored data. I would strongly welcome the opportunity for the Ministry to co-lead in organizing the data infrastructure. The region, more broadly, could also participate in strengthening the infrastructure. This is needed to support a systems thinking inquiry of this kind. Such collaboration would bring greater analytical depth. It would also ensure national and regional ownership of the insights that emerge.

At this point, our thinking is guided by what is publicly available through internet-based searches. While this has allowed us to outline key directions, we are acutely aware of the limitations. For that reason, I ask that you handle this information with professional discretion. Please do so until we are in a position to confirm and consolidate findings more robustly.

A distinctive aspect of our approach to systemic mapping is its ability to trace causal influences. It does this both at a specific point in time, but importantly, also traces these influences across time. This allows us to surface structural patterns. These include feedback loops, delays, and reinforcing behaviors. Such patterns often underpin not just the problem, but its persistence. We can begin this work with 20-year datasets. However, having a longer time series makes the causal structure more robust. This long-view perspective is especially important for policymakers seeking interventions that are not only responsive but also transformative.


Introduction

If the stories and explanations we’ve been using haven’t helped solve the problem, it’s time to take a step back. We need to ask new questions. Sometimes, we need to look deeper—or in entirely new directions—to find what’s really going on. Only then can we start telling a new story, one that brings real and lasting change.


**“We may not control the weather with the press of a button—but we are already influencing it, profoundly. The systems we built to extract water have altered rainfall patterns. This includes deforestation, exposed-field farming, and over-irrigation. These actions have weakened the water cycle. The question isn’t whether human action affects weather; it’s how we choose to act.

When we start to treat water as a partner, we create landscapes that invite rain. It’s not just a resource. Moist soils, living roots, and transpiring plants cool the land, seed clouds, and stabilize local climates. It’s not about control—it’s about cooperation with the natural systems we depend on.”**

Adapted for regenerative agriculture and water cycle resilience messaging


What Nature Speaks: Rethinking Water Use and Agriculture in Botswana – Summary

  • High water use, low returns: Botswana’s agriculture consumes large volumes of water but contributes minimally to GDP.
  • Cereal crops as a key outlier: While beef and horticulture align with global water-use norms, cereal crops are often drought-resistant. However, they use far more water and have lower productivity.
  • Not poor practice, but environmental exposure: The inefficiency stems from exposed-field farming in a semi-arid climate, leading to extreme evaporation.
  • Drought-resistance as a false solution: Over-reliance on drought-tolerant crops may suppress transpiration, disrupt rainfall cycles, and accelerate land degradation.
  • Yields and GDP suffer: Reduced rainfall and deteriorating soils weaken crop yields and reinforce the sector’s underperformance.
  • A call to ecological cooperation: The article urges a shift from controlling nature to partnering with it through regenerative practices.
  • Time to reintroduce water-cycle crops: Non-drought crops—especially horticultural varieties—can cool the land, restore rainfall patterns, and build resilience.
  • Toward a regenerative future: By designing agriculture to regenerate rather than extract, Botswana can improve climate stability. It can also boost productivity and enhance long-term economic contribution.

🔁 From Efficiency to Regeneration: Rethinking Water Use and Crop Strategy in Botswana

Dr. Rasbash’s analysis in “Thirsty Farms, Empty Returns” The Gazette, 28 May, 2025 (pg 24) highlights a critical issue. Botswana uses a lot of agricultural water. However, it experiences low economic returns.

We, like Dr Rasbash, noticed a significant deviation in water consumption per tonne of agricultural produce in Botswana. This is evident when compared to global benchmarks (for details refer to Part III below). The most striking difference, however, is in cereal production. Beef is the most water-intensive product. However, both beef and horticultural crops show water usage broadly comparable to international standards. Cereal crops, on the other hand, diverge sharply.

If so, this discrepancy may not be a reflection of poor farming practices, inefficient irrigation, or crop selection per se. Rather, it stems from the environmental context in which these crops are grown. Unlike horticultural crops, cereals in Botswana are typically cultivated in open fields without protective cover. The country’s semi-arid to arid climate causes a substantial loss of applied water due to evaporation. For details refer to: Comparison of Average Annual Evaporation by Climate Zones in Part III below. High solar radiation and ambient heat drive this evaporation process.

This insight now invites us to go beyond technical adjustments. It compels us to ask deeper questions:

What keeps the sector from understanding inefficiencies despite repeated episodes of the issue?
The answer may lie in the assumptions we’ve internalized about what defines “productive” agriculture in dryland conditions.

Rainfall cycles and cooler climates are supported by vegetation that actively contributes to transpiration. These plants boost atmospheric moisture. These traits are less common in drought-resistant crops (for details, refer to Part I below). By designing agricultural systems that collaborate with natural water cycles, Botswana can enhance resilience. These systems work with nature. They do not resist it. (For details on the consequences of resisting it, refer to Part II below). This approach allows Botswana to move toward climate-resilient productivity and long-term food security.

Too often, agricultural solutions default to scaling up drought-resistant crops—an understandable and technically sound response to erratic rainfall. However, this approach risks masking a deeper systemic challenge. While drought-resistant crops will buy us time, they cannot reverse the underlying drivers of desertification. Nor can they rebuild climate resilience if soil health continues to decline and vegetation cover is reduced. These conditions weaken the land’s capacity to retain water. They disrupt critical feedback loops in the water cycle. This disruption ultimately contributes to declining yields. It also fosters the perception that agriculture underperforms in driving national GDP.

Crops that promote transpiration and atmospheric moisture, on the other hand, include many horticultural varieties. These crops will initially require time to re-establish after years of disuse. However, they offer long-term potential to help restore local rainfall cycles and moderate surface temperatures. When grown under protective systems and supported by regenerative practices, they:

  • Improve soil structure and organic matter to retain moisture,
  • Reduce surface temperatures through better vegetative cover,
  • Ultimately lead to fewer heatwaves and more stable growing conditions leading to better yields and more stable climates.
  • Enhance transpiration, which supports cloud formation and rainfall,

This is not just a shift in crop choice. It is a recalibration of agriculture’s role. The focus is changing from resisting climate change to regenerating the conditions that make farming viable in the first place.

Instead, we should view agriculture as a partner in the water cycle, not just a consumer of it.


It’s true—we cannot “control” the weather in the way we control machines or systems with switches and dials. But we’re already influencing it, profoundly—just not always with awareness or intention. The very technologies and land-use systems we designed to maximize extraction have altered rainfall patterns. This occurs through deforestation, large-scale irrigation, or monocropping. They have also increased surface temperatures and weakened the water cycle.

The question is not whether human action affects the weather—it clearly does. The question is how we choose to act.

Think of it like a forest. No single tree controls the climate, but together, their presence regulates humidity, encourages rainfall, moderates temperature, and stabilizes soil. Likewise, agriculture, land cover, and soil practices can act like an ecological switchboard.

We see measurable improvements when we treat water as a partner in productivity. It’s not just a resource to be extracted. Moist soils reduce land temperatures. Vegetation increases transpiration, which adds moisture to the air. This feedback is slow, subtle, and cumulative. They are real and supported by growing evidence in agroecology, climate science, and satellite data.

We may not press a button to make it rain tomorrow. However, we can build landscapes that invite rainfall over the seasons. In doing so, we move from technological control to ecological cooperation—from managing components to designing for outcomes.


Without this shift, efforts at water efficiency—however well-intentioned—may end up reinforcing the vulnerabilities they aim to fix.

“Efficiency without regeneration risks accelerating the very vulnerabilities we aim to overcome.”

Ultimately, this calls for a paradigm shift. We need to move from maximizing extraction to optimizing contribution. Land, water, and communities should be healthier each season than the last. Botswana’s agricultural strategy must evolve from technical reform to systemic redesign, aligning with ecological processes rather than resisting them.


PART I

The Impact of Crops That Transpire Less

Crops that transpire less can significantly alter the local and regional water cycle, especially when adopted widely across a landscape. Here’s a breakdown of the key impacts:

1. Reduced Moisture Recycling (Less Local Rainfall)

Transpiration contributes to atmospheric moisture, which can return as local or regional rainfall.

  • When crops transpire less, less water vapor enters the atmosphere, leading to:
    • Lower humidity
    • Reduced cloud formation
    • Decreased local rainfall, especially in semi-arid and continental interiors

🔹 Impact: This can contribute to longer dry spells and a feedback loop of aridification, especially in areas already vulnerable to desertification.


2. Lower Evapotranspiration = Slower Water Cycling

Evapotranspiration (ET) = evaporation from soil + transpiration from plants.

  • Lower ET = slower movement of water from soil to atmosphere.
  • This can:
    • Reduce cooling of the land surface (because ET consumes heat)
    • Potentially increase surface temperatures during the day

🔹 Impact: Hotter days, reduced rainfall, and possible heat stress for crops and livestock.


3. Increased Soil Moisture Retention (Short-term Benefit)

Less water is lost to the atmosphere. As a result, soils may stay moist longer. This initially improves drought resistance and reduces irrigation needs. This initially improves drought resistance and reduces irrigation needs.

🔹 Impact: In the short term, this supports water conservation.
In the long term, if this leads to reduced rainfall, it can backfire.


4. Landscape-Level Hydrological Shifts

When drought-resistant, low-transpiration crops replace native vegetation or high-transpiration crops, they:

  • Disrupt ecosystem-level water cycling
  • Potentially lower groundwater recharge (fewer rain events = less infiltration)
  • Shift local climate patterns due to changes in surface albedo* and humidity

🔹 Example: Large-scale planting of low-transpiration crops across a savanna could reduce the frequency of convective afternoon rains.


Rainfall Levels for Botswana 1970 to 2020.

*Albedo is a scientific term. It refers to the reflectivity of a surface. Specifically, it describes how much sunlight (solar radiation) a surface reflects back into the atmosphere instead of absorbing it.


Simple Definition:

Albedo is the fraction of incoming solar energy that is reflected by a surface.

It is measured on a scale from 0 to 1:

  • 0 = No reflection (total absorption, like black asphalt)
  • 1 = Full reflection (perfectly reflective, like fresh snow)

Examples of Albedo in Nature and Land Use:

Surface TypeTypical Albedo
Fresh snow0.8 – 0.9
Dry sand/desert0.3 – 0.4
Grassland/crops0.2 – 0.25
Forest (dark vegetation)0.1 – 0.2
Water (angle-dependent)0.05 – 0.1
Black soil/asphalt0.04 – 0.1

Why It Matters in Agriculture and Climate:

  • Higher albedo = more solar radiation is reflected = cooler local temperatures.
  • Lower albedo = more solar radiation is absorbed = warmer local temperatures.

For example, deforestation lowers albedo because darker soil absorbs more heat, potentially intensifying local warming.

In agriculture, mulching, crop type, soil exposure, and canopy density each impact the albedo of a farming landscape. These factors influence microclimates and water loss.

Would you like a visual example or its role in climate feedback loops?

Summary Table

EffectLow-Transpiration Crops Impact
Local Rainfall↓ Decreases
Humidity↓ Decreases
Soil Moisture (Short-term)↑ Increases
Groundwater Recharge (Long-term)↓ Decreases
Temperature Moderation↓ Less evaporative cooling
Water Use Efficiency↑ Increases

Implications for Agricultural Planning in Botswana

  • Drought-resistant, low-transpiration crops help in the short term. However, relying on them without reforesting, mulching, and soil regeneration can be risky. It’s important to balance these crops with plants that transpire more. Otherwise, it may lead to a drier, hotter, and less predictable climate.
  • Strategic planning must balance plant-level efficiency with landscape-level water cycle stability.

KEY INSIGHTS:

Declining Rainfall in Key Production Areas:

Rainfall levels in Botswana have declined in specific cereal- and livestock-producing regions over the past 15 years. Other areas have remained unaffected, according to historical data from the Botswana Meteorological Department. This challenges the idea of a uniform global warming effect. It suggests that localized environmental degradation may be happening. This degradation is likely linked to agricultural land use and possibly deforestation.

Limitations of Cereal Investment Narratives:

There is a common assumption that increasing investment in cereal production alone can reverse national declines. However, efforts to regenerate ecological conditions must occur in parallel. This includes maintaining moisture levels and soil structure. Otherwise, such strategies may prove unsustainable, even for drought-resistant crops.

Escalating Desertification Risks:

Desertification is not static—it is steadily progressing. Without systemic change, even crops bred for resilience will eventually become non-viable. Long-term adaptation strategies must go beyond input substitution and address root climatic trends.

Rationale for Regenerative and Horticulture Focus

In response, STRLDi advocates for a regenerative agriculture strategy, particularly through horticulture. Horticulture is initially vulnerable to erratic weather. However, it offers a critical advantage by actively contributing to atmospheric moisture and soil regeneration. Over time, this enhances local microclimates and can help reverse drying trends caused by extractive practices.

Balancing Competing Agricultural Priorities:

The solution is not to swing policy wholly toward one system or another. Instead, it lies in designing a balanced agricultural model. This model must meet food security targets and restore ecological function.

Data Gaps Undermine Strategic Action:

Preliminary FAOSTAT data indicate a countrywide decline in cereal production, aligning with producer concerns over inconsistent field data. This may limit the Ministry’s capacity to regulate imports effectively or justify increased sectoral investment. Delayed payments to producers could be symptomatic of this deeper structural imbalance.


Recommendation:

There is an urgent need for a national effort to collect and analyze disaggregated, region-specific production and climate data. Policymakers, investors, and farmers need a systems-based understanding of Botswana’s agricultural future. This understanding will help them co-create a more resilient and self-sustaining agricultural sector.


Subject: Reflections on National Cereal Production and Data Trends

Dear Mr. Tema,

I had thus far refrained from commenting on the country’s cereal and meat production landscape. I felt it important to first examine more recent and comprehensive data sets in both sectors.

Fifteen years ago, I had noted that rainfall patterns were declining in certain areas. This was based on historical data from the Botswana Meteorological Department. These localities were known for cereal and livestock production. Interestingly, this trend was not mirrored in all parts of the country. This suggests that the issue may not solely be the result of a uniform global warming effect. Rather, it indicated possible localised environmental degradation. This could be linked to agricultural practices and land use changes. Such changes may include or even lead to deforestation. With more robust and longitudinal datasets, these causal relationships can be better defined and understood.

This point may appear subtle, yet it carries significant weight and is often overlooked in discussions. It illustrates how we identify high-leverage interventions. Specifically, it concerns the observed correlation between drought-resistant cereals and declining rainfall. The common conclusion is to increase investment in cereal production to counteract the decline—an understandable response. However, without addressing the underlying climatic shifts driving these patterns, we risk falling short of achieving true resilience. Long-term productivity gains are unlikely without confronting these deeper systemic changes.

I recall saying at that time that even drought-resistant crops will eventually be phased out. The climatic conditions they are meant to survive will worsen. Even they cannot withstand these changes. Desertification is not a fixed point—it is dynamic and constantly expanding. We must change land use, water retention strategies, and soil regeneration practices. Otherwise, we risk pursuing production targets in environments that are no longer viable.

This may help you understand why I have taken a regenerative agriculture approach. I have also placed emphasis on boosting horticulture production levels. Horticulture might initially suffer from the same drying effects of climate variability. However, when approached regeneratively, it presents a potential solution. It contributes to atmospheric moisture and enhances local microclimates. Unlike conventional cereal farming, it can help reverse some drying conditions. These conditions are caused by widespread cultivation of crops that, while drought-resistant, do not release moisture into the atmosphere. This occurs in combination with other extractive agricultural practices.  The key, I believe, is not to swing the pendulum entirely in one direction. Instead, a practical balance should be found. This balance is between systems that nourish the land and those that meet the country’s food needs.

I have compiled an initial set of figures from FAOSTAT to begin exploring these patterns. While the current dataset is limited, the preliminary trends suggest a sustained nationwide decline in cereal production. This situation may partly explain why producer associations feel caught between competing pressures. They are unable to rely on consistent field-level data to inform the Ministry’s regulatory decisions. This is particularly true concerning the timing and scale of import restrictions.

The Ministry itself may also be facing a difficult balancing act. Without clear evidence of import substitution, justifying increased allocations to the sector becomes challenging. There is no significant drop in the national import bill for cereals. This, in turn, likely affects its capacity to pay producers promptly, further exacerbating trust and viability within the sector.

A more coordinated effort is needed. We need to gather and analyze disaggregated, locality-specific production and climate data (see inbox below). This effort would shape responsive policies. These policies would strengthen national food security and protect the economic interests of our producers.

Warm regards,
Sheila Damodaran
Managing Director
Systems Thinking Research & Leadership Development Institute (STRLDi)
Botswana
Tel: 75987534

May 14, 2025


PART II

GRAIN PRODUCTION, DEMAND AND CONSUMPTION TRENDS 1960S – 2020S

Comparing Botswana’s grain production and demand from the 1960s to the present shows a persistent gap. Domestic production consistently falls short of consumption needs. This disparity has necessitated substantial grain imports to meet the country’s food requirements.

📊 Grain Production Trends (1960s–2020s)

  • 1960s–1980s: Grain production was generally low, with significant fluctuations due to droughts and limited agricultural infrastructure. For instance, in 1984, production dropped to a record low of 9,525 metric tons. (CEIC Data)
  • 1990s–2000s: Efforts to improve agricultural output led to some increases in grain production. However, challenges such as inconsistent rainfall and limited agricultural infrastructure continued to hinder substantial growth.
  • 2010s: Production levels varied, with some years witnessing improvements due to better rainfall and government support programs. For example, in 2017, the total grain production was 2,348 metric tons. However, by 2019, production had declined sharply to 583 metric tons, primarily due to drought conditions.
  • 2020s: Recent data indicates a gradual increase in grain production. In 2022, cereal production was reported at 85,049 metric tons. By 2028, grain production could rise to 64,100 metric tons. This is an increase from 59,000 metric tons in 2023. It reflects an annual growth rate of 1.3%.

📈 Grain Demand and Consumption

While specific year-on-year consumption data is limited, it’s evident that Botswana’s grain demand has consistently outpaced domestic production. The country’s reliance on grain imports underscores this gap. For instance, in 2023, Botswana ranked 143rd globally in grain production, with Lesotho surpassing it by producing 59,000 metric tons. (Taylor & Francis Online, ReportLinker)


📉 Production vs. Demand Gap

The persistent shortfall in grain production relative to demand has led to a dependence on imports to ensure food security. Factors contributing to this gap include:

  • Crop Production Choices Exacerbating Climate Variability
    Botswana’s semi-arid climate and recurrent droughts have long posed challenges to agricultural productivity. Current crop production choices are adding to the problem. They limit the landscape’s ability to support moisture recycling. As a result, they decrease rainfall. In this way, agricultural decisions are not only shaped by climate variability but may also reinforce it.

📚 Data Sources for Detailed Analysis

For a more comprehensive year-by-year breakdown of grain production and consumption statistics in Botswana, the following resources are recommended:

  • Statistics Botswana: Provides detailed agricultural survey reports and data. (Statistics Botswana)
  • FAO GIEWS Country Briefs: Offers insights into food security and agricultural trends. (FAOHome)
  • CEIC Data: Contains historical data on agricultural production and consumption. (CEIC Data)

To check the extent increases were the result of proceeds from sales or capital injections.  

CEREALS PRODUCED IN PANDAMATENGA

Pandamatenga, situated in Botswana’s Chobe District, stands as the nation’s primary hub for cereal production. The area’s favorable conditions are ideal for large-scale, rainfed agriculture. These conditions include flat terrain, fertile Vertisol soils, and annual rainfall averaging around 600 mm. (Wikipedia, African Development Bank Group)

🌾 Major Cereals Produced in Pandamatenga

Sorghum: As Botswana’s staple grain, sorghum is extensively cultivated in Pandamatenga. In the 2022–23 season, the region produced approximately 42,100 tonnes of sorghum, marking an 11% increase from the previous year. This output significantly contributes to national self-sufficiency in sorghum production. (Mmegi Online)

Wheat: Traditionally a minor crop, wheat cultivation in Pandamatenga has expanded in recent years. During the 2022–23 season, there was a nearly 30% increase in wheat production. This indicates a growing importance in the region’s agricultural portfolio. (Facebook, Mmegi Online)

Maize: Maize is a significant cereal crop nationally. However, its cultivation in Pandamatenga is less prominent compared to sorghum and wheat. However, it remains an essential component of the region’s cereal production.

Millet: Grown on a smaller scale, millet contributes to the diversity of cereals produced in Pandamatenga. Its cultivation supports food security, especially in areas with variable rainfall.(chobedestination.co.bw)

🌱 Additional Crops

Beyond cereals, Pandamatenga’s farmers also cultivate various pulses and oilseeds, including cowpeas, chickpeas, mung beans, sunflower, and sugar beans. These crops not only diversify agricultural output but also enhance soil fertility through crop rotation practices. (Mmegi Online)

🏗️ Infrastructure and Development

To support and enhance agricultural productivity, significant investments have been made in infrastructure within the Pandamatenga region. Notably, 12 modern steel grain silos are being constructed. Each silo has a capacity of 5,000 metric tonnes. This aims to improve grain storage and management. This development is expected to motivate farmers to increase grain production, thereby promoting food security. (Guardian Sun, Daily News)

In summary, Pandamatenga’s strategic importance in Botswana’s agricultural sector is significant. It contributes substantially to cereal production, focusing on sorghum and wheat. These contributions are supported by favorable agro-climatic conditions and ongoing infrastructure development.

Continue reading What Nature Speaks Water Usage and Agriculture