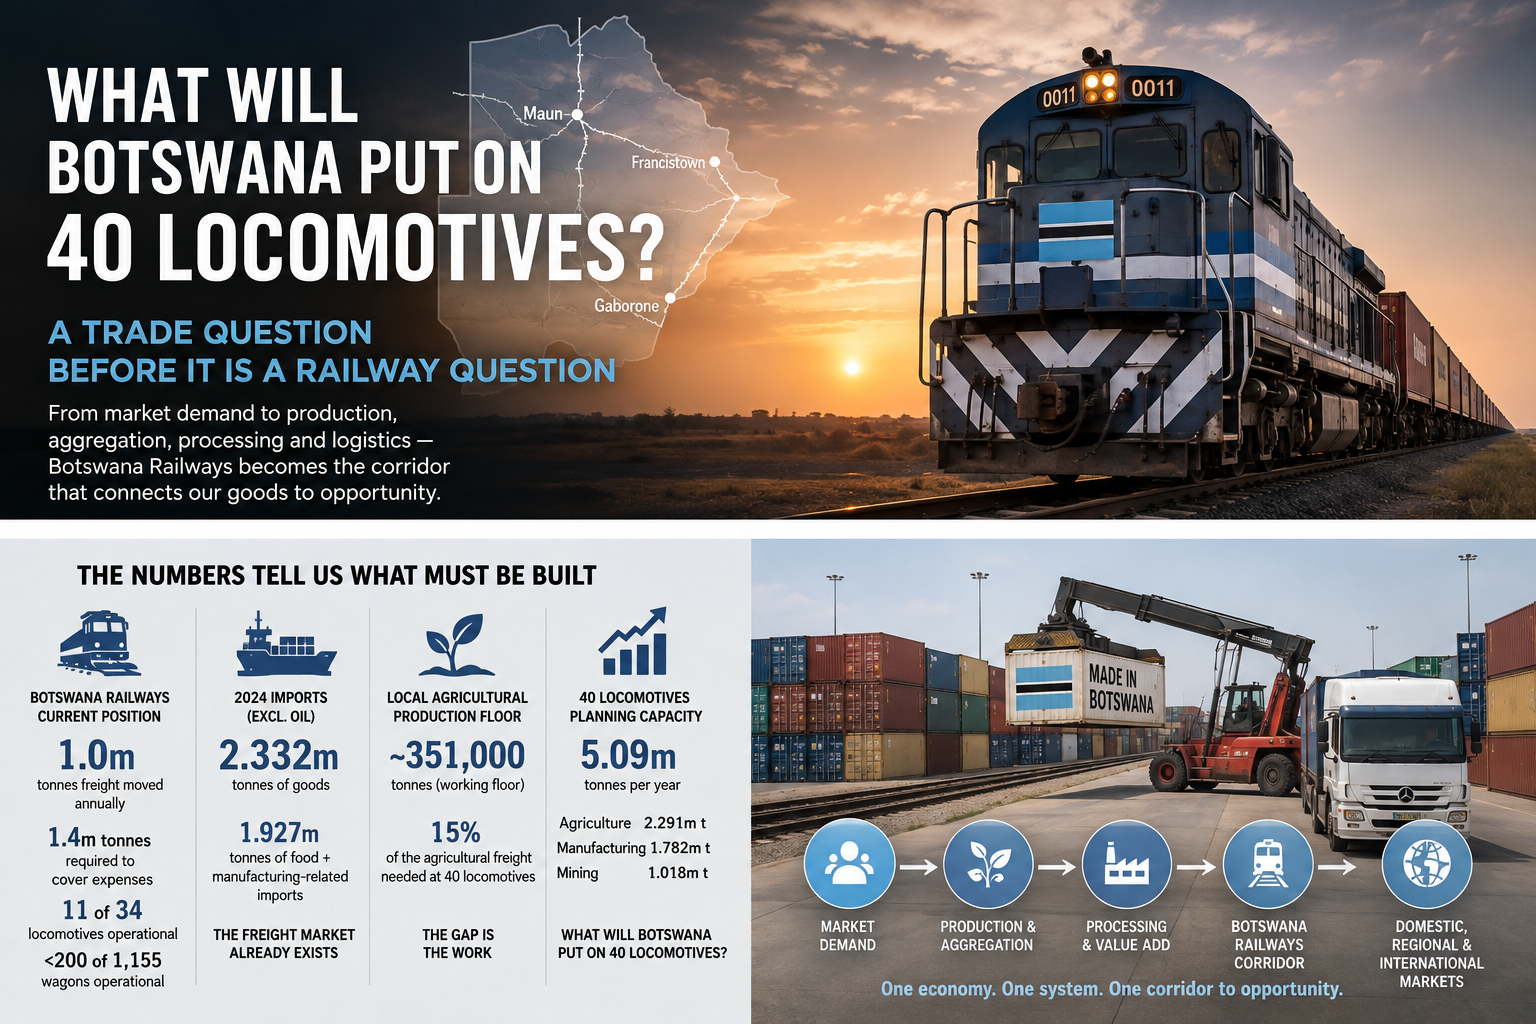
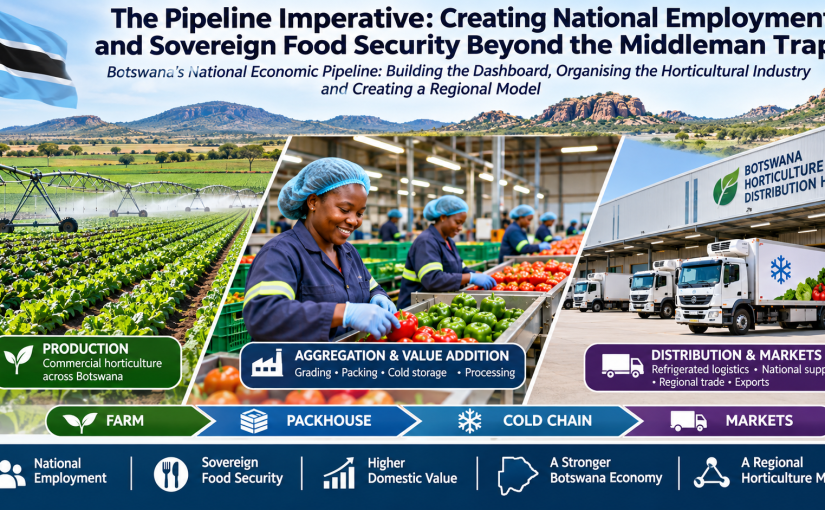
The Pipeline Imperative: Creating National Employment and Sovereign Food Security Beyond the Middleman Trap


Botswana’s National Economic Pipeline: Building the Dashboard, Organising the Horticultural Industry and Creating a Regional Model

Executive Perspective

Botswana stands at a historic economic crossroads. Following the bold implementation of horticultural import restrictions, domestic vegetable and fruit production surged to an unprecedented 140,881 metric tonnes (MT) in 2025/26—up from just 58,715 MT in 2019. The national import bill plummeted from P1.2 billion in 2021 to approximately P150 million, while government matching grants under the Impact Accelerator Subsidy (IAS) surpassed P144 million, supporting over 1,630 citizen farmers. Meanwhile, flagship foreign direct investments like the Selebi-Phikwe Citrus project (>P200 million FDI out of a P491 million capital expenditure) generated 22,000 MT of export-grade fruit.

Yet, despite these production triumphs, the horticultural sector faces a structural bottleneck that threatens citizen farm viability: an estimated 35,881 metric tonnes of locally grown produce (25%) is lost annually to in-field spoilage, post-harvest heat deterioration, and supermarket rejections.

As policy makers evaluate the next stage of market organization, a seductive proposal has gained traction: importing the Johannesburg Fresh Produce Market (JFPM) commission-agent model. On the surface, floor brokerage looks vibrant, busy, and visually dynamic. However, transplanting an urban spot-market trading floor into Botswana’s developing agricultural landscape risks creating a class of speculative middlemen who extract producer margins without taking spoilage risk, while failing to solve the cold-chain deficits that lock citizen farmers out of retail supply chains.

This strategic paper presents an alternative: an Integrated National Cold Supply Pipeline. By comparing the two models across job creation, risk absorption, price stability, and farmer support systems, this analysis demonstrates why a national pipeline is the essential engine to secure citizen farm profitability, eliminate post-harvest waste, and generate thousands of sustainable industrial and rural jobs across Botswana.


1. The Middleman Trap: Why the Commission Agent Model Fails Botswana

The Johannesburg commission-agent model was designed a century ago for a massive, highly dense agricultural market with established cold infrastructure. In that setting, commission agents act as floor brokers matching spot buyers and sellers, taking a 5% to 12% cut on gross sales.

When applied to Botswana’s current horticultural reality, the commission-agent concept introduces severe economic distortions:

  • Zero Risk-Taking: Commission agents do not own cold trucks, do not build refrigerated packhouses, and do not buy crops. If 10 tonnes of citizen tomatoes rot on a market floor during a seasonal heatwave or market glut, the farmer absorbs 100% of the financial loss. The agent incurs no loss and simply collects a fee on whatever portion sells.
  • Extraction of Producer Margins: By taking an 8% to 15% commission off gross turnover, floor traders reduce the net revenue returning to the farm gate. In a sector where smallholders already face high input costs for seeds, fertilizers, and solar irrigation, this margin extraction destroys farm profitability and forces farmers to cut field wages.
  • Failure to Solve Retail Access: Major South African supermarket chains operating in Botswana enforce strict quality standards, maximum residue limits (MRL), uniform grading, and temperature-controlled deliveries. Supermarket distribution centers reject smallholder crops due to broken cold chains—not due to a lack of floor brokers. An agent standing on a trading floor cannot fix a heat-damaged cucumber.
  • Incentivizing Market Chaos: Commission agents thrive on daily price volatility. During seasonal harvest peaks, agents drop floor prices to clearance levels, forcing smallholders to sell below production cost. This volatility discourages planned, staggered planting and keeps the national agricultural economy fragmented.

2. The Employment Math: Floor Traders vs. A National Supply Grid

A primary argument advanced by proponents of the commission-agent model is job creation. However, a rigorous comparative analysis reveals that spot-market brokerage produces a low-volume, urban-centric employment footprint, whereas an Integrated Cold Supply Pipeline creates a multi-tiered, nationwide industrial labor market.

┌────────────────────────────────────────────────────────────────────────┐
│ COMMISSION AGENT MODEL (Urban Floor Brokerage) │
│ ──> Concentrated urban floor traders & commission brokers │
│ ──> Squeezes farm profitability ──> Reduces rural farm-level wages │
└────────────────────────────────────────────────────────────────────────┘
┌────────────────────────────────────────────────────────────────────────┐
│ INTEGRATED NATIONAL PIPELINE (Distributed Cold Supply Grid) │
│ ──> Rural packhouse managers & pre-cooling technicians │
│ ──> Digital quality control, grading & MRL compliance officers │
│ ──> Logistics dispatchers & refrigerated fleet drivers │
│ ──> District agronomic planners & extension coordinators │
│ ──> Industrial agri-processing workers (curbing 35,881 MT loss) │
│ ──> Expands farmer revenue ──> Multiplies farm & rural employment │
└────────────────────────────────────────────────────────────────────────┘

Comparative Job Creation Matrix

Job CategoryCommission Agent Floor ModelIntegrated National Supply Pipeline
Primary LocationCentral urban trading floors (e.g., Gaborone/Francistown).Distributed across all rural agricultural districts (Chobe, Tuli, Boteti, Lobatse, Central).
Direct Roles CreatedFloor sales agents, desk brokers, manual off-loaders.Packhouse supervisors, refrigeration technicians, digital graders, MRL lab technicians, fleet drivers, processing operators, agronomic data planners.
Indirect Employment ImpactNegative: Erodes farmer margins, forcing farms to reduce field labor.Highly Positive: Expands farm gate revenues, enabling commercial farms to scale field labor (expanding the current 66% citizen / 34% foreign labor force into formal, year-round employment).
Skill & Salary ProfileLow-tier, transactional sales commission roles.Skilled technical, engineering, logistical, and managerial positions with long-term career pathways.
Industrial SpilloverMinimal: No processing or infrastructure integration.High: Drives local manufacturing in packaging, cold-room assembly, transport maintenance, and value-added food processing.

3. What the Pipeline Delivers: A Structural Safety Net for Citizen Farmers

An integrated pipeline moves horticultural management from chaotic spot trading to a structured, demand-driven value chain. It provides four critical support systems that commission agents can never deliver:

A. Farm-Gate Pre-Cooling & Cold Chain Preservation

Survey data indicates that only 1 out of 102 surveyed smallholders in Botswana owns a cold room, and only 1 utilizes a refrigerated transport vehicle. The National Pipeline establishes regional aggregation hubs equipped with rapid pre-cooling facilities and climate-controlled transport fleets. By cooling produce immediately after harvest, the pipeline directly targets the 35,881 MT in annual post-harvest losses, transforming spoiled crops into saleable inventory.

B. Standardized Quality Grading & Retail Off-Take Compliance

Rather than leaving farmers to negotiate individually with supermarket procurement managers, pipeline aggregation hubs inspect, wash, sort, and package produce to exact retail specifications. This guarantees that smallholder output meets the stringent requirements of national retail chains, replacing informal rejection with guaranteed contract fulfillment.

C. Transparent Cost-Plus Pricing & Financial Security

The pipeline operates on transparent, cost-plus pricing contracts linked to verified quality grades. By shielding farmers from predatory daily price drops during harvest gluts, the pipeline ensures that citizen growers earn predictable returns, enabling them to service CEDA and NDB loans and reinvest in greenhouse and drip irrigation infrastructure.

D. Coordinated District Cropping Schedules

To prevent localized gluts—such as simultaneous overproduction of cabbage across multiple districts—the pipeline utilizes a national digital dashboard. Agronomic planners coordinate planting schedules across ecological zones (e.g., balancing Chobe’s winter output with Tuli Block’s summer production), maintaining a smooth, year-round supply that matches national consumption patterns (restoring ~44.8 kg/person/year net availability up to national historical highs of 58.4 kg/person/year).


4. Macroeconomic Impact: Reclaiming P250 Million in Lost National Wealth

The strategic justification for an Integrated Supply Pipeline extends beyond individual farm gate economics to national fiscal stability:

  1. Monetizing Post-Harvest Waste: The 35,881 MT of produce currently lost to spoilage represents over P250 million in uncollected farm revenue. Recovering even 70% of this lost volume through cold pipeline logistics immediately injects P175 million back into the rural economy.
  2. Reinforcing Import Substitution: While trade bans reduced imports from 94,954 MT in 2021 to ~25,000 MT in 2025/26, retail shortages still occur during seasonal transitions. A cold pipeline stores and distributes seasonal surpluses, permanently closing the remaining import gap without triggering food inflation.
  3. Crowding in Private Capital: Government commitments, such as the P65 Million allocated toward Letsema market infrastructure, act as seed capital. Demonstrating a structured pipeline attracts further private logistics investment, building on private benchmark facilities like the P65 Million Safe Pro cold storage unit in Sherwood.

5. Roadmap for National Leadership: Organizing for Execution

Achieving this vision requires joint strategic coordination between the primary government institutions governing production and trade. National leadership must move beyond fragmented initiatives and convene a unified executive briefing.

┌────────────────────────────────────────────────────────────────────────┐
│ JOINT MINISTERIAL EXECUTIVE BRIEFING │
│ ┌──────────────────────────────────┐ ┌──────────────────────────────┐ │
│ │ Ministry of Agriculture │ │ Ministry of Entrepreneurship │ │
│ │ (IAS Grants, Extension, Yields) │ │ & Trade / CEDA / NDB │ │
│ └──────────────────────────────────┘ └──────────────────────────────┘ │
└───────────────────────────────────┬────────────────────────────────────┘
│
▼
┌────────────────────────────────────────────────────────────────────────┐
│ DELIVERABLES & DECISION AGENDA │
│ 1. Empirical Horticultural Employment & Value-Chain Study │
│ 2. Integrated National Cold Supply Pipeline Architecture │
│ 3. Capability Gap Assessment & 10-Year Implementation Roadmap │
└────────────────────────────────────────────────────────────────────────┘

Action Plan for Government Engagement

  1. Convene Joint Ministerial Briefing: Secure a formal working session uniting the Minister of Agriculture and the Minister of Entrepreneurship/Trade, alongside senior leadership from CEDA, NDB, and the Competition Authority.
  2. Present the Empirical Employment Study: Share full econometric data proving that the Integrated Supply Pipeline generates five times more skilled, distributed jobs than an urban agent floor model.
  3. Establish the Pipeline Infrastructure Blueprint: Review the spatial layout for regional aggregation hubs, cold-fleet logistics, and digital market dashboards.
  4. Define Capability & Skills Development Programs: Commit to a structured capability-building roadmap to train Batswana youth as cold-chain engineers, packhouse managers, digital crop graders, and supply chain managers.

Conclusion

Botswana’s horticultural sector has successfully proved its capacity to produce. The national imperative now is to build the pipeline that protects this production. Copying a century-old commission-agent model will lock citizen farmers into a cycle of predatory spot pricing, unabsorbed spoilage, and retail exclusion.

By investing in an Integrated National Cold Supply Pipeline, Botswana can eliminate post-harvest waste, protect citizen farm capital, and establish a vibrant, multi-industry employment engine that guarantees national food sovereignty for generations to come.


From the conversation with Mr Ratsele Molefhe to a national industry architecture

1. The conversation: a bigger question than the role of agents

The conversation with Mr Molefhe began with a question about how agents could organise the marketing and distribution of horticultural produce in Botswana. The Johannesburg Fresh Produce Market (JFPM) commission-agent model offers a familiar reference point: farmers consign their produce to agents, who negotiate sales with buyers and earn commissions on transactions. It is an established commercial arrangement within a large agricultural market, and it is understandable why its visible activity and market connections might appear attractive when considering how Botswana should organise its growing horticultural sector.

However, the question facing Botswana reaches considerably further. Who will organise the national horticultural economy so that production responds to actual demand, farmers have reliable market access, produce moves efficiently, consumers receive affordable food, and the resulting economic activity creates employment and domestic value? An agent-driven marketplace can facilitate transactions. A national economic pipeline must organise the productive system that generates those transactions in the first place.

This distinction is central to the discussion. The objective is to help Mr Molefhe and the wider industry move from considering a market arrangement to considering a national industry architecture. The first industry meeting can provide the starting point: a shared examination of what Botswana needs to organise, what information must be available, which institutions and businesses must work together, what capabilities are required, and how the country can build a model that becomes a reference point for the region.

The opportunity is considerably larger than establishing a trading floor. Botswana can develop a demand-led national economic pipeline, beginning with horticulture, supported by a national dashboard and connected through physical production, aggregation, processing, logistics and distribution corridors. This architecture can become a practical foundation for employment creation, food security, industrial development and regional trade.

2. Botswana has increased production. The next task is to organise the economy around it.

The horticultural production figures in the strategy document indicate a significant expansion in domestic production. Production is reported to have increased from 58,715 metric tonnes in 2019 to 140,881 metric tonnes in the 2025/26 season. The document also reports that the Horticulture Impact Accelerator Subsidy (IAS) exceeded P144 million, supporting more than 1,630 citizen farmers across over 5,192 hectares. Import expenditure is reported to have fallen from P1.2 billion in 2021 to approximately P150 million.

These figures describe a substantial production response. They also raise a more demanding economic question: how much of the production reaches the intended market, at what cost, through which commercial channels, and with what value retained by Botswana’s farmers, workers and businesses? Production volume alone cannot answer those questions. The country needs visibility across the full movement of produce, from the original production decision through to final consumption, processing or export.

The strategy estimates annual losses of 35,881 metric tonnes, valued at more than P250 million in uncollected farm revenue. It also identifies supermarket rejection, inconsistent grading, maximum residue limit (MRL) requirements, inadequate pre-cooling, fragmented delivery arrangements and insufficient cold-chain capacity as structural constraints. These estimates and operational claims require validation against the underlying food balance data, survey methodology and current facility performance. They nevertheless identify the central organising challenge: Botswana’s ability to produce has advanced, while the national systems connecting production to markets require further development.

The national task is therefore to convert production capacity into a dependable economic flow. That requires demand intelligence, coordinated production, aggregation, quality assurance, storage, processing, transport, distribution, commercial arrangements and performance information to operate as one connected system.

3. Two different ways of organising the horticultural industry

An agent-driven marketplace and a national supply pipeline perform different functions. The agent model primarily organises transactions between producers and buyers. The pipeline organises the relationships between demand, productive capacity, physical movement, market requirements and the institutions responsible for coordinating the system.

An agent can connect a farmer to a buyer, negotiate a sale, arrange a consignment or provide distribution. These services can have commercial value. The wider question is whether each farmer should have to independently find market information, negotiate buyer access, coordinate collection, arrange quality compliance and manage several intermediary relationships after the country has already invested in production support.

A national pipeline changes the starting point. It establishes what the market requires, translates that demand into production plans, coordinates farmers and clusters, and organises the movement of produce through the appropriate infrastructure and commercial services. Agents and other service providers can then operate within a system whose requirements, information flows and responsibilities are visible.

The pipeline is the organising system. Agents are service providers within that system. This is the distinction that should guide the discussion with Mr Molefhe.

Systematic comparison: commission-agent floor and national pipeline

Economic dimensionCommission-agent floor modelIntegrated national supply pipeline
Operational conceptUrban commission traders negotiating daily spot prices between individual growers and buyersIntegrated digital and physical network connecting demand, farm clusters, aggregation, processing, logistics and markets
Primary functionFacilitates transactions involving produce arriving at the marketOrganises demand-led production, quality, aggregation, storage, distribution and market delivery
Risk and loss allocationUnder the consignment arrangement described in the source, the farmer carries the risk of unsold or spoiled produce; contractual terms determine the precise allocationReduces losses through planned production, pre-cooling, grading, storage and coordinated delivery; risk allocation is defined through commercial agreements
Pricing and revenueDaily spot prices and commission charges, with exposure to seasonal price volatilityTransparent cost and margin structures, quality specifications and scheduled commercial arrangements
Retail integrationBrokerage alone cannot provide grading, MRL compliance, cold-chain integrity or reliable delivery schedulesCoordinates the physical and quality requirements of retail procurement
National market visibilityInformation may remain distributed among individual agents and private transaction recordsA shared national dashboard provides visibility of demand, production, inventory, prices and deliveries
Employment profileBrokerage and market-handling roles concentrated around trading locationsEmployment across farms, clusters, packhouses, quality assurance, cold storage, logistics, processing, data and commercial management
Economic reachPrimarily transaction-focusedConnects production, services, manufacturing, trade, employment and national food security

The commission rates cited in the working material vary: 5–12%, 5–15% and 8–15%. These ranges should be checked against the actual JFPM arrangements and the proposed Botswana model before they are used as a definitive rate. Similarly, the degree of risk carried by an agent depends on the consignment contract, the transfer of title and the allocation of losses. The important distinction is that a commission arrangement by itself does not provide the cold-chain infrastructure, national demand intelligence or production coordination that Botswana requires.

The JFPM model emerged within a mature, high-volume agricultural environment with established market infrastructure. Botswana must consider its own production geography, market size, infrastructure, institutional capabilities and farmer structure when designing its arrangements. A familiar trading-floor model cannot substitute for the wider work of organising the national industry.

4. The national economic pipeline: three interconnected spines

The pipeline should be organised through three interconnected management structures: the Demand Spine, the Supply Spine and the Throughput Spine. These are functional components of one national system. They provide a practical basis for defining institutional responsibilities, professional capabilities, information requirements and the physical infrastructure needed to move produce from production to market.
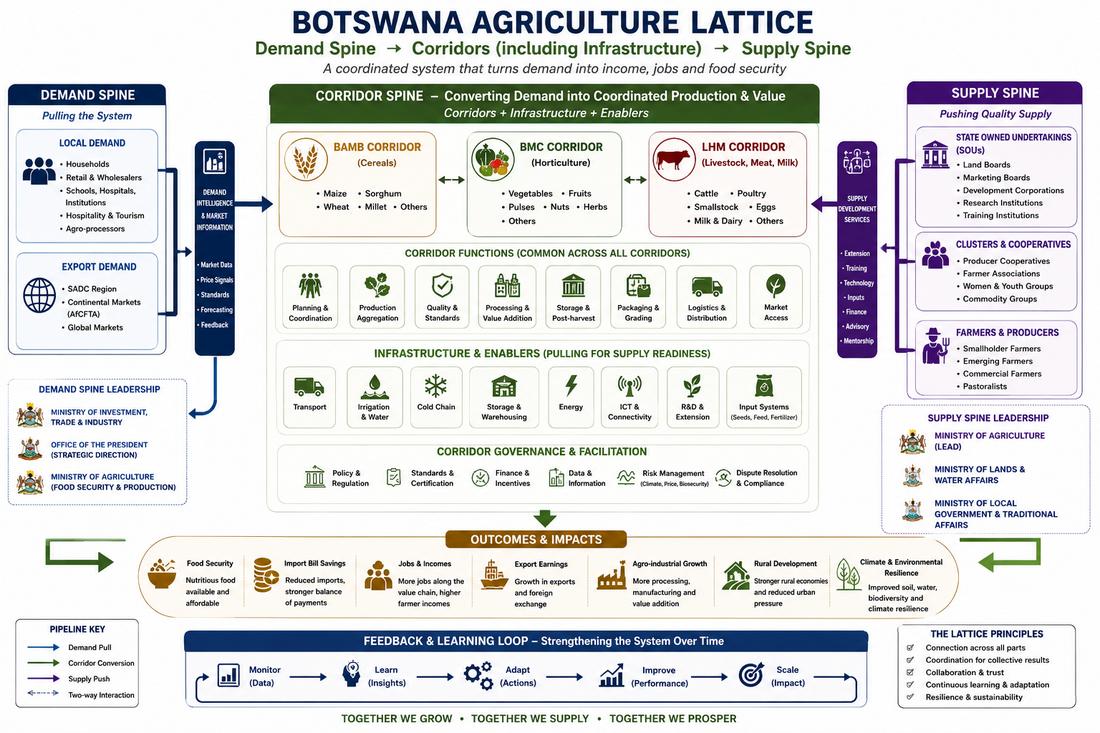
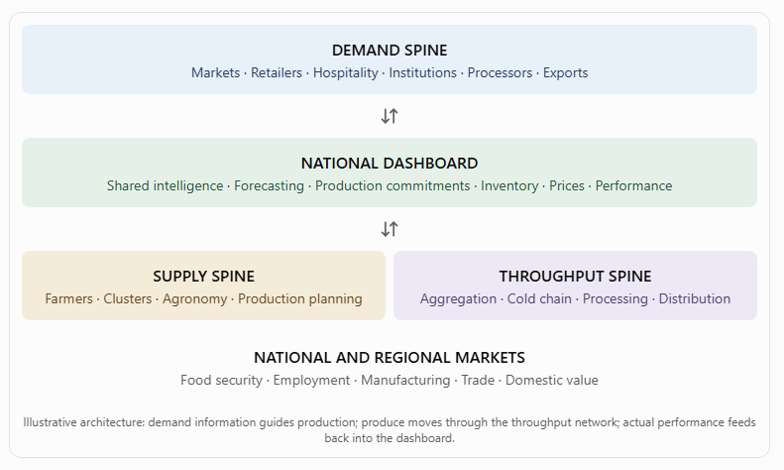
The Demand Spine — Ministry of Trade and the wider economic-development system

The Demand Spine establishes what the market requires, in what quantities, at what time, to which specifications and at what price expectations. It must cover household consumption, grocery retailers, hotels, restaurants, hospitals, schools, public institutions, food manufacturers, wholesale markets and regional export markets.

Demand intelligence must identify crop varieties, grades, volumes, packaging, delivery locations, seasonal requirements, contract conditions and market absorption. It must also distinguish between projected demand, confirmed orders and actual purchases. This information provides the basis for determining what Botswana should produce and where the market opportunity exists.

The Supply Spine — Ministry of Agriculture

The Supply Spine organises the country’s productive capacity. It identifies farmers, land, water, infrastructure, crop suitability, production capacity and the geographic organisation of farmer clusters. It translates market requirements into coordinated production plans, including crop selection, planting schedules, expected harvest volumes, quality specifications and delivery commitments.

Farmers and clusters must be able to work against a clear production requirement. This strengthens the relationship between public production support, commercial farming decisions and actual market opportunities.

The Throughput Spine — aggregation, logistics, processing and distribution

The Throughput Spine organises the physical movement of produce from farms and clusters to aggregation points, processors, retailers, institutions and consumers. It covers collection, pre-cooling, grading, certification, washing, sizing, packaging, storage, refrigerated transport, distribution and export logistics.

Its infrastructure requirements must emerge from the production flow and market demand. A cold room, packhouse, distribution centre or processing facility should be located and sized according to the volumes, timing, geography, throughput and delivery requirements it will serve.

These three spines must operate as one system. Demand information moves upstream to guide production. Produce and commercial value move downstream to markets. Actual performance, sales, prices, inventory and delivery information then feed back into the next production cycle.

The national pipeline is therefore more than a physical route for moving vegetables. It is an organising mechanism for information, people, infrastructure, commercial relationships, decisions and accountability.

5. The national dashboard: the industry’s shared intelligence centre

The three spines require a common information architecture. The national dashboard should become the industry’s shared intelligence centre, providing an integrated picture of demand, production, physical supply movement, market absorption and economic performance.
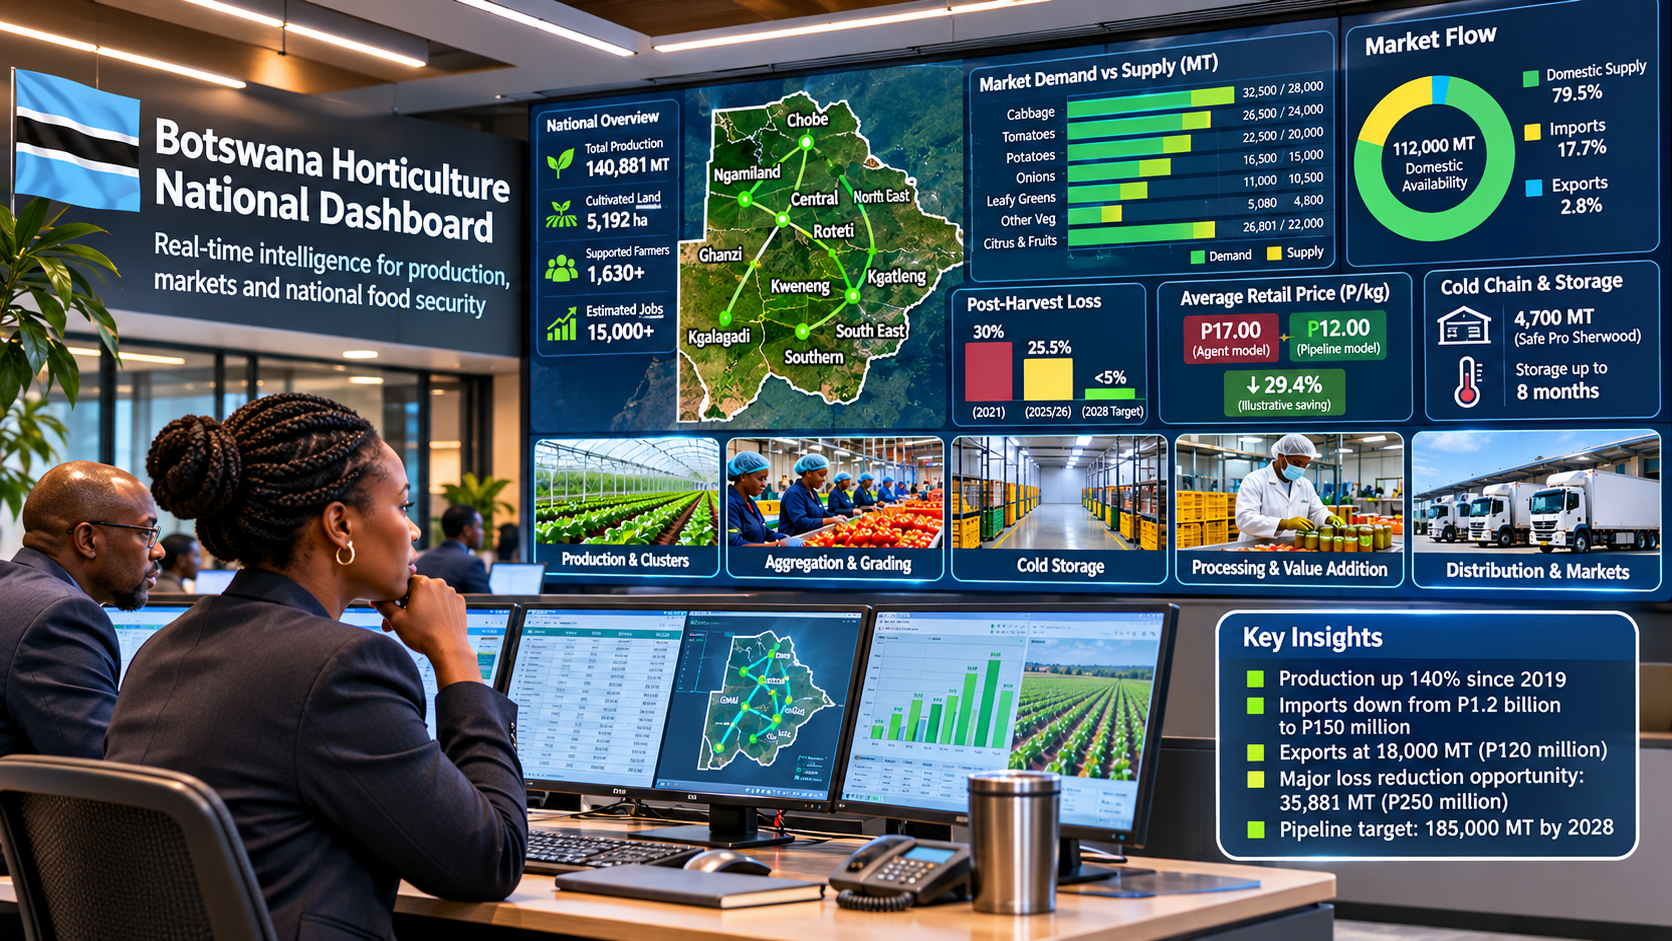
A registration database showing farmers and hectares planted is useful, but it is only one part of the information required. The dashboard must show the relationship between what the market requires, what farmers plan to produce, what is actually harvested, what enters the distribution system and what ultimately reaches consumers, processors or export markets.

Core information requirements for the national dashboard

Information areaData to be capturedPrincipal management question
Market demandCrop, variety, grade, volume, location, season, delivery schedule and buyer requirementsWhat does the market require, and when?
Confirmed ordersRetail, institutional, hospitality, processing and export ordersWhat demand is commercially committed?
Production capacityFarmers, clusters, hectares, crop plans, land, water and productive capacityWhat can the country produce, where and when?
Planting and harvestPlanned planting, actual planting, crop progress, expected harvest and actual harvestIs production following the national plan?
AggregationQuantities dispatched, received, graded, accepted and rejectedWhat volume enters the formal distribution system?
Storage and cold chainFacility capacity, actual inventory, storage duration, temperature integrity and utilisationWhere is produce held, and for how long?
DistributionDispatch quantities, routes, delivery schedules, quantities received and delivery performanceIs produce reaching its intended destination?
Market absorptionRetail sales, institutional use, processing volumes, wholesale sales and exportsHow much produce is actually absorbed by the market?
Trade flowsImports, exports, regional movements and seasonal tradeWhere is Botswana importing from and where can it supply?
Price formationFarm-gate, aggregation, wholesale and retail prices; commissions and service chargesWhere are costs and margins accumulating?
Employment and valueJobs by occupation, location and employment type; farmer revenue and domestic value retainedWhat economic value is the pipeline creating?
Losses and discrepanciesSpoilage, rejection, delays, diversion, unexplained inventory differences and unsold produceWhere is value being lost, delayed or diverted?

The dashboard must also support appropriate commercial confidentiality and access rules. It should provide shared national planning information while protecting sensitive buyer contracts, individual commercial terms and proprietary business information. Its governance should establish who can submit data, who can access it, how information is verified, and how discrepancies are investigated.

There is an important national-interest dimension here. Whoever controls demand information has considerable influence over what farmers produce and who gains access to markets. A shared national dashboard reduces the risk that essential market intelligence becomes concentrated in a small number of private hands. It gives government, farmers, lenders, processors, retailers and service providers a common basis for planning and investment.

The dashboard should also record actual physical movement. It must distinguish between a forecast harvest and produce that has been harvested, dispatched, received, stored, sold or exported. This is essential for understanding market shortages, inventory levels, price movements and the possibility of deliberate supply suppression.

Price discovery and the National Horticultural Price Determination Council

The national horticultural pipeline can draw valuable lessons from the price discovery mechanisms of a commodity exchange without subjecting the entire horticultural industry to exchange-driven pricing. Within this architecture, a National Horticultural Price Determination Council would provide an institutional mechanism for interpreting market information and projecting indicative prices or reference price ranges for different commodities and grades. Its assessments would take into account actual market transactions, production costs, seasonal availability, demand, imports, regional prices, transport and storage costs, weather conditions and the wider economic climate. In doing so, the Council would connect price signals with the lived realities of farmers, buyers, consumers and the national economy.

The Council’s work would provide a more informed basis for national production planning, commercial negotiations and market decisions, while allowing prices to respond to genuine market conditions. The distinction is important: a commodity exchange discovers prices through trading, whereas the Council would interpret those market signals against the wider economic and productive conditions of the horticultural industry. This brings together the transparency and market intelligence associated with an exchange with the national coordination and economic purpose of the pipeline. It also creates an opportunity to strengthen price transparency without allowing the requirements of a trading institution to determine how the country’s horticultural production system is organised.

6. Farmers, clusters and the changing role of agents

Once market demand has been quantified, the Ministry of Agriculture and cluster management can coordinate farmers around agreed production requirements. Farmers should have clarity on the crop, quantity, quality, planting schedule and delivery period required by the market. This creates a more dependable relationship between the farmer’s production decision and the commercial opportunity.

The farmer’s principal responsibility is to produce the agreed quantity and quality. The national production system and cluster management provide the coordination that supports this commitment. This includes technical guidance, production monitoring, aggregation planning and communication with the relevant market channels.

This is where the role of agents changes fundamentally. Once the farmer has agreed with cluster management and Ministry of Agriculture data on what to produce, and has produced the required quantity and quality, the farmer’s principal external service requirement is distribution. A distribution agent can provide collection, transport, delivery coordination and related services under a transparent service agreement.

The farmer should not have to pay several intermediary layers separately for market information, buyer connections, procurement coordination and access to a market that the national system has already identified and organised. These functions should be coordinated as part of the pipeline. Commercial service providers remain important, but their responsibilities and charges should be clear.

The distribution agent becomes a competitive service provider within the pipeline, rather than the gatekeeper of the farmer’s market access, buyer information or commercial relationships. This distinction allows private enterprise to participate while reducing unnecessary intermediation and cumulative charges.

The role of the agent within the pipeline

FunctionOrganising responsibilityRole of commercial service providers
National demand intelligenceDemand Spine and dashboardProvide market data, buyer information and specialist research under agreed standards
Production planningMinistry of Agriculture and production coordinationProvide technical services, inputs and contract-farming support
Farmer and cluster coordinationAgricultural coordination and cluster managementProvide contracted technical, operational and management services
Buyer requirements and commercial agreementsDemand management and market coordinationParticipate in procurement, contracting and buyer services
Aggregation and qualityThroughput coordination and accredited facilitiesOperate packhouses, grading, certification, storage and handling services
DistributionThroughput planning and delivery coordinationCompete to provide collection, transport and delivery services
Market feedbackNational dashboard and system governanceSubmit verified delivery, sales, inventory and performance data

This arrangement is not an attempt to remove commercial enterprise from the horticultural economy. It is an attempt to organise the functions so that businesses compete to provide valuable services within a coordinated national system. The pipeline creates opportunities for logistics companies, warehouse operators, graders, processors, transport providers, data businesses and commercial agents, while giving farmers a clearer route to market.

7. Price formation, the spoilage tax and the cost of intermediation

The price consumers pay for produce accumulates across the journey from farm to market. It can include the farm-gate price, procurement and brokerage charges, collection, grading, packaging, storage, transport, losses, wholesale margins and retail margins. The purpose of the pipeline is to identify the legitimate costs of these activities, expose duplication and inefficiency, and improve the transparency of the margins accumulated along the way.

One of the highest hidden costs is the spoilage tax. When produce is lost in the field, deteriorates during transit or is rejected after arrival, the cost of that loss can be recovered through the price of the produce that survives. Consumers may therefore pay more because the system has lost produce elsewhere. Farmers, meanwhile, may receive little or no return on the produce that was lost.

The working strategy provides an illustrative comparison of a one-kilogram basket under a commission-agent spot model and an integrated cold-pipeline model. It estimates a consumer price of P17 per kilogram under the agent model and P12 under the pipeline model. The comparison illustrates how lower spoilage and more coordinated logistics could reduce the cost reaching the consumer while allowing the farmer a higher baseline return.

Step-by-step retail price build-up comparison: illustrative 1 kg basket

Price build-up stageCommission-agent spot model (BWP)Integrated cold-pipeline model (BWP)Economic impact and driver
1. Baseline farm-gate costP6.00/kgP6.50/kgPipeline model provides a higher, more predictable grower return
2. Post-harvest waste / spoilage factor+P2.57/kg (30% loss)+P0.34/kg (less than 5% loss)Pre-cooling and cold-chain management reduce the spoilage cost
3. Middleman / logistics fee+P1.03/kg (12% agent fee)+P1.20/kg (integrated cold logistics)Replaces floor brokerage with coordinated physical logistics
4. Uncooled transit and handling+P1.50/kgIncluded in pipelineReduces separate uncooled handling and transit costs
5. Retail supermarket risk markup+P5.90/kg (high-risk allowance)+P3.96/kg (standard retail margin)More reliable grading and delivery reduce retailer risk
Final consumer checkout priceP17.00/kgP12.00/kgP5.00/kg difference; approximately 29.4% lower
Consumer home shelf life24–48 hours7–10 daysLonger household usability through improved handling and preservation

The P5 difference represents an illustrative saving of approximately 29.4% against the P17 comparison price. The model’s components add to the stated totals. These are scenario values supplied in the strategy document; they should be treated as a model for testing rather than a verified national retail price survey. Actual results will vary by crop, grade, season, route, storage requirement, contract and retailer.

The scale of the potential value is worth examining. If a P5/kg saving were achieved across different annual throughput volumes, the resulting scenario values would be:

Annual throughputIllustrative saving at P5/kg
1,000 MTP5 million
10,000 MTP50 million
25,000 MTP125 million
50,000 MTP250 million
100,000 MTP500 million

These figures are scenario calculations, not guaranteed savings or realised national benefits. They show why the industry should measure cost per kilogram across the entire pipeline. The objective is to improve farmer returns and consumer affordability together by reducing avoidable losses, duplicate handling and unnecessary intermediary charges.

8. Artificial scarcity: monitoring the movement of produce

A further issue for the national dashboard is the possibility of artificial supply suppression. A genuine shortage may result from weather, seasonality, crop failure or insufficient productive capacity. A different situation arises when available produce is deliberately withheld, delayed, diverted or restricted from reaching the market in order to influence prices.

Where several intermediary layers control information and the movement of produce, opportunities for artificial scarcity may increase. Prices can rise even when sufficient produce exists within farms, aggregation facilities, storage or distribution networks. The farmer may receive no corresponding benefit from the higher price paid by the consumer.

Regulation of agents alone cannot resolve this issue. The pipeline must track what was produced, harvested, dispatched, received, graded, stored, sold, diverted, exported or lost. It must compare actual supply with market deliveries and price movements, identifying discrepancies for investigation. A price increase alongside a fall in market deliveries may be a signal requiring investigation; it is not, by itself, proof of deliberate manipulation.

The dashboard therefore becomes a practical instrument of market transparency and accountability. It enables the industry and relevant authorities to distinguish genuine supply shortages from breakdowns in distribution, inventory accumulation, delayed deliveries or potentially deliberate withholding.

The pipeline must remain wide. Production capacity, throughput, distribution, information and market access must expand together. A system that produces sufficient food but allows its movement to become artificially restricted will struggle to deliver the food-security and affordability benefits that production growth should create.

9. The physical corridor: building infrastructure around the flow

The national pipeline requires a physical network that connects production clusters to markets. The Integrated National Cold Supply Pipeline is a major component of the Throughput Spine, but it is one part of the wider national economic pipeline. Its purpose is to preserve quality, reduce losses, support aggregation and make reliable delivery possible.
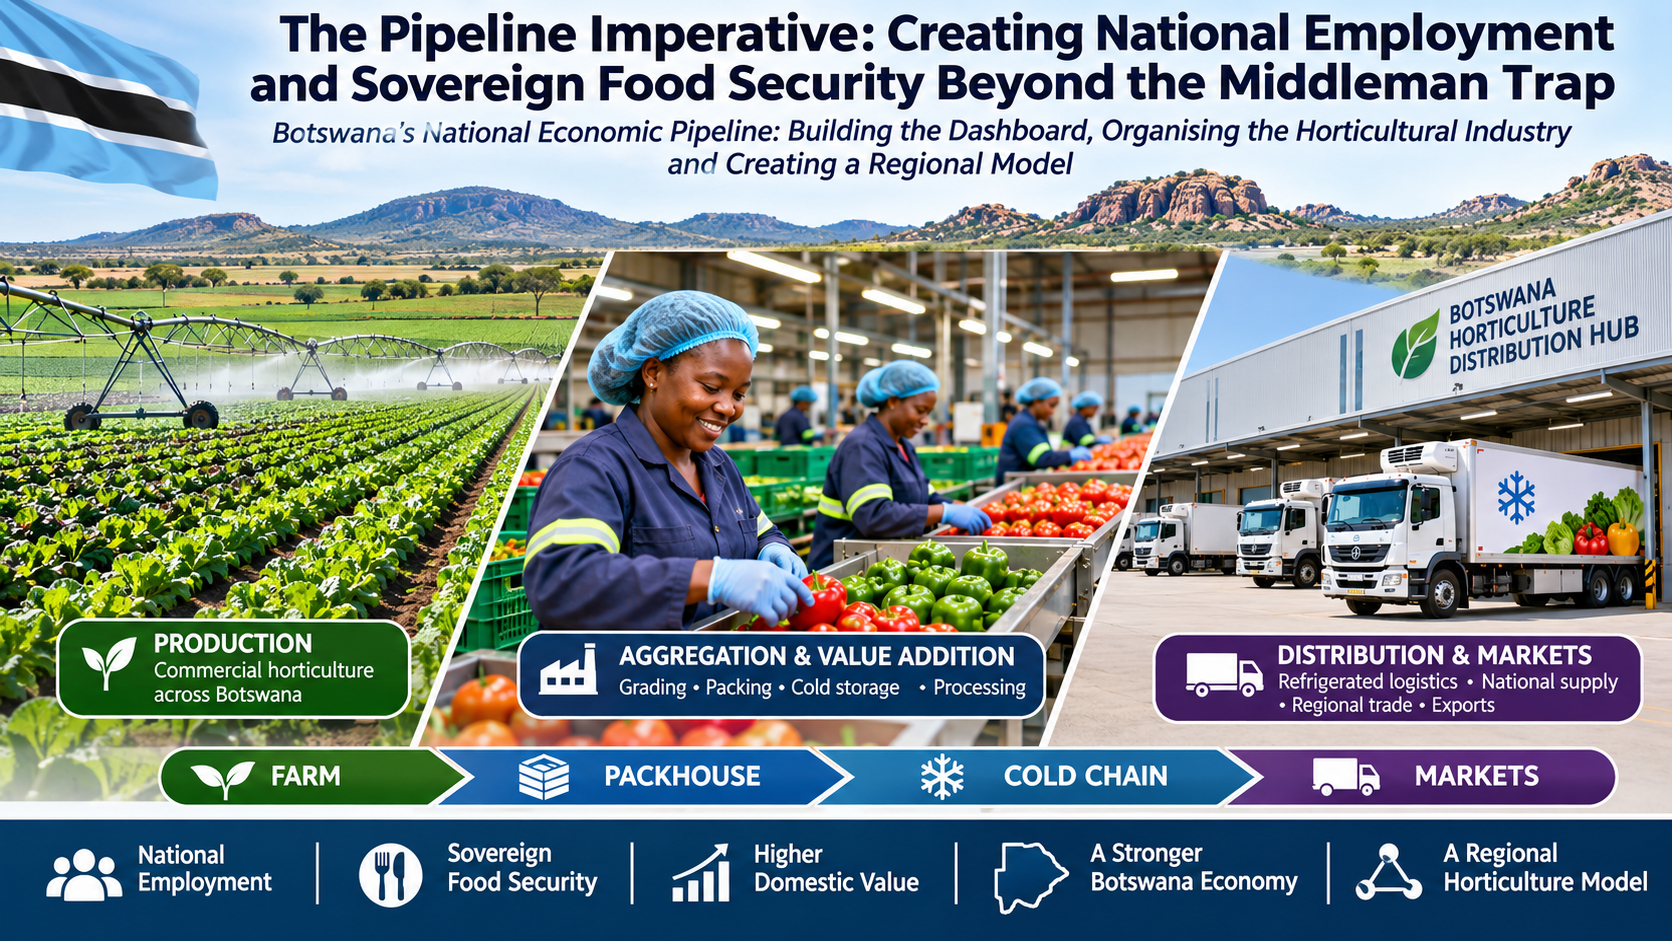
The operational sequence can include:

Farm production clusters → farm packhouses and pre-cooling → refrigerated transport → regional aggregation hubs → grading and certification → cold storage → processing and distribution → retail, institutional and export markets.

Facilities such as CEDA Letsema and the Safe Pro Sherwood facility are identified in the working material as elements of the existing or emerging infrastructure landscape. The source reports a 4,700-tonne capacity for the Safe Pro facility and a P65 million investment, with storage capability of up to eight months. These figures, together with current operational status, actual utilisation, temperature performance and commercial access arrangements, should be verified before infrastructure planning relies on them.

The strategy also identifies a significant infrastructure gap among smallholders: in a survey of 102 smallholders, only one reportedly owned a cold room and only one used a refrigerated truck. This is an important indicator of the scale of the challenge, subject to verification of the survey methodology and sample coverage.

Infrastructure planning must follow demand, production geography, seasonality and throughput. A distribution centre, cold-storage facility or packhouse should be justified by the actual volumes it will handle, the routes it will serve, the time produce needs to be held and the commercial requirements of its buyers. Building facilities first and searching for throughput afterwards risks creating expensive assets that fail to solve the underlying problem.

The same principle applies to processing. Produce that does not meet fresh retail specifications may still have value for processing, depending on food safety, quality and the intended product. The working strategy identifies NAPRO and potential products such as tomato paste, juices, pickles and dried produce. Processing can provide an additional market for suitable seasonal surplus, create manufacturing employment and retain more value within Botswana.

Seasonal coordination is equally important. The strategy gives the example of balancing Chobe’s winter output with Tuli Block’s summer production. The dashboard and production planners should use such geographic and seasonal differences to organise a more consistent national supply, reducing simultaneous gluts and improving year-round market availability.

10. The skills required to organise the pipeline

The pipeline requires a multidisciplinary management capability across the three spines and the information systems connecting them. Agricultural officers alone cannot manage the full national system, just as commercial agents alone cannot organise it. The work requires professionals in economics, mathematics, statistics, operations research, horticulture, engineering, logistics, quality assurance, commercial management, information systems and governance.

The absence of a particular skill in the current workforce establishes a capability-building requirement. It gives Botswana a reason to identify the expertise needed, quantify the gaps, determine where the skills can be sourced and organise their development. The pipeline itself provides the framework for identifying the country’s skills requirements.

Professional capabilities required across the national pipeline

CapabilitySkills requiredPrincipal responsibility
Demand intelligenceMathematicians, statisticians, economists, market researchers and data analystsQuantify demand and identify market requirements
Production planningAgricultural economists, operations researchers and production plannersTranslate demand into production volumes, locations and schedules
Agricultural coordinationAgronomists, horticulturalists, irrigation and crop specialistsAssess and coordinate productive capacity
Farmer and cluster managementExtension specialists, cluster coordinators and farm managersOrganise farmers and monitor production commitments
Aggregation and qualityFood scientists, post-harvest specialists and quality assurance officersManage collection, grading, standards and consolidation
Logistics and distributionSupply-chain specialists, transport planners and cold-chain managersCoordinate physical movement and delivery
Commercial managementProcurement, contract and trade specialistsCoordinate buyer requirements and commercial agreements
Information and governanceSystems analysts, information managers, auditors and monitoring specialistsOperate the dashboard, track performance and identify discrepancies

These capabilities do not all have to sit within one institution. Their institutional placement should follow function, mandate and accountability. What matters is that the capabilities exist, that responsibilities are clear and that the three spines are connected.

Botswana can map the expertise already available across ministries, universities, research institutions, the private sector and professional bodies. Critical specialist expertise can be recruited from the region or internationally, with structured knowledge transfer and local professional development. Partnerships with tertiary institutions, internships, practical placements and postgraduate training can build the next generation of cold-chain engineers, packhouse managers, digital crop graders, supply-chain specialists and agricultural planners.

11. How many people are required to manage the pipeline?

The discussion must move beyond naming professional disciplines to estimating the actual workforce required. An initial planning hypothesis in the working material proposes a national coordinating unit of approximately 25–35 specialists. Regional aggregation corridor teams could require approximately 10–14 people each, depending on geographic coverage, throughput, crop range and operational complexity.

These are indicative planning assumptions, rather than a completed Botswana workforce assessment. They must be tested against the actual number of production clusters, participating farmers, crop varieties, production volumes, delivery destinations, distances and infrastructure requirements.

Indicative management staffing model

Management levelIndicative staffingMain responsibilities
National pipeline coordinating unit25–35 specialistsNational leadership, demand intelligence, production planning, technical coordination, logistics planning, commercial coordination, dashboard management and governance
Each established regional corridor10–14 peopleCorridor management, production and cluster coordination, agricultural support, aggregation, quality, logistics and reporting
Five regional corridors50–70 peopleCombined regional corridor management capacity
National and five corridor teams75–105 peopleIndicative combined national and corridor management workforce
Cluster coordinationAdditional staffing to be assessedFarmer coordination, production monitoring and technical support based on cluster numbers, geographic spread and service intensity

Cluster coordination should be calculated against the number of participating clusters, their geographic spread and the level of technical support required. One possible planning assumption is one cluster coordinator for every 10–15 clusters, with technical specialists supporting several clusters. The actual ratio will depend on travel distances, farm sizes, crop diversity and the intensity of production support.

The assessment should produce three distinct workforce estimates:

  • National system-management workforce: people who plan, coordinate, analyse and govern the pipeline.
  • Regional and cluster-management workforce: people who coordinate production, farmer participation, aggregation and delivery.
  • Productive and commercial workforce: people directly involved in farming, technical services, grading, warehousing, transport, processing and distribution.

The national coordinating unit should remain lean and focused on system performance. It is not intended to employ every person working in horticulture. The wider employment footprint emerges through farms, service businesses, logistics, processing, retail and the supporting industries connected to the pipeline.

12. Employment throughout the pipeline: a national economic dividend

A common justification for the commission-agent model is its potential to generate employment. The wider pipeline provides a much broader employment base, distributed across production districts and across a range of technical, operational, commercial and manufacturing occupations.
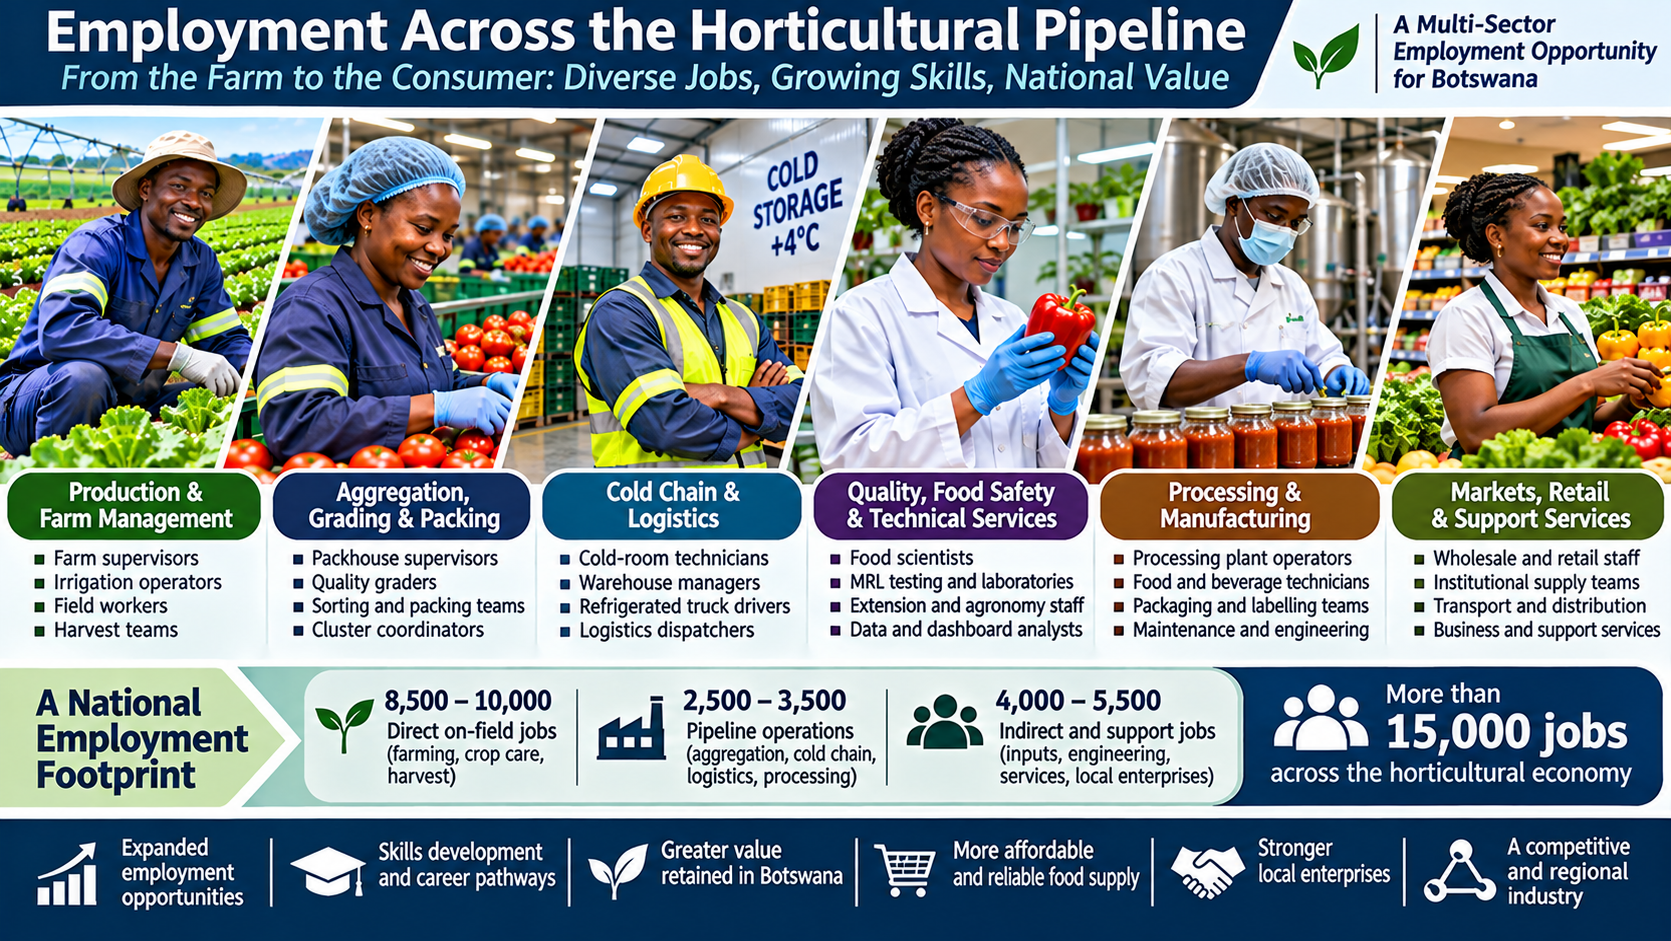
The strategy estimates more than 15,000 jobs across direct field employment, pipeline operations and indirect and support services, compared with an estimate of fewer than 300 floor-broker roles under the commission-agent model. These figures are projections and require a transparent employment methodology before being presented as a verified comparative impact study. In particular, the analysis should distinguish permanent, seasonal and full-time-equivalent jobs, avoid double counting, and separate direct, indirect and induced employment.

Comprehensive national employment projections matrix

Employment sector / tierSpecific functional rolesProjected jobsPrimary locationLabour demographics and skill profile
Tier 1: Direct on-field labourFarm supervisors, irrigation operators, field hands and seasonal harvesters8,500–10,000Rural agricultural districts: Chobe, Tuli, Boteti, Lobatse and CentralSource estimates 66% Batswana citizens and 34% regional skilled labour, including 30% Zimbabwean workers
Tier 2: Direct pipeline operationsPackhouse supervisors, digital quality graders and cold-room technicians800–1,200District aggregation hubs and packhousesSkilled technical and supervisory roles
Tier 2: Direct pipeline operationsCold-storage facilities and warehouse managers400–600Commercial cold hubs, including Safe Pro SherwoodCertified refrigeration and warehouse staff
Tier 2: Direct pipeline operationsRefrigerated transport fleet drivers and logistics dispatchers500–700Logistics corridors and fleet depotsProfessional heavy-vehicle and fleet coordination
Tier 2: Direct pipeline operationsAggregators, Letsema hub managers and market staff300–500Regional market distribution hubsMarket operations and commercial management
Tier 2: Direct pipeline operationsAgro-processing operators: NAPRO, juices, pastes and drying500–800Industrial processing zonesIndustrial manufacturing and food-science technicians
Subtotal Tier 2 pipelinePipeline infrastructure and operations2,500–3,500Nationwide logistics networkTechnical and logistics careers
Tier 3: Indirect and supportInput manufacturing: shade nets, drip pipes, fertiliser, nurseries1,200–1,500Industrial centres and rural supply storesManufacturing, retail and nursery labour
Tier 3: Indirect and supportTechnical engineering: boreholes, solar pumps and machinery repair800–1,000Field service corridorsSkilled mechanical and solar technicians
Tier 3: Indirect and supportExtension officers, MRL laboratory testing and digital dashboard analysts500–700Regional service centres and laboratoriesAgronomists, laboratory scientists and data analysts
Tier 3: Indirect and supportInduced community retail, hawking and local services1,500–2,300Farming townships and rural centresInformal retail and service micro-entrepreneurs
Subtotal Tier 3 indirectIndirect and support footprint4,000–5,500Broad national economyMulti-sector economic spillover
Total employmentComplete national footprintMore than 15,000NationwideDistributed agricultural and industrial employment

The workforce estimates in the source document provide a starting model for examining employment across the horticultural economy. The labour composition figure of 66% citizens and 34% foreign workers, including 30% Zimbabwean workers, also requires confirmation of its survey source, sample and date. Once validated, it should inform workforce planning and training policy.

Employment develops progressively as the pipeline becomes operational. Organising demand creates analytical and planning roles. Mobilising production creates work for farmers, farm managers, agronomists, irrigation specialists and field workers. Building throughput creates jobs for graders, packhouse teams, warehouse operators, cold-chain technicians and drivers. Increasing value addition creates opportunities for food technologists, manufacturing workers, packaging specialists, maintenance personnel and export professionals.

The employment study should therefore examine more than a headline job total. It should measure job quality, occupation, location, remuneration, skills, employment duration, investment per job, productivity and the value retained within Botswana.

13. National production, land and project projections

The strategy document provides a crop-level production and land matrix for the 2025/26 baseline. This is important because a national pipeline must be designed around the actual composition of production, rather than treating horticulture as a single undifferentiated volume.

National produce, land and project projections matrix: 2025/26 baseline

Crop categorySpecific crop typeProjected volume (MT)Share of total volumeCultivated land area (ha)Primary production system
Local vegetablesCabbage32,50023.1%1,100Open field / drip irrigation
Local vegetablesTomatoes26,50018.8%850Shade nets / tunnels / open field
Local vegetablesPotatoes22,50016.0%750Commercial open field, high density
Local vegetablesOnions16,50011.7%550Commercial open field
Local vegetablesRape and leafy greens11,0007.8%400Smallholder open field
Local vegetablesOther vegetables: carrots, beetroot, peppers and butternut5,0803.6%465Mixed open field / shade nets
Subtotal vegetablesAll vegetable crops114,08080.9%4,11585% open field / 15% protected
Local fruitsCommercial citrus: oranges, lemons and grapefruit22,00015.6%1,077Integrated commercial FDI orchard
Local fruitsWatermelons and subtropical fruits4,8013.4%Approximately 350Open field, rain-fed / drip
Subtotal fruitsAll fruit crops26,80119.1%1,427Integrated orchard and field
Total nationalHorticulture production140,881100.0%More than 5,1921,630+ active citizen and commercial farms

The crop matrix identifies where the greatest production volumes and land commitments are concentrated. It can inform aggregation capacity, seasonal storage, transport planning, grading specifications, processing opportunities and the geographical placement of facilities. Before implementation, the production figures and land totals should be checked against the underlying agricultural records, particularly where commercial estates and citizen-farmer programmes are reported together.

The strategy also identifies the Selebi-Phikwe Citrus development as a major commercial investment, with reported capital expenditure of P491 million, more than P200 million in foreign direct investment and 1,077 hectares. The source reports an initial harvest of 22,000 MT and exports of 18,000 MT in 2025/26, valued at approximately P120 million, with destinations including Europe, the Middle East, Zambia and Namibia. These project-specific figures should be verified with the project and trade records. The wider point is that large-scale commercial production can connect Botswana to export markets when production, packhouse capacity, quality and logistics are organised together.

14. Food balance, domestic availability and regional trade

Production growth must be examined alongside the volume of food that reaches domestic consumers. The food balance matrix in the strategy document illustrates why this distinction matters. It compares local production, post-harvest losses, imports, exports, net domestic availability and estimated per-capita availability across a 2021 baseline, the 2025/26 position and a 2028 pipeline target.

Food balance sheet and regional trade pipeline matrix

Food balance sheet metricPre-pipeline baseline (2021)Current status (2025/26)Pipeline target (2028 horizon)Strategic and regional significance
Total local production66,000 MT140,881 MT185,000 MTExpanded civilian and commercial production
Post-harvest loss19,800 MT (30%)35,881 MT (25.5%)Less than 9,250 MT (less than 5%)Targeted reduction in annual spoilage
Total imports94,954 MTApproximately 25,000 MTLess than 10,000 MTImport volume and expenditure reduction
Total exports1,000 MT (approximately P10M)18,000 MT (approximately P120M)More than 45,000 MT (more than P320M)Growth through citrus and regional SADC trade
Net domestic availability140,154 MT112,000 MT165,750 MTFood volume reaching domestic consumers
Net per-capita availabilityApproximately 58.4 kg/person/yearApproximately 44.8 kg/person/yearApproximately 63.8 kg/person/yearDomestic availability and food-security indicator

The figures in this table are reproduced from the working strategy. They require a full reconciliation against the underlying food balance methodology before publication as official national statistics. In particular, the calculation of net domestic availability must account consistently for production, imports, exports, losses, stock changes and any other relevant adjustments. Per-capita availability is a food-balance indicator and should not be described as measured household consumption.

The regional dimension is essential. Botswana’s horticultural development should strengthen its capacity to supply domestic markets while building competitive export corridors. The Selebi-Phikwe Citrus development illustrates the potential of connecting commercial production to international and regional markets. A national pipeline can extend that capacity to other crops and production areas by coordinating quality, volumes, logistics, and buyer requirements.

The working strategy also raises the importance of SACU trade relations and the Common Revenue Pool. Trade restrictions and import controls have wider regional and fiscal implications. A pipeline-led approach can support a more balanced two-way trade framework: Botswana develops its domestic productive capacity, exports surplus and high-value produce, and participates in regional trade through reliable supply arrangements. The implications of particular restrictions should be assessed against SACU obligations, regional commitments and the country’s wider trade interests.

Agro-processing provides another route for regional value creation. A dependable supply of graded raw materials can support processors such as NAPRO and businesses producing tomato paste, juices, dried foods and other horticultural products. This connects primary agriculture to manufacturing, packaging, transport, marketing and regional distribution.

15. Fitness to farm, competition and citizen participation

The growth of horticulture also raises questions about who produces, under what authority, who controls market access and how local farmers participate in the expanding economy. These questions should form part of the national industry discussion, supported by evidence and consistent standards.

Reported concerns about land use, operating permissions, equipment, infrastructure, business compliance and supply arrangements require investigation. The same standards should apply to citizen and non-citizen operators. The relevant questions include whether land and operating permissions are valid, whether production activity complies with applicable requirements, what productive capacity is being used, how businesses employ and pay workers, and where the produce is sold.

There are also questions about direct supply relationships between large commercial producers and grocery retailers, and the potential barriers facing independent local farmers. These relationships should be examined through procurement data, supply contracts, market shares, volumes and competition analysis. Allegations about particular operators or supply arrangements require verification before they are presented as established facts.

The working material proposes progressive citizen procurement quotas over a ten-year period. These are proposals for consideration, rather than existing legal requirements.

Proposed progressive citizen procurement framework

Implementation periodProposed citizen procurement share
Years 1–320–30%
Years 4–635–45%
Years 7–950–60%
Year 1065% or more

Any such framework would require a careful assessment of productive capacity, crop availability, quality, price competitiveness, procurement law, competition policy and Botswana’s regional and international trade obligations. The objective should be to strengthen citizen participation, enterprise development, employment and domestic value creation while providing a sound framework for productive investment.

The distinction between domestic production and citizen ownership also matters. Produce grown in Botswana contributes to domestic supply, while citizen ownership and participation raise additional questions about the distribution of economic opportunity. The national dashboard and industry data should make these dimensions visible so that policy can be informed by evidence.

16. What the first industry meeting should organise

The first industry meeting led by Mr Molefhe should provide a practical starting point for the wider architecture. Its immediate purpose is to establish a shared understanding of what must be organised, who must take responsibility, what information is required and what work should begin first. It should bring together the productive, commercial, institutional and technical perspectives needed to shape the national pipeline.

The discussion should move beyond whether Botswana needs agents or a trading floor. It should examine the national Demand, Supply and Throughput Spines, the dashboard that connects them, and the commercial and physical services required to make them work.

The meeting should consider the following work areas:

  1. National demand intelligence: Identify the major domestic and regional markets, quantify demand by crop and specification, and establish how buyer information will be collected and updated.
  2. Production capacity and farmer clusters: Map farmers, production areas, land, water, crop suitability, infrastructure, seasonal production and the potential organisation of clusters.
  3. The national dashboard: Define the information required, the institutions and businesses that will contribute data, governance arrangements, access rules and the process for validating information.
  4. Aggregation and distribution corridors: Map existing facilities, identify infrastructure gaps and determine the location, capacity and commercial justification of required aggregation, cold-chain and distribution services.
  5. Commercial arrangements and agent services: Define the role of distribution agents and other service providers within the pipeline, including transparent service charges, performance requirements and accountability.
  6. Skills and workforce requirements: Identify existing professional capabilities, estimate national and corridor staffing requirements, map skills gaps and establish recruitment, regional partnership and training priorities.
  7. Price, loss and market transparency: Establish how the industry will measure farm-gate, wholesale and retail prices, commissions, spoilage, rejections, storage, delivery performance and unexplained supply discrepancies.
  8. Employment and domestic value creation: Define how direct, indirect and induced employment, farmer income, citizen participation, processing and value retained in Botswana will be measured.
  9. Regional trade and processing: Identify opportunities for exports, seasonal exchange, processing and regional market partnerships, while assessing the relevant trade and regulatory implications.

The immediate objective is to establish the organisational requirements and agree on the first work programme. It is a focused industry-organising exercise, with the national economic pipeline as its framework. The wider economic transformation agenda remains a national responsibility. The first meeting can help establish the industry architecture, the evidence base and the institutional coordination required to advance it.

17. The regional opportunity: building a model others can learn from

Botswana has an opportunity to develop a national horticultural pipeline that connects productive capacity, market demand, logistics, processing, skills and trade through a shared information system. The model can begin with horticulture, where the production expansion and the challenges of market access, post-harvest loss and distribution make the need for coordination visible.

Its regional value will come from the way the system is organised. A national dashboard can provide market and production intelligence. Coordinated clusters can organise supply. Aggregation and cold-chain corridors can preserve quality and move produce. Processing can convert suitable surplus into manufactured products. Regional trade can connect seasonal production differences and expand market opportunities.
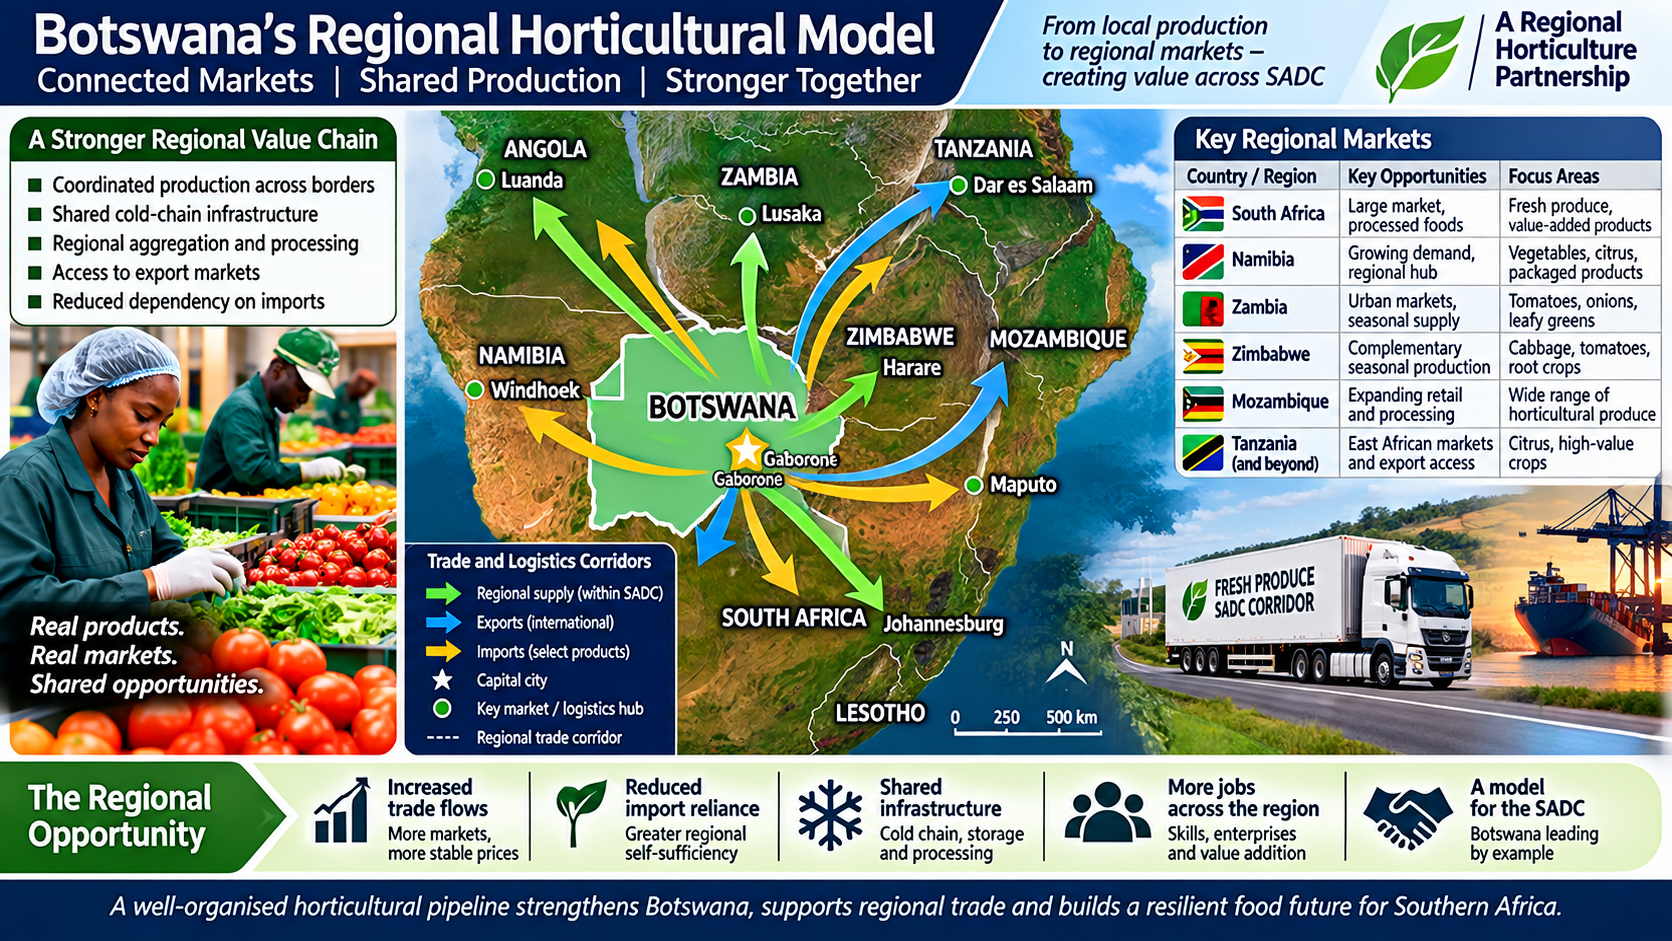
The ambition should be to build a model that the region can study and adapt: one that demonstrates how a country can organise its agricultural economy around verified demand, coordinated production, transparent commercial services, accountable physical movement and measurable employment outcomes.

This is a wider opportunity for Botswana’s professional and technical workforce. It creates demand for economists, statisticians, agricultural planners, agronomists, engineers, food scientists, quality specialists, logistics managers, data analysts, procurement professionals and commercial operators. It also creates opportunities for local businesses to provide services and build enterprises around the national production system.

The pipeline can therefore become a platform for national capability development. Rather than waiting for every required skill to be available before the system begins, Botswana can identify the skills required by each stage, map existing expertise, recruit critical capabilities and develop local professionals through practical deployment.

18. The national imperative

Botswana has demonstrated that horticultural production can expand. The next task is to organise the economic relationships that turn production into reliable supply, viable farms, affordable food, employment, manufacturing and regional trade.

The national dashboard provides the shared intelligence. The Demand Spine identifies what the market requires. The Supply Spine organises productive capacity and farmers. The Throughput Spine moves produce through aggregation, storage, processing, logistics and distribution. Professional management connects these functions, monitors performance and ensures that the system learns from actual results.

Within this architecture, agents and other commercial service providers have a place. Their contribution should be defined by the service they provide, the cost they charge and the value they create. Distribution is an essential service. Market intelligence, production planning, quality management, aggregation and commercial coordination are also essential capabilities, but they should be organised as part of the national pipeline rather than duplicated through layers of fragmented intermediation.

The employment opportunity extends far beyond the trading floor. It reaches farms, clusters, packhouses, cold stores, laboratories, transport companies, processing facilities, data operations, input manufacturing and regional trade. The food-security opportunity is equally significant: more of what Botswana produces can reach domestic consumers, while a stronger production and distribution system can support competitive exports.

The national imperative is to build the pipeline that connects the country’s productive capacity to its economic future. The first industry meeting is an opportunity to begin that work with clarity: organise the information, define the functions, identify the skills, quantify the workforce, map the physical flow and establish the shared responsibilities.

The opportunity before Botswana is to move beyond organising transactions and begin organising the productive economy itself.


Editorial and data note: This article integrates the supplied national horticulture pipeline strategy and the subsequent working material on the Demand, Supply and Throughput Spines, dashboard, staffing, agent functions and industry meeting. Figures described as estimates, projections, proposals, or scenario values retain that status. Source discrepancies and claims requiring verification have been identified in the relevant sections. The tables are retained in the article body for readers to examine alongside the argument.


The National Horticultural Pipeline and the Commodity Exchange Market: Why they should connect, why they should remain distinct, and how they can work together

Responding to the need for price discovery

In our conversation, Mr Molefhe raised an important issue: the need for price discovery in the horticultural market. I agree with him. Farmers, buyers, processors, retailers, and other participants need reliable information about prevailing prices, available quantities, quality specifications, and market demand. Without this information, farmers make production decisions with limited knowledge of the market, while buyers and sellers negotiate from different information positions.

A commodity exchange can contribute meaningfully to addressing this problem. However, I believe we should examine its role within the wider national horticultural system before making it the centre of our proposed market arrangements.

The distinction I would like us to consider is between organising the market for trading commodities and organising the national economy that produces, processes and distributes those commodities.

Our proposed national horticultural pipeline addresses the latter. A commodity exchange can become one of the mechanisms operating within it.

1. Why we should consider a commodity exchange

A commodity exchange provides an organised marketplace through which buyers and sellers can trade according to established rules, commodity specifications and transaction procedures. Its contribution to the horticultural industry could include:

Price discovery: Published prices and recorded transactions can provide farmers and buyers with a more reliable reference for commercial negotiations. This can reduce dependence on individual agents or isolated buyer quotations.

Market access: An organised exchange can bring together a wider pool of buyers and sellers, potentially increasing competition and creating opportunities for producers to reach markets beyond their existing commercial relationships.

Transparency: Transaction records, traded volumes, commodity grades and prices can provide a clearer picture of market activity. This information can help identify price differences between locations, grades and market channels.

Commercial planning: Where suitable arrangements exist, spot trading and forward contracts can help buyers and producers plan their procurement and production commitments.

Access to finance: Standardised grades, documented transactions and reliable storage arrangements can support the development of warehouse receipt systems and other financing mechanisms. These require appropriate legal, institutional and physical infrastructure.

These are worthwhile contributions. We should therefore recognise the commodity exchange as a potentially valuable institution within Botswana’s horticultural market architecture.

2. Why the commodity exchange cannot replace the national pipeline

A commodity exchange primarily organises trading. It does not automatically organise the productive and physical systems required to make commodities available.

For example, a published market price for tomatoes does not establish how many tonnes farmers should plant, where production should take place, when harvesting should occur, how the produce will be graded, where it will be stored, or how it will reach the buyer before its shelf life expires.

Those are national pipeline functions.

Our proposed pipeline brings together three interconnected spines:

The Demand Spine establishes what the market requires: the crops, quantities, grades, quality, delivery locations, prices and schedules required by households, retailers, hospitality businesses, processors, public institutions, wholesalers and regional markets.

The Supply Spine organises the productive response. It connects the Ministry of Agriculture, farmers, production clusters, land and water resources, crop suitability, planting schedules, technical support and production commitments.

The Throughput Spine organises the physical movement of produce through harvesting, aggregation, grading, certification, pre-cooling, cold storage, processing, logistics and distribution.

The national dashboard connects these three spines. It provides the intelligence required to compare market demand with productive capacity and actual produce movement.

A commodity exchange can support price discovery and transactions within this arrangement. It cannot perform all these functions on its own.

3. Why we should be cautious about making an exchange the organising institution

There are several considerations, particularly for fresh horticultural produce.

First, market participation requires productive capacity. Farmers need sufficient volumes, consistent quality, appropriate grading, storage, transport and access to buyers. Small and independent farmers may face barriers to exchange participation if these requirements are left to individual producers to meet.

Second, horticultural produce is perishable. Tomatoes, lettuce, leafy vegetables and other fresh produce require close coordination between harvesting, handling, storage and delivery. A trading platform cannot compensate for inadequate cold-chain infrastructure or delayed distribution.

Third, price transparency does not automatically produce fair participation. A farmer may know the prevailing market price but still lack the bargaining power, financial capacity, volume or infrastructure to access that market.

Fourth, an exchange introduces its own costs and requirements. Membership, brokerage, transaction charges, grading, certification, storage and delivery arrangements must be examined to establish whether participation improves the farmer’s net return.

Fifth, trading information and physical supply information are different. Recorded transactions tell us what has been traded. The national pipeline must also establish what has been produced, harvested, dispatched, received, stored, rejected, sold, diverted or lost.

We should therefore avoid assuming that establishing an exchange will, by itself, resolve the structural problems facing the horticultural industry.

4. Does the agent model fit better with a commodity exchange?

The traditional commission-agent model is more closely associated with intermediary-based trading. Agents connect farmers with buyers, facilitate sales and earn commissions. Brokers also have a recognised role in organised exchange markets.

However, we should distinguish between the traditional commission floor arrangement and a broker operating under the rules of a regulated exchange.

Both can facilitate transactions, but the conditions governing price information, fees, trading records, market access and accountability may differ.

Our position should therefore accommodate agents and brokers as commercial service providers, while establishing transparent rules for their participation.

The pipeline changes the starting point.

Once production has been coordinated through the farmer clusters and the Ministry of Agriculture’s production information, and the farmer has met the agreed crop, quantity, quality and schedule, the farmer’s principal external service requirement becomes access to distribution and buyers.

Distribution agents can compete to provide that service. Other specialist businesses can provide aggregation, grading, storage, processing, logistics and market services.

The objective is to create a competitive service environment within an organised national system, rather than allow the entire system to depend on individual intermediary relationships.

5. How the two models can work together

I propose that we retain the national horticultural pipeline as the organising architecture and connect it to a national horticultural market platform.

The market platform could accommodate several trading arrangements:

  1. Direct supply contracts: Agreements between farmers or farmer clusters and retailers, processors, hospitality businesses and institutional buyers.
  2. Wholesale markets: Competitive trading and aggregation for buyers and sellers requiring physical market facilities.
  3. Agents and brokers: Commercial intermediaries operating under transparent terms, with clearly defined responsibilities and charges.
  4. Commodity exchange transactions: Trading of suitable commodities through an organised exchange, subject to the required standards and infrastructure.
  5. Forward supply agreements: Commercial arrangements that connect planned production with anticipated buyer requirements.
  6. Institutional procurement: Structured procurement arrangements for public institutions and other large-volume buyers.

The national dashboard would provide the shared intelligence required to connect these mechanisms. It would track market requirements, production commitments, actual harvests, available inventory, prices, deliveries, losses and market absorption.

This would give the industry a common information foundation while allowing different commercial models to operate competitively.

6. Which horticultural commodities are suitable for exchange-based trading?

We should also recognise that horticultural commodities have different physical and commercial characteristics.

Grains such as maize, wheat and sorghum are generally more suited to conventional commodity exchange arrangements because they can be graded, stored and traded in standardised quantities over longer periods.

Fresh vegetables and fruit require more immediate coordination. Their quality, maturity, shelf life, handling requirements and delivery schedules can vary considerably.

Processed and storable horticultural products may offer additional opportunities. Dried produce, tomato paste, juices and other standardised products can potentially be traded under arrangements that differ from those required for fresh produce.

This does not exclude fresh produce from an exchange. It means that the trading arrangements must be designed around the commodity and the physical supply chain.

7. Who benefits, and who carries the cost?

This should be one of our central tests when assessing any proposed market institution.

We should ask whether the arrangement improves the position of farmers, consumers and local enterprises, or whether it primarily improves the efficiency of transactions for those who already control market access.

The assessment should consider:

  • Whether farmers receive better market information and improve their net returns after commissions, logistics and other charges.
  • Whether small and independent farmers can participate through aggregation and shared infrastructure.
  • Whether buyers gain reliable access to quality produce and competitive supply.
  • Whether consumers benefit from improved availability, quality and affordability.
  • Whether local enterprises develop in storage, logistics, processing, packaging and distribution.
  • Whether employment expands beyond primary agricultural production.
  • Whether Botswana retains a greater proportion of the value generated by its horticultural production.

A commodity exchange can improve price discovery and trading transparency. The national pipeline must ensure that the wider productive economy benefits from those improvements.

8. How we should proceed

I would suggest that the first industry meeting examine the relationship between the two models before committing to a particular institutional arrangement.

The discussion could focus on five areas:

A. Understand existing market arrangements

Map the current wholesale markets, commission agents, brokers, direct procurement arrangements, processors, retailers and institutional buyers. Establish how prices are currently determined, where information is generated and who has access to it.

B. Examine price discovery requirements

Determine which prices need to be visible nationally: farmgate, wholesale, retail, processor procurement and regional market prices. Identify the frequency of reporting, the quality and grade specifications, the transaction volumes and the locations required.

C. Assess existing commodity exchange infrastructure

Establish what existing exchange facilities and institutions can accommodate, which commodities they serve, their participation requirements, transaction costs, trading volumes and regulatory arrangements. Identify whether a dedicated horticultural trading mechanism is necessary or whether existing facilities can be adapted.

D. Design the national dashboard and pipeline

Establish the information required to connect demand, production and physical throughput. The dashboard should distinguish between projected production, actual harvest, quantities dispatched, inventory received, quantities sold, losses and unsold or delayed stock.

E. Determine the appropriate market architecture

Only after understanding the existing arrangements and requirements should we decide which functions belong within direct contracts, wholesale markets, agent services, commodity exchange transactions or other commercial mechanisms.

The institutional arrangements should follow the requirements of the national system.

9. The proposition we should take forward

I believe Mr Molefhe’s observation about price discovery provides an important entry point into a much wider conversation.

We should not dismiss the commodity exchange. Equally, we should avoid assuming that a commodity exchange is the solution to the organisation of the horticultural industry.

Price discovery tells us what the market is willing to pay. Production planning tells us what the country should produce. The throughput system ensures that the produce reaches the market. The national dashboard connects the information and measures the performance of the entire system.

These functions are complementary.

Our ambition should be to establish a national horticultural pipeline within which farmers, agents, brokers, commodity exchanges, processors, logistics operators, retailers and other market participants can operate under transparent and competitive arrangements.

The ultimate objective is larger than improving the sale of produce. It is to organise a productive national economy that creates employment, strengthens local enterprises, improves food security, reduces avoidable losses and retains more economic value in Botswana.

We should organise the national pipeline first, establish the market mechanisms that best serve it, and ensure that price discovery becomes an instrument of national productive development.


Executive Cheat Sheet for Mr. Molefhe

Here is an executive TL;DR crib sheet tailored for Mr. Molefhe, specifically referencing the core economic arguments published in The Pipeline Imperative: Creating National Employment and Sovereign Food Security Beyond the Middleman Trap.


1. Zero Risk-Taking vs. Active Spoilage Elimination

  • The Agent Floor: Commission traders take zero financial or spoilage risk. If produce rots on a market floor, the farmer absorbs 100% of the loss, while the agent collects an 8%–15% fee on whatever portion happens to sell.
  • The National Pipeline: Establishes farm-gate pre-cooling and climate-controlled transit to eliminate Botswana’s 35,881 metric tonnes of annual post-harvest loss (~P250 Million in wasted farm revenue).

2. The Employment Reality: 300 Urban Brokers vs. 15,000 National Jobs

  • The Agent Floor: Generates fewer than 300 urban broker jobs in Gaborone and Francistown while extracting producer margins, forcing growers to cut field labor.
  • The National Pipeline: Creates >15,000 nationwide jobs across rural packhouses, digital quality grading, cold-fleet logistics, refrigeration engineering, agro-processing (NAPRO), and agronomic extension.

3. Supermarket Shelf Access: The Cold Chain Gap

  • The Agent Floor: Supermarkets reject local smallholder produce due to broken cold chains, pesticide residue (MRL) non-compliance, and inconsistent grading—not because of a lack of floor traders. An agent on a trading floor cannot fix a heat-damaged crop.
  • The National Pipeline: Aggregates, pre-cools, and digitally grades smallholder produce to exact supermarket specifications, securing guaranteed retail off-take.

4. Consumer Wallet & Price Impact: P17/kg vs. P12/kg (~29% Savings)

  • The Agent Floor (P17.00/kg checkout): Consumers pay a hidden “spoilage tax” (+P2.57/kg) and agent markup (+P1.03/kg) to cover rotted stock, while farmers face predatory price crashes during harvest gluts.
  • The National Pipeline (P12.00/kg checkout): Eliminates waste, pays the farmer more at the farm gate (P6.50 vs P6.00/kg), and delivers 4x longer fridge shelf life (7–10 days vs 24–48 hours) for Batswana families.

5. National Control: Market Chaos vs. The Single Digital Dashboard

  • The Agent Floor: Crop data is trapped inside private broker ledgers, driving uncoordinated planting gluts followed by off-season shortages.
  • The National Pipeline: Operates on a Single National Digital Dashboard connecting Cabinet, Ministry planners, CEDA/NDB lenders, and district farming clusters to stagger planting schedules across ecological zones (Chobe vs. Tuli Block vs. Boteti).

Core Framing Statement for Molefhe

“Mr Molefhe, agents do not buy cold trucks, build packhouses, or take spoilage risk. Our goal is not to build a trading floor for middlemen—it is to convene the Ministry of Agriculture and the Ministry of Entrepreneurship/Trade to deliver an Integrated National Cold Pipeline that protects our farmers, lowers consumer food prices, and creates 15,000 jobs.”


Related Articles:

Nov 14, 2026: The functions of demand-led planning in the horticulture industry:

https://sheilasingapore.blog/portfolio/the-functions-of-demand-led-planning-in-the-horticulture-industry/

Nov 13, 2026: The Pipeline Imperative: Creating National Employment and Sovereign Food Security Beyond the Middleman Trap

Nov 12, 2026: Botswana’s Horticultural Transformation: Who Controls Production, Who Controls the Market, and Where Do Local Farmers Fit?

https://lnkd.in/p/dZnyftgt


#NationalHorticulturalPipeline #BotswanaAgriculture #FoodSecurity #NationalEmployment #SystemsThinking #HorticulturalTransformation #PriceDiscovery #SADCRegionalTrade


Three Models of Farmer Organisation: From Representation to Production-System Operation


The term farmers’ association is often used as though it describes one organisational model. It does not. Across agricultural systems, farmer organisations perform very different functions — from representing farmers’ interests, to collectively marketing their produce, to providing commercial services, and, in more sophisticated arrangements, coordinating production itself.

This distinction matters for Farmers United (FU). The question is not simply whether FU should become a “better farmers’ association”. The more fundamental question is what economic function FU should perform within Botswana’s emerging national agricultural pipeline, and what a farmer should be paying for when joining it.

I see three distinct models.

1. The Representative Farmers’ Association

The first model exists principally to give farmers a collective voice.

Its members join because the organisation represents their interests before government, regulators, markets and other institutions. It may provide information, networking, training, advocacy, policy dialogue and access to selected services, but it does not necessarily organise the members’ production or take responsibility for getting their produce to market.

This remains an important function. IFAD describes farmer and producer organisations as membership-based organisations that can provide economic services while also enabling farmers to participate in policy dialogue and advocacy. (Nedac)

The value proposition is therefore essentially:

“Your collective voice is stronger than your individual voice.”

The organisation does not need to know exactly how many tonnes each member will produce next season in order to represent the sector.

Its principal assets are membership, legitimacy, information and collective voice.


2. The Producer or Marketing Organisation

The second model moves beyond representation into economic organisation.

Here farmers come together because collective action gives them advantages that they cannot obtain individually. These can include collective purchasing, aggregation, grading, packaging, processing, storage, transportation, marketing, technical assistance and bargaining with buyers.

The European producer-organisation model is a good example. Recognised producer organisations can undertake joint production planning, concentration of supply, marketing, transportation, packaging, storage and other activities designed to improve members’ economic position. (AgGateway)

The World Bank similarly describes producer organisations as jointly owned, member-controlled organisations established for producers’ economic benefit, with functions including bargaining, inputs, technical assistance, processing and marketing. (Rural Development)

The value proposition becomes:

“Together, we can perform commercially important functions more efficiently and with greater bargaining power than we can individually.”

This is much closer to where FU has been trying to go.

It explains the logic behind distribution, storage, aggregation, collective marketing and possibly processing. The farmer pays because collective organisation can reduce transaction costs and improve commercial returns.

But there is a vulnerability in this model: the organisation can begin accumulating infrastructure and operating costs in order to provide services that may not actually need to be provided in-house.

FU’s experience with rented storage is instructive here. If storage becomes an expensive fixed cost, suffers pilferage and does not correspond to a sufficiently predictable flow of produce, the service can destroy rather than create member value.


3. The Production-System Operator

The third model starts somewhere different.

It begins not with:

“What can farmers collectively sell?”

but with:

“What will customers and the wider economy require in the future, and what productive capacity must exist to meet that requirement?”

This is the model STRLDi is beginning to see as the potential destination for FU.

The organisation becomes a linchpin between forecast demand and organised productive capacity.

Its functions would include:

Forecast demand → aggregate demand → translate demand into production requirements → match requirements against proven capacity → allocate production to geographic clusters → monitor fulfilment → identify variance early → coordinate aggregation and logistics → deliver against forecast → learn from actual performance and improve the next forecast.

This is not the place for the fireman.

It requires the mathematician, forecaster, planner and systems operator.

The distinction is fundamental.

A market intermediary asks:

“Who has tomatoes available now?”

A production-system operator asks:

“What will our customers require six months from now, what production capacity will be available then, where will the gaps occur, and what must we do now to prevent them?”

That is a much more demanding organisational capability.

“Membership — Geographic clusters composed of farmers with demonstrated commercial production histories and the capacity to account for their production over time.”


The three models compared

Dimension1. Representative Farmers’ Association2. Producer / Marketing Organisation3. Production-System Operator
Primary purposeRepresent farmersImprove members’ economic positionSynchronise future demand with productive capacity
Starting pointFarmerFarmer + marketDemand + productive capacity
Core valueCollective voiceCollective commercial advantageForecasting, planning, production assurance and system reliability
MembershipBroad farmer membershipProducers meeting defined criteriaQualified clusters containing proven commercial producers
Market roleAdvocacyCollective marketingForward demand forecasting and customer coordination
Production planningLimitedMay coordinateCore function
ForecastingNot centralSupporting functionCentral capability
ClustersMember/community groupsProduction/marketing groupsGeographic production units
Farmer commitmentUsually voluntaryMay involve marketing agreementsSpecific production allocation tracked through to delivery
DataMember informationProduction and sales dataLongitudinal production-performance data used for forecasting
StorageUsually not coreMay provide/own storageUsed only where the forecasted production flow demonstrates a need
DistributionUsually not coreMember serviceCoordinated with forecast volume and timing
InfrastructureLimitedOften importantOwned only where ownership creates a demonstrable advantage
Government relationshipRepresentationCommercial/regulatory interfaceConnection into the national agricultural pipeline
Farmer voicePrimary purposeImportant secondary functionEssential feedback into the pipeline, but not the whole purpose
Management mindsetRepresentation and advocacyCommercial coordinationMathematics, forecasting, planning and systems operation
Economic propositionStronger collective voiceLower transaction costs / greater bargaining powerLower uncertainty + coordinated productive capacity + predictable supply
Member fee definitionFee for representation, information, networking and advocacyFee/service charge for collective commercial services, often supplemented by marketing levies, commissions or transaction-based chargesFee for access to a forecast-driven production system, with service charges potentially linked to capacity, production or transactions

The third model should not be understood simply as “Model 2 with more services.” It changes the organisation’s operating logic.


The Starting Point: What Does It Mean to Be a Commercial Farmer?

The discussion that prompted this comparison began with a practical observation: many farmers do not have the quantitative capability required to operate within a highly coordinated production system. My response is not to begin by asking how we can teach every farmer mathematics. The more fundamental question is whether a production organisation such as Farmers United should accept farmers who have not yet demonstrated, through the operation of their farms, that they can sustain and grow a livelihood from farming.

For FU, “skin in the game” needs to mean more than having invested money or having an attachment to farming. It should mean that the farm itself has demonstrated the capacity to sustain the farmer’s livelihood and contribute to the farmer’s growth. A farmer who must maintain two or three other jobs simply to keep the farm going is in a different economic position from a farmer whose farm is already generating the income from which the farmer lives, reinvests and grows.

This is not a judgement on the worth of farmers who are still transitioning into commercial agriculture. It is an organisational design decision about the kind of productive capacity FU is prepared to build its system around. If FU is ultimately expected to forecast demand, allocate production, coordinate volumes and timing, and account for delivery against those requirements, it needs members whose farms can produce a sufficiently reliable history of production, revenue, costs, yields and performance from which those calculations can be made.

The proposed 3–5 year production record therefore becomes more than a membership requirement. It becomes the beginning of FU’s quantitative production intelligence. A farmer who can demonstrate what the farm has produced over time is already generating the information from which FU can begin to understand capacity, reliability, seasonality, yield and growth. The farmer does not have to be a mathematician; the farm must, however, be capable of producing evidence that can be worked with mathematically.

This is also why I would resist the temptation to measure FU’s future success by how many farmers it can bring into the system. The objective is not to fill FU with farmers. It is to build reliable productive capacity. If farmers are encouraged to remain permanently dependent on income from several unrelated activities while the farm itself remains commercially weak, the organisation may increase its membership without increasing the productive economy. And when the productive economy remains weak, the infrastructure built to carry it — including our trains — remains underutilised.

The question is therefore not whether every farmer currently possesses the mathematics required of a production-system operator. The question is whether FU can identify, organise and progressively develop farmers whose farms are already demonstrating the productive discipline from which that capability can be built.


What Do Farmers Actually Pay For?

There is no universal global membership fee for farmer organisations. The fee structure depends heavily on whether the organisation is primarily representative, service-based, commercial, cooperative or producer-controlled.

However, current examples give us useful comparative ranges.

Representative and professional agricultural associations

The Zimbabwe Farmers Union (ZFU) currently charges annual membership fees of US$5 for smallholder farmers, US$20 for small-scale commercial farmers and US$40 for large commercial farmers. The membership card also provides access to discounts from participating firms. (ZFU)

The Zimbabwe Agricultural Society charges US$100 annually for individual members, US$150 for husband-and-wife membership and US$200 for corporate members, with lifetime membership at US$2,000. (ZAS)

Practical Farmers of Iowa charges US$50 for individual membership and US$75 for farm/household membership, with lower-cost access membership at US$25. (Practical Farmers)

The West Virginia Farmers Market Growers Association uses a more commercial basis: full producer membership is US$100–350 annually, based on gross sales. (MFVGA)

These examples illustrate the first model particularly well: membership dues primarily support participation, representation, information and member services.

Producer and commercial organisations

The National Hay Association provides a useful example of a producer-oriented fee model. New producer members pay a minimum of US$325, after which annual dues rise with annual tonnage: US$550 for 5,001–10,000 tons, US$825 for 10,001–25,000 tons and US$1,100 for 25,000+ tons. (National Hay Association)

This is particularly relevant because it demonstrates a principle that could matter for FU:

The fee is related to the economic scale of the member’s participation in the system.

An older agricultural cooperative study in the United States similarly found membership fees ranging from US$25 to US$300, with fees serving partly as member capital and as a mechanism for securing financially responsible members. (Agecon Search)

The European/global producer-group ecosystem also illustrates that membership can be tied to the services and commercial functions of the organisation. For example, GLOBALG.A.P.’s current community membership is €2,550/year for producer groups, producer/supplier associations and cooperative groups, compared with €1,550 for individual producers. This is not a farmers’ association fee in the strict sense, but it demonstrates the higher fee level attached to participation by an organised producer group in a technical/commercial standards ecosystem. (GLOBALG.A.P.)


Comparative Membership-Fee Models

Organisation / modelGeographyOrganisation typeCurrent fee basisPublished feeApprox. USD
Zimbabwe Farmers UnionZimbabweRepresentative farmers’ unionFarmer categoryUS$5–40/year$5–40
Zimbabwe Agricultural SocietyZimbabweAgricultural society / farmer communityMembership categoryUS$100–200/year$100–200
Practical Farmers of IowaUSAFarmer organisationIndividual/farm householdUS$25–75/year$25–75
WV Farmers Market Growers AssociationUSAProducer associationGross salesUS$100–350/year$100–350
National Hay AssociationUSAProducer/marketing associationAnnual tonnageUS$325–1,100/year$325–1,100
GLOBALG.A.P.GlobalProducer/quality ecosystemProducer group€2,550/year≈$2,950
NEDACAsia-PacificAgricultural cooperative networkOrganisationUS$2,500/year + US$500 admission$2,500/year
FU — proposed Model 3BotswanaProduction-system operatorTo be determined from value/cost of forecast-driven production servicesNot yet setNot yet set

USD equivalents for euro-denominated fees are approximate and will vary with exchange rates.

The examples demonstrate something important: membership fees range from nominal representation dues to thousands of dollars for organisations receiving specialised commercial, technical or network services. There is no defensible global benchmark that says a farmer organisation should charge “X dollars per farmer.”

The correct question for FU is therefore not:

“What do other farmers’ associations charge?”

It is:

“What measurable economic value does FU create for a participating farmer, and what does it cost FU to provide that value?”


What This Means for FU

This distinction is particularly important because FU’s members would not be joining merely to belong to an association.

Under the emerging Model 3, the farmer would be joining because FU provides something the farmer cannot efficiently create alone:

forward visibility of demand; production planning; allocation of requirements; coordinated aggregation; commercial scheduling; logistics coordination; performance information; and access to a wider production system.

The fee should therefore be defensible in relation to the economic value of those services.

And there is a further discipline that I think is essential.

Storage, Forecasting and Infrastructure

If FU can forecast demand accurately enough to synchronise production and delivery, it may need less storage, less emergency transport, less working capital tied up in inventory and fewer fire-fighting interventions. FU’s previous experience with a rented storage facility becoming costly and vulnerable to looting is therefore not simply a problem to solve by finding a better warehouse. It is evidence that the organisation should first determine what physical infrastructure the future production flow actually requires.

The more effectively FU can forecast demand and synchronise production with the timing of that demand, the less it should need to hold produce simply because production and the market are out of sequence. Storage will not disappear; rather, it should become a calculated buffer for unavoidable timing differences rather than a substitute for poor forecasting. This potentially reduces the amount of storage, emergency transport and working capital FU needs to carry, while also reducing the risks associated with holding produce for which there is not yet a sufficiently certain destination.

This is an important distinction in moving from the producer/marketing organisation to the production-system operator. The latter does not begin by acquiring infrastructure and then finding a use for it. It builds the production system first and lets the mathematics determine what infrastructure the system actually requires.

That leads to a useful design principle:

Do not build infrastructure and then find a use for it. Build the production system first and let the mathematics determine what infrastructure the system requires.

Setting of Membership Fee

The same principle applies to membership.

Do not set the membership fee first and then invent services to justify it. Define FU’s unique value proposition, establish the cost of providing it, measure the economic benefit to the member, and then determine the appropriate fee structure.

For FU, the strategic choice is therefore much bigger than whether it should be a farmers’ association.

It is whether it should remain primarily a voice for farmers, become a collective commercial organisation for farmers, or evolve into something more demanding: a farmer-owned production-system operator capable of forecasting demand, organising productive capacity and making dispersed farms reliably responsive to the requirements of the wider economy.

That is the question the Phase 1 work needs to answer.


The Thinking Behind This Model

This discussion of farmer organisations is part of a wider body of STRLDi work on how productive systems are connected — from national demand and production, through value addition and logistics, to the infrastructure that ultimately carries economic activity.

1. What Will Botswana Put on 40 Locomotives?
A question about what productive economy Botswana must build if its railway is to become an economic corridor rather than an isolated transport asset. (LinkedIn)

Read: What Will Botswana Put on 40 Locomotives?

2. Agriculture Corridor Execution Lattice
The wider architecture for connecting demand, production, aggregation, value addition, logistics and corridor execution — with discipline, standards and time certainty at its centre. (strldi.weebly.com)

Read: Agriculture Corridor Execution Lattice

3. Study Unemployment: The Report
The earlier study from which this line of thinking emerged: understanding unemployment not simply as a labour-market problem, but as an outcome of the design and performance of the national production system. (strldi.weebly.com)

Read: Study Unemployment — The Report

That makes your response to Jimmy much more than a disagreement about whether farmers can do mathematics. It becomes the entry point into the question: what kind of productive organisation does Botswana need if its farmers are to become part of a production system capable of feeding markets, filling corridors and growing the economy?


#SystemsThinking #Agriculture #FarmersOrganisations #FoodSystems #ProductionSystems #AgriculturalTransformation #Botswana #SouthernAfrica #EconomicTransformation #STRLDi

#SystemsThinking #Agriculture #FoodSystems #ProductionSystems #AgriculturalTransformation #Botswana #EconomicTransformation #STRLDi

What Will Botswana Put on 40 Locomotives?


A Trade question before it is a railway question
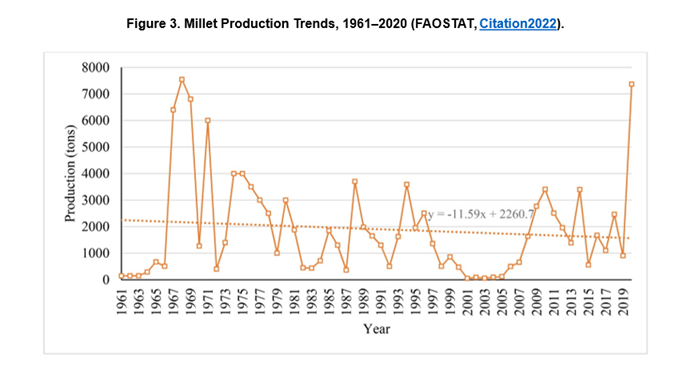
On 11 August, President Duma Boko spoke about the urgency with which Botswana must begin to execute. In the remarks shared by Ray Mafoko, he returned to Botswana Railways as an example. He had set a deadline for the railway to become profitable. December came; it was not profitable. His response was blunt: decisions had to be made, the country could not remain “supine” in the face of challenges, and Botswana was in a race against time. Ray Mafoko’s publication of President Boko’s remarks

The statement can be heard simply as an instruction to Botswana Railways: become profitable. But perhaps we should slow down long enough to ask what that instruction actually requires of the economy around the railway. A railway cannot manufacture profitability by instruction. It becomes profitable when there is sufficient economically viable freight to move, when it can move that freight reliably and competitively, and when the productive economy continues to generate more freight as the railway expands. The more useful question, therefore, is not only how do we make Botswana Railways profitable? It is what must Botswana produce, process, sell and move for Botswana Railways to become increasingly profitable?

That takes us into territory that belongs initially to Trade. It takes us beyond the familiar regulatory role of controlling standards, licences, borders and commercial rules and into the economic work of understanding markets, defining demand, organising production opportunities and connecting them to the infrastructure that must carry the resulting goods. Botswana Railways then becomes part of that economic architecture, rather than being left at the end of the system to ask where it will find enough freight.


First, Let Us Look at the Railway We Have

In May 2026, Botswana Railways reported that it had been moving around one million tonnes of freight annually, while approximately 1.4 million tonnes a year were required to cover expenses. At the same time, only 11 of 34 locomotives and fewer than 200 of 1,155 wagons were operational. BR had also recorded an operating loss of P235 million between 2021 and 2024. (Daily News)

The natural response is to look at the 1.4 million tonnes and say: get BR to 1.4 million tonnes.

But that is where we need to be careful. 1.4 million tonnes is a financial threshold. It is not an economic ambition. If we make break-even the destination, we risk designing the railway around survival: reach the line, stay above it, contain costs, avoid taking risks and wait for the next problem. That is a balancing logic. It can keep an organisation alive without necessarily creating the conditions for it to become a growing economic engine.

The alternative is to understand profitability as feedback within a reinforcing economic loop. More viable production creates more freight; more freight creates railway revenue; revenue and investment create more capacity; more capacity allows more production to move; and increased production creates more opportunities for markets, investment and further freight. The question is therefore not simply how BR gets to the break-even line, but what size of productive economy Botswana needs to build around the railway so that the railway can keep growing with it.


Four Stages Give Us Something We Can Actually See

Let us use a simple eight-year planning model in which BR moves from 11 operational locomotives to 20, then 30, then 40. If we use the reported 1.4 million tonnes as the initial working capacity at 11 locomotives and scale the planning capacity proportionally with operational locomotives, the numbers look like this:

BR stageOperational locomotivesAnnual planning capacityAverage per day
Stage 1111.40m tonnes3,836 t/day
Stage 2202.55m tonnes6,973 t/day
Stage 3303.82m tonnes10,460 t/day
Stage 4405.09m tonnes13,948 t/day

These are planning numbers, not an engineering forecast of BR’s physical capacity. Actual capacity would depend on locomotives, wagons, track, signalling, loading and unloading facilities, maintenance, crews, turnaround times and the ability of the network to handle the resulting train movements. The purpose of the calculation is different. It allows us to see the scale of the productive economy that would need to grow if Botswana progressively restores and expands railway capacity.

Now apply the original planning allocation of 45% agriculture, 35% manufacturing and 20% mining:

BR stageTotal capacityAgriculture 45%Manufacturing 35%Mining 20%
11 locomotives1.40m630,000 t490,000 t280,000 t
20 locomotives2.55m1.145m t891,000 t509,000 t
30 locomotives3.82m1.718m t1.336m t764,000 t
40 locomotives5.09m2.291m t1.782m t1.018m t

Now stop at the last line for a moment.

At 40 operational locomotives, this planning model would require approximately 2.29 million tonnes of agricultural freight and 1.78 million tonnes of manufactured freight, in addition to approximately 1.02 million tonnes of mining freight. The railway cannot create those goods. Agriculture, manufacturing and mining must create them, markets must absorb them, and the logistics system must be capable of moving them.

So the question becomes very simple:

What will Botswana put on 40 locomotives?


The Goods Are Already Moving

The answer does not begin with a blank sheet of paper. Botswana already has a substantial goods economy moving through its borders.

The 2024 International Merchandise Trade Statistics recorded 2.332 million tonnes of goods excluding oil imported into Botswana. Food and live animals accounted for 667,708 tonnes. Manufactured goods classified chiefly by material accounted for 1.101 million tonnes, machinery and transport equipment another 99,101 tonnes, and miscellaneous manufactured articles 58,476 tonnes. (GBoS Data)

The latter three manufacturing-related categories therefore amounted to approximately:

1,101,325+99,101+58,476 = 1.259 million tonnes

Add food and live animals:

667,708+1,258,902=1.927 million tonnes

Botswana therefore already imported approximately 1.927 million tonnes of food and manufacturing-related goods in 2024 within these categories. That is more than the 1.4 million tonnes that BR has identified as the level required to cover its expenses.

We should not make the foolish conclusion that all 1.927 million tonnes should now move by rail. Some goods are more appropriately moved by road; some are time-sensitive; some are high-value and relatively low-volume; some require short-haul distribution; and some goods will continue to be imported because producing them in Botswana would not be economically sensible.

The significance of the number is elsewhere. The freight market already exists. Botswana is already buying these goods, already paying for them, already bringing them through its borders and already moving them to consumers and businesses.

The question for Trade is therefore not simply where can BR find more freight? It is: which of these existing goods flows are economically suitable for rail, which imports could realistically be replaced by domestic production, and what additional markets could Botswana develop so that production grows beyond the domestic market?

That is a much more productive starting point.


Now Put Today’s Production Beside Tomorrow’s Requirement

Botswana is also not starting its productive economy from zero.

During the 2024/25 cropping season, Botswana reported approximately 144,000 tonnes of crop production, while horticultural production reached 88,670 tonnes, including vegetables and fruit. (Daily News) Government has also reported substantial livestock production, including approximately 69,000 tonnes of beef and 49,000 tonnes of poultry meat in 2022/23.

Using these documented quantities as a working production floor gives:

144,000+88,670+69,000+49,000=350,670 tonnes

This is not a claim that Botswana’s total agricultural production is only 350,670 tonnes. It is a conservative working number from the physical production quantities we can presently place side by side. Eggs have not been converted into tonnes, and other livestock and agricultural products have not been added.

But even this incomplete number is enough to expose the scale of the work ahead.

BR stageAgriculture freight requirementWorking local productionToday’s production as % of requirementProduction gap
11 locomotives630,000 t~351,000 t55.7%~279,000 t
20 locomotives1.145m t~351,000 t30.6%~794,000 t
30 locomotives1.718m t~351,000 t20.4%~1.367m t
40 locomotives2.291m t~351,000 t15.3%~1.940m t

The point is not that Botswana cannot get there. The point is that today’s production is not the economy required by a 40-locomotive railway.

Today’s production is the starting point from which that economy has to grow.

At 11 locomotives, the working agricultural production floor represents approximately 56% of the agricultural freight requirement. At 20 locomotives, it represents about 31%. At 30 locomotives, approximately 20%. By 40 locomotives, it represents approximately 15%.

That is the productive gap.

And the productive gap is not a reason to stop.

It is the work.


This Is Where Trade Needs Another Muscle

Trade’s regulatory role remains necessary. Botswana needs standards, licensing, customs, competition rules, consumer protection and a functioning commercial environment. But a country that wants to move from importing a large proportion of its goods to producing, processing and exporting substantially more cannot ask its economic-development ministry to stop at regulating commerce.

Trade has to know where the markets are.

It needs to know what Botswana buys, from whom, in what quantities and at what value. It needs to know which goods are growing in demand, which markets are opening, which imports might be competitively replaced, which products Botswana could export, and what quantities buyers would actually take.

The work then moves backwards from the market. If a buyer requires 20,000 tonnes of a product a year, at a particular specification, during particular months and at a particular price, that is not yet an agricultural programme. It is a market requirement. The next calculation is what production capacity is needed to meet it, who can produce it, where it can be produced, what inputs and infrastructure are required, what processing is necessary, how the output will be aggregated and how it will reach the buyer.

That is where the Ministry’s economic-development mandate becomes different from simply saying “produce more.”


There is another danger here: each part of the economy can become concerned mainly with whether the problem is occurring at its own end. Trade can look at regulation, Agriculture at production, manufacturers at markets, farmers at buyers, logistics operators at freight and Botswana Railways at its available tonnage. Each may have a perfectly reasonable explanation for why its own part cannot move faster. But if the economic system is treated as a collection of separate responsibilities rather than as one connected production-and-market system, the country can spend years improving individual parts while the whole system continues to take on water.

Article content

The problem is not necessarily at the end where the water is visible. It may be in the connections between the ends.


What Should the Trade Economic-Development Manual Contain?

If Trade is given an economic-development directive alongside its regulatory mandate, I would expect its operating manual to contain at least the following:

FunctionWhat Trade must actually do
Market intelligenceMaintain a live picture of what Botswana buys, from whom, in what quantity, value and trajectory.
Demand definitionQuantify domestic, SADC and international demand by product, volume, specification, price and timing.
Import replacementIdentify imports that Botswana could realistically produce or process competitively.
Export developmentIdentify products and markets where Botswana can credibly gain market share.
Product prioritisationRank opportunities by market size, margin, feasibility, employment, infrastructure and strategic value.
Production requirementsTranslate markets into tonnes, quality, timing, land, water, inputs, technology and processing requirements.
Producer mappingKnow who can produce what, where, at what scale and with what reliability.
Aggregation architectureOrganise dispersed production into commercial volumes, consistent quality and predictable delivery.
ProcessingIdentify where raw production must be graded, stored, chilled, processed, packaged or transformed.
Buyer developmentBuild relationships with retailers, processors, institutions, hospitality and regional/international buyers.
Commercial contractingDevelop forward orders, specifications, supply schedules and commercial arrangements that give producers a production signal.
Logistics planningMap movement from producer to aggregation, processing, distribution and market.
Freight-demand planningConvert production and markets into tonnes, origins, destinations, seasonality and frequency.
Rail–road allocationDetermine which movements are economically suited to rail, road or intermodal transport.
Investment pipelineTurn identified market and production gaps into investable projects.
Capability developmentIdentify missing skills, technology, equipment, finance and management capability.
Production monitoringTrack hectares, yields, throughput, quality, delivery and variance from plan.
Market performanceMeasure actual import replacement, market share, exports, prices and commercial returns.
Economic feedbackFeed actual results back into the model and continuously adjust the production programme.
Corridor developmentTranslate production and market flows into the Botswana Railways corridor: origins, aggregation points, processing nodes, destinations, seasonality, train frequency and capacity requirements.

This does not mean that Trade becomes the farmer, manufacturer, processor, investor, logistics operator or railway. Its job is to see the economic system and organise the information, relationships and decisions that allow those actors to work together.

The sequence is therefore:

That is what makes the railway part of an economic corridor rather than simply a railway company trying to sell transport capacity.


Where Does the Farmer Fit?

This distinction matters because a farmer who asks, “Who will buy what I produce?” is asking a legitimate commercial question. It should not be the farmer’s responsibility to discover the market after production has already taken place. The responsibility for identifying demand, quantifying it, developing buyers and translating that demand into production opportunities belongs within the economic-development function of Trade.

Once that market signal exists, the farmer’s responsibility becomes much clearer. The farmer can determine whether the required crop, livestock or other product can be produced at the required volume, quality, price and time. A Farmers Association or a Centre can then help aggregate production, coordinate growers, improve consistency and organise delivery against that identified demand.

This is where a Centre or Farmers Association can eventually become financially stronger. It does not have to become the buyer of everything, and it should not promise farmers that every crop will automatically be sold. Its role can increasingly be to organise supply against a market that has already been identified, reducing the randomness between production and sale.

The farmer therefore does not have to invent the market.

Trade develops and organises the market opportunity; producers build the capacity to supply it; associations and Centres aggregate that supply; processors add value; investors build missing capacity; logistics operators move the goods; and Botswana Railways becomes the corridor through which an increasing share of the economically suitable long-haul movement can flow.

That is a system in which each participant can see where his or her responsibility begins and ends.


Road Does Not Have to Lose for Rail to Grow

There is also no need to turn this into a fight between Botswana Railways and the freight companies already operating on the roads. A growing productive economy should create more freight, not simply move the same freight from one operator to another. Road remains essential for collection, short-haul distribution and last-mile delivery, while rail can progressively take more of the long-haul, bulk and consolidated movements for which it is economically suited.

We already have a practical illustration of what that can mean. In July 2026, Botswana Railways reported that the share of fuel imports transported by rail had fallen from approximately 70% to below 20% after its fuel tankers were withdrawn from service. The refurbished tankers now returning to service can carry 55,000 litres each, while a full train can move approximately 1.87 million litres, equivalent to roughly 50 fuel trucks. (Daily News)

The point is not that every truck should become a train. The point is that different transport modes can be allocated according to the economics of the movement. As the total productive economy grows, the appropriate share for rail can grow with it. Road operators can become part of the aggregation, distribution and intermodal system rather than being treated as an obstacle to railway recovery.

That is a much more sensible way to think about the relationship.


The Numbers Now Give Us a Different Question

At 11 locomotives, the planning capacity is approximately 3,836 tonnes a day. At 20 locomotives, it is approximately 6,973 tonnes a day. At 30 locomotives, it rises to 10,460 tonnes a day, and at 40 it reaches approximately 13,948 tonnes a day.

The question is not whether Botswana can magically produce enough goods tomorrow to fill 40 locomotives. It cannot. The question is whether Botswana can deliberately build the productive economy that will require 40 locomotives when that capacity becomes available.

That requires Trade to work ahead of the railway. It requires Agriculture to understand the production requirements of identified markets. It requires manufacturers and processors to see opportunities in the goods Botswana currently imports. It requires investors to see bankable production opportunities rather than simply waiting for a fully formed market to appear. It requires farmer organisations to become capable of aggregating commercial supply. And it requires logistics planning to connect all of this physical production to actual buyers.

At 20 locomotives, the planning model calls for approximately 1.145 million tonnes of agricultural freight and 891,000 tonnes of manufactured freight. At 30, those figures rise to 1.718 million and 1.336 million tonnes. At 40, they reach 2.291 million and 1.782 million tonnes.

Those numbers should not make us say, “Botswana cannot do this.”

They should make us ask:

What has to be built for Botswana to do this?

That is the difference between looking at a gap as evidence of impossibility and looking at a gap as a development programme.


Profitability Is Not the Destination

This is why I am reluctant to make the 1.4-million-tonne break-even number the centre of the discussion.

If the system is told repeatedly that BR must reach 1.4 million tonnes, the organisation can become oriented towards achieving and protecting that threshold. The resulting behaviour can become cautious: contain expenditure, protect the existing customer base, avoid capacity commitments, avoid risk and attempt to remain just above the line. The balancing loop then becomes stronger, while the productive economy around the railway remains weak.

A different structure starts with growing demand.

In this structure, profitability is not ignored. It becomes an essential feedback signal. If the additional freight does not produce adequate revenue, the system has to ask why: is the product wrong, is the market wrong, is the price wrong, is the route wrong, is utilisation too low, are turnaround times too long, or is the cost structure too high?

Profitability tells the system whether the reinforcing loop is working. It does not define the size of the economy we should be satisfied with.

That is why the ambition should not be “keep BR above break-even.” The ambition should be to build a productive economy in which BR can progressively increase its capacity because the economy is producing the freight that makes that capacity economically valuable.


So, What Will Botswana Put on 40 Locomotives?

We already have some of the answer.

Botswana is already importing the goods. Botswana is already producing agricultural goods. Botswana already has farmers, manufacturers, processors, freight companies, investors, buyers and a railway corridor. The missing piece is not the complete absence of economic activity. The missing piece is the deliberate connection of these activities at the scale required to transform the productive economy.

That is the work that must now become visible.

Trade can identify the demand and develop the market. Agriculture and producers can build the production capability. Farmer organisations and Centres can aggregate supply. Manufacturers and processors can add value. Investors can build the missing capacity. Logistics operators can collect, consolidate and distribute. Botswana Railways can become the long-haul corridor connecting that growing production to domestic, regional and international markets.

Then the railway is no longer sitting at the end of the system asking:

“Where will I find freight?”

The economic system is feeding the corridor.

Perhaps President Boko knows this.

Perhaps the statement on 11 August was intended to make the country uncomfortable enough to ask what “make Botswana Railways profitable” actually means.

Because the easier question is:

How do we get BR to 1.4 million tonnes?

The harder question is:

What are we going to build in Botswana that will make 40 locomotives necessary?

That question belongs to Trade.

It belongs to Agriculture and Manufacturing.

It belongs to farmers, producer organisations, processors, investors and logistics operators.

And it belongs to Botswana Railways.

Most importantly, it is not a question that requires Botswana to wait until it has all the answers before beginning. The numbers tell us where the gaps are. The gaps tell us what has to be built. And once the country can see what has to be built, the question changes from “Can we do it?” to “What do we need to do first?”

Sources:

  1. President Duma Boko’s remarks on Botswana Railways and the urgency of national execution, as shared by Ray Mafoko, 11 August 2026. Ray Mafoko — publication of President Boko’s remarks
  2. Botswana Railways: freight volumes, break-even requirement, locomotive and wagon availability, and operating losses. DailyNews, 21 May 2026. Botswana Railways records P235 million loss
  3. Botswana’s International Merchandise Trade Statistics. Statistics Botswana — official source for customs-based import and export data. Statistics Botswana explains that the underlying merchandise-trade data originate with BURS Customs & Excise and are transferred to Statistics Botswana for processing. (Statistics Botswana) International Merchandise Trade Statistics — December 2024
  4. Botswana crop and horticultural production, 2024/25. President’s State of the Nation Address reporting approximately 144,000 tonnes of crop production and 88,670 tonnes of horticultural production. DailyNews/BOPA, 11 November 2025. (Daily News) 2024/25 crop and horticultural production figures
  5. Botswana horticultural production and market development. DailyNews, 31 March 2026. This provides the more recent figure of 140,881 tonnes of horticultural production from April 2025 to January 2026, including 114,080 tonnes of vegetables and 26,800 tonnes of fruit, and notes that production exceeded national vegetable demand by 1.8%. (Daily News) Progress in horticultural production
  6. Horticultural import restrictions and domestic production. DailyNews, 29 April 2024. The report records horticultural production rising from 67,000 tonnes in 2021 to 86,000 tonnes in 2023, alongside a substantial reduction in the horticultural import bill. (Daily News) Horticultural import ban and local production
  7. Botswana Railways fuel-corridor example. DailyNews, 15 July 2026. The report states that the share of fuel imports transported by rail had fallen from approximately 70% to below 20%, that a refurbished tanker carries 55,000 litres, and that a full train can carry approximately 1.87 million litres, equivalent to about 50 fuel trucks. (Daily News) Botswana Railways fuel tanker refurbishment and rail freight capacity

One correction:

We would not retain the earlier statement that the 2024 agricultural production floor is exactly 350,670 tonnes without a qualification. The crop/horticulture figure of 144,000 + 88,670 is from 2024/25, while the beef and poultry figures cited are from 2022/23. They are useful for demonstrating scale, but they are not a clean same-year agricultural balance.

More importantly, we now have a newer horticulture figure of 140,881 tonnes for April 2025–January 2026. (Daily News)

So for a publication intended to withstand scrutiny, we retain the ~351,000-tonne figure explicitly as a “working production floor assembled from available documented production series”.


I Can Sleep When the Wind Blows: What Botswana’s Horticulture Needs Beyond Funding & Allocations


There is an old parable titled “I Can Sleep When the Wind Blows.”

I Can Sleep When the Wind Blows | Shayne M. Bowen | 2018

A farmer hires a young hand. Each night, no matter the weather, the young man goes to bed early. When a storm finally breaks, the farmer panics. He runs to check the fields. However, he discovers that the barn doors are fastened. The tools are secured. The animals are sheltered. The hay is tied down. Everything had been prepared. The young man could sleep when the wind blew, because his work was already in order.


Budgets without backbone

Currently, I observe the following trends in the country. All governments, past and present, have focused mainly on budgeting and disbursing the funds they receive. The machinery is geared to release money and “create a conducive environment.” It monitors. But it does this without actually planning the industry itself.

That is a shame. Because when we avoid planning the industry, we trap ourselves in an endless cycle:

  • cash allocations that don’t yield repayment,
  • borrowers who appear to build assets with money that does not belong to them,
  • and a country that thickens its skin the next time it seeks funding — all without seeing real economic growth.

There is also an unspoken hope that we will be let off the hook because “we are Africans.” But finance does not forgive weak structures.


Dividing what should be united

Each cycle, allocations are trumpeted to youth, women, and farmers. But in reality, these three are not separate categories — they are a family. Women and youth are embedded in family farms. To slice them into compartments for the sake of budgeting is not only wasteful, it is divisive.

True industry planning does not start with who gets the allocation. It starts with building the backbone that ensures profitability for all: demand mapping, planting calendars, logistics, markets, and reinvestment. Once this spine is in place, the benefits naturally flow to every farmer — whether woman, youth, or elder.


Why the backbone is ignored

The deeper reason this backbone is overlooked is the dichotomy we live with as a nation. We underplay the role of STEM in our economy and agriculture. Yet agriculture is one of the industries that most demands a STEM-disciplined approach. This ranges from governance structures down to the farmer’s choice of seed.

When land and GDP are tended by hands guided by STEM discipline, they produce predictability, scaling, and growth. When managed without it, results fluctuate with the weather, pests, and luck.


One hectare, two futures

To make this real: take two farmers, each with 1 hectare.

  • The STEM-hardwired farmer runs soil tests and balances water precisely. She selects the right seed for climate and disease. She also manages pests with foresight. Over five years, her profits grow steadily from BWP 80,000 to over 100,000.
  • The non-STEM farmer plants by habit and intuition. Some seasons bring decent returns, others collapse under shocks. Over the same period, his profits swing wildly, sometimes as low as BWP 5,000.

One farmer can reinvest and scale. The other cannot.


STEM as the Backbone

Agriculture is not only about soil and seed — it is about systems, and systems require STEM discipline. From governance down to the individual farmer, STEM makes the difference between sustained growth and endless frustration.

On the farm — with STEM

  • Seed selection: Matching varieties to soil type, climate, and disease resistance using agronomic trials and data.
  • Water management: Irrigation calibrated to evapotranspiration rates, soil moisture sensors, and seasonal rainfall models.
  • Fertilisation: Nutrient application based on soil chemistry analysis, preventing both waste and depletion.
  • Pest management: Integrated pest management (IPM) using monitoring thresholds and biological controls rather than reacting late with chemicals.
  • Scaling: Precision data provides confidence to expand from 1 ha to 2, then 10 — with predictable margins.

On the farm — without STEM

  • Seeds chosen by habit or availability, vulnerable to climate shifts.
  • Irrigation by “eye” — too much or too little water.
  • Fertiliser applied reactively, causing soil exhaustion.
  • Pests noticed too late, leading to crop loss or costly sprays.
  • Scaling is a gamble; banks are hesitant to lend.

The result? Inconsistent yields, poor profitability, and farmers dropping out of horticulture.


In the system — with STEM

  • Data pipelines: Retailers share weekly SKU-level demand, analysed and published as crop calendars.
  • Forecasting: National dashboards project shortfalls or surpluses, triggering clear import or storage policies.
  • Logistics design: Cold chain hubs placed using flow models of supply vs. demand, not guesswork.
  • Finance: Lenders and insurers trust the system because data reduces risk.

In the system — without STEM

  • Ministries working in silos — Agriculture with farmers, Trade with retailers, no shared demand–supply map.
  • Imports opened or closed arbitrarily, undercutting local farmers.
  • Collection centres built as afterthoughts, often underused because produce doesn’t match demand.
  • Credit extended, but repayment fails because profitability was never secured.

The absence of STEM discipline is what gets in the way of building the coordination systems horticulture requires. Without it, money flows — but growth stalls.


👉 This section shows concretely: STEM is not just a “nice-to-have” in farming. It is the backbone of both productivity and coordination.


Scaling to the nation

Now imagine horticulture taking 30% of Botswana’s crop land (≈3 million ha), with STEM adoption rising over time.

YearSTEM Area (ha)Non-STEM Area (ha)STEM Profit (BWP Bn)Non-STEM Profit (BWP Bn)Total Profit (BWP Bn)
3600,0002,400,00054.072.0126.0
51,200,0001,800,000108.054.0162.0
101,800,0001,200,000162.036.0198.0
202,400,000600,000216.018.0234.0

With a STEM backbone, national profits rise steadily and reinvestment becomes possible. Without it, volatility, waste, and default persist.


What leadership requires

The leader who takes this on will not just fix horticulture. They will demonstrate that Botswana can move from funding to building industries that plan and re-fund themselves.

That leader will be remembered for building the industry spine. It was the system that allowed farmers, families, and the nation to reinvest. It let them scale and finally sleep when the wind blows.


Closing thought

Botswana does not lack hardworking farmers. It lacks the discipline of coordination and STEM-driven planning that secures the barns before the storm. If we build that spine, we can turn volatility into predictability, allocations into industries, and families into investors.

Then, and only then, will we all be able to say:

“I can sleep when the wind blows.”


Horticulture Farmers Can’t Plant Blind: Why Botswana Needs a National Horticulture Coordination System


She had done everything right.

Bought the seeds. Paid for inputs. Hired labour. Measured every drop of water. Watched over her crop with the kind of personal care only farmers understand. After weeks of nurturing, her cherry tomatoes gleamed on the vines — plump, red, and ready.

She took them to the retailer who once told her, “When you have them, bring them.”
But when she arrived with her harvest, the same buyer turned her away.

“Who placed an order for cherry tomatoes?” the retailer asked.

No order meant no sale. Hours of sweet labour, investment, and determination — side-stepped.

And here’s the bitter twist (and a true story). Those very tomatoes had just won first prize at the national agricultural show. The nation had applauded her produce, yet her local retail shelves never saw it. By the time the retail chain placed its order, it was for imported cherry tomatoes. They simply did not know that, in their own backyard, a farmer was already producing prize-winning fruit.


Why this matters

This is not just one farmer’s story. It is a mirror of the system we all work within.

  • Horticulture farmers plant blind, not knowing what demand will look like when the crop matures.
  • Retailers scramble, relying on imports because there is no coordinated calendar of who is growing what, where, and when.
  • Policymakers toggle between bans and openings, without a real-time picture of supply gaps or gluts.

The result? Crops are wasted in fields. Empty shelves in shops. Rising import bills. And declining confidence among the very farmers we need to carry this sector forward.

The bigger issue

This story is not about one farmer. It is about a system where demand lives with Trade. Supply oversight sits with Agriculture. The bridge in between is missing. Farmers plant in hope, retailers stock in panic, and national policy oscillates between bans and openings.


How did other countries solve this?


How other countries broke the cycle

  • Netherlands: transparent flower and vegetable auctions give growers and buyers the same daily data.
  • Spain’s Almería region: cooperatives coordinate planting schedules, logistics, and marketing so no farmer is left stranded.
  • Kenya: a single horticulture directorate oversees both production and marketing, ending the “split brain” between ministries.
  • India’s Operation Greens: real-time demand intelligence and price stabilization prevent wipeouts from gluts and shortages.

This picture (which shows the split between Ministry of Agriculture and Ministry of Trade, and the missing coordination in the middle):

Note:
This picture highlights a critical gap in Botswana’s horticulture sector.

  • On one side of each vertical line, the Ministry of Agriculture oversees farmers, extension, and production.
  • On the other, the Ministry of Trade manages retail, imports, and demand data.
  • In the interim, there is no coordinating mechanism. It is unclear who grows what, where, and when to match the actual demand in shops and institutions.

The result is wasted crops, empty shelves, and farmers discouraged from investing further.

A National Horticulture Coordination Unit can bridge this gap. It links production to market demand. It publishes clear crop calendars. This unit ensures imports are guided by real data—not guesswork.

Without this bridge, farmers will continue to plant blind. With it, Botswana can move from meeting 70% of its demand to achieving 100% and beyond.


Each of these countries built what Botswana lacks. It is a coordination spine that maps demand to supply. This gives both farmers and retailers a reliable compass.


What Botswana can do

Establish a National Horticulture Coordination Unit – jointly housed by Trade and Agriculture, with clear legal authority.

Publish a Horticulture Market Observatory – weekly retailer data (sales, volumes, gaps) made visible to farmers and policymakers.

Issue crop calendars by district – so farmers know when and how much to plant.

Invest in packhouses and cold chain hubs – so produce doesn’t die at the farm gate.

Set transparent import triggers – clear rules on when imports open and close, avoiding last-minute surprises.


We found several existing or emerging initiatives in Botswana. They partly touch on what we’re describing. Some are close to the supply-demand pipeline we want to build. Others are still missing elements. These might be things you can link into or build upon.


Snapshot: what exists, strengths, and gaps

Initiative (owner)What it coversStrengths we can leverageGap vs. “coordination spine”Quick next step
Letsema Horticulture Market (Gaborone, Block 3)Centralized wholesale-style market; farmer aggregation; quality/price transparency ambitions.Physical node; recognizable brand; farmer access; early digital footprint. (Letsemahm)Not yet a nationwide demand-forecast or pre-order system; weak link to retailer SKU forecasts and planting calendars.Pilot weekly pre-orders from major retailers + simple demand dashboard posted every Friday.
Tokafala Horticulture Programme (Debswana)A 3-year, demand-driven horticulture program to support SMMEs.Explicit demand orientation; private-sector discipline; delivery capacity. (Debswana)Not yet publicly tied to national import rules or district planting calendars.Invite Tokafala to share anonymized demand signals to a public Market Observatory (see below).
PYEC – Horticulture Readiness (OP/PSRU)TVET + change-management workshop to stream youth into horticulture.National convening power; change-management tooling; youth pipeline. (Your doc.)On-ramp for talent, but no market-signal backbone—risk of youth repeating old frustrations.Make “Market Observatory + crop calendars” a deliverable of PYEC’s action plan.
NAMPAADD (MoA)Long-standing plan to modernize arable agriculture; identifies under-used horticulture potential and calls for coordinated cropping.Policy legitimacy; extension footprint; precedent for coordination. (FAOLEX Database)Never fully operationalized into weekly demand data, rules-based imports, or public calendars.Refresh NAMPAADD’s horticulture chapter with district-level sow/harvest targets tied to retailer data.
FAO Hand-in-Hand (HiH)Evidence-based, country-led investment planning; typology tools.Data tools & geospatial analytics that can power targeting and calendars. (FAOHome)Not yet configured as retail demand → farm supply pipeline for Botswana SKUs.Request FAO HiH support to stand up a lightweight Market Observatory (see below).
NDB / Grants & Finance windowsCredit & recent horticulture grant guidelines; blended finance possibilities.Can nudge compliance (e.g., finance only when farmer slots align to calendars). (NDB)Finance currently decoupled from demand forecasts and import triggers.Make finance conditional on calendar-aligned offtake (pre-order or market slot).
IFAD / FAO field schools & ASSP-type supportCapacity, “farming as a business,” climate-smart practices.Training backbone that can teach market-aligned production. (IFAD)Training often production-centric, not demand-calibrated.Add a Market Intelligence module + weekly planning ritual.

What’s still missing (and how to add it quickly)

The missing piece is a public, rules-based, demand→supply pipeline that everyone can see.

Horticulture Market Observatory (public web page + PDF weekly)

Retailers/markets submit weekly SKU volumes, price bands, stockouts (simple template).

Publish a Friday snapshot + 8-week rolling forecast by district/crop.

Use FAO HiH tooling for the analytics layer. (FAOHome)

District Crop Calendars & Planting Targets

Start with top 8–10 veg; publish sow/harvest windows + target tonnage per district (refresh monthly).

Base targets on the Observatory forecast + Letsema/Tokafala signals. (Letsemahm)

Transparent Import Trigger Bands

Example: if projected supply <85% of demand for 4–6 weeks, open imports; >110% triggers processing/price-stabilization measures.

Announce changes via the Observatory (predictability for farmers and retailers).

Finance/Grant Conditionality

NDB/other windows require an assigned market slot (pre-order or auction) or alignment to district targets. (NDB)

90-day stitching plan (practical)

  • Week 0–2: Form a small Working Cell (MoA, MoT, Letsema, Tokafala, two retailers, NDB, FAO HiH).
  • Week 2–6: Stand up v1 Market Observatory (Google Sheet → public webpage); collect first 4 weeks of retailer SKUs.
  • Week 4–8: Publish draft crop calendars for two corridors (Gaborone–South, Francistown–North); recruit 50 pilot farmers via PYEC/TVET.
  • Week 6–10: Pilot Friday pre-order window at Letsema (listing + minimum volumes); Tokafala farmers prioritize listed SKUs. (Letsemahm)
  • Week 10–12: Announce import-trigger bands for those SKUs; align NDB grant/loan approvals to calendar slots.

The prize-winning tomatoes that never reached the shelf

The farmer in our story is not unique. Across Botswana, farmers are working with grit, faith, and long hours. They produce quality food. This food too often fails to meet the market. It is not because of their shortcomings. It is because the system has no bridge between production and demand.

Her cherry tomatoes were good enough to win the nation’s top prize. Yet they could not win a spot on the nation’s dinner tables.

That gap is what a National Horticulture Production Management System is meant to close.


Closing thought

Farmers can’t plant blind.
Retailers can’t stock empty shelves.
Policymakers can’t steer an economy on partial data.

Botswana’s farmers have already reached about 70% of local demand under difficult conditions. With coordination, transparency, and investment in the missing middle, that 70% can become 100% — and beyond.

The prize-winning tomatoes are proof that quality is here. Now it’s time to build the system that ensures such produce doesn’t just win awards. It must also win its rightful place on our tables.


Centrally Coordinated Agricultural Production – What That Means For Botswana


🧠 The Rotten Test: Ask of Any Policy

“Does this system give the farmer clear, real-time information about how much to produce, when to produce, and where it will go?”

If the answer is no, the policy—like the food systems exposed in Rotten—may be setting them up for failure.

What I am describing is not nationalization in the strict sense (i.e. state ownership of farms), but rather centrally coordinated agricultural production — where the government, in partnership with national farmer associations, plans production to meet national needs and organized export targets, while the land and operations remain privately or corporately owned.

This model aligns more with:

  • Coordinated market economies (e.g., in parts of Europe)
  • Export-led agricultural systems (e.g., in Asia and Latin America)
  • Public-private agriculture governance structures

Below is a list of countries (or regional blocs) that most closely reflect this model, where government and farmer associations work together to ensure supply meets aggregated national and global demand without owning the farms:


🌾 Countries with Strong National Coordination in Agriculture (Non-Nationalized)

1. Netherlands

  • Model: Highly planned and tech-enabled production.
  • Coordination body: Ministry of Agriculture works closely with farmer cooperatives (e.g., LTO Nederland).
  • Export focus: Major exporter of vegetables, flowers, meat.
  • Tools used: Digital farm registries, production quotas, national R&D targets, and organized market access through co-ops.

2. France

  • Model: Strong Common Agricultural Policy (CAP) alignment.
  • Coordination body: Ministry of Agriculture + National Interprofessional Councils (interprofessions).
  • Mechanisms: Strategic sector plans, quotas, and export agreements within EU and globally.

3. Denmark

  • Model: Export-oriented cooperative model.
  • Coordination body: Ministry + Danish Agriculture & Food Council.
  • Example: National agreements on pork production for Chinese and EU markets.

4. Israel

  • Model: State-supported planning with strong research-industry links.
  • Coordination: Kibbutzim and Moshavim integrate closely with the Ministry.
  • Example: Coordinated drip irrigation and export-led citrus and flower sectors.

5. China

  • Model: Mixed economy with quotas and central guidance.
  • Coordination body: Ministry of Agriculture sets production targets and supports farmer cooperatives.
  • Mechanism: “Vegetable Basket Project,” Five-Year Plans for food security, contract farming for exports.

6. Vietnam

  • Model: Post-reform socialist market economy.
  • Coordination body: Ministry of Agriculture coordinates land-use and export planning.
  • Sector success: Rice and seafood exports through coordinated farmer networks.

7. Brazil

  • Model: Government-backed agribusiness export strategy.
  • Coordination: Ministry of Agriculture + Embrapa (agricultural research) + national crop boards (e.g., ABPA for poultry).
  • Tools: Satellite monitoring, national zoning laws, and crop forecasts for soy, beef, sugar, etc.

8. India

  • Model: Large-scale crop planning with farmer incentives.
  • Coordination: Central and state governments work with cooperatives and marketing boards (e.g., NAFED, FCI).
  • Challenges: Implementation complexity due to scale, but export crops like basmati rice, spices, cotton are heavily coordinated.

9. Thailand

  • Model: Coordinated value chains for rice, rubber, and fruit exports.
  • Coordination: Ministry + farmer groups + contract farming for export fulfillment.

10. South Korea

  • Model: Government sets supply and demand forecasts, supports cooperatives.
  • Example: Korea Agro-Fisheries & Food Trade Corporation (aT) facilitates exports and sets production planning.

🔄 Common Features Among These Countries:

  • Centralized data on supply & demand, often real-time.
  • Institutionalized partnerships between government, farmers, and exporters.
  • Use of permits, quotas, and forward contracts to stabilize markets.
  • Heavy investment in agricultural R&D, extension services, and export facilitation.
  • Sometimes involve minimum price guarantees or subsidies tied to national plans.

🌍 Notable Regional Example:

European Union (CAP – Common Agricultural Policy)

  • Supranational coordination of agricultural production.
  • Uses production planning, environmental standards, and trade negotiations collectively.
  • Member states develop National Strategic Plans under an EU umbrella.

❗️Where This Is Not Common:

  • Most of Sub-Saharan Africa: Lacks centralized systems due to fragmentation, lack of digital traceability, weak farmer cooperatives, and limited export integration.
  • United States: While subsidies and crop insurance exist, production decisions are mostly private. There’s no national production permit system based on demand forecasts.

✅ So to answer the question:

At least 10–15 countries today have strong, centralized coordination systems that match your description — though they do not own farms. These systems are more about:

Orchestrated agriculture – where national production is planned, monitored, and aligned with export strategies in partnership with organized farmer associations.


What Stops a Country From Adopting Coordinated Demand-driven Agricultural Production?

A country is often not able to adopt coordinated, demand-driven agricultural production (without nationalizing farms) for six major reasons, each with multiple layers of structural and systemic inertia.


❶ Weak or Fragmented Farmer Organizations

Why it matters:
Coordinated production requires organized producers (e.g., cooperatives, associations) that can receive quotas, participate in planning, and supply consistently.

What stops it:

  • Historical mistrust in cooperatives
  • Politicization or elite capture of farmer groups
  • Fragmentation: Too many small, uncoordinated actors
  • Weak leadership or lack of technical capacity in associations

Example: In Botswana, farmers often operate individually or in loose groups without strong aggregation mechanisms for production or marketing.


❷ Poor Agricultural Market Intelligence & Data Systems

Why it matters:
Governments need real-time data on local production, global prices, weather, input access, and demand forecasts to guide decisions.

What stops it:

  • Absence of centralized production databases
  • Lack of investment in agricultural statistics and remote sensing
  • Disconnection between research bodies and policy decisions
  • Low digital infrastructure in rural areas

Without data, there’s no basis to permit, predict, or plan.


❸ Lack of Institutional Coordination

Why it matters:
Coordinated production requires alignment across:

  • Ministries (Agriculture, Trade, Finance, Infrastructure)
  • Export councils
  • Research and extension services

What stops it:

  • Turf wars and siloed operations
  • Frequent leadership changes or policy reversals
  • Weak coordination platforms (e.g., inactive agriculture councils)
  • Absence of a national agriculture command-and-control dashboard

❹ Absence of National and Export Market Contracts

Why it matters:
Export-led production thrives on forward contracts and pre-negotiated quotas with international buyers. These guide local production volumes and timing.

What stops it:

  • Limited international trade negotiations in agriculture
  • Poor branding of national produce (quality, consistency, certifications)
  • Weak or non-existent export councils for agriculture
  • Lack of investment in post-harvest handling and cold chains

In short: no buyers, no reason to scale production.


❺ Insecure Land Tenure and Weak Investment Incentives

Why it matters:
Farmers need to feel secure to invest in scaling production to meet quotas. Private capital needs clear property rights to engage.

What stops it:

  • Customary or leased land not usable as collateral
  • Unclear title deeds or long delays in land allocation
  • Inconsistent tax and subsidy policies
  • Fear of state interference or lack of trust in public agencies

❻ Skills Gaps: STEM, Management, Agronomy

Why it matters:
Coordinated production needs a skilled backbone — both in government planners and farmer-managers — who understand:

  • Market systems
  • Agribusiness logistics
  • Crop science and climate-smart production
  • Systems thinking for scaling

What stops it:

  • Education systems focus on “agriculture” but not core STEM
  • Extension workers lack upskilling in global trends
  • Low digital fluency across the agri-value chain

🧩 Underneath It All: A Missing Mental Model

At the heart of all these constraints is a mental model of agriculture as a:

  • Subsistence sector (not a commercial production industry)
  • Social policy tool (employment & land access) rather than an economic engine
  • Politically risky sector to regulate, due to voter sensitivities

Until this mental model shifts, efforts at coordination often stall.


✅ What It Takes to Shift

To transition to coordinated agriculture like the Netherlands, Denmark, or Vietnam, a country must:

Build national crop & livestock registries (traceability)

Mandate digital reporting of land use and yields

Empower farmer associations with planning & market access roles

Set up joint public-private Export Market Councils

Negotiate bulk purchase/export contracts regionally & internationally

Link national education to agribusiness STEM fields

Reorganize the Ministry into a strategy + data + extension nucleus


A transformation map for Botswana

Here’s a Botswana-Specific 10-Year Transformation Map to move from fragmented, input-subsidy-dependent farming to coordinated, demand-driven agricultural production that enables both food sovereignty and organized export markets — without nationalizing farms.

🇧🇼 BOTSANA AGRICULTURE TRANSFORMATION MAP (2025–2035)

Goal: Shift to a system where production is guided by national demand + structured export contracts, via strong public-private coordination.
Principle: Farms stay private; coordination becomes public.


🟩 PHASE 1: 2025–2027 – Foundation & Visibility

Theme: “See the System” – Map, Aggregate, Connect

Priority AreaKey ActionsLead Entities
🧭 1. National Production Mapping– Build digital registry of farms (land, crops, size, irrigation) – Use satellite + mobile reporting – Identify agro-climatic zones per cropMoA, Statistics Botswana, Land Board, UNDP
🤝 2. Empower Farmer Associations– Legal & capacity reform for existing associations – Support formation of national-level boards per major commodity (e.g., Potatoes, Horticulture, Poultry)Registrar of Societies, Farmers Unions, Business Botswana
📊 3. Market Intelligence Platform– Establish a digital dashboard for crop price, demand, weather, input availability – Run national demand studies & baseline exportsMinistry of Trade, MoA, SEZA
🔎 4. Rethink Subsidies– Begin shifting ISPAAD & LIMID from blanket inputs to targeted support based on crop priorities and agrozonesMoA Policy Division, MFED

🟨 PHASE 2: 2027–2030 – Coordination & Control

Theme: “Guide the System” – Aggregate Demand, Set Targets

Priority AreaKey ActionsLead Entities
📈 5. National Crop & Livestock Council– Form a legally mandated multi-stakeholder council (Govt + Farmer Boards + Exporters + Researchers) – Use council to approve seasonal production quotas and export targetsOffice of the President, MoA, Business Botswana
🔐 6. Contract Farming Expansion– Pilot export-oriented contracts in garlic, potatoes, chilies, and beef – Sign regional procurement contracts (e.g., SADC school feeding, GCC retailers)BITC, MoFAIC, Trade Attachés
📉 7. STEM-Agri Curriculum Reform– Integrate data analysis, systems thinking, and agribusiness into SHS and tertiary agri courses – Establish internship placements on export farmsMoESD, BIUST, BUAN
💼 8. Professionalise Extension Officers– Upskill officers in market systems, contract farming, regenerative production – Make performance linked to farmer productivity & supply alignmentMoA Training Department, LDF

🟥 PHASE 3: 2030–2035 – Export Reliability & Resilience

Theme: “Run the System” – Export with Confidence, Invest with Trust

Priority AreaKey ActionsLead Entities
🛫 9. National Export Board for Agriculture– Consolidate oversight of agri-export promotion, standards, marketing – Align with customs, veterinary permits, cold chain logisticsMoA, BAMB, Botswana Bureau of Standards
🏭 10. Value Chain Finance & Insurance– Develop crop insurance linked to production permits – Channel NDB and citizen equity funds through farmer boards – Attract private agri-finance via forward contractsNDB, CEDA, BITC, BoB
🧠 11. Systems Research & Forecasting– Use weather, market, soil, and input data to run production simulations – Use archetype-based insights to prevent overproduction, glut cyclesSTRLDi, BUAN, MoA
🔄 12. Legislative Backing– Revise National Agriculture Policy to reflect coordinated production model – Anchor it in Food Security and Economic Diversification strategyParliament, Attorney General’s Office

🧩 SYSTEM FEATURES ENABLED BY 2035:

  • ✅ Production permits based on demand forecasts (not guesswork)
  • ✅ National farm registry and traceability system
  • ✅ Data-driven price stabilization and export contracting
  • ✅ Digital dashboards at MoA and Districts for planning
  • ✅ Professionalized farmer base (similar to manufacturing)
  • ✅ Resilience against import bans and regional shocks

🔄 Optional: 4-Year Electoral Fit (2025–2029)

To align with political cycles, Phase 1 and early Phase 2 deliverables can form part of a presidential or ministerial results agenda, showing clear progress before elections.


My Inspiration for this Post

If you are a farmer or an agriculturalist (at any level), then you should watch this! Now!

Here’s a structured rundown of Netflix’s Rotten—the documentary series that inspired my reflection on farmers caught in volatile price cycles. It exposes how hidden market dynamics, fraud, and corporate systems hurt producers, often those at the very bottom of the chain.


📺 Overview of Rotten

  • A Netflix original investigative series (first season released January 5, 2018; second season October 4, 2019) with a total of twelve episodes across two seasons, each exploring corruption, fraud, and exploitation in global food systems (GQ, Wikipedia).

🔍 Season 1 (6 episodes) – “True Food Crimes”

1. Lawyers, Guns & Honey

Uncovers massive honey adulteration—beekeepers struggling to compete with cheap, syrup‑diluted honey flooding the U.S. market from China and other countries. Domestic producers are squeezed out, and regulators struggle to detect fraud (Garden Culture Magazine).

2. The Peanut Problem

Investigates a surge in peanut allergies in the U.S., linking it to shifts in processing, environment, and early childhood exposure. Highlights how industrial peanut systems affect public health and put pressure on farmers to keep up with opaque demand trends (Allergy Amulet).

3. Garlic Breath

The most gripping episode: a legal and ethical battlefield between Chinese exporters (some using prison labor) and U.S. garlic farmers. It reveals how global supply shocks, trade disputes, and price dumping devastate small producers (GQ).

4. Big Bird

Focuses on poultry production, showing how large-scale consolidation and export-driven demand distort local markets and compress margins for independent growers, often underregulated (GQ).

5. Milk Money

Centers on the raw milk controversy in the U.S., juxtaposing small dairy farm viability with public-health risks. It highlights how fear-based regulation and consumer mistrust can impact livelihoods without clear national strategy or market clarity (David Gumpert, GQ).

6. Cod Is Dead

Explores overfishing, regulatory loopholes, and global demand for seafood, showing how small fishing communities fall prey to industrial fleets and opaque supply chains, often without knowing who consumes their catch or at what price (Los Angeles Times, GQ).


🌍 Season 2 (6 episodes) – Deeper on Commodities & Ethics

Includes stories like:

  • The Avocado War – Supermarket chains squeezing small growers in Latin America.
  • Reign of Terroir – How terroir branding is co-opted by big players.
  • Troubled Water – Bottled water scams that leave communities thirsty.
  • A Sweet Deal, Bitter Chocolate, High on Edibles – covering sugar, chocolate production (including deforestation and labor abuse), and cannabis edibles respectively (Wikipedia).

🧩 Cross‑Cutting Themes

  • Global supply shocks and price volatility leave producers blind to demand, often overinvesting and ending in ruin.
  • Food fraud and adulteration undermine trust and crop value (honey, garlic, chocolate).
  • Corporate consolidation & opaque trade—big buyers and multinationals capturing margins, leaving farmers in informational darkness.
  • Labor exploitation, especially in low-cost producers like prison farms in China or cocoa plantations under slavery-like conditions.
  • Regulatory dysfunction: government bodies failing to protect small producers or clarify demand forecasts.
  • Emotional storytelling draws empathy—but also criticism for dramatizing issues over structural analysis (GQ).

🧑‍🌾 Relevance to Farmer Experience

Your concerns—that small farmers invest blindly, with no real insight into national or export demand, and thus suffer catastrophic losses—mirrors Rotten’s narrative. Farmers often don’t control:

  • Market entry or exit timing,
  • Price contracts,
  • Export pathways or demand data.

They’re typically stuck reacting rather than planning—leaving them vulnerable to price crashes, import floods, and external shocks. The series underscores the human toll of systemic opacity and misalignment.


✅ Summary Table

Episode / ThemeKey InsightImpact on Farmers
Honey adulterationPrice-undercutting by fraudulent syrup importsDomestic beekeepers driven out or starved
Garlic dumpingGlobal trade wars, forced labor, export inequalityU.S. garlic farmers lose ground and market share
Commodity allergiesShifting health trends and processing normsPeanut farmers suffer demand unpredictability
Poultry, fish, dairyExport pressures and consolidationSmall producers edged out, price and demand opaque

Did the documentary reach the conclusions we reached here?

No, the documentary Rotten does not explicitly reach the conclusion we’ve raised here — that coordinated, demand-driven national production planning is a necessary safeguard for farmers.

Instead, Rotten does the following:


🎥 What the Documentary Does Say:

  • It exposes the invisible machinery behind food systems — fraud, monopolies, unfair trade, exploitation, price dumping.
  • It empathizes with small farmers who suffer under market opacity, global trade forces, and power imbalances.
  • It documents farmer bankruptcies, family trauma, and systemic silence that precedes collapse.
  • It often frames these as consequences of deregulated capitalism, consolidation of corporate power, and corruption in trade.

🧠 What It Does Not Do:

  • It does not explicitly propose national production permits, demand forecasting, or farmer-board coordination as solutions.
  • It does not draw a policy systems map or push for governance reforms like those we are advocating.
  • It largely avoids proposing structural solutions, staying in the investigative and emotional storytelling space rather than systemic policy design.

✅ So, What Have We Done Differently?

We have taken Rotten a step further by:

Translating narrative diagnosis into policy prescription.

Where Rotten shows the symptoms, we’ve proposed the systemic cause and a coordinated solution.

The documentary paints the tragedy. We’ve used it to frame the design.

This is precisely the value of the systems thinking lens—where stories like Rotten become entry points to expose structure, delay, loop dynamics, and system traps that can be redesigned.


📄 Policy Memo: From Rotten to Resilient – Why Botswana Must Coordinate Its Agricultural Production

To: Ministry of Agriculture, Trade & Industry, Office of the President
From: [Your Name / STRLDi]
Date: [Insert Date]
Subject: Preventing Farmer Collapse through Coordinated, Demand-Driven Agricultural Planning


🎬 Background Inspiration

The global food documentary series Rotten (Netflix, 2018–2019) offers a sobering account of how disorganized, opaque, and exploitative food systems ruin small producers. While it focuses on the U.S., China, and Latin America, the core lessons are deeply relevant to Botswana’s farmers:

“What destroys the farmer isn’t drought or pest—it’s the silence before the market crashes.”


🚨 Key Lessons from Rotten

Episode ThemeUnderlying FailureResult for Farmers
Honey FraudLack of quality regulation & import controlLocal beekeepers undercut & collapse
Garlic DumpingUnregulated trade, forced labor, price floodingLocal garlic growers sued, outcompeted
Poultry ConsolidationNo control over contract terms, production quotasChicken farmers left with losses
Milk & Fish EpisodesNo demand forecasting, oversupply, regulatory chaosPrices crash; family farms shut down

🇧🇼 The Botswana Parallel

Farmers across Botswana face the same pattern of systemic vulnerability:

  • They produce without visibility into national or global demand.
  • They invest heavily without guaranteed buyers.
  • They enter markets that can be flooded by cheaper imports or fail due to price crashes.
  • Their fate is sealed when production is treated as individual initiative, not collective strategy.

🔑 Policy Recommendation: Coordinate Agricultural Production

Botswana can avoid this fate—not through state ownership, but through central coordination with decentralized production.

What Needs to ChangeHow to Implement It
❌ Farmers produce blindly✅ Establish seasonal production permits & quotas based on national + export demand forecasts
❌ No market visibility✅ Develop a National Agricultural Intelligence Platform (real-time price, supply, demand)
❌ Weak farmer associations✅ Mandate and professionalize crop-specific national producer boards
❌ Reactive policies✅ Use predictive modeling, weather & trade analytics to plan ahead
❌ No export assurance✅ Pre-negotiate contracts via Export Market Councils (public-private)

📈 Strategic Benefits

  • Reduces price volatility for both producers and consumers
  • Prevents overproduction gluts and underproduction shocks
  • Builds investor confidence in agribusiness supply chains
  • Protects smallholder farmers from being the last to know—and the first to suffer

🧠 The Rotten Test: Ask of Any Policy

“Does this system give the farmer clear, real-time information about how much to produce, when to produce, and where it will go?”

If the answer is no, the policy—like the food systems exposed in Rotten—may be setting them up for failure.


📌 Closing Note

The stories of collapsed garlic farms, ruined poultry growers, and poisoned fishers in Rotten show us one thing: a happy family at the breakfast table doesn’t come from heroic individual effort—it comes from a system that plans, protects, and pays. Botswana’s farmers deserve no less.


What Nature Speaks Water Usage and Agriculture


In Cereal, Horticulture & Meat Production

Early Signals, Not Yet a Systemic Map


We do not yet have access to the extensive national data collection that underpinned the unemployment study. However, we have identified substantive datasets for Botswana and the region through FAOStats, which form a solid initial foundation. Using these, we are currently developing a case study to examine these dynamics at a global scale.

That said, the work would benefit significantly from deeper, locally anchored data. I would strongly welcome the opportunity for the Ministry to co-lead in organizing the data infrastructure. The region, more broadly, could also participate in strengthening the infrastructure. This is needed to support a systems thinking inquiry of this kind. Such collaboration would bring greater analytical depth. It would also ensure national and regional ownership of the insights that emerge.

At this point, our thinking is guided by what is publicly available through internet-based searches. While this has allowed us to outline key directions, we are acutely aware of the limitations. For that reason, I ask that you handle this information with professional discretion. Please do so until we are in a position to confirm and consolidate findings more robustly.

A distinctive aspect of our approach to systemic mapping is its ability to trace causal influences. It does this both at a specific point in time, but importantly, also traces these influences across time. This allows us to surface structural patterns. These include feedback loops, delays, and reinforcing behaviors. Such patterns often underpin not just the problem, but its persistence. We can begin this work with 20-year datasets. However, having a longer time series makes the causal structure more robust. This long-view perspective is especially important for policymakers seeking interventions that are not only responsive but also transformative.


Introduction

If the stories and explanations we’ve been using haven’t helped solve the problem, it’s time to take a step back. We need to ask new questions. Sometimes, we need to look deeper—or in entirely new directions—to find what’s really going on. Only then can we start telling a new story, one that brings real and lasting change.


**“We may not control the weather with the press of a button—but we are already influencing it, profoundly. The systems we built to extract water have altered rainfall patterns. This includes deforestation, exposed-field farming, and over-irrigation. These actions have weakened the water cycle. The question isn’t whether human action affects weather; it’s how we choose to act.

When we start to treat water as a partner, we create landscapes that invite rain. It’s not just a resource. Moist soils, living roots, and transpiring plants cool the land, seed clouds, and stabilize local climates. It’s not about control—it’s about cooperation with the natural systems we depend on.”**

— Adapted for regenerative agriculture and water cycle resilience messaging


What Nature Speaks: Rethinking Water Use and Agriculture in Botswana – Summary

  • High water use, low returns: Botswana’s agriculture consumes large volumes of water but contributes minimally to GDP.
  • Cereal crops as a key outlier: While beef and horticulture align with global water-use norms, cereal crops are often drought-resistant. However, they use far more water and have lower productivity.
  • Not poor practice, but environmental exposure: The inefficiency stems from exposed-field farming in a semi-arid climate, leading to extreme evaporation.
  • Drought-resistance as a false solution: Over-reliance on drought-tolerant crops may suppress transpiration, disrupt rainfall cycles, and accelerate land degradation.
  • Yields and GDP suffer: Reduced rainfall and deteriorating soils weaken crop yields and reinforce the sector’s underperformance.
  • A call to ecological cooperation: The article urges a shift from controlling nature to partnering with it through regenerative practices.
  • Time to reintroduce water-cycle crops: Non-drought crops—especially horticultural varieties—can cool the land, restore rainfall patterns, and build resilience.
  • Toward a regenerative future: By designing agriculture to regenerate rather than extract, Botswana can improve climate stability. It can also boost productivity and enhance long-term economic contribution.

🔁 From Efficiency to Regeneration: Rethinking Water Use and Crop Strategy in Botswana

Dr. Rasbash’s analysis in “Thirsty Farms, Empty Returns” The Gazette, 28 May, 2025 (pg 24) highlights a critical issue. Botswana uses a lot of agricultural water. However, it experiences low economic returns.

We, like Dr Rasbash, noticed a significant deviation in water consumption per tonne of agricultural produce in Botswana. This is evident when compared to global benchmarks (for details refer to Part III below). The most striking difference, however, is in cereal production. Beef is the most water-intensive product. However, both beef and horticultural crops show water usage broadly comparable to international standards. Cereal crops, on the other hand, diverge sharply.

If so, this discrepancy may not be a reflection of poor farming practices, inefficient irrigation, or crop selection per se. Rather, it stems from the environmental context in which these crops are grown. Unlike horticultural crops, cereals in Botswana are typically cultivated in open fields without protective cover. The country’s semi-arid to arid climate causes a substantial loss of applied water due to evaporation. For details refer to: Comparison of Average Annual Evaporation by Climate Zones in Part III below. High solar radiation and ambient heat drive this evaporation process.

This insight now invites us to go beyond technical adjustments. It compels us to ask deeper questions:

What keeps the sector from understanding inefficiencies despite repeated episodes of the issue?
The answer may lie in the assumptions we’ve internalized about what defines “productive” agriculture in dryland conditions.

Rainfall cycles and cooler climates are supported by vegetation that actively contributes to transpiration. These plants boost atmospheric moisture. These traits are less common in drought-resistant crops (for details, refer to Part I below). By designing agricultural systems that collaborate with natural water cycles, Botswana can enhance resilience. These systems work with nature. They do not resist it. (For details on the consequences of resisting it, refer to Part II below). This approach allows Botswana to move toward climate-resilient productivity and long-term food security.

Too often, agricultural solutions default to scaling up drought-resistant crops—an understandable and technically sound response to erratic rainfall. However, this approach risks masking a deeper systemic challenge. While drought-resistant crops will buy us time, they cannot reverse the underlying drivers of desertification. Nor can they rebuild climate resilience if soil health continues to decline and vegetation cover is reduced. These conditions weaken the land’s capacity to retain water. They disrupt critical feedback loops in the water cycle. This disruption ultimately contributes to declining yields. It also fosters the perception that agriculture underperforms in driving national GDP.

Crops that promote transpiration and atmospheric moisture, on the other hand, include many horticultural varieties. These crops will initially require time to re-establish after years of disuse. However, they offer long-term potential to help restore local rainfall cycles and moderate surface temperatures. When grown under protective systems and supported by regenerative practices, they:

  • Improve soil structure and organic matter to retain moisture,
  • Reduce surface temperatures through better vegetative cover,
  • Ultimately lead to fewer heatwaves and more stable growing conditions leading to better yields and more stable climates.
  • Enhance transpiration, which supports cloud formation and rainfall,

This is not just a shift in crop choice. It is a recalibration of agriculture’s role. The focus is changing from resisting climate change to regenerating the conditions that make farming viable in the first place.

Instead, we should view agriculture as a partner in the water cycle, not just a consumer of it.


It’s true—we cannot “control” the weather in the way we control machines or systems with switches and dials. But we’re already influencing it, profoundly—just not always with awareness or intention. The very technologies and land-use systems we designed to maximize extraction have altered rainfall patterns. This occurs through deforestation, large-scale irrigation, or monocropping. They have also increased surface temperatures and weakened the water cycle.

The question is not whether human action affects the weather—it clearly does. The question is how we choose to act.

Think of it like a forest. No single tree controls the climate, but together, their presence regulates humidity, encourages rainfall, moderates temperature, and stabilizes soil. Likewise, agriculture, land cover, and soil practices can act like an ecological switchboard.

We see measurable improvements when we treat water as a partner in productivity. It’s not just a resource to be extracted. Moist soils reduce land temperatures. Vegetation increases transpiration, which adds moisture to the air. This feedback is slow, subtle, and cumulative. They are real and supported by growing evidence in agroecology, climate science, and satellite data.

We may not press a button to make it rain tomorrow. However, we can build landscapes that invite rainfall over the seasons. In doing so, we move from technological control to ecological cooperation—from managing components to designing for outcomes.


Without this shift, efforts at water efficiency—however well-intentioned—may end up reinforcing the vulnerabilities they aim to fix.

“Efficiency without regeneration risks accelerating the very vulnerabilities we aim to overcome.”

Ultimately, this calls for a paradigm shift. We need to move from maximizing extraction to optimizing contribution. Land, water, and communities should be healthier each season than the last. Botswana’s agricultural strategy must evolve from technical reform to systemic redesign, aligning with ecological processes rather than resisting them.


PART I

The Impact of Crops That Transpire Less

Crops that transpire less can significantly alter the local and regional water cycle, especially when adopted widely across a landscape. Here’s a breakdown of the key impacts:

1. Reduced Moisture Recycling (Less Local Rainfall)

Transpiration contributes to atmospheric moisture, which can return as local or regional rainfall.

  • When crops transpire less, less water vapor enters the atmosphere, leading to:
    • Lower humidity
    • Reduced cloud formation
    • Decreased local rainfall, especially in semi-arid and continental interiors

🔹 Impact: This can contribute to longer dry spells and a feedback loop of aridification, especially in areas already vulnerable to desertification.


2. Lower Evapotranspiration = Slower Water Cycling

Evapotranspiration (ET) = evaporation from soil + transpiration from plants.

  • Lower ET = slower movement of water from soil to atmosphere.
  • This can:
    • Reduce cooling of the land surface (because ET consumes heat)
    • Potentially increase surface temperatures during the day

🔹 Impact: Hotter days, reduced rainfall, and possible heat stress for crops and livestock.


3. Increased Soil Moisture Retention (Short-term Benefit)

Less water is lost to the atmosphere. As a result, soils may stay moist longer. This initially improves drought resistance and reduces irrigation needs. This initially improves drought resistance and reduces irrigation needs.

🔹 Impact: In the short term, this supports water conservation.
In the long term, if this leads to reduced rainfall, it can backfire.


4. Landscape-Level Hydrological Shifts

When drought-resistant, low-transpiration crops replace native vegetation or high-transpiration crops, they:

  • Disrupt ecosystem-level water cycling
  • Potentially lower groundwater recharge (fewer rain events = less infiltration)
  • Shift local climate patterns due to changes in surface albedo* and humidity

🔹 Example: Large-scale planting of low-transpiration crops across a savanna could reduce the frequency of convective afternoon rains.


Rainfall Levels for Botswana 1970 to 2020.

*Albedo is a scientific term. It refers to the reflectivity of a surface. Specifically, it describes how much sunlight (solar radiation) a surface reflects back into the atmosphere instead of absorbing it.


Simple Definition:

Albedo is the fraction of incoming solar energy that is reflected by a surface.

It is measured on a scale from 0 to 1:

  • 0 = No reflection (total absorption, like black asphalt)
  • 1 = Full reflection (perfectly reflective, like fresh snow)

Examples of Albedo in Nature and Land Use:

Surface TypeTypical Albedo
Fresh snow0.8 – 0.9
Dry sand/desert0.3 – 0.4
Grassland/crops0.2 – 0.25
Forest (dark vegetation)0.1 – 0.2
Water (angle-dependent)0.05 – 0.1
Black soil/asphalt0.04 – 0.1

Why It Matters in Agriculture and Climate:

  • Higher albedo = more solar radiation is reflected = cooler local temperatures.
  • Lower albedo = more solar radiation is absorbed = warmer local temperatures.

For example, deforestation lowers albedo because darker soil absorbs more heat, potentially intensifying local warming.

In agriculture, mulching, crop type, soil exposure, and canopy density each impact the albedo of a farming landscape. These factors influence microclimates and water loss.

Would you like a visual example or its role in climate feedback loops?

Summary Table

EffectLow-Transpiration Crops Impact
Local Rainfall↓ Decreases
Humidity↓ Decreases
Soil Moisture (Short-term)↑ Increases
Groundwater Recharge (Long-term)↓ Decreases
Temperature Moderation↓ Less evaporative cooling
Water Use Efficiency↑ Increases

Implications for Agricultural Planning in Botswana

  • Drought-resistant, low-transpiration crops help in the short term. However, relying on them without reforesting, mulching, and soil regeneration can be risky. It’s important to balance these crops with plants that transpire more. Otherwise, it may lead to a drier, hotter, and less predictable climate.
  • Strategic planning must balance plant-level efficiency with landscape-level water cycle stability.

KEY INSIGHTS:

Declining Rainfall in Key Production Areas:

Rainfall levels in Botswana have declined in specific cereal- and livestock-producing regions over the past 15 years. Other areas have remained unaffected, according to historical data from the Botswana Meteorological Department. This challenges the idea of a uniform global warming effect. It suggests that localized environmental degradation may be happening. This degradation is likely linked to agricultural land use and possibly deforestation.

Limitations of Cereal Investment Narratives:

There is a common assumption that increasing investment in cereal production alone can reverse national declines. However, efforts to regenerate ecological conditions must occur in parallel. This includes maintaining moisture levels and soil structure. Otherwise, such strategies may prove unsustainable, even for drought-resistant crops.

Escalating Desertification Risks:

Desertification is not static—it is steadily progressing. Without systemic change, even crops bred for resilience will eventually become non-viable. Long-term adaptation strategies must go beyond input substitution and address root climatic trends.

Rationale for Regenerative and Horticulture Focus

In response, STRLDi advocates for a regenerative agriculture strategy, particularly through horticulture. Horticulture is initially vulnerable to erratic weather. However, it offers a critical advantage by actively contributing to atmospheric moisture and soil regeneration. Over time, this enhances local microclimates and can help reverse drying trends caused by extractive practices.

Balancing Competing Agricultural Priorities:

The solution is not to swing policy wholly toward one system or another. Instead, it lies in designing a balanced agricultural model. This model must meet food security targets and restore ecological function.

Data Gaps Undermine Strategic Action:

Preliminary FAOSTAT data indicate a countrywide decline in cereal production, aligning with producer concerns over inconsistent field data. This may limit the Ministry’s capacity to regulate imports effectively or justify increased sectoral investment. Delayed payments to producers could be symptomatic of this deeper structural imbalance.


Recommendation:

There is an urgent need for a national effort to collect and analyze disaggregated, region-specific production and climate data. Policymakers, investors, and farmers need a systems-based understanding of Botswana’s agricultural future. This understanding will help them co-create a more resilient and self-sustaining agricultural sector.


Subject: Reflections on National Cereal Production and Data Trends

Dear Mr. Tema,

I had thus far refrained from commenting on the country’s cereal and meat production landscape. I felt it important to first examine more recent and comprehensive data sets in both sectors.

Fifteen years ago, I had noted that rainfall patterns were declining in certain areas. This was based on historical data from the Botswana Meteorological Department. These localities were known for cereal and livestock production. Interestingly, this trend was not mirrored in all parts of the country. This suggests that the issue may not solely be the result of a uniform global warming effect. Rather, it indicated possible localised environmental degradation. This could be linked to agricultural practices and land use changes. Such changes may include or even lead to deforestation. With more robust and longitudinal datasets, these causal relationships can be better defined and understood.

This point may appear subtle, yet it carries significant weight and is often overlooked in discussions. It illustrates how we identify high-leverage interventions. Specifically, it concerns the observed correlation between drought-resistant cereals and declining rainfall. The common conclusion is to increase investment in cereal production to counteract the decline—an understandable response. However, without addressing the underlying climatic shifts driving these patterns, we risk falling short of achieving true resilience. Long-term productivity gains are unlikely without confronting these deeper systemic changes.

I recall saying at that time that even drought-resistant crops will eventually be phased out. The climatic conditions they are meant to survive will worsen. Even they cannot withstand these changes. Desertification is not a fixed point—it is dynamic and constantly expanding. We must change land use, water retention strategies, and soil regeneration practices. Otherwise, we risk pursuing production targets in environments that are no longer viable.

This may help you understand why I have taken a regenerative agriculture approach. I have also placed emphasis on boosting horticulture production levels. Horticulture might initially suffer from the same drying effects of climate variability. However, when approached regeneratively, it presents a potential solution. It contributes to atmospheric moisture and enhances local microclimates. Unlike conventional cereal farming, it can help reverse some drying conditions. These conditions are caused by widespread cultivation of crops that, while drought-resistant, do not release moisture into the atmosphere. This occurs in combination with other extractive agricultural practices.  The key, I believe, is not to swing the pendulum entirely in one direction. Instead, a practical balance should be found. This balance is between systems that nourish the land and those that meet the country’s food needs.

I have compiled an initial set of figures from FAOSTAT to begin exploring these patterns. While the current dataset is limited, the preliminary trends suggest a sustained nationwide decline in cereal production. This situation may partly explain why producer associations feel caught between competing pressures. They are unable to rely on consistent field-level data to inform the Ministry’s regulatory decisions. This is particularly true concerning the timing and scale of import restrictions.

The Ministry itself may also be facing a difficult balancing act. Without clear evidence of import substitution, justifying increased allocations to the sector becomes challenging. There is no significant drop in the national import bill for cereals. This, in turn, likely affects its capacity to pay producers promptly, further exacerbating trust and viability within the sector.

A more coordinated effort is needed. We need to gather and analyze disaggregated, locality-specific production and climate data (see inbox below). This effort would shape responsive policies. These policies would strengthen national food security and protect the economic interests of our producers.

Warm regards,
Sheila Damodaran
Managing Director
Systems Thinking Research & Leadership Development Institute (STRLDi)
Botswana
Tel: 75987534

May 14, 2025


PART II

GRAIN PRODUCTION, DEMAND AND CONSUMPTION TRENDS 1960S – 2020S

Comparing Botswana’s grain production and demand from the 1960s to the present shows a persistent gap. Domestic production consistently falls short of consumption needs. This disparity has necessitated substantial grain imports to meet the country’s food requirements.

📊 Grain Production Trends (1960s–2020s)

  • 1960s–1980s: Grain production was generally low, with significant fluctuations due to droughts and limited agricultural infrastructure. For instance, in 1984, production dropped to a record low of 9,525 metric tons. (CEIC Data)
  • 1990s–2000s: Efforts to improve agricultural output led to some increases in grain production. However, challenges such as inconsistent rainfall and limited agricultural infrastructure continued to hinder substantial growth.
  • 2010s: Production levels varied, with some years witnessing improvements due to better rainfall and government support programs. For example, in 2017, the total grain production was 2,348 metric tons. However, by 2019, production had declined sharply to 583 metric tons, primarily due to drought conditions.
  • 2020s: Recent data indicates a gradual increase in grain production. In 2022, cereal production was reported at 85,049 metric tons. By 2028, grain production could rise to 64,100 metric tons. This is an increase from 59,000 metric tons in 2023. It reflects an annual growth rate of 1.3%.

📈 Grain Demand and Consumption

While specific year-on-year consumption data is limited, it’s evident that Botswana’s grain demand has consistently outpaced domestic production. The country’s reliance on grain imports underscores this gap. For instance, in 2023, Botswana ranked 143rd globally in grain production, with Lesotho surpassing it by producing 59,000 metric tons. (Taylor & Francis Online, ReportLinker)


📉 Production vs. Demand Gap

The persistent shortfall in grain production relative to demand has led to a dependence on imports to ensure food security. Factors contributing to this gap include:

  • Crop Production Choices Exacerbating Climate Variability
    Botswana’s semi-arid climate and recurrent droughts have long posed challenges to agricultural productivity. Current crop production choices are adding to the problem. They limit the landscape’s ability to support moisture recycling. As a result, they decrease rainfall. In this way, agricultural decisions are not only shaped by climate variability but may also reinforce it.

📚 Data Sources for Detailed Analysis

For a more comprehensive year-by-year breakdown of grain production and consumption statistics in Botswana, the following resources are recommended:

  • Statistics Botswana: Provides detailed agricultural survey reports and data. (Statistics Botswana)
  • FAO GIEWS Country Briefs: Offers insights into food security and agricultural trends. (FAOHome)
  • CEIC Data: Contains historical data on agricultural production and consumption. (CEIC Data)

To check the extent increases were the result of proceeds from sales or capital injections.  

CEREALS PRODUCED IN PANDAMATENGA

Pandamatenga, situated in Botswana’s Chobe District, stands as the nation’s primary hub for cereal production. The area’s favorable conditions are ideal for large-scale, rainfed agriculture. These conditions include flat terrain, fertile Vertisol soils, and annual rainfall averaging around 600 mm. (Wikipedia, African Development Bank Group)

🌾 Major Cereals Produced in Pandamatenga

Sorghum: As Botswana’s staple grain, sorghum is extensively cultivated in Pandamatenga. In the 2022–23 season, the region produced approximately 42,100 tonnes of sorghum, marking an 11% increase from the previous year. This output significantly contributes to national self-sufficiency in sorghum production. (Mmegi Online)

Wheat: Traditionally a minor crop, wheat cultivation in Pandamatenga has expanded in recent years. During the 2022–23 season, there was a nearly 30% increase in wheat production. This indicates a growing importance in the region’s agricultural portfolio. (Facebook, Mmegi Online)

Maize: Maize is a significant cereal crop nationally. However, its cultivation in Pandamatenga is less prominent compared to sorghum and wheat. However, it remains an essential component of the region’s cereal production.

Millet: Grown on a smaller scale, millet contributes to the diversity of cereals produced in Pandamatenga. Its cultivation supports food security, especially in areas with variable rainfall.(chobedestination.co.bw)

🌱 Additional Crops

Beyond cereals, Pandamatenga’s farmers also cultivate various pulses and oilseeds, including cowpeas, chickpeas, mung beans, sunflower, and sugar beans. These crops not only diversify agricultural output but also enhance soil fertility through crop rotation practices. (Mmegi Online)

🏗️ Infrastructure and Development

To support and enhance agricultural productivity, significant investments have been made in infrastructure within the Pandamatenga region. Notably, 12 modern steel grain silos are being constructed. Each silo has a capacity of 5,000 metric tonnes. This aims to improve grain storage and management. This development is expected to motivate farmers to increase grain production, thereby promoting food security. (Guardian Sun, Daily News)

In summary, Pandamatenga’s strategic importance in Botswana’s agricultural sector is significant. It contributes substantially to cereal production, focusing on sorghum and wheat. These contributions are supported by favorable agro-climatic conditions and ongoing infrastructure development.

Continue reading What Nature Speaks Water Usage and Agriculture