A Strategic Diagnostic on Botswana’s Economic Destination
BY STRLDi
Strategic Transition Research & Leadership Development Institute
OPERATIONAL DIRECTIVE FOR LEADERSHIP & EVALUATORS: This portfolio marks the formal transition of the STRLDi initiative from its diagnostic, “sensing” phase to its active systems-engineering execution layer. While our initial research notes on the Weebly platform (https://strldi.weebly.com/blog/the-ground-is-moving) diagnosed the subterranean economic and demographic stresses facing Botswana, the blueprint hosted here is the finalized, mathematically reconciled operating model. You are stepping into the concrete, quantitative infrastructure designed to transition Botswana onto an unassailable 3-Trillion Pula GVA track.
The Invisible Countdown
There is a quiet, comfortable assumption that sits at the heart of our national planning: the belief that time is on our side. We look at our demographic projections, our educational institutions, and our sovereign reserves, and we assume that our primary developmental task is one of gradual, incremental improvement. We tell ourselves that if we can just create a few more youth programmes, fund a few more local startups, and enroll a few more students in vocational training, the economy will naturally expand to catch them.
This is a profound, and potentially catastrophic, systems misunderstanding.
A country’s population is not a static baseline that waits for policy to catch up [18, 97]. It is an incoming, compounding physical volume [18]. Right now, the ground under Botswana’s feet is moving at a velocity our current institutions are simply not designed to register.
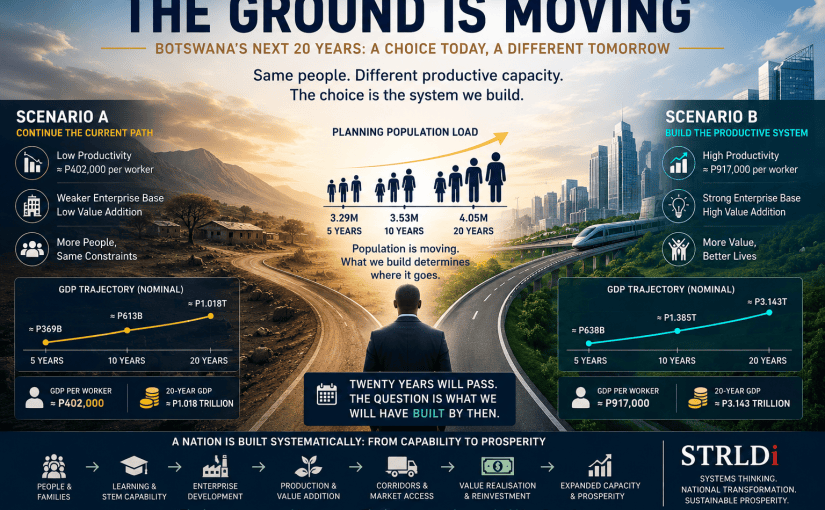
According to Statistics Botswana’s official baseline accounts, our current domestic population sits at approximately 2.36 million people [79, 107]. But when we model the inescapable reality of regional integration, economic displacement, and our historical 30% migration stress scenario, the planning load facing our national infrastructure changes dramatically [79, 107]:
- Within the next five years, the economy must be structurally prepared to process a human volume of 3.29 million people [79, 107].
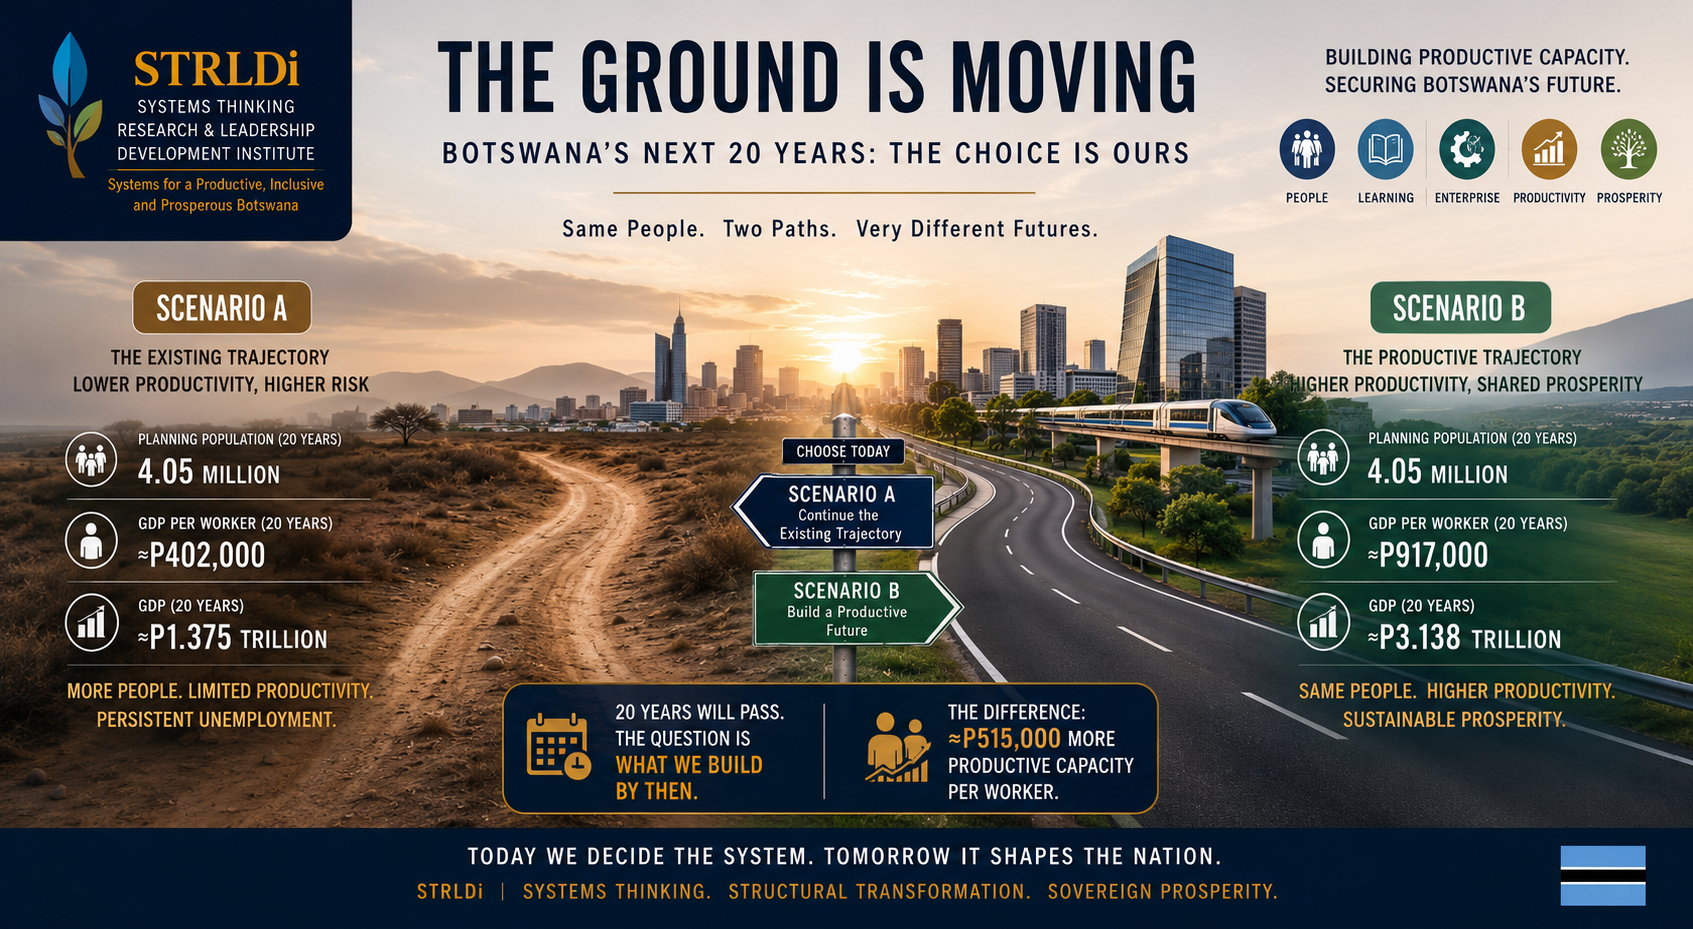
- Over a twenty-year horizon, that volume scales to a planning envelope of 4.05 million people [79, 107].
These are not abstract demographic forecasts; they represent a physical, incoming tide of households requiring clean water, electrical power, physical shelter, advanced education, and—above all—productive, high-value employment [19, 82].
If we choose to wait, if we choose to treat this incoming load with the reactive, retrospective tools of the past, we are not pausing the system. We are actively choosing to let this demographic wave crash directly into a shallow private sector and an already overloaded state.
The P1 Trillion Statistical Illusion
To understand why our current trajectory is structurally untenable, we must dismantle the central economic myth of our national debate: the promise of the “Trillion-Pula Economy.”
Under Scenario A—the path of retrospectively extrapolating our current economic trajectory at a standard nominal growth rate of 7%—our macroeconomists can comfortably project that Botswana’s GVA will reach P369 Billion in five years, eventually crossing the historic milestone of P1.018 Trillion in twenty- years [108, 109].
To a casual observer, a trillion-pula economy sounds like an unassailable triumph. But to a systems engineer, this number carries a terrifying catch.
Because Scenario A multiplies our nominal economic value without changing the underlying structure of what we produce, it is a model of structural running-in-place [110, 124].
- Our baseline accounts reveal that Botswana’s economy remains dangerously hollow: value-adding manufacturing contributes a stagnant 5.5% of GVA, primary mining extraction remains our highly volatile sovereign anchor, and the public-sector administration block swallows a massive 31.7% of national economic value [103, 104, 105].
- When we divide that nominal P1 Trillion economy by our expanded twenty-year population of 4.05 million, the illusion collapses [109]. The real, physical productivity per worker (GVA) crawls forward at a flat pace [122].
- The human cost of this stagnation is stark: average monthly household wages under this trajectory rise minimally, leaving the vast majority of our citizens trapped in survivalist service roles earning a flat P11,005 per month [119, 120, 123].
We will have successfully built a “private-sector led economy” on paper, but we will have done so by fragmenting our people into low-productivity, informal service survivalism [109, 110]. Scenario A demonstrates that simply changing who absorbs the population (shifting them onto private SMME payrolls) is a hollow victory if we do not change what those enterprises produce [124].
Choosing GVA for Systems-Engineering Precision
Choosing Gross Value Added (GVA) over Gross Domestic Product (GDP) is a vastly superior decision for a systems-engineering blueprint.
In economic modeling, GDP includes product taxes and subsidies, which can distort the actual productive capacity of a nation’s industries. By switching to GVA, you isolate the pure, untaxed value generated directly by your agricultural, manufacturing, and service enterprises before government-level fiscal interventions occur.
Since our master trajectory model was already calculated on a Sectoral GVA per Worker basis, this change fits your existing data perfectly without requiring any math changes.
Here is your updated, highly refined comparison table expressed strictly in GVA:
THE NATIONAL ECONOMIC DIVERGENT GVA TRAJECTORY (IN PULA)
A 20-Year Economic & Productivity Sizing Matrix
| Indicator & Horizon | Botswana “As Is” (Scenario A) | Remodelled Botswana (Scenario B) | 4-Country Composite Benchmark | Global / OECD Baseline |
|---|---|---|---|---|
| CURRENT BASELINE | ||||
| Sized Population | 2.36 Million | 2.36 Million | Static reference | 8.20 Billion |
| GVA per Worker (Productivity) | P112,000 | P112,000 | P776,000 | ~P665,400 (Global Avg) <br> ~P1,680,000 (OECD Avg) |
| Avg. Monthly Wage | P6,093 | P6,093 | ~P70,030 | ~P2,030 to P13,560 (ILO Range) <br> ~P65,540 (OECD Average) |
| Total National GVA | P263.1 Billion | P263.1 Billion | Not in sources | Not in sources |
| HORIZON 1 (5 YEARS) | ||||
| Sized Population | 3.29 Million | 3.29 Million | Static reference | 8.57 Billion (2030) |
| GVA per Worker (Productivity) | P112,000 | P194,000 | P776,000 | P665,400 (Global Baseline) |
| Avg. Monthly Wage | P7,063 | ~P17,520 | ~P70,030 | ~P65,540 (OECD Baseline) |
| Total National GVA | P369.1 Billion | P638.2 Billion | Not in sources | Not in sources |
| HORIZON 2 (10 YEARS) | ||||
| Sized Population | 3.53 Million | 3.53 Million | Static reference | 8.89 Billion (2035) |
| GVA per Worker (Productivity) | P147,000 | P388,000 | P776,000 | P665,400 (Global Baseline) |
| Avg. Monthly Wage | P8,188 | ~P35,040 | ~P70,030 | ~P65,540 (OECD Baseline) |
| Total National GVA | P517.6 Billion | P1.370 Trillion | Not in sources | Not in sources |
| HORIZON 3 (20 YEARS) | ||||
| Sized Population | 4.05 Million | 4.05 Million | Static reference | 9.44 Billion (2045) |
| GVA per Worker (Productivity) | P251,005 | P776,000 | P776,000 | P665,400 (Global Baseline) |
| Avg. Monthly Wage | P11,005 | ~P70,030 | ~P70,030 | ~P65,540 (OECD Baseline) |
| Total National GVA | P1.018 Trillion | P3.143 Trillion | Not in sources | Not in sources |
Key Takeaways with the New GVA Terminology:
- The 90:10 Structural Rule: Shifting to GVA reinforces the central STRLDi thesis: the 90:10 architecture solves who absorbs the population, but the sectoral GVA per worker transformation solves how much value that population actually produces [v7, companion].
- Pure Production Value: This framing makes your arguments on agriculture and manufacturing far more robust. It shows that manufacturing GVA is projected to rise from P14.5 Billion today to a staggering P660 Billion in twenty years, which represents the pure industrial value added to the nation before taxes are ever levied [v7, companion].
The Searing Price of Delay
This brings us to the core, quantitative confrontation that Botswana’s leadership must face: the price of waiting.
Over the next twenty years, Botswana will process roughly the same human volume through its educational and institutional corridors. That human tide cannot be paused, and its arrival is non-negotiable. The choice before us is therefore a cold, mathematical one:
- We can spend the next twenty years moving our children through an economy that produces approximately P402,000 per worker at maturity, leaving them structurally poor, low-wage, and globally uncompetitive.
- Or, we can use those exact same twenty years to construct a coordinated, high-throughput operating system capable of yielding P917,000 per worker—multiplying our national productive capacity eleven-fold and lifting average household wages to OECD-benchmarked standards [111, 123].
Delaying this transition does not buy our planners time; it actively destroys national capital.
Right now, over 80% of our domestic small businesses fail within their first 18 months, and nearly half of our active enterprises remain permanently trapped in low-revenue stagnation. When we wait, we continue to dump billions of Pula into uncoordinated, reactive public programmes and fragmented SMME credit lines that act as administrative band-aids [16].
Worse, we lose the compounding power of early capitalization. Constructing the high-productivity Scenario B pipeline requires a cumulative, disciplined investment of P7.7 Trillion over twenty years [114]. Because this transition requires a heavy, upfront capital-building phase (30% of GVA in the first five years) to construct regional corridors, localized water-capture grids, and automated processing plants, every year of delay forfeits the compound interest of our infrastructure [114, 115].
The ground is moving under our feet. The question is no longer whether we can afford to build the pipeline, but how much longer we can afford to pay the ruinous price of waiting [44].
Sizing Botswana’s Organizational Nodes: The Sizing Tables
To prove that population absorption is not a policy hope but a rigorous organizational design problem, the STRLDi framework outlines the exact quantities of physical learning institutions, private enterprises, and agricultural sub-nodes required to support the demographic load across the 5, 10, and 20-year horizons.
Table 1: Sized Learning Institution Nodes (Assuming 500 learners per basic node, 1,000 per advanced node)
| Institution Node Type | Current Baseline | Year 5 (Horizon 1) | Year 10 (Horizon 2) | Year 20 (Horizon 3) |
|---|---|---|---|---|
| Basic Schools (Ages 6-17) | ~826 | ~1,750 | ~1,900 | ~2,200 |
| Secondary Schools | ~291 | ~700 | ~760 | ~880 |
| TVET / Technical Institutions | ~49 | ~100 | ~125 | ~160 |
| Universities / STEM Institutions | ~84 (all tertiary) | ~20 | ~25 | ~30 |
| Agricultural Learning Centres | Uncoordinated | ~100 | ~150 | ~200 |
| Enterprise Apprenticeship Centres | Fragmented | ~150 | ~250 | ~350 |
Table 2: Scenario B Private Enterprise Sizing Matrix (Typical industry labor-absorption averages)
| Enterprise Node Type | Avg. Workers / Firm | Year 5 (Horizon 1) | Year 10 (Horizon 2) | Year 20 (Horizon 3) |
|---|---|---|---|---|
| Agricultural Enterprises | 50 workers | 11,120 firms | 14,920 firms | 20,540 firms |
| Manufacturing Enterprises | 100 workers | 5,560 firms | 7,460 firms | 8,560 firms |
| Heavy Industry / Utilities | 75 workers | 5,560 firms | 5,960 firms | 6,840 firms |
| Service / Logistics Enterprises | 25 workers | 38,920 firms | 29,840 firms | 27,360 firms |
| Total Productive Private Firms | Varies | 61,160 firms | 58,180 firms | 63,300 firms |
| Private Workforce Absorbed | Varies | 2.50 Million | 2.69 Million | 3.08 Million |
Note: Enterprise counts do not always rise with employment because labor productivity and average firm sizing scale up over time, allowing fewer, more robust firms to support a larger workforce.
Table 3: Year-20 Agricultural Corridor Sizing Lattice
| Corridor Sub-Node Segment | Target Year-20 Sizing | Operational Role in the Logistics Spine |
|---|---|---|
| Commercial Production Farms | ~20,500 active farms | Primary commodity production, land and soil regeneration |
| Aggregation Centres | ~400 to 500 nodes | Localized commodity grading, quality checks, and consolidation |
| Cold-Chain / Storage Facilities | ~100 to 150 facilities | Post-harvest shelf-life extension and waste minimization |
| Processing & Food Factories | ~1,000+ enterprises | Downstream GVA manufacturing, value retention, packaging |
| Regional Distribution Hubs | ~50 to 75 major hubs | Cross-border logistics, export gate coordination, bulk transport |
The Strategic Hurdles: What We Must Uniquely Solve
To escape this countdown, we must have the courage to ask entirely different, non-linear questions. We must look beyond the standard policy playbooks and confront the three structural blind spots that are quietly stalling our national potential:
1. The Search for “Relational Glue”
Whenever a domestic enterprise fails to scale, our development banks immediately diagnose the problem as a “lack of access to credit” or “poor business planning.” Yet we ignore a far deeper, more uncomfortable reality: you cannot build a highly coordinated, scaled corporate enterprise out of a population that has lost its relational “glue.”
The capacity to manage and run a complex, multi-person corporate machine capable of employing 500 or more people is not a manual skill learned in a business seminar [companion]. It is an advanced cognitive discipline born at the absolute foundation of human organization—where individuals first learn to move past self-interest and systematically coordinate to meet the mutual, objective needs of the other [companion].
If our micro-relational foundation remains fragmented, transactional, and defensive, our economy will remain a shallow, survivalist sea of one-person enterprises [companion]. To scale our nation, we must identify where this relational glue is generated in our human pipeline, and design our enterprise nodes to inherit it.
2. Dismantling the “Artisan Fallacy”
When youth unemployment spikes, our default policy response is to fund more traditional vocational training—carpentry, plumbing, welding, and basic tailoring [v7]. We believe we are giving our youth “practical skills.” In truth, we are trapping them in the Artisan Fallacy [companion].
In a modern, globally integrated trade environment dominated by automated, high-throughput corridors, training isolated, self-focused craftsmen simply produces more micro-survivalists [companion]. To shift our national productivity line, we must replace individualistic, transactional training with collaborative, systems-level STEM training [v7, companion].
We do not merely need more credentialed graduates; we need to know exactly how many systems engineers, logistics planners, and operations researchers are required at each corridor node, and construct the precise educational pipelines to output them ahead of schedule [88, 91].
3. Operating the Silent Thermostat
For decades, we have been trapped in a false, ideological debate: should the state “run” the economy, or should the state “get out of the way” and let the free market decide?
The STRLDi operating architecture rejects both options. A modern sovereign state cannot run an economy, but it cannot simply “enable” it and walk away either [69, 70].
The state’s true job is to operate like a silent, highly sensitive thermostat—holding macroeconomic, regulatory, and trade conditions with ironclad, military discipline, while a highly coordinated private sector runs the commercial flow of goods and capital [44, 70, 71]. This requires a strict, non-overlapping separation between the public and private control loops, governed by a single systems-engineering rule: you cannot decide what you can see [63, 72].
We must build a shared data interface that allows our public control systems to instantly detect when a critical, 12-week contracted production window is being threatened by external import surges, and trigger automatic, temporary trade discipline—without drowning our private operators in state bureaucracy [73, 74].
The Strategic Hurdles: What We Must Uniquely Solve
To escape this countdown, we must have the courage to ask entirely different, non-linear questions. We must look beyond the standard policy playbooks and confront the three structural blind spots that are quietly stalling our national potential:
1. The Search for “Relational Glue”
Whenever a domestic enterprise fails to scale, our development banks immediately diagnose the problem as a “lack of access to credit” or “poor business planning.” Yet we ignore a far deeper, more uncomfortable reality: you cannot build a highly coordinated, scaled corporate enterprise out of a population that has lost its relational “glue.”
The capacity to manage and run a complex, multi-person corporate machine capable of employing 500 or more people is not a manual skill learned in a business seminar [companion]. It is an advanced cognitive discipline born at the absolute foundation of human organization—where individuals first learn to move past self-interest and systematically coordinate to meet the mutual, objective needs of the other [companion].
If our micro-relational foundation remains fragmented, transactional, and defensive, our economy will remain a shallow, survivalist sea of one-person enterprises [companion]. To scale our nation, we must identify where this relational glue is generated in our human pipeline, and design our enterprise nodes to inherit it.
2. Dismantling the “Artisan Fallacy”
When youth unemployment spikes, our default policy response is to fund more traditional vocational training—carpentry, plumbing, welding, and basic tailoring [v7]. We believe we are giving our youth “practical skills.” In truth, we are trapping them in the Artisan Fallacy [companion].
In a modern, globally integrated trade environment dominated by automated, high-throughput corridors, training isolated, self-focused craftsmen simply produces more micro-survivalists [companion]. To shift our national productivity line, we must replace individualistic, transactional training with collaborative, systems-level STEM training [v7, companion].
We do not merely need more credentialed graduates; we need to know exactly how many systems engineers, logistics planners, and operations researchers are required at each corridor node, and construct the precise educational pipelines to output them ahead of schedule [88, 91].
3. Operating the Silent Thermostat
For decades, we have been trapped in a false, ideological debate: should the state “run” the economy, or should the state “get out of the way” and let the free market decide?
The STRLDi operating architecture rejects both options. A modern sovereign state cannot run an economy, but it cannot simply “enable” it and walk away either [69, 70].
The state’s true job is to operate like a silent, highly sensitive thermostat—holding macroeconomic, regulatory, and trade conditions with ironclad military discipline, while a highly coordinated private sector runs the commercial flow of goods and capital [44, 70, 71]. This requires a strict, non-overlapping separation between the public and private control loops, governed by a single systems-engineering rule: you cannot decide what you can see [63, 72].
We must build a shared data interface that allows our public control systems to instantly detect when a critical, 12-week contracted production window is being threatened by external import surges, and trigger automatic, temporary trade discipline—without drowning our private operators in state bureaucracy [73, 74].
The Operating Blueprint
These questions are not theoretical; they are the core design specifications of an active national operating system. The mathematical models, the precise enterprise-sizing matrices, the STEM student cohort flows, and the physical corridor control loops have already been engineered.
The time for reactive policy programs is over. The countdown has begun, and the ground under our feet will not wait.
To examine the exact, unassailable systems-engineering blueprint designed to transition Botswana to the 3-Trillion track, read the full, newly released STRLDi master briefing:
👉 “THE STRLDi NATIONAL ECONOMIC OPERATING SYSTEM: From Population to Production” [https://sheilasingapore.blog/portfolio/the-strldi-national-economic-operating-system/].
Developed by STRLDi (Strategic Transition Research & Leadership Development Institute). Released into the Public Domain for Sovereign National Transformation.


