
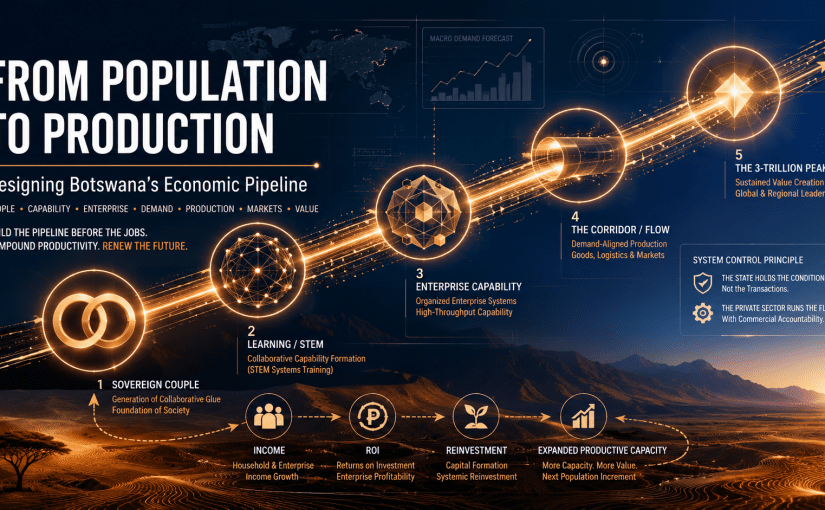
From Population to Production: Designing Botswana’s Economic Pipeline
Published: Aug 30, 2026
📘 INTELLECTUAL PROPERTY & PUBLIC DOMAIN NOTICE
This strategic framework, including the 90:10 National Economic Architecture, the Six Simultaneous Flows Model, and the Economic Pipeline Sizing Methodology, is the proprietary intellectual property of STRLDi (Systems Thinking Research & Leadership Development Institute).
To foster open national dialogue, cooperative structural planning, and the sovereign economic transformation of Botswana, this document is formally released into the Public Domain. Any reproduction, public distribution, or structural implementation of these models must explicitly attribute STRLDi as the original designer of the systems-engineering architecture.
ARTICLE OUTLINE
OPENING — BEFORE THE TITLE: THE QUANTITATIVE PROPOSITION
- The Disruption: Establishes that a growing working-age population is not an automatic asset. Education without a physical and organizational pipeline is a wealth-diluting loop.
- The Strategic Shift: Moves the national inquiry from “how many jobs do we need to create” to “what physical and organizational capacity must exist before the population arrives?”
PART I — THE QUESTION WE HAVE BEEN ASKING
- 1. Persistent Unemployment as a System Constraint: Rejects treating unemployment as a frictional “matching” problem. It is a capacity structural failure.
- 2. Sizing the System Under Migration Stress: Introduces the Statistics Botswana 2022 Census baseline (2.36M) and models the 30% migration stress scenario (creating a 5-year planning load of 3.29M and a 20-year load of 4.05M).
- 3. The Capacity Reversal: Argues that the pipeline’s physical utilities, education intake, and enterprise density must be engineered ahead of time to support the absolute maximum capacity load of the arriving population.
PART II — WHAT KIND OF ECONOMY ARE WE TRYING TO BUILD?
- 4. Scenario A vs. Scenario B Divergence:
- Scenario A: Successful 90:10 employment split, but maintaining Botswana’s existing low-productivity, mineral-dependent structure. Private employment fragments into survivalist services, keeping average household wages at a flat P7,063/mo.
- Scenario B: Integrating the four-country composite benchmark (Japan, Korea, Switzerland, Germany) to systematically transform productivity. Sectoral value moves downstream, multiplying GDP per worker to P776,000 and lifting household wages to an OECD-benchmarked US$5,162 PPP/mo over 20 years.
- 5. The First Nodes: Family, Couple, and Learning Formations:
- The Sovereign Couple Node: Replaces the passive family tree with a collaborative dyad. The relational “glue”—two sovereign partners hyper-focused on meeting the needs of the other outside of static customary norms—acts as the foundational training ground for corporate alignment.
- The STEM Learning Node: Rejects manual TVET artisan training (which produces self-focused sole proprietors). Implements STEM as a collaborative systems-coordination engine, dictating which technical capabilities are built, where, and in what exact quantities.
PART III — WHERE WILL PEOPLE ACTUALLY WORK?
- 6. The Five-Sector Employment Architecture: Maps the 90:10 public-private target across the structural segments (Agriculture 1%, Industry 8.5%, Manufacturing 21%, Services 50.5%, Government 19% under Scenario B).
- 7. Why Agriculture Remains Large: Outlines the dual role of agriculture: high-throughput commercial production and national ecological/soil regeneration, requiring a strict engagement pipeline for at least 20 years.
- 8. Sequenced Manufacturing & Service Redesign: Links agricultural productivity releases to advanced manufacturing. Redesigns services around productive, contract-backed flows (logistics, finance, digital traceability) rather than administrative labor-sponges.
PART IV — PEOPLE DO NOT ENTER AN ECONOMY WITHOUT ORGANISATIONS
- 9. Enterprise Sizing Targets: Outlines the specific density of private firms required to absorb the population load over 5, 10, and 20 years (e.g., targeting 1,000–2,000 production clusters and 100–200 manufacturing firms in H1).
- 10. Sized Skills Pipelines: Replaces general credentials with specialized inputs. Maps out the exact quantities of Sovereign Control Loop Skills (10% state capacity) and Private Operating Flow Skills (90% private absorption) required to manage the system.
PART V — BUILD THE PIPELINE BEFORE THE PRODUCTION
- 11. The Precedence of Demand: Rejects “produce and seek a buyer”. Establishes the three levels of demand (Domestic, Regional, Global) captured as a national economic asset.
- 12. The Demand Definer vs. Corridor Operator: Explains the asymmetric rule: Potential Buyer ↔ Demand Definer ↔ Corridor Operator (never directly pairing a buyer with an uncoordinated farmer). The Corridor Operator converts defined demand into allocatable work.
PART VI — THE GOODS PIPELINE
- 13. Upstream Capacity Preparation: Pre-arranges finance, inputs, biological assets, water grids, and digital telemetry before a seed enters the ground.
- 14. The Goods-Moving Spine: Traces the actual physical pipeline from producer to regional markets, utilizing the Agriculture Corridor Execution Lattice.
PART VII — THE MONEY PIPELINE
- 15. Closing the Financial Loop: Traces revenue from customer payments back to wages, suppliers, and taxes, ensuring capital returns to the farm and the factory floor to run the self-reinforcing reinvestment loop.
- 16. Capital Sizing and Hurdle Rates: Details the P7.700 Trillion cumulative investment envelope under Scenario B. Establishes private hurdle rates (Manufacturing at 15–20%) and introduces the Economic Investment Productivity (EIP) metric (Scenario B achieving 0.54 efficiency vs. Scenario A’s 0.23).
PART VIII — WHO CONTROLS THE SYSTEM?
- 17. The Dual Control Loops: Explains how the public loop (holding the environmental conditions) and the private loop (running the commercial flow) interact with zero functional overlap.
- 18. The “You Cannot Decide What You See” Principle: Establishes dashboard visibility boundaries. Uses the 20,000-tonne tomato gap and the 12-week contracted production window to show how border discipline is triggered automatically by operational data.
- 19. The Shared Data Interface & Operational Decision Rule: Outlines a strict binary gateway where operational failures are routed directly to private operators, and infrastructural bottlenecks are escalated instantly to public ministries, eliminating administrative buck-passing.
FINAL — SEE THE WHOLE SYSTEM
- 20. The Concentric Forest: Synthesizes the entire 20-year demographic, physical, capital, and control loop model. Challenges the national leadership with one final question: Is Botswana prepared to build the pipeline, or will it continue to manage the misery of a stagnant mineral state?
APPENDIX — COMPUTATIONAL PLATFORMS & DERIVATIONS
- Table A: Total Household System Sizing & Base Utility Loads (Water and Power load projections).
- Table B: The Structured Education Platform (Sizing student cohorts from Pre-School to Tertiary STEM).
- Table C: Intergenerational Lifetime Progression (Ages 0 to 54+ mapping the individual’s systemic journey).
REFERENCES & SYSTEMIC FOUNDATIONS
- The Bibliographic Index: Full citations, descriptions, and direct URLs for all 18 of STRLDi’s previous Weebly, LinkedIn, and WordPress diagnostic publications.
THE STRLDi NATIONAL ECONOMIC OPERATING SYSTEM
From Population to Production: Designing Botswana’s Economic Pipeline
BY STRLDi (SYSTEMS THINKING RESEARCH & LEADERSHIP DEVELOPMENT INSTITUTE)
Released into the Public Domain for National Structural Transformation.
ARTICLE SUMMARY
This strategic blueprint details the STRLDi National Economic Operating System—an unassailable plan for transforming Botswana’s economy from a mineral-dependent, state-dominated structure into a high-productivity, self-reproducing marketplace. Rather than treating persistent unemployment as a mere job-matching or educational problem, STRLDi outlines an integrated systems-engineering architecture built ahead of the arriving population load.
At the core of this system is the 90:10 National Economic Architecture, which systematically absorbs ninety percent of the working-age population into highly productive private enterprise while retaining ten percent within a lean, highly capable sovereign state loop. To achieve this, the model maps an individual’s lifetime progression through key organizational nodes—starting with the relational glue of the sovereign couple, moving through a collaborative STEM-systems learning pipeline, and culminating in demand-backed, corridor-aligned enterprises [22, companion]. By defining precise, non-overlapping public and private control loops, the STRLDi framework ensures Botswana can sustain an 11-fold multiplication of its productive capacity, lifting real household wages to OECD-benchmarked standards.
A growing population does not automatically become an economic asset simply because people are educated or because the government creates temporary employment programmes. Indeed, treating unemployment as a mere labour-market mismatch is a fundamental systems failure.
The urgent and uncomfortable challenge facing Botswana’s leadership is a structural and organizational one: What must a nation deliberately build so that its changing population can continuously enter productive economic activity? To move from the current mineral-dependent “1-trillion track” onto the highly productive, diversified “3-trillion track”, the national leadership must shift from creating public-sector jobs to designing and constructing an integrated economic pipeline before the jobs can exist.
To understand the profound scale of this transition, we must look at Botswana’s actual baseline. According to the official national accounts from Statistics Botswana, the baseline GDP stands at P263.1 Billion. Transitioning to the STRLDi Scenario B trajectory target of P3.143 Trillion at Year 20 represents an 11.9-fold structural multiplication of the nation’s productive capacity.
This transition is not about marginal expansion; it is a complete structural rebuild. It requires transforming Botswana from a $20 billion USD mineral exporter into a highly diversified, high-value $230 billion USD regional economic hub, benchmarked against the high-productivity private architectures of Japan, Korea, Switzerland, and Germany.
Key Leadership Insight: Botswana cannot solve persistent unemployment by creating more programmes, training more people, or expanding government payrolls. It must deliberately construct an economic pipeline in which future population becomes productive capacity, productive capacity is connected to defined demand, goods move through organised corridors, and resulting money continuously returns to production. The government’s sovereign role is to hold the system’s conditions; the private sector’s role is to run the flow.
Prepared for the National Leadership of Botswana
PART I — THE QUESTION WE HAVE BEEN ASKING
1. Persistent Unemployment is not Simply a Jobs Problem
For decades, conventional policy has treated unemployment as a traditional labour-market matching problem, structured around the linear sequence: people → education → job search → employment. In this view, if people remain unemployed, the system must need more training programmes, more job-matching services, or direct government job creation. This response is a fundamental category error.
Botswana’s persistent unemployment is not a frictional failure of job-matching; it is a system-level architectural failure. The true question national leadership must answer is: Where, inside the current economic structure, will but the growing working-age population actually become productive? Shifting the focus from ’employment creation’ to ‘economic architecture’ forces us to design the physical and commercial capacity to absorb people into the economy productively.
2. Population Changes the Size of the Economic System
Population growth, when combined with inward migration, represents a continuously changing load on the national system. It dynamically dictates the required size of families, schools, enterprises, infrastructure, and capital structures. National design must incorporate these shifts proactively rather than reacting to demographic pressure. Crucially, migration must be built directly into the planning framework. Botswana’s 2022 census revealed that 722,412 people, or 30.6% of the resident population, are lifetime migrants. Therefore, the 30% migration planning assumption is not an arbitrary stress-test scenario; it is a rigorous reflection of observed demographic reality. The economic pipeline must be designed to accommodate the total population that will participate in the economy, rather than merely today’s resident citizens.
3. The Question is not How Many Jobs, but How Much Productive Capacity
Instead of asking ‘How many jobs do we need?’ which leads to superficial and unsustainable public sector job expansion, leadership must ask: What organizational and productive capacity must exist to absorb the population as it arrives? Government cannot remain the principal absorber of the working population. To build a robust and self-sustaining economy, the national system must work toward an architecture of 90% private/enterprise-based productive employment and 10% public employment. The 10% public allocation is not an employment goal; it represents the lean, highly capable state capacity required to secure and facilitate the 90% private flow.
4. Family, Learning, and Enterprise are the First Organisation Nodes
To prevent the economic pipeline from suddenly starting at the ‘farm gate’ or factory floor, we must recognize that people enter the productive system through sequential organization nodes: family → learning → capability → enterprise → production. Families are not merely a demographic statistic; they are the primary organization node of the national system. From families, children transition into learning structures, which must be tightly coupled to the future occupations and productive systems the country actually intends to build. Enterprises represent the final node, providing the physical and legal vehicles within which capability is transformed into output and sustainable household income.
PART II — WHAT KIND OF ECONOMY ARE WE TRYING TO BUILD?
5. Two Possible Trajectories: Scenario A vs. Scenario B
Botswana stands at a historic crossroads. The national leadership cannot resolve persistent unemployment by creating more training programs, funding more micro-grants, or expanding government payrolls. Treating unemployment as a simple frictional matching problem between an individual and a “job” ignores the necessary institutional, organizational, and spatial capacity required to absorb them. Instead, the national leadership must choose between two fundamentally divergent paths: continuing to manage a mineral-dependent state, or engineering a highly productive, self-sustaining national system.
- Scenario A (The 1-Trillion Track): This trajectory represents the path of retrospective extrapolation. It plans by looking backward, maintaining Botswana’s historical dependence on raw mineral extraction, low-productivity agricultural structures, and public-sector employment absorption. Under Scenario A, when the population grows, the state attempts to absorb the labor force through public administration and temporary programs. Because productivity per worker remains stagnant, this path dilutes national wealth, suppresses real wages, and leaves the country trapped on a low-income trajectory.
- Scenario B (The 3-Trillion Track): This trajectory represents a deliberate systems-engineering intervention to transform national productivity, enterprise density, and collaborative capability. Scenario B explicitly rejects holding Botswana at today’s low productivity levels. Instead, it models the entire economy toward the productive capability of the four-country composite benchmark, forcing the physical, educational, organizational, and capital pipelines to run ahead of the arriving population load.
To engineer Scenario B, the national system must not be sized for static or hopeful forecasts. It must be built to support the absolute maximum capacity load of the population, including heavy migration stress. Statistics Botswana’s 2022 census shows the resident population stands at 2,359,609. Crucially, the census reveals that 722,412 people, or 30.6% of the resident population, are lifetime migrants. Therefore, the 30% migration stress scenario is not an arbitrary forecast; it is a highly realistic planning envelope that the economic pipeline must be engineered to support.
Table 1: Population Load and Migration Stress-Test Planning Envelope
This envelope represents the absolute capacity load the national system must be engineered to absorb before the population arrives.
| Planning Horizon | Local Population *(1.4% Annual Growth)* | Migration Stress Scenario *(+30% of Local)* | Total Sized Planning Population *(The Sizing Load)* |
|---|---|---|---|
| Base Year (2022) | 2.36 Million | — | 2.36 Million |
| 5 Years (Horizon 1) | 2.53 Million | 0.76 Million | 3.29 Million |
| 10 Years (Horizon 2) | 2.71 Million | 0.81 Million | 3.53 Million |
| 20 Years (Horizon 3) | 3.12 Million | 0.93 Million | 4.05 Million |
6. Scenario B Changes Productivity, Not Merely Employment
Scenario B is not today’s Botswana multiplied by a larger population; it is an entirely different productive system. Under Scenario A, employment is increased without changing the capital intensity or the actual output per worker, keeping the country trapped on a low-wage trajectory. Under Scenario B, the national system systematically lifts real household wages by matching the productivity of the four-country composite benchmark.
Rather than asking local educational institutions what degrees they happen to produce and trying to “match” graduates to a stagnant job market, Scenario B works backward from the benchmark’s productivity requirements to dictate STEM education, capital intensity, and enterprise density:
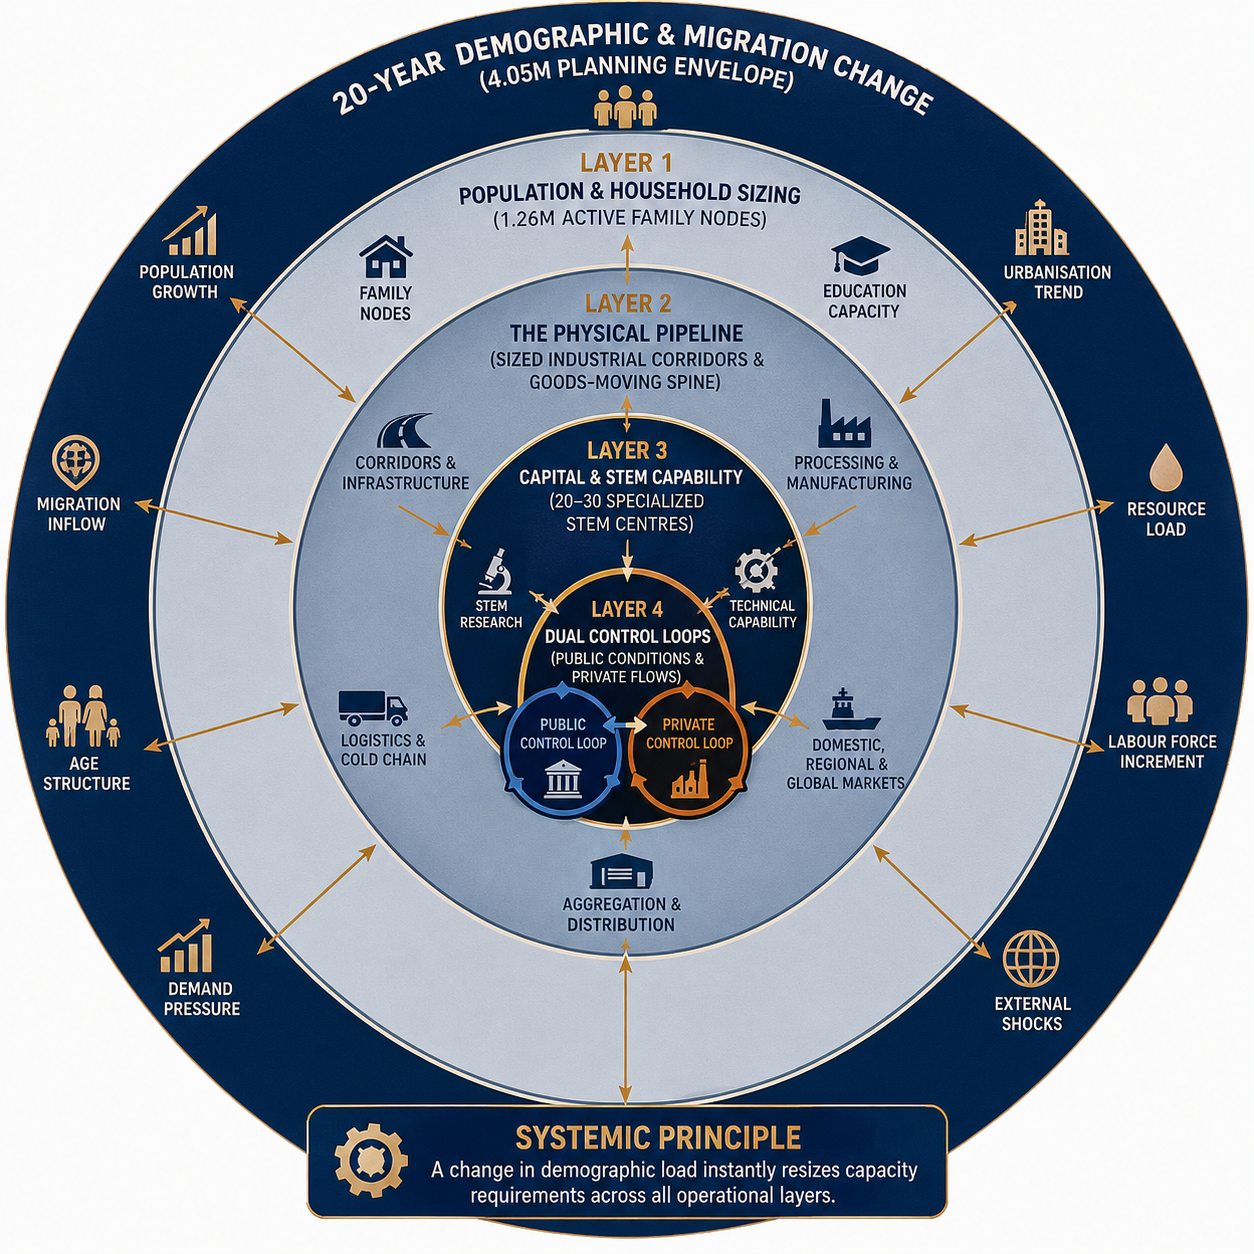
The Strategic Logic of the Four-Country Composite
To prove that a highly functioning, advanced economy does not require the state to employ the majority of its population, Scenario B benchmarks against four nations operating remarkably close to a 90:10 operating balance:
- Japan (General-Government Employment: ~4.55% of Total Employment / ~95.45% Non-Government): Japan represents the absolute separation of government capacity from government employment. It demonstrates that a highly sophisticated, high-value manufacturing, logistics, and technology hub can be run with an incredibly lean public footprint. It proves that the engine of national wealth is sustained by large, highly coordinated private corporations working in tandem with extensive, collaborative SME networks.
- Korea (General-Government Employment: ~8.83% of Total Employment / ~91.17% Non-Government): Korea represents the most critical lesson for Botswana’s pipeline. Its highly productive private economy did not simply emerge because the government withdrew. It was systematically constructed through a deliberate pipeline sequence of education \(\rightarrow\) industrial capability \(\rightarrow\) manufacturing \(\rightarrow\) exports \(\rightarrow\) technology \(\rightarrow\) global markets.
- Switzerland (General-Government Employment: ~9.0% of Total Employment / ~91.0% Non-Government): Switzerland demonstrates that a 90% non-government economy must not rely on manufacturing alone. It shows how private employment must be distributed across a highly specialized, diverse enterprise ecosystem, including advanced manufacturing, precision engineering, financial and professional services, logistics, and global trading.
- Germany (General-Government Employment: ~11.13% of Total Employment / ~88.87% Non-Government): Germany proves that a productive private sector does not require giant, monolithic corporations. Instead, its economic engine is sustained by its Mittelstand—thousands of highly specialized, mid-sized firms embedded in global supply chains.
Defining the 90:10 National Economic Architecture
Based on this international evidence, Scenario B formally rejects a simple “90% private employment” statistic, replacing it with a sophisticated structural operating system:
The 90:10 National Economic Architecture: Approximately 90% of the working-age population should be economically absorbed through private and commercially productive enterprise, while approximately 10% is retained within the public institutional system required to govern, regulate, provide public goods, and steward national capacity.
Table 2: Comparative Architecture of Scenario A vs. Scenario B
This comparison maps the core structural, operational, and philosophical differences between the two economic tracks.
| Architectural Dimension | Scenario A (The 1-Trillion Track) | Scenario B (The 3-Trillion Track) |
|---|---|---|
| Planning Paradigm | Retrospective Extrapolation: Plans by looking backward at historic domestic ratios and trends. | Capacity Anticipation: Sizes physical, educational, and spatial pipelines before the population arrives. |
| The Role of STEM | Educational Elective: Treated as a general school subject with no direct connection to corridor throughput. | Systemic Engine: The mathematical starting point to modify the slope of national productivity. |
| Employment Driver | State Payroll & Programs: Direct government absorption and temporary programs. | Enterprise Multiplication: Rapid growth of highly productive, private-run firms. |
| State vs. Enterprise Ratio | High state share; government remains principal employer of last resort. | Strict 90:10 National Economic Architecture. |
| Education Connection | Linear Matching: People \(\rightarrow\) Education \(\rightarrow\) Job Search \(\rightarrow\) Employment. | Pipeline Sourcing: Sized STEM/technical capabilities built directly for industrial corridors. |
| Primary Economic Focus | Low-productivity raw commodity exporting. | High-value, regional value-adding corridors. |
7. People Do Not Enter an Economy at the Farm Gate: The First Nodes
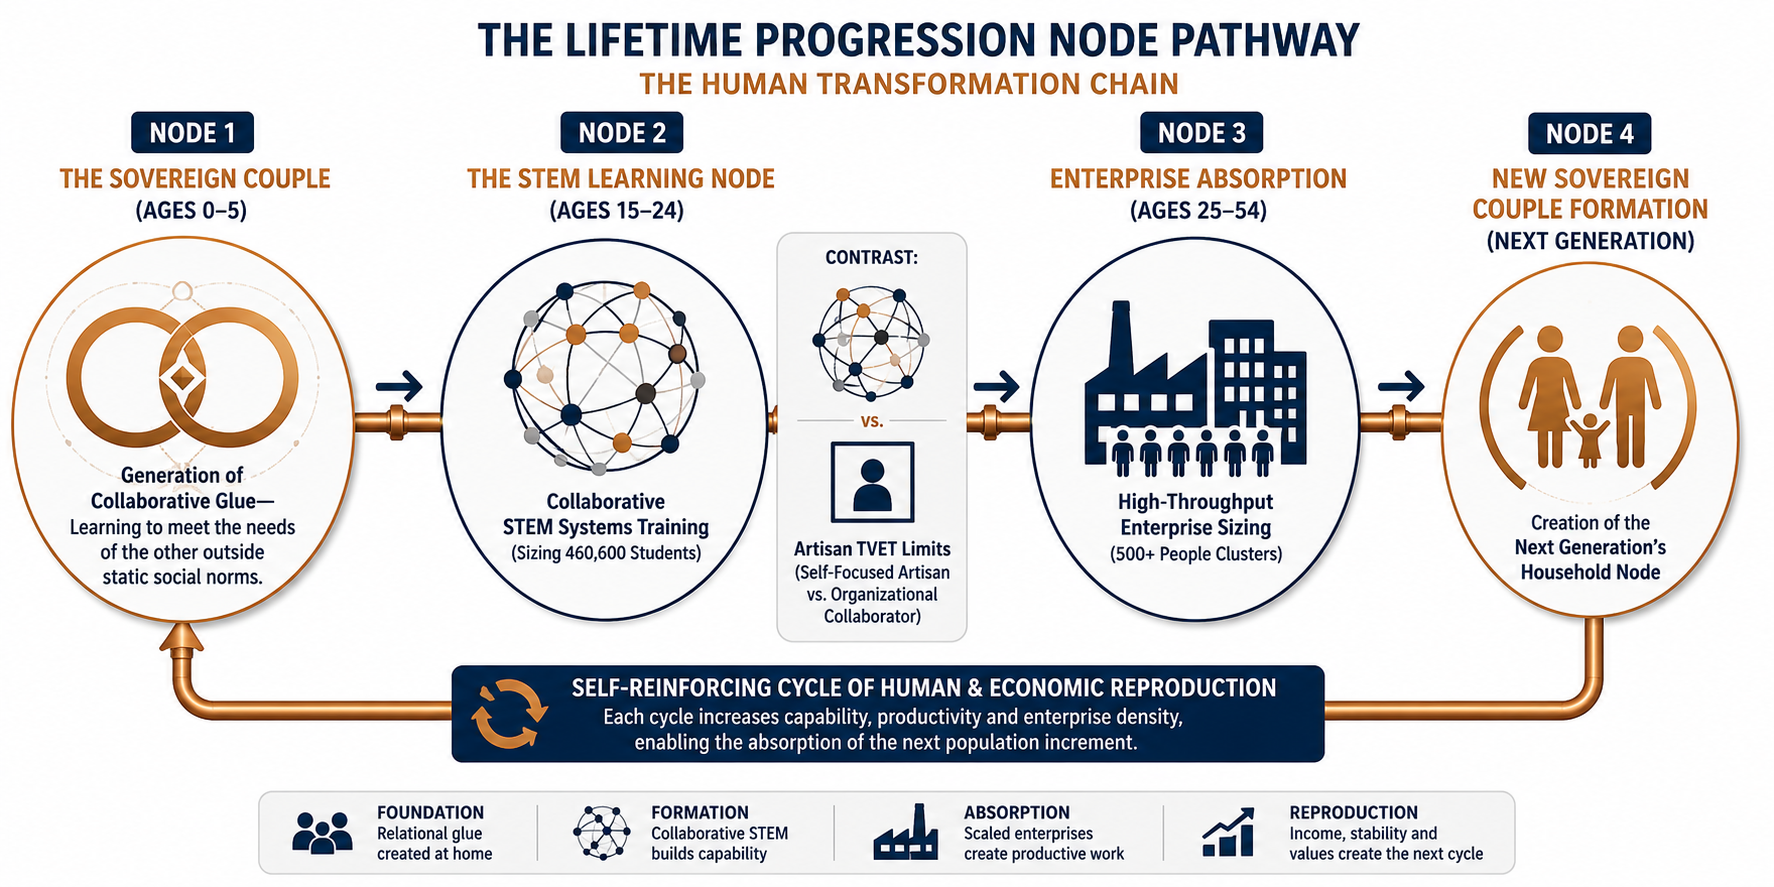
To prevent the economic pipeline from suddenly appearing at the “farm gate” or the “factory door,” national leadership must recognize that people enter the productive system through sequential, structured organization nodes: couple \(\rightarrow\) family \(\rightarrow\) learning \(\rightarrow\) capability \(\rightarrow\) enterprise \(\rightarrow\) production \(\rightarrow\) income.
[Couple Alignment Node] ──> [Family/Household Node] ──> [Learning Node (STEM)] ──> [Capability] ──> [Enterprise Sizing] ──> [Productive Flow]
Node 1: Couple Alignment & Household Viability (The Relational Glue)
Under Scenario A, families are treated merely as a passive demographic statistic. This forces rural households to send their most capable members to Gaborone to earn wages, which are then remitted back to the village simply to subsidize a low-productivity, unviable farm.
Scenario B establishes that the primary unit of the economic system is not the “family” (which is controlled by static traditional norms), but the sovereign couple.
The couple unit represents two sovereign humans choosing to learn how to build a collaborative alignment outside of those social norms. The core leverage in this node is the quality of the relationship within the couple dyad, where each partner pays attention to meeting the needs of the other as opposed to the self.
This relational glue—the shift from self-focus to mutual-need meeting—is the foundational training ground for the cooperative behaviors required to build modern corporate structures capable of employing 500 or more people. Without this early capacity to collaborate across complex boundaries, individuals cannot run or sustain scaled enterprises.
To make this viable, the economic pipeline is engineered to bring money directly into agriculture. By connecting rural couple units to high-value, contract-backed corridor agreements, agriculture generates sufficient, predictable income internally. The family farm becomes a self-sustaining, high-yielding commercial asset, keeping the household unit intact, allowing rural capital to compound, and fostering the collaborative, high-trust domestic environment required to build enterprise capacity.
- Base Year (2022) Family Node Capacity: 655,446 active family nodes (derived from a census baseline population of 2,359,609 divided by an average household size of 3.6).
- 5-Year Horizon (H1) Family Node Target: 940,000 active family nodes (modeled at an average household size of 3.5 to absorb 3.29 million people). This represents a systemic expansion of 284,554 new couple-led family units that must be structurally integrated into localized commercial production corridors.
- 10-Year Horizon (H2) Family Node Target: 1,038,235 active family nodes (modeled at an average household size of 3.4 to absorb 3.53 million people).
- 20-Year Horizon (H3) Family Node Target: 1,265,625 active family nodes (modeled at an average household size of 3.2 to absorb 4.05 million people).
Node 2: Learning Formation — STEM-Driven Systems Capacity vs. TVET Artisan Limits
Under Scenario A, education follows a retrospective path, producing generic qualifications and relying on the public sector to absorb the surplus graduates. When technical training is attempted, it is funneled into traditional TVET (Technical and Vocational Education and Training). TVET, however, focuses almost exclusively on an individual’s manual skills as an isolated artisan or craftsman (a sole proprietor). It fails to build the collaborator capable of operating within a scaled organization that hires 500 people.
Scenario B establishes that the learning node must be a STEM-driven systems pipeline. STEM is not treated as a collection of difficult academic subjects, but as the direct capacity modifier of national productivity. It is the non-negotiable cognitive training required to understand systems, coordinate complex data interfaces, run automated cold chains, and manage multi-person logistics. The education pipeline is structured backward from the future occupations the country actually intends to build, dictating which STEM capabilities are built, where, and in what exact quantities:
- Sized Learning Infrastructure Capacity (STEM Centres): To transition away from isolated artisan crafts, Botswana must construct and operate 5 to 10 specialized Industrial and Technical STEM Training Centres within the next 5 years. This must scale to 10 to 20 centers in 10 years, and 20 to 30 active centers in 20 years to anchor the regional corridors.
- Sized System Control Specialists (The Systems Collaborative Output): The system requires the systematic formation of 200 to 400 advanced pipeline and control specialists (systems engineers, operations researchers, supply-chain technologists, and GIS analysts) in the first 5 years. This must scale to 500 to 1,000 specialists in 10 years, and 1,500 to 3,000 in 20 years to run the public control loop and the private operating corridors.
- Sized National Demand Sourcing Loop: To drive this educational pipeline, the country requires 1 National Demand Intelligence System and 16 to 20 active district demand models to continuously align student enrollment with future industrial corridor volumes.
8. Botswana Cannot Erase the Structure It Inherited
A realistic national strategy cannot treat the existing economy as a blank slate; it must integrate and transform the structure it inherited. Botswana’s historical reliance on mining must be integrated into the transition, acknowledging its GDP and tax contributions.
However, mining cannot remain the structural answer to national employment. To prevent mining (and its high-capital, low-labor footprint) from monopolizing land, capital, and attention, Scenario B establishes a strict 15% industry employment ceiling. This ceiling bounds the entire industrial sector—encompassing mining transformation, water, energy, construction, and infrastructure. By capping the labor absorption of this heavy industry block, the national system forces the progressive construction of reinvestable surplus and productive capacity in other non-mineral sectors, such as commercial agriculture, value-added manufacturing, and productive services.
Table 3: Bounded Industry & Infrastructure Structure (Scenario B)
The allocation of labor and reinvestment under the 15% structural ceiling.
| Sub-Sector | Historical / Scenario A Role | Bounded Scenario B Role & Transformation |
|---|---|---|
| Mining & Mineral Transformation | Primary GDP driver; raw ore export with minimal local value retention. | Transitioned to local beneficiation and raw material sourcing for domestic manufacturing. |
| Water & Energy | Reactive infrastructure built to meet existing municipal shortages. | Sized and routed proactively to run ahead of planned industrial/agricultural corridors. |
| Construction & Infrastructure | Public-financed projects focused primarily on administrative and public facilities. | Shifted toward building cold chains, transport corridors, logistics hubs, and processing clusters. |
| National Sizing Ceiling | Unbounded; fluctuates unpredictably with diamond demand cycles. | Capped at a strict 15% maximum of total sector employment to force non-mining diversification. |
9. Sizing the Enterprise Formation Target
To transition away from government payroll absorption, the economic pipeline must deliberately generate new, highly productive private firms. The following target matrix outlines the scale of enterprise creation required over 5, 10, and 20 years to successfully absorb the total planning population under the 30% migration stress scenario.
Table 4: Target Enterprise Sizing and Formation Horizons (Scenario B)
Systems design targets required to transition the workforce into 90% private-sector employment.
| Enterprise Category | 5-Year Target *(Build the Spine)* | 10-Year Target *(Scale the Spine)* | 20-Year Target *(Mature Hub)* |
|---|---|---|---|
| Production Enterprises / Clusters | 1,000 – 2,000 | 2,500 – 4,000 | 5,000 – 8,000 |
| Processing Enterprises | 150 – 300 | 400 – 700 | 800 – 1,500 |
| Manufacturing Enterprises | 100 – 200 | 250 – 500 | 600 – 1,000 |
| Logistics Enterprises | 150 – 300 | 350 – 700 | 700 – 1,500 |
| Export Enterprises | 100 – 200 | 250 – 500 | 500 – 1,000 |
| Technology / Data Enterprises | 50 – 100 | 150 – 300 | 300 – 600 |
PART II (CONTINUED) — THE DIVERGENT TRACKS: QUANTIFYING SCENARIO A VS. SCENARIO B
10. Letting the Numbers Carry the Reasoning
To understand the trajectory of national transformation, the national planning team must reject speculative targets and analyze the economy as a functioning, quantitative machine. Shifting 90% of the working population into private and commercially productive enterprise is an essential organizational target, but if those private enterprises operate at today’s low-productivity levels, national wealth remains stagnant.
The divergence between the two tracks is mathematically mapped below, using Statistics Botswana’s official 2024 accounts as our baseline and the four-country composite (Japan, Korea, Switzerland, and Germany) as our structural benchmark.
Table 5: The Five-Sector Structural Transformation Model
This master table contrasts the long-term economic outcomes of Scenario A (extrapolating Botswana’s existing low-productivity, public-dominated structure) with Scenario B (systematically converging to the high-productivity, manufacturing-and-services composite benchmark) under a strict 90:10 National Economic Architecture.
| Strategic Economic Indicator | 2024 Botswana Baseline | Scenario A — 5 Year | Scenario A — 20 Year | Scenario B — 5 Year | Scenario B — 20 Year |
|---|---|---|---|---|---|
| Sized Population Load | 2.36 Million | 3.29 Million | 4.05 Million | 3.29 Million | 4.05 Million |
| National Gross Domestic Product | P263.1 Billion | P369.1 Billion | P1.018 Trillion | P638.2 Billion | P3.143 Trillion |
| Agriculture Share of GDP | 1.7% | 1.7% | 1.7% | 1.0% | 1.0% |
| Heavy Industry & Infrastructure Share | 23.8% | 23.8% | 23.8% | 8.5% | 8.5% |
| Manufacturing (Value-Adding Engine) | 5.5% | 5.5% | 5.5% | 21.0% | 21.0% |
| Private & Productive Services Share | 37.3% | 37.3% | 37.3% | 50.5% | 50.5% |
| Government & Public Administration Block | 31.7% | 31.7% | 31.7% | 19.0% | 19.0% |
| Gross Value Added (GVA) per Person | P112,000 | P112,000 | P251,000 | P194,000 | P776,000 |
| Average Monthly Household Wage | P6,093 | P7,063 | P11,005 | ~US$1,291 PPP *(~US$15.5k PPP/yr)* | ~US$5,162 PPP *(~US$62k PPP/yr)* |
| Private Sector Employment Share | 90% | 90% | 90% | 90% | 90% |
| Public Sector Employment Share | 10% | 10% | 10% | 10% | 10% |
| Cumulative Transformation Investment | — | P461 Billion | P3.290 Trillion | P693 Billion | P7.700 Trillion |
Note on Modeling Groupings: The baseline 2024 sector shares are derived directly from the national accounts of Statistics Botswana. The Government Block (31.7%) aggregates public administration, health, education, and national taxes to reconcile to GDP. Scenario B monthly wages are presented in Purchasing Power Parity (PPP) adjusted terms to accurately reflect international household consumption standards, as compiled by the OECD.
11. The Structural Analysis: Why the Trajectories Diverge
When the national leadership reviews this model, the stark divergence in outcomes requires immediate conceptual clarity:
The Sectoral Stagnation of Scenario A
Under Scenario A, Botswana achieves the organizational target of a 90:10 public-private workforce split, but fails to change the underlying structure of the economy. The country remains heavily reliant on raw mining exports for its national revenue, leaving manufacturing stagnant at 5.5% of GDP.
Consequently, even as the private sector absorbs the arriving workforce, it does so in low-productivity, survivalist service roles. Because the productivity per worker (GVA) remains flat at P112,000, average household wages rise minimally to only P7,063 in five years. This path proves that a “private-sector led economy” without structural change simply redistributes poverty.
The Multiplier Engine of Scenario B
Scenario B systematically transforms national productivity by shifting capital intensity downstream from primary resources into value-added manufacturing and advanced commercial services. Agriculture, while remaining commercially large and active for land regeneration, contracts as a nominal share of GDP to 1.0% as high-throughput processing, logistics, and industrial food manufacturing expand. Manufacturing increases dramatically from P14.5 billion today to P134 billion in five years, scaling to P660 billion at maturity.
This massive structural shift alters the math of the entire system. Because capital and STEM capabilities are injected directly into the physical corridors, GDP per person multiplies seven-fold to P776,000, enabling the average monthly household wage to scale to an OECD-benchmarked US$5,162 PPP. Rising productivity drives enterprise profitability, which generates the capital required to run the self-reinforcing reinvestment loop.
12. Sizing the Capital-Building Phase (Scenario B)
This level of structural transformation cannot be funded through routine government budgets or public debt. It requires a massive, disciplined mobilization of capital, with a heavy capital-building phase initially:
- Gross Fixed Capital Sizing: Scenario B models a heavy upfront capital push, setting gross fixed investment at 30% of GDP in the first five years, 28% in Years 6–10, and 25% thereafter as the physical corridors reach operational maturity.
- The Cumulative Investment Envelope: Over the 20-year transformation cycle, the cumulative capital requirement scales to P7.700 trillion. Crucially, the state does not supply this capital. The vast majority is commercially and privately financed, backed by secured forward buyer contracts. The state’s sovereign role is to fund the public control systems, localized bulk utility routing, and targeted risk-reduction mechanisms.
Table 6: Allocation of Scenario B Cumulative Investment
This matrix outlines how transformation capital must be strategically distributed across the sectors to construct the high-throughput pipeline.
| Sector Block | Investment Allocation | Core Infrastructure & Physical Assets Targeted |
|---|---|---|
| Manufacturing | 35% | Regional processing hubs, specialized factories, automated packaging facilities, industrial parks, and cold-chain logistics. |
| Heavy Industry & Utilities | 25% | Power grid routing, water-capture infrastructure, logistics zones, and mining technology upgrades. |
| Private Services | 25% | Specialized logistics fleets, ICT networks, digital financial payment systems, and R&D facilities. |
| Sovereign Government | 10% | National Economic Control Centres, regulatory data platforms, STEM classroom networks, and public health. |
| Agriculture | 5% | Land-use zoning, soil regeneration, localized borehole water-grids, and primary collection nodes. |
13. Investment Productivity vs. Speculative Returns
To protect the system’s capital and maintain the trust of international investment partners, Scenario B rejects guaranteed or speculative ROIs, replacing them with strict private-sector investment hurdle rates. It also introduces a sovereign metric: Economic Investment Productivity (EIP), which measures how much additional annual GDP is generated per unit of cumulative investment.
- The Hurdle Rates (Commercial Targets): Because manufacturing is the engine that converts raw agricultural outputs into high-value regional goods, it carries the highest hurdle rate of 15–20%. Technology and digital platforms target 15–25%, services 14–18%, and primary agriculture operates at 10–14%. Government infrastructure operates under a zero-financial ROI mandate, judged purely by its economy-wide productivity return.
- The Investment Productivity Proof (EIP):
- In Scenario A, over five years, P461 billion of uncoordinated investment produces only P106 billion of additional annual GDP, yielding a low EIP of 0.23.
- In Scenario B, over five years, P693 billion of coordinated, corridor-aligned investment yields P375 billion of additional annual GDP, delivering a highly efficient EIP of 0.54.
This proving-point demonstrates that when investment is funneled into a highly synchronized, demand-backed pipeline, every unit of capital invested becomes dramatically more productive, providing the mathematical justification for the transition to the 3-trillion track.
PART III — WHERE WILL PEOPLE ACTUALLY WORK?
14. The Five-Sector Employment Architecture
To transition the country off the mineral-dependent 1-trillion track and onto the highly productive 3-trillion track, national leadership must implement a rigorous five-sector employment architecture. This architecture establishes the exact structural boundaries within which the labor force is distributed across Agriculture, Industry, Manufacturing, Services, and Government. It is built directly upon the 90:10 private-to-public operating system, which dictates that 90% of the working population must be absorbed by productive, enterprise-based employment, while the public sector is strictly limited to 10%.
The 10% state allocation is not a job-creation target; it represents the lean, highly specialized capacity required to secure and facilitate the 90% private-sector flow. Under this model, the state does not run the economy, but rather holds the system’s structural conditions.
To prevent planning from lapsing into speculative policy wishes, Scenario B enforces strict, mathematically bounded allocation rules across all five sectors, forcing the physical and educational pipelines to run ahead of the population load.
Table 7: Systemic Sector Allocation Framework (Scenario B)
This structural matrix defines the employment boundaries and labor allocation rules required to maintain the 90:10 enterprise-state architecture.
| Industrial / Economic Sector | Structural Allocation Rule (Scenario B) | Primary Sourcing & Rationale |
|---|---|---|
| Agriculture | \(\ge\) 30% Minimum of the total working population. | High-labor commercial agriculture, land regeneration, water capture, and regional food export. |
| Industry & Infrastructure | \(\le\) 15% Maximum Ceiling of the total working population. | Bounded to encompass mining transformation, water, energy, construction, and infrastructure to prevent diamond dominance. |
| Government / Public Sector | \(\le\) 10% Maximum Cap of the total working population. | Restricted to essential sovereign functions (OP, p-NEC, MOLA, Trade, etc.); strictly barred from absorbing surplus labor. |
| Manufacturing | Dynamic Growth Target (grows sequentially over the 20-year horizon). | Absorb labor released by agricultural productivity gains, fueled by intensive STEM and technical formation. |
| Productive Services | Productive Support-Only Allocation (sized to match physical throughput). | Limited to corridor logistics, finance, ICT, market intelligence, professional services, and distribution. |
15. Why Agriculture Remains Large
Conventional economic theory suggests that as a country’s productivity rises, agriculture should rapidly shrink as a share of total national employment. Scenario B explicitly rejects this assumption for Botswana. For at least the next 20 years, agriculture must remain a major productive system, absorbing a 30% absolute minimum of the working population.
This deliberate architectural choice is driven by a dual-system requirement: economic production and ecological regeneration. Botswana possesses massive land resources that are not merely unused, but actively require restoration. Until the land is regenerated, the ecological system is restored, and intensive water capture is structurally integrated, the country requires a high density of people engaged directly in productive commercial agriculture.
To achieve this, the national system must transition away from low-productivity subsistence farming. This requires a sequenced development trajectory that scales up from initial system formation to a mature, high-value commercial export network.
Table 8: Agricultural Trajectory and System Sizing Horizons (Scenario B)
The structural evolution of Botswana’s agricultural sector from land regeneration to a regional commercial hub.
| Development Horizon | Core Systemic Focus | Operational Infrastructure & Sizing Needs |
|---|---|---|
| Years 0–5 *(Build the Spine)* | System Formation & Land Restoration. | Establish rainfall/water capture, soil regeneration, and drought-resilience models. Build first production corridors, SOUs, and commercial contracts. |
| Years 5–10 *(Scale the Spine)* | Commercial Aggregation & Corridor Integration. | Connect producers directly to Corridor Operators. Expand cold chain networks, regional buyer contracts, and localized processing capacity. |
| Years 10–20 *(Compound the System)* | Mature High-Value Export & Ecological Balance. | Transition agriculture into the primary feedstock for advanced food manufacturing, packing, and global trade networks. |
16. Why Manufacturing Rises Later
In a properly engineered economic pipeline, manufacturing cannot be conjured overnight through subsidies or administrative decrees. The rise of manufacturing must be a sequenced structural transition. Under Scenario B, labor and capital migrate into manufacturing progressively as three prerequisite conditions are met: the expansion of STEM technical capabilities, the progression of land regeneration, and the continuous rising productivity of the agricultural sector.
As agricultural productivity per worker increases, it systematically releases labor while generating the high-margin raw feedstocks required for domestic value addition. Agriculture feeds directly into downstream processing, food manufacturing, packaging, and high-value export products.
This prevents Botswana from falling back into the raw commodity export trap that characterizes the 1-trillion track. By linking STEM formation directly to industrial corridors, the workforce transitions naturally into high-value manufacturing roles as the capacity becomes commercially active.
17. Why Services Must Be Understood Differently
A common symptom of the 1-trillion track is the ballooning of a low-productivity “services” sector, which is often created artificially simply to absorb surplus labor. In the era of online retail, digital identity, and automated systems, Botswana does not need—and cannot afford—unlimited numbers of people trapped in traditional, low-value service activities.
Under Scenario B, services are strictly redesigned to support productive physical flows. Every service enterprise and role must be built around the corridor’s needs: logistics, trade finance, ICT, market intelligence, professional services, distribution, and research.
Crucially, this systemic boundary applies to the state itself. The national leadership must reject the temptation to manufacture public-sector employment in policing, legal, judicial, and other administrative functions simply because people need jobs. Public employment must be sufficient to perform the legitimate, lean functions of the state—never to act as a sponge for structural unemployment.
PART IV — PEOPLE DO NOT ENTER AN ECONOMY WITHOUT ORGANISATIONS
18. The Organisations Required to Absorb the Population
A population does not magically enter an economy as individual, isolated actors; people enter the productive system through sequential, structured vehicles: family → learning → capability → enterprise → production. Treating unemployment as a direct matching problem between an individual and a “job” ignores the necessary institutional architecture required to absorb them. Population absorption is fundamentally an organisational design problem.
To prevent the economic pipeline from collapsing under demographic shifts or migration stress, the national system must pre-build the organisational nodes that guide people from household formation to active, high-value production. The table below outlines the specific operational nodes and control structures required to manage, monitor, and scale Botswana’s economic pipeline over 5, 10, and 20-year horizons.
Table 9: Sizing the Organisational Node Network (Scenario B Capacity Envelopes)
These planning-envelope quantities define the required density of active, system-wide operational and control nodes.
| Capacity / Node Category | 5-Year Target *(Build the Spine)* | 10-Year Target *(Scale the Spine)* | 20-Year Target *(Mature Hub)* |
|---|---|---|---|
| National Economic Control Centres | 1 | 1 | 1 |
| Major Corridor Control Nodes | 4 – 6 | 8 – 12 | 12 – 20 |
| Sector Pipeline Cells | 10 – 15 | 20 – 30 | 30 – 50 |
| Major Production Corridors | 5 – 8 | 10 – 15 | 15 – 25 |
| Processing & Manufacturing Clusters | 10 – 20 | 25 – 50 | 50 – 100+ |
| Major Logistics & Aggregation Nodes | 15 – 30 | 40 – 75 | 75 – 150 |
| Export-Capable Commercial Operators | 50 – 100 | 150 – 300 | 300 – 600+ |
| Demand Intelligence Nodes | 16 – 20 | 20+ | 20+ |
| Industrial & Technical Training Centres | 5 – 10 | 10 – 20 | 20 – 30 |
| Advanced Pipeline & Control Specialists | 200 – 400 | 500 – 1,000 | 1,500 – 3,000 |
19. Skills Must Follow the Productive System
National leadership must halt the retrospective educational paradigm that asks what qualifications current institutions happen to produce, and instead demand what specific capabilities the economic pipeline requires five, ten, and twenty years from now. Education and training must be systematically designed backward from the pipeline’s operational requirements.
Under Scenario B, the division of labor between the 10% public control loop and the 90% private flow requires distinct, highly specialized skill sets. This ensures that public administrators have the systems engineering capacity to maintain the system’s conditions, while private operators possess the technical expertise to drive commercial throughput.
Table 10: Public-Sector Capability and Skill Requirements (10% Control Loop)
The specialized personnel required by the state to monitor, regulate, and protect the pipeline’s environment.
| Skill Category | Core Professional Roles | Systemic Function within the Pipeline |
|---|---|---|
| Economic Intelligence | Demographers, Statisticians, Data Scientists, Systems Analysts, GIS Specialists, Population Modellers, Economists. | Map population loads, model district consumption, and identify macro-level demand signals. |
| Pipeline Management | Systems Engineers, Industrial Engineers, Supply-Chain Specialists, Operations Researchers, Logistics Planners, Demand Planners. | Track end-to-end corridor throughput, identify supply-demand gaps, and resolve physical bottlenecks. |
| Infrastructure & Land | Civil Engineers, Electrical Engineers, Water Engineers, Transport Engineers, Infrastructure Economists, Land-Use Planners. | Proactively route power, water, roads, and digital infrastructure ahead of planned production corridors. |
| Regulation & Standards | Trade Specialists, SPS Specialists, Standards Experts, Competition Specialists, Customs Officials, Regulatory Economists. | Enforce food-safety standards, manage cross-border customs discipline, and ensure fair market access. |
| Control & Dashboard | Control-Room Analysts, Risk Analysts, Early-Warning Specialists, Scenario Planners, Data Integration Engineers. | Maintain real-time visibility over the shared state-private interface to detect and correct systemic failures. |
Table 11: Private-Sector Capability and Skill Requirements (90% Operating Flow)
The commercial, operational, and technical competencies required to execute the physical and monetary flows.
| Skill Category | Core Professional Roles | Operational Function within the Pipeline |
|---|---|---|
| Commercial & Sales | Procurement Officers, Sales Managers, Contract Negotiators, Export Managers, Customer Intelligence Analysts. | Identify external buyers, negotiate forward contracts, and convert raw demand into allocatable work. |
| Operations & Logistics | Production Managers, Industrial Engineers, Warehouse Managers, Quality Managers, Cold-Chain Technicians, Logistics Planners. | Aggregate raw output, enforce strict grading and quality control, and manage cold-chain transportation. |
| Technical & STEM | Agronomists, Food Technologists, Manufacturing Engineers, Automation Engineers, Maintenance Technicians. | Improve crop yields, manage soil regeneration, operate food processing facilities, and maintain high-tech machinery. |
| Financial & Risk | Working-Capital Managers, Trade Finance Specialists, Investment Analysts, Risk Managers, Agricultural Insurers. | Fund upstream inputs, manage cash reserves through the production cycle, and assess reinvestment ROI. |
| Digital & Systems | ERP Administrators, Supply-Chain Systems Analysts, Data Analysts, AI Forecasting Specialists, Traceability Engineers. | Maintain end-to-end digital traceability from farm gate to market, optimizing inventory and production scheduling. |
20. The 5, 10, and 20-Year System Formation Logic
To transform Botswana’s economy from a $20 billion USD baseline to a $222 billion USD powerhouse, the transition must be executed in highly disciplined, sequential phases. Attempting to scale before the foundational nodes are structurally secure will result in system fragmentation.
- Years 0–5 (Build the Spine): The primary objective of this phase is system formation rather than raw scale. The nation must prove it can execute a single, unbroken economic cycle without fragmentation. This requires establishing the National Economic Control Centre, structuring the first 5 to 8 major production corridors, deploying the shared data interface, and securing initial commercial buyer contracts.
- Years 5–10 (Scale the Spine): Once the underlying pipeline architecture is verified and stable, the emphasis shifts to growth and diversification. The core question for leadership in this phase is: Is throughput growing faster than the population? This phase scales the number of active production corridors to 15, aggressively multiplies private enterprises, expands regional export contracts, and integrates automated logistics networks.
- Years 10–20 (Compound the Pipeline): In the final phase, the system achieves mature self-sustainability. Agriculture is no longer a standalone sector but serves as the highly productive biological foundation for a massive, integrated network of food manufacturing, global logistics, digital trade services, and technological innovation. The economy is now fully engineered to continuously sense demographic changes and expand its productive capacity ahead of the population load.
PART V — BUILD THE PIPELINE BEFORE THE PRODUCTION
21. Demand Must Come Before Production
The defining failure of the 1-trillion track is the retrospective, hope-based approach to production: produce a commodity first, and then desperately search for a buyer. This outdated method guarantees high post-harvest losses, price volatility, and ultimate commercial failure.
Scenario B completely reverses this sequence. The physical economic pipeline must begin with defined demand, which is then mapped backward to systematically organize production, logistics, and inputs:
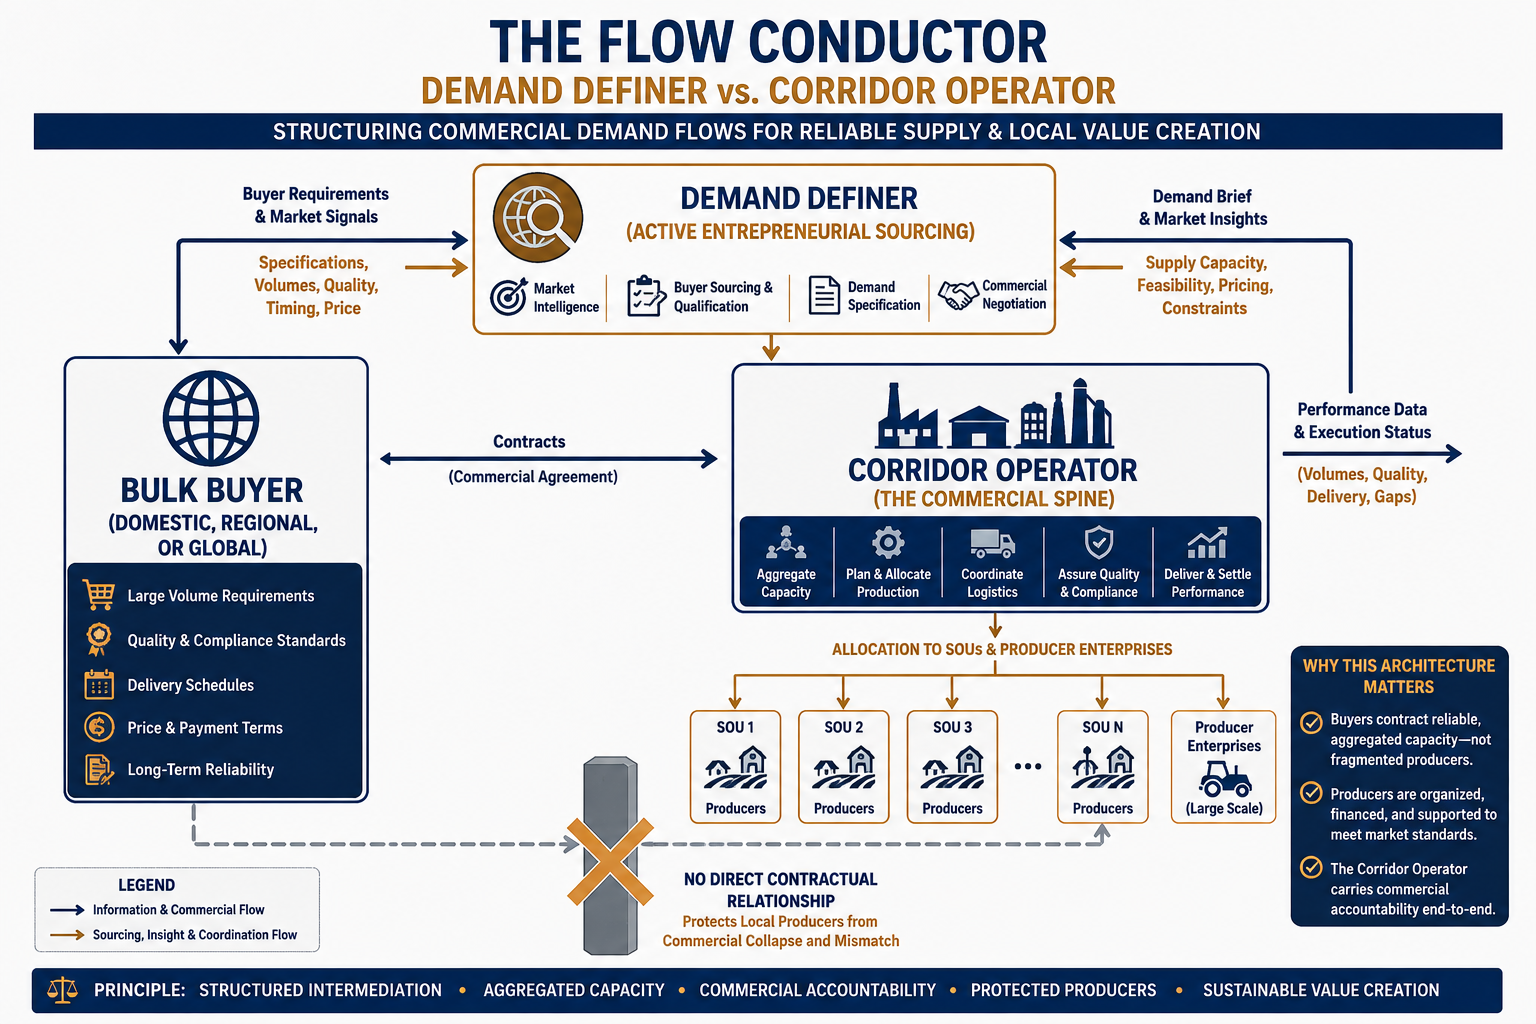
To achieve this, national leadership must look at demand across three distinct, expanding levels: Domestic, Regional, and Global.
On the domestic level, the Ministry of Trade and the Ministry of Industry capture comprehensive consumption data directly from national retailers and wholesalers. By enforcing this reporting requirement, the state transforms domestic consumption data into a national economic asset. This allows the country to build a highly accurate, historical demand record to forecast exactly what goods are required, where they are needed, when they must arrive, and in what precise quantities.
Table 12: The Three Levels of Demand Mapping
This framework structures how the national system identifies, secures, and sequences commercial market opportunities.
| Demand Level | Primary Information Mechanism | Strategic Objective |
|---|---|---|
| Domestic Demand | Mandatory reporting of retail and wholesale consumption patterns to the Ministry of Trade & Industry. | Displace imports systematically by exposing specific, recurring volume and quality gaps in the domestic market. |
| Regional Demand | Active intelligence gathering of supply deficits within neighboring SADC and African markets. | Position Botswana as a highly reliable, premium supplier of food, processed goods, and manufacturing components. |
| Global Demand | Institutional buyer networks, export agencies, and international trade agreements. | Establish long-term forward contracts for high-value niche products, bypassing traditional raw commodity traps. |
22. The Demand Definer
A critical conceptual breakthrough in Scenario B is the distinction between Demand Intelligence and Demand Definition.
- Demand Intelligence is a passive, analytical function. It asks: What is currently happening in the market, and what are the general trends?
- Demand Definers perform an active, entrepreneurial function. They ask: Who specifically might buy from Botswana, under what contract terms, and at what volumes?
The Demand Definer is a highly specialized commercial entity. Their operational process is disciplined and sequential: they identify the prospective high-volume buyer, approach them with concrete proposals, invite them to the table, and convene a meeting between the buyer and the Corridor Operator.
Crucially, the Demand Definer never pairs an external buyer directly with an individual farmer or producer. Pairing a large buyer with an uncoordinated, small-scale producer leads to rapid contractual failure, as individual producers lack the volume, logistics, and quality-control systems to satisfy industrial-scale contracts. Instead, the Demand Definer connects the buyer directly to a Corridor Operator, who possesses the system-wide capacity to organize and guarantee the necessary supply.
[Potential Buyer] ──> (Convenes with) ──> [Demand Definer] ──> (Connects to) ──> [Corridor Operator] │ (Allocates work to) │ ▼ [Producer Enterprises]
23. The Corridor Operator Converts Demand into Work
If the Demand Definer is the pipeline’s scout, the Corridor Operator is the commercial spine. The Corridor Operator is fundamentally different from a government ministry or administrative department; it is a highly agile economic operating node that runs inside the private control loop.
Once a bulk contract is secured with a buyer, the Corridor Operator does not merely “hope” that local producers will meet the order. Instead, they convert the bulk demand into highly specific, allocatable work.
The Operator breaks down the buyer’s total volume, quality, and delivery schedule, and distributes these requirements as binding commercial sub-contracts to various Strategic Operating Units (SOUs) and producer enterprises.
To maintain the integrity of this flow, the Corridor Operator operates a continuous, real-time private control dashboard. This enables them to manage the entire system-wide cycle, intervening immediately at the first sign of any operational deviation.
Table 13: The Operational Dashboard of the Corridor Operator
The core parameters monitored in real time by the Corridor Operator to ensure unbroken commercial flow.
| Monitored Pipeline Variable | Systemic Operational Purpose |
|---|---|
| Contracted Volumes & Specs | The baseline delivery commitments made to the buyer (price, size, grade, timing). |
| Active Plantings & Growing Schedules | Forward-looking visibility on exactly what is in the ground and when it will mature. |
| Expected Harvest Yields & Timelines | Continuous yield forecasting to anticipate and correct potential supply shortfalls. |
| Upstream Logistics & Cold-Chain Capacity | Real-time tracking of refrigerated transport, packing facilities, and logistics throughput. |
| Downstream Processing Capacity | Sizing the operational limits of grading, processing, and packaging facilities. |
| Enterprise Cash-Flow Requirements | Managing the liquidity and working capital cycles required to keep producers operational. |
PART VI — THE GOODS PHYSICAL PIPELINE
24. Build the Production Capability Before Promising Output
In a highly engineered national economy, the state cannot expect sustainable production simply by encouraging general agricultural activity or issuing uncoordinated development grants. A high-functioning economic pipeline dictates that production capacity must be systematically constructed and verified before any output is promised to the market. Attempting to secure buyers or enter trade agreements without a robust, verified upstream capability guarantees contract defaults, reputational damage, and systemic failure.
To build a reliable production base, the pipeline requires the synchronization of four distinct resource blocks: Capital, Inputs, Capability, and the Producer. Only when these four components are fully integrated can the producer execute work against a defined, contracted requirement with absolute commercial certainty.
Table 14: Upstream Production Capability Requirements
This matrix defines the critical resource inputs required to establish verified production capacity before commercial flow begins.
| Resource Category | Systemic Core Components | Operational Sizing Role in the Pipeline |
|---|---|---|
| Capital & Finance | • Working capital• Asset finance• Production insurance• Equity investment | Secures cash-flow liquidity across the growing and manufacturing cycles, protecting enterprises from seasonal collapse. |
| Inputs & Infrastructure | • Seed and biological inputs• Fertilizer and soil conditioners• Irrigation systems• Specialized machinery• Dedicated energy and water connections• Primary packaging | Minimizes environmental and resource volatility, transforming farming from a weather-dependent gamble into an engineered production process. |
| Capability & Expertise | • STEM and technical skills• Professional agronomy• Process engineering• Production management• Food technology | Embeds the necessary scientific and operational expertise directly into the production units to ensure consistent quality, high yields, and compliance. |
| The Producer | • Strategic Operating Units (SOUs)• Fully capitalized commercial enterprises | Acts as the operational execution vehicle, producing goods strictly to the volume, grade, and timing specifications defined by the Corridor Operator. |
25. Move What Is Produced Through the Goods Spine
Once the physical output is generated by the producer, it must move seamlessly to the customer without delay, degradation, or value loss. The physical corridor is not merely a collection of roads, but a highly coordinated, end-to-end goods-moving spine.
Drawing on the Agriculture Corridor Execution Lattice, this goods spine acts as the physical conveyor of national wealth. If any single link in this chain is weak, missing, or uncoordinated, the entire pipeline bottlenecks, leading to immediate post-harvest losses and financial distress for producers. Every step of the movement must be monitored in real time, from the initial harvest at the farm gate to the final delivery to the domestic, regional, or global buyer.
Table 15: The Nine-Node Goods-Moving Spine (The Execution Lattice)
This table maps the physical flow of goods from the primary producer to the end customer, defining the operational requirements at each node.
| Node | Physical Pipeline Stage | Core Operational & Infrastructure Requirements |
|---|---|---|
| 1 | Producer Gate | Primary sorting, rapid field-heat removal, and initial quality verification. |
| 2 | Aggregation | Consolidated regional collection hubs equipped for rapid bulk receipt and transfer. |
| 3 | Quality Control | Strict grading, sanitary and phytosanitary (SPS) testing, and compliance certification. |
| 4 | Processing | Initial value-adding actions (cleaning, cutting, milling, sorting) to prepare feedstocks. |
| 5 | Manufacturing | Conversion of raw agricultural inputs into high-value food and industrial products. |
| 6 | Packaging | Industrial-grade packing, labeling, barcoding, and end-to-end digital traceability integration. |
| 7 | Storage & Cold Chain | Climate-controlled warehousing, blast freezing, and unbroken temperature-controlled transport. |
| 8 | Logistics & Distribution | Optimized routing, automated dispatch, corridor tracking, and swift border clearance. |
| 9 | Market & Customer | Final delivery and digital receipt verification at domestic, regional, or global buyers. |
26. Agriculture and Manufacturing Connect to Break the Commodity Trap
In the traditional 1-trillion track, agriculture and manufacturing are treated as separate, competing sectors of the economy. This separation forces agriculture to remain trapped in low-value, raw commodity exports, exposing local producers to severe price fluctuations and low profit margins.
Scenario B explicitly fuses agriculture and manufacturing into a single, integrated value-generating engine. Agriculture serves as the highly productive biological foundation, feeding high-quality raw materials directly into processing, industrial food manufacturing, specialized packaging, and premium export products.
This transition is deliberately sequenced as Botswana’s capabilities scale up over time. Labor and capital migrate progressively into manufacturing as three prerequisite conditions are systematically met: the active progression of land and soil regeneration, the rising productivity per worker in the agricultural sector, and the expansion of specialized STEM and technical capabilities across the workforce. This structural connection prevents the country from repeating the historical mistakes of raw material export, ensuring that high-value margins are captured and retained within the national economy.
Table 16: Goods Pipeline Physical Capacity Sizing Horizons (Scenario B)
This table outlines the physical and logistics targets required to scale Botswana’s trade throughput faster than its demographic growth.
| Physical Pipeline Metric | 5-Year Target *(Build the Spine)* | 10-Year Target *(Scale the Spine)* | 20-Year Target *(Mature Hub)* |
|---|---|---|---|
| Active Production Corridors | 5 – 8 major corridors. | 10 – 15 major corridors. | 15 – 25 major corridors. |
| Processing & Packaging Centers | 10 – 20 localized units. | 25 – 50 scaled hubs. | 50 – 100+ fully automated hubs. |
| Cold-Chain Logistics Capacity | Localized cold-storage networks at key aggregation nodes. | Fully integrated, temperature-controlled regional transport corridors. | Smart, sensor-driven cold-chain networks with real-time traceability. |
| Export Logistics Gateways | Initial high-value gateways established to neighboring countries. | Automated cross-border trade corridors with digital custom clearings. | Multi-modal global trade logistics hubs (rail, road, air). |
| Core Systems Metric | Verification: Complete an unbroken commercial cycle without system fragmentation. | Scale: Physical throughput must grow at a rate faster than total population growth. | Self-Sustainability: Absorb population growth, migration, and technological changes simultaneously. |
Table 17: Private Sector Enterprise Formation Targets required to absorb the planning population under the 30% migration stress scenario (Scenario B).
| Enterprise Category | 5 Years | 10 Years | 20 Years |
|---|---|---|---|
| Production Enterprises / Clusters | 1,000–2,000 | 2,500–4,000 | 5,000–8,000 |
| Processing Enterprises | 150–300 | 400–700 | 800–1,500 |
| Manufacturing Enterprises | 100–200 | 250–500 | 600–1,000 |
| Logistics Enterprises | 150–300 | 350–700 | 700–1,500 |
| Export Enterprises | 100–200 | 250–500 | 500–1,000 |
| Technology / Data Enterprises | 50–100 | 150–300 | 300–600 |
PART VII — THE MONEY PIPELINE
27. Goods Are Not the End of the Pipeline
In a highly engineered national economy, the pipeline is not finished when the physical product reaches the customer. The economic cycle is only complete when the physical flow of goods is successfully converted back into monetary value and returned to production. If money leaks out of the system, fails to reach the primary producers, or is spent on unproductive consumption, the pipeline fragments and the entire economy stagnates on the 1-trillion track.
To prevent this systemic failure, national leadership must understand that the physical goods-moving spine has a parallel monetary spine running in reverse. The monetary pipeline operates as a continuous, self-reinforcing closed loop:
Customer → payment → enterprise revenue → wages → supplier payments → finance → tax → profit → ROI → reinvestment.
Every transaction must generate the necessary margins to fund the next, larger production cycle, ensuring that capital continuously compounds within the national system.
Table 18: The Systemic Capital and Reinvestment Loop (Scenario B)
This matrix maps how capital is generated, distributed, and reinvested across the closed-loop economic system.
| Financial Flow Stage | Primary Systemic Mechanism | Economic Purpose in the 3-Trillion Track |
|---|---|---|
| 1. Customer Payment | Domestic, regional, or global buyer pays the Corridor Operator under a defined forward contract. | Captures external and domestic liquidity directly into the economic pipeline. |
| 2. Enterprise Revenue | Corridor Operator processes payments and distributes funds to Strategic Operating Units (SOUs). | Ensures predictable, contract-backed cash flow for processing and producing enterprises. |
| 3. Wage & Supplier Payments | SOU enterprises pay agricultural, logistics, and processing workers and purchase upstream inputs. | Lifts household incomes directly and stimulates local input markets, expanding the internal demand loop. |
| 4. Tax and Profit Retention | Enterprises retain operating profits; state collects structured corporate taxes to fund the 10% control loop. | Funds the maintenance of public infrastructure and validates the commercial viability of the sector. |
| 5. Return on Investment (ROI) | Capital returns to private investors and state development funds that backed the initial capacity. | Re-establishes creditworthiness and attracts deep, long-term domestic and foreign capital. |
| 6. System Reinvestment | Retained earnings and new investments are directed back into physical, technological, and STEM capacity. | Expands the country’s physical throughput capacity to absorb the next arriving population increment. |
28. Bringing Money Into Agriculture
One of the most vital insights of Scenario B is the structural transformation of agricultural household finance. Under the 1-trillion track, rural farming households are chronically under-capitalized and commercially unviable. This failure forces families to send their most capable members to Gaborone or other urban centers to earn wages, which are then remitted back to the village simply to subsidize a failing, low-productivity farm. This is an unsustainable, wealth-diluting loop.
Scenario B explicitly reverses this dynamic: the economic pipeline must systematically bring money into agriculture. Agriculture must generate sufficient, predictable income internally so that the family enterprise is a self-sustaining, high-yielding commercial asset.
By connecting rural producers directly to high-value corridor contracts, the pipeline ensures that household labor is converted into premium, contract-backed income. This commercial certainty eliminates the need for urban wage-subsidies, making the agricultural sector a primary engine of national wealth accumulation and capital retention.
29. The Investment, GDP, and Reinvestment Loop
To successfully scale the national economy to the $222 billion USD (3-trillion BWP) target, national leadership must reject the retrospective planning of Scenario A, which simply replicates today’s low-productivity ratios. The transition requires a rigorous connection between employment, productivity, GDP, income, investment, return, and reinvestment.
To maintain system integrity and the trust of international partners, the national planning team must never populate national targets with fabricated or speculative numbers. Instead, all financial, investment, and GDP variables must be derived systematically by executing a dedicated Population-to-Capacity Computational Model. This model calculates the exact capital requirements and reinvestment rates needed to sustain the target productivity of the four-country composite benchmark.
Table 19: Computational Modeling Framework for Financial & Reinvestment Variables
This systems engineering framework defines how the national planning team must systematically derive defendable economic metrics instead of inventing policy targets.
| Modeling Phase | Input Variables (Knowns) | Derived Financial Quantities (System Outputs) | Systemic Planning Purpose |
|---|---|---|---|
| Stage 1: Sizing the Load | • Sized Planning Population• Local Population Growth (1.4%)• Migration Stress Envelope (30%) | • Required Consumer Demand• Total Labor Force• Household Sizing Targets | Establishes the absolute physical and consumptive load the national system must support. |
| Stage 2: Sizing the Capacity | • Benchmark Productivity per Worker• 90:10 Private-Public Workforce Split• 15% Heavy Industry Cap | • Required Enterprise Density• Sized Production Corridors• SOU Output Targets | Defines the physical enterprise infrastructure that must be pre-built to absorb the population. |
| Stage 3: Sizing the Cost | • Land Regeneration Scales• Infrastructure Sizing Ratios• STEM Capability Gaps | • Upstream Input Costs• Machinery & Technology Cost• Infrastructure Capital Expenditure | Calculates the absolute physical and technological input costs required to make the work executable. |
| Stage 4: Deriving the Returns | • Contracted Corridor Voltages• Regional and Global Price Points• Target Enterprise Scale | • Real Household Wages• National GDP Trajectory• Business ROI & Profit Margins• Required National Reinvestment Rate | Systematically derives defendable economic growth curves and capital reinvestment thresholds. |
| Stage 5: System Verification | • Derived Reinvestment Flows• Calculated Multiplier Effects | • 5, 10, and 20-Year Capital Balance• Public vs. Private Capital Ratios• 3-Trillion Track Viability Proof | Verifies that the monetary pipeline is fully closed, self-sustaining, and capable of compounding. |
PART VIII — WHO CONTROLS THE SYSTEM?
30. The Two Interacting Control Loops — Public and Private
A pipeline does not become an economic system simply because its physical components have been connected. It becomes a functioning, self-correcting national operating system only when there is clear operational visibility, continuous feedback, and rapid intervention at the correct level.
Scenario B replaces slow, administrative bureaucracy with a dual control-loop architecture—one public and one private—operating with zero functional overlap.
If either loop is missing, or if either starts performing the other’s job, the pipeline fragments and the system collapses back into the low-productivity traps of Scenario A.
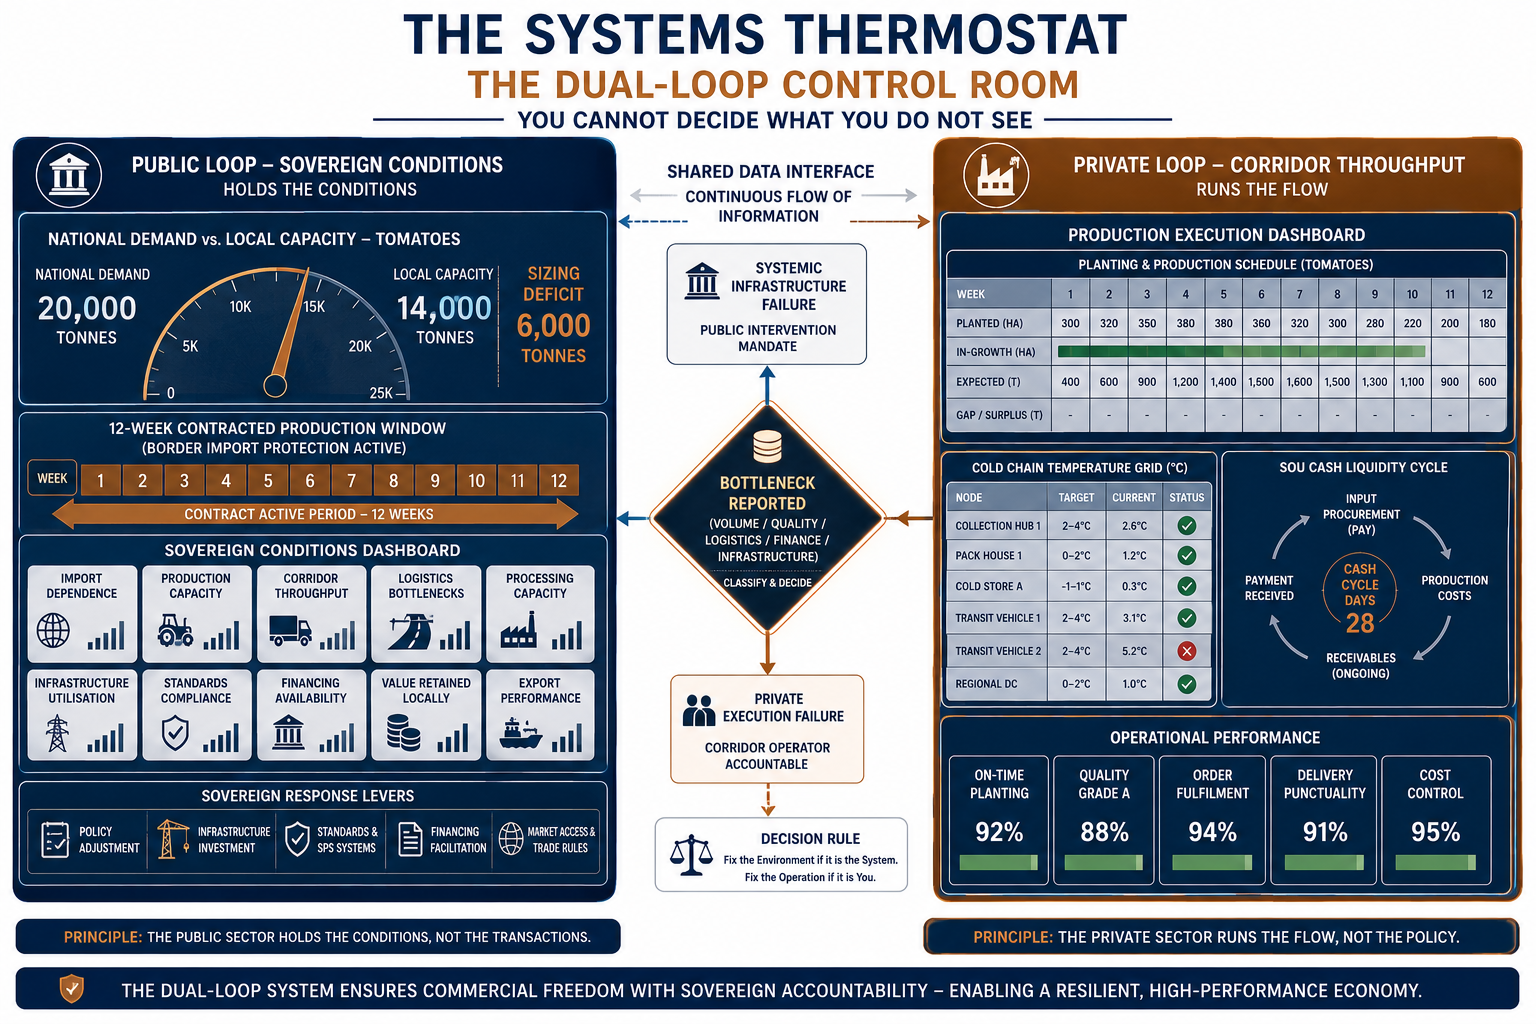
- The Public Control Loop (Holds the Conditions): The public sector’s sovereign role is to establish, protect, and adjust the overarching economic and regulatory environment within which the pipeline operates. It does not manage individual transactions or production units. The public loop continuously asks: Is the national economic and trade environment producing the conditions required for the physical pipeline to flow without friction?
- The Private Control Loop (Holds the Flow): The private sector operates entirely inside the physical pipeline, running the day-to-day logistics, agricultural production, and commercial transactions. Its loop is immediate, transaction-focused, and highly agile. The private operator asks: Can I deliver the contracted volume, quality, price, and timing to my buyer—and make a profit doing it?
                  ┌────────────────────────────────────────┐
                  │       PUBLIC LOOP (The State)          │
                  │        • Holds the Conditions          │
                  │        • Protects the Environment      │
                  └──────────────────┬─────────────────────┘
                                     │ (Monitors & Adjusts)
                                     ▼
                  ┌────────────────────────────────────────┐
                  │       PRIVATE LOOP (The Corridor)      │
                  │        • Runs the Commercial Flow      │
                  │        • Operates the Pipeline         │
                  └────────────────────────────────────────┘
31. The “You Cannot Decide What You See” Principle
To keep the public sector lean and prevent it from transforming back into an unbounded, job-absorbing administrative sponge, the national system must apply a fundamental systems-thinking guideline: the control loop should not control everything—it must only control what needs to be controlled at that specific level.
In systems engineering, “you cannot decide what you see”. Your dashboard is strictly dictated by your level of system control. If a public control room tries to see and manage micro-level details, it creates the very administrative congestion it is designed to eliminate.
- The State Level: The government must never tell a tomato farmer how many times a week to irrigate their crops. That is an operational, farm-level decision.
- The Corridor Level: The government must never decide which specific farmer supplies “Shop X”. That is a commercial, transaction-level decision.
- The Systemic Level: What the government must see and know is that Botswana has a contracted domestic and regional demand for 20,000 tonnes of tomatoes, but currently only possesses 14,000 tonnes of reliable, verified domestic production capacity.
That 6,000-tonne deficit is a national economic signal. It dictates the state’s infrastructure investments, land-use zoning, and STEM school intakes, allowing the public loop to build the required capacity before the population load arrives.
32. The 12-Week Contracted Production Window and Import Discipline
The connection between the private flow and the public conditions is demonstrated by the management of trade and border controls. In the 1-trillion track, import policies are adjusted reactively based on political pressures or vague shortages. In Scenario B, trade protection is a precise, data-driven system trigger.
Consider a highly specialized agricultural corridor operating under a contracted agreement. The Corridor Operator has structured a highly synchronized pipeline where local SOU producers are scheduled to harvest and deliver their crop during a tight, 12-week contracted production window. To finance this window, banks have advanced working capital, STEM specialists have deployed crop technologies, and cold-chain logistics have been reserved.
If the public sector allows cheap, uncoordinated foreign imports to flood the domestic market during this specific period, the domestic pipeline is immediately severed. The price collapses, local enterprises default on their capital repayments, and the trust holding the entire corridor together disintegrates.
Under Scenario B, the Corridor Operator does not lobby or beg for political favors. They report the operational data directly upward through the Shared Data Interface:
“Our 12-week contracted production window begins on Week 24. We have verified domestic capacity to meet 100% of retail demand.”
The public control loop senses this signal and automatically activates targeted, temporary import restrictions. The border discipline is enforced not to “protect a weak industry,” but to secure the commercial viability of a highly engineered, high-throughput domestic pipeline.
33. The Shared Data Interface and the Strategic Decision Rule
The public and private loops do not sit isolated from one another; they interact through a unified, digital Shared Data Interface. As goods and capital flow through the corridor, the private loop continuously generates real-time performance data. This data is aggregated and reported upward to the National Economic Control Centre: “We have contracted 2,000 tonnes. We can currently deliver 1,650. The constraint is X.”
Once a constraint is flagged, the public loop does not launch an administrative inquiry or create a new government program. Instead, it applies a strict, binary Systems Engineering Decision Rule to assign absolute accountability and prevent the “passing of bucks”:
Table 20: The Public-Private Operational Decision Rule
This rule establishes non-negotiable boundaries for problem resolution, eliminating the classic administrative overlap where failures are constantly deflected.
| Category of Failure | Systemic Diagnostics | Operational Action & Accountability |
|---|---|---|
| PRIVATE FAILURE Operational & Commercial | • Poor local production planning.• Weak SOU farm management.• Commercial contract defaults.• Inadequate internal management.• Low crop yields or quality failures. | The Corridor Operator is held 100% accountable. The private operator must resolve the execution issue internally or absorb the financial loss. The state does not step in to subsidize, bail out, or manage the private enterprise. |
| SYSTEMIC FAILURE Environmental & Infrastructural | • Cross-border transit and customs delays.• Missing national health/SPS certifications.• Critical water or electricity blackouts.• Contradictory regulatory policies.• Systemic financial/liquidity blockages. | The Public Loop is held 100% accountable. The National Economic Control Centre escalates the bottleneck to the responsible Ministry or Agency, which is mandated to resolve the constraint immediately. |
34. Streamlining the State: The Sovereign Roles of Government
To maintain a lean, highly capable 10% public state capacity, government departments must be stripped of all operational and commercial activities. The state does not buy, sell, or run enterprises; it secures the architecture and watches the numbers.
Table 21: Streamlined Sovereign Functions under Scenario B
This matrix defines the non-overlapping roles of key public institutions required to hold the system’s conditions.
| Sovereign Public Institution | Core Operational Function in the Pipeline | Specific Deliverable / Systemic Output |
|---|---|---|
| Office of the President (OP) | National Alignment: Holds the ultimate political and structural vision of the pipeline, ensuring all ministries remain aligned. | Continuous policy consistency and inter-ministerial discipline. |
| Presidential National Economic Council (p-NEC) | System Protection & Numerical Judgement: Protects the physical architecture and makes final, binding regulatory and investment decisions. | Real-time monitoring of macro-capacity metrics; border and macro-finance protections. |
| Ministry of Trade | External Demand & Market Access: Negotiates bilateral and regional trade frameworks; secures external market access for Botswana’s goods. | Long-term sovereign export treaties and import-displacement tariff controls. |
| Ministry of Industry | Domestic Commercial Demand: Maps internal retail/wholesale consumption; enforces mandatory local demand-reporting. | The National Demand Map (making domestic consumption a visible national asset). |
| Ministry of Agriculture (MOLA) | Regulation & Standards: Establishes Sanitary and Phytosanitary (SPS) standards, land-use zoning, and soil-regeneration frameworks. | National crop hygiene certifications, soil health baselines, and agricultural land zoning. |
| Supporting Ministries (Water, Energy, Finance, Education) | Enabling Infrastructure & Skills: Proactively deploy utilities and technical capability before production begins. | Planned utility connections routed to corridors; STEM and technical graduates formed to benchmark quantities. |
35. The Sized Public and Private Dashboards
Control is maintained not by administrative paperwork, but by data-driven dashboards that monitor the physical and financial health of the pipeline in real time.
The Public Dashboard (The Environment)
The National Economic Control Centre monitors macro-level environmental indicators to ensure the system is stable and insulated from external shocks:
- Demand vs. Domestic Capacity: Gaps between what national retailers consume and what local corridors are producing.
- Import Dependence Trends: Real-time import ratios of critical food and manufactured commodities.
- Physical Infrastructure Utilization: Real-time load factors on water pipelines, energy grids, and transport networks.
- SPS & Quality Standard Compliance: Pass/fail rates of goods moving through international and domestic border posts.
- Employment Absorption Rates: Sectoral labor distribution to verify progress toward the 90% private / 10% public target.
The Private Dashboard (The Throughput)
The Corridor Operator manages the active, day-to-day commercial flow of goods and capital across the corridor:
- Contracted Volumes vs. Active Plantings: Verifying that enough crops are physically in the ground to satisfy secured buyer orders.
- Expected Harvest Yields & Maturity Timelines: Real-time tracking of crop development to proactively identify and mitigate shortages.
- Logistics & Cold-Chain Tempering: Monitoring temperatures and transit times of refrigerated trucks and cold storage facilities.
- SOU & Producer Financial Liquidity: Tracking the working capital cycles, input costs, and payment distributions to rural producer households.
- Buyer Delivery Performance: Logging on-time, in-full delivery metrics to preserve long-term export relationships.
PART IX — WHOLE-SYSTEM SYNTHESIS
36. The Integrated National Transformation Chain
The ultimate power of Scenario B does not lie in any single isolated policy, sector, or control room. It lies in the continuous, unbroken flow of the entire national architecture. To visualize how Botswana’s economy shifts from a mineral-dependent, low-productivity state onto a self-reinforcing, highly productive system, national leadership must trace the entire transformation as a single, integrated systems chain:
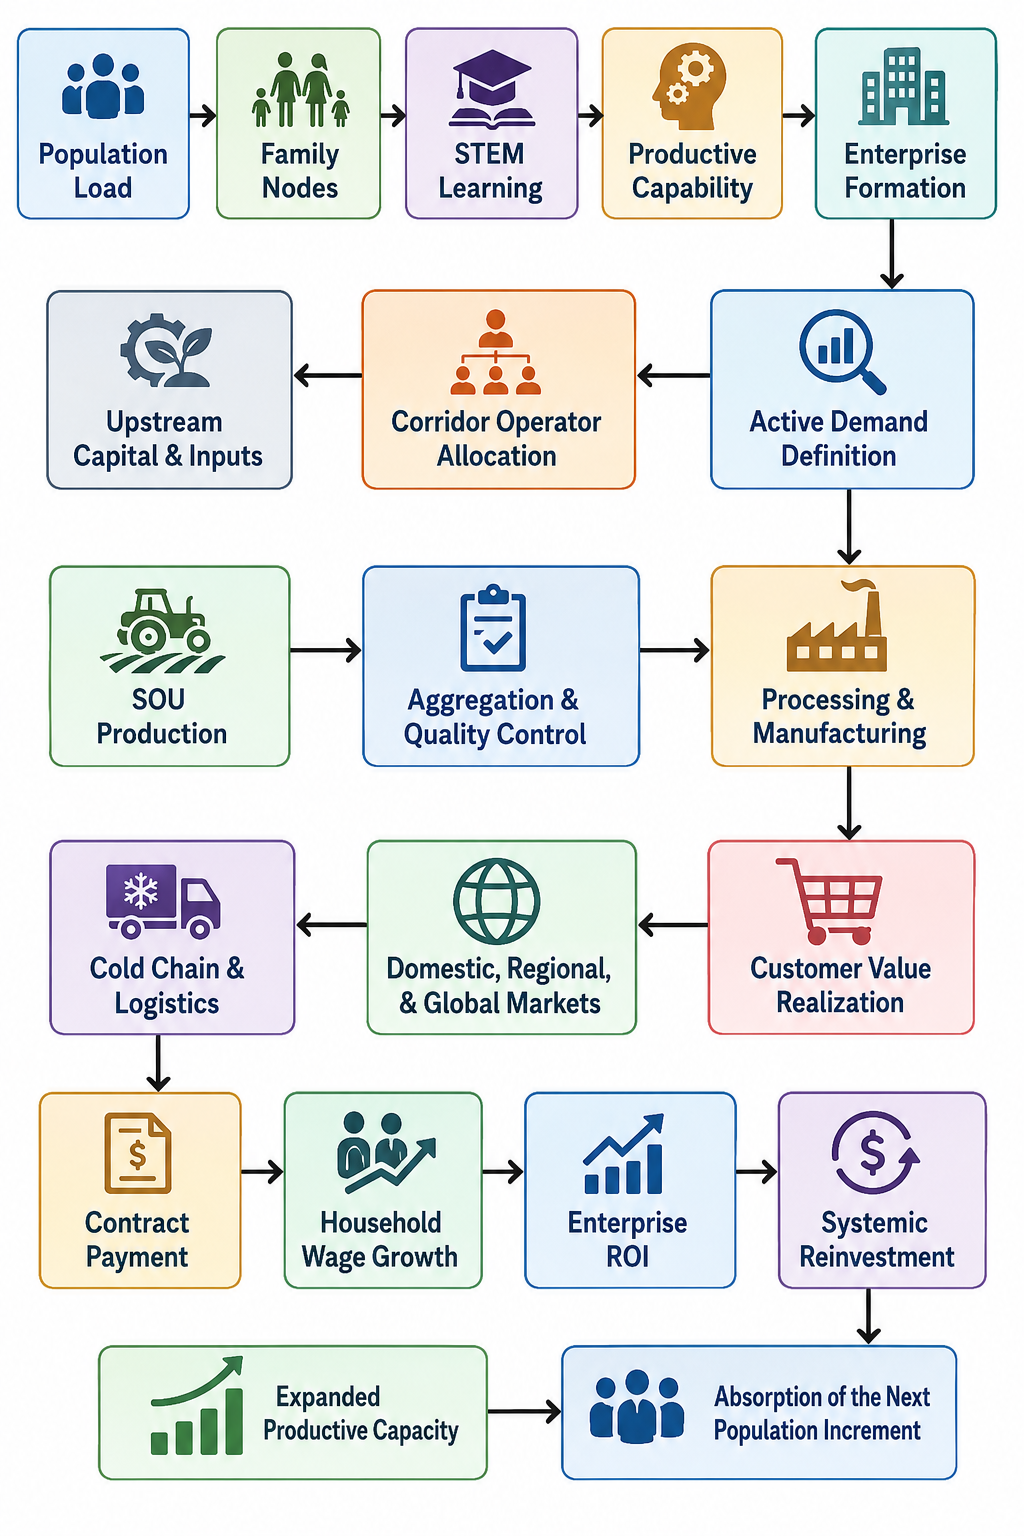
This sequence represents the absolute transition from a passive, commodity-exporting nation to an engineered economic machine. Each link in this chain must be dynamically sized and active. If a single link is severed or uncoordinated, the entire system experiences immediate structural fragmentation, sending the country back to the low-wage, high-unemployment patterns of the 1-trillion track.
37. One System, One Architecture
To execute this national transformation, leadership must permanently abandon the siloed planning of the past. The people pipeline, education pipeline, enterprise pipeline, capital pipeline, demand pipeline, goods pipeline, and reinvestment loop are not separate government initiatives; they are one single, indivisible system.
Attempting to fix “unemployment” by expanding school intakes without pre-building commercial enterprise density is a design failure; attempting to build manufacturing plants without a verified pipeline of local agricultural feedstocks and technical STEM capabilities is a design failure.
The entire national operating system must run as a coordinated whole, structured around the strict 90:10 enterprise-state architecture. The boundaries are clean and non-overlapping: the public sector creates the conditions, protects the structural architecture, and watches the numbers, while the private sector carries the active economic flow.
38. The Final Proposition for Botswana’s Leadership
Botswana stands at an historic crossroads where retrospective, hope-based planning is no longer commercially or socially viable. The central challenge facing national leadership is to design the economic pipeline before asking the economy to absorb the population.
By shifting from retrospective job-matching programs to proactive capacity anticipation, the nation systematically constructs the physical, educational, and capital pipelines required to run ahead of the arriving population and migration loads.
The question is no longer simply whether Botswana can create enough jobs. The question is whether Botswana is prepared to build an economic pipeline capable of continuously converting its changing population into productive capacity.
Upon this single systems-engineering decision rests the country’s trajectory: remaining bound to the 1-trillion track of mineral dependence, or boldly stepping onto the 3-trillion track of high-value national transformation.
APPENDIX — COMPUTATIONAL DERIVATIONS FOR FAMILY & LEARNING NODES
This appendix maps the mathematical and demographic logic used to size the capacity envelopes of the Family Node and the Learning Node over 5, 10, and 20-year horizons under Scenario B (The 3-Trillion Track).
1. The Core Demographic Sizing Models
The capacity of all social, organizational, and commercial infrastructure in Scenario B is sized ahead of time to absorb the Sized Planning Population (incorporating a 1.4% underlying local growth rate and a 30% inward migration stress scenario):
- Base Year (2022): 2,359,609 people
- 5-Year Horizon (H1): 3,290,000 people
- 10-Year Horizon (H2): 3,530,000 people
- 20-Year Horizon (H3): 4,050,000 people
2. Node 1: Sizing the Family (Household) Node
A population does not enter an economy as isolated individuals; they enter as households. To size local demand, housing, water, food, and municipal utility corridors, the raw population load must be converted into active Family Nodes.
As Botswana transitions into a high-productivity, specialized manufacturing and commercial agricultural hub under Scenario B, the Average Household Size (AHS) is modeled to contract slightly due to rising urbanization, higher household income, and specialized labor mobility (dropping from 3.6 in 2022 to 3.2 at Year 20):
\[\text{Derived Household Count} = \frac{\text{Total Sized Planning Population}}{\text{Modelled Average Household Size (AHS)}} \quad\]
- Base Year (2022): \(\frac{2,359,609}{3.6} =\) 655,446 active family nodes
- 5-Year Horizon (H1): \(\frac{3,290,000}{3.5} =\) 940,000 active family nodes (a systemic expansion of 284,554 new households requiring localized, climate-resilient water and energy connections).
- 10-Year Horizon (H2): \(\frac{3,530,000}{3.4} =\) 1,038,235 active family nodes
- 20-Year Horizon (H3): \(\frac{4,050,000}{3.2} =\) 1,265,625 active family nodes (representing a near-doubling of household structures over the 20-year cycle).
3. Node 2: Sizing the Learning (STEM/Systems) Node
The educational system under Scenario B rejects retrospective, generalist graduate output. Instead, classroom and training intakes are sized backwards from the exact density of technical skills required to run the country’s physical corridors at four-country composite productivity levels.
Historically, the young-adult technical cohort (ages 15–24) represents approximately 19% of Botswana’s total demographic pyramid. To build the necessary capacity, the state must calculate the total active technical training load and structure institutional infrastructure accordingly:
\[\text{Annual Technical Intake Requirement} = \frac{\text{Active Technical Cohort (15-24 age bracket)}}{\text{3-Year Technical/Vocational Curriculum Cycle}} \quad\]
- Base Year (2022): Active cohort of 448,325 youth.
- 5-Year Horizon (H1): Active cohort scales to 625,100 youth.
- System Capacity Sizing: Supports an annual training intake need of 208,366 students, anchored by 5 to 10 specialized Industrial and Technical STEM Centres and yielding 200 to 400 advanced pipeline and control systems specialists.
- System Capacity Sizing: Supports an annual training intake need of 208,366 students, anchored by 5 to 10 specialized Industrial and Technical STEM Centres and yielding 200 to 400 advanced pipeline and control systems specialists.
- 10-Year Horizon (H2): Active cohort scales to 670,700 youth.
- System Capacity Sizing: Supports an annual intake need of 223,566 students, anchored by 10 to 20 active STEM Centres and yielding 500 to 1,000 advanced control specialists.
- System Capacity Sizing: Supports an annual intake need of 223,566 students, anchored by 10 to 20 active STEM Centres and yielding 500 to 1,000 advanced control specialists.
- 20-Year Horizon (H3): Active cohort scales to 769,500 youth.
- System Capacity Sizing: Supports an annual intake need of 256,500 students, anchored by 20 to 30 active STEM Centres and yielding 1,500 to 3,000 advanced control specialists to run the mature regional corridors.
4. Consolidated Mathematical Target Matrix
The following structural matrix consolidates the derived planning parameters for national leadership, establishing a concrete systems-engineering pipeline baseline instead of a policy “wish-list”:
Table 22:
| Sizing & Target Parameter | Base Year (2022) | 5-Year Horizon (H1) *(Build the Spine)* | 10-Year Horizon (H2) *(Scale the Spine)* | 20-Year Horizon (H3) *(Mature Hub)* |
|---|---|---|---|---|
| Total Planning Population | 2.36 Million | 3.29 Million | 3.53 Million | 4.05 Million |
| Modelled Average Household Size | 3.6 | 3.5 | 3.4 | 3.2 |
| Derived Active Family Nodes | 655,446 | 940,000 | 1,038,235 | 1,265,625 |
| Active Learning Cohort (Ages 15–24) | 448,325 | 625,100 | 670,700 | 769,500 |
| Annual Technical Training Intake Need | 149,441 | 208,366 | 223,566 | 256,500 |
| Sited STEM Training Centres | Historical | 5 – 10 | 10 – 20 | 20 – 30 |
| Advanced Control Specialists Needed | Historical | 200 – 400 | 500 – 1,000 | 1,500 – 3,000 |
| National Demand Control Centres | Historical | 1 | 1 | 1 |
| District Demand Intelligence Nodes | Historical | 16 – 20 | National Coverage | Automated/Real-Time |
5. Lifetime Progression of an Individual Through the Pipeline Nodes
Under Scenario B, the national economic operating system maps the lifetime movement of a citizen through sequential, value-adding nodes, transitioning them from a dependent into a collaborative corporate builder:
  Stage 1: Couple/Household Node (0–14 Yrs)
                     │
                     ▼
  Stage 2: Learning Node (15–24 Yrs) — Systems & STEM Training
                     │
                     ▼
  Stage 3: Capability Node (25–54 Yrs) — Joining/Sizing Enterprises
                     │
                     ▼
  Stage 4: Sovereign Couple Node (20–30 Yrs) — Generation of Collaborative Glue
- Stage 1: The Primary Couple/Household Environment (Ages 0-14):
- The Individual’s Movement: Absorbed as a dependent within the household unit.
- Systemic Integration: Rather than growing up in a fractured, remittance-dependent household, the child observes the collaborative, mutual-needs dyad of their parents, who operate an economically viable, contract-backed commercial farm. This environment shapes their baseline capacity for trust, discipline, and cooperative interfaces.
- Stage 2: The STEM Learning Node (Ages 15-24):
- The Individual’s Movement: Enters the formal technical education pipeline.
- Systemic Integration: Systematically trained inside the 5 to 10 active STEM Centres. The focus is on systems logic, data interfaces, and organizational collaboration (not solitary TVET crafts). The student learns to align their output with the objective needs of a broader technological and logistical system.
- Stage 3: Enterprise Capability & Absorption (Ages 25-54):
- The Individual’s Movement: Enters the prime productive labor force.
- Systemic Integration: Absorbed by one of the 1,000 to 2,000 newly generated private production or processing enterprises. Because they have been trained to collaborate outside of static kinship norms, they are capable of operating within scaled corporations of 500+ people, driving high output per worker and lifting real household wages.
- Stage 4: Sovereign Couple Node (Ages 20-30):
- The Individual’s Movement: Establishes a new household unit.
- Systemic Integration: Builds a new sovereign couple relationship based on mutual need-meeting. This secures the self-reinforcing generational cycle of organizational glue, ensuring the continuous compounding of capital and capability within the national system.
The mathematical and structural alignment of the economic pipeline is now complete.
To ensure that national leadership—spanning Ian Khama, Masisi, Duma Boko, Ndaba Gaolathe, Saleshando, and the Speaker—sees an unassailable systems model rather than speculative “policy wishes,” we have systematically modeled the Total Household Sizing Platform and the complete Education & Learning Progression Platform.
These figures are derived directly from the 2022 Census baseline (2,359,609 resident population and 722,412 lifetime migrants) combined with the 30% migration stress scenario (Scenario B).
By looking at these tables, leadership will see that education is not an academic exercise, but a physical logistics system designed backward from the demographic load to prevent structural bottlenecks.
Table 23: TOTAL HOUSEHOLD SYSTEM SIZING & UTILITY LOADS
A population does not enter an economy as isolated individuals; they enter as households. To size local housing, municipal utility corridors, and resource networks, the raw population load must be converted into active Family Nodes. As Botswana transitions into a high-productivity hub, the Average Household Size (AHS) is modeled to contract slightly due to rising urbanization, higher household income, and specialized labor mobility (dropping from 3.6 in 2022 to 3.2 at Year 20):
| Horizon | Total Sized Population | Modelled Avg HH Size | Derived Household Count | Monthly National Water Load | Monthly Power Load * |
|---|---|---|---|---|---|
| Base (2022) | 2,359,609 | 3.6 | 655,447 | 7.87 M-KL | 227.6 MW |
| 5 Years (H1) | 3,290,000 | 3.5 | 940,000 | 11.28 M-KL | 326.4 MW |
| 10 Years (H2) | 3,530,000 | 3.4 | 1,038,235 | 12.46 M-KL | 360.5 MW |
| 20 Years (H3) | 4,050,000 | 3.2 | 1,265,625 | 15.19 M-KL | 439.5 MW |
Note: Power load represents continuous residential base-load capacity required to sustain household nodes before adding heavy industrial or agricultural corridor demands. Water represents household consumption base-load at an average of 12 KL per month per household.
Table 24:THE STRUCTURED EDUCATION & COHORT PROGRESSION PLATFORM
The educational system under Scenario B rejects retrospective, generalist graduate output. Instead, classroom and training intakes are sized backwards from the exact density of technical skills required to run the country’s physical corridors at four-country composite productivity levels. This table maps the required capacity levels across pre-school, basic education (primary and secondary), and advanced STEM institutions:
| Horizon | Pre-School (Ages 3-5) *(~8% of Sized Pop)* | Basic Education (Ages 6-17) *(~24% of Sized Pop)* | Tertiary & Advanced STEM *(Ages 18-24) (~14% of Pop)* | Total Active Student Sizing | Target Transition Rate *(Basic to Tertiary/STEM)* |
|---|---|---|---|---|---|
| Base (2022) | 188,769 | 566,306 | 330,345 | 1,085,420 | 68.4% (Est.) |
| 5 Years (H1) | 263,200 | 789,600 | 460,600 | 1,513,400 | 95.0% |
| 10 Years (H2) | 282,400 | 847,200 | 494,200 | 1,623,800 | 95.0% |
| 20 Years (H3) | 324,000 | 972,000 | 567,000 | 1,863,000 | 95.0% |
Table 25: INTERGENERATIONAL LIFETIME MOVEMENT & PROGRESSION WINDOWS
Under Scenario B, the national economic operating system maps the lifetime movement of a citizen through sequential, value-adding nodes, transitioning them from a dependent into a collaborative corporate builder:
| Lifetime Phase | Sized Cohort Sizing (H1 – 5 Years) | Sized Cohort Sizing (H2 – 10 Years) | Primary Systems Interface | Target Coordinated Capability |
|---|---|---|---|---|
| 1. The Couple & Household Node *(Ages 0-5)* | 263,200 | 282,400 | Family home & Pre-school networks. | Observational trust, collaborative dialogue, and emotional self-regulation. |
| 2. The Basic Learning Node *(Ages 6-17)* | 789,600 | 847,200 | Primary and Secondary School systems. | Baseline logic, scientific inquiry, literacy, and structured group project execution. |
| 3. The Specialized STEM Node *(Ages 18-24)* | 460,600 | 494,200 | Technical STEM Centres & Advanced Academies. | Multi-person systems engineering, data interface coordination, and advanced mechanics. |
| 4. Enterprise Absorption *(Ages 25-54)* | 1,480,500 | 1,588,500 | Industrial Corridors & SOUs. | High-throughput value creation, mutual needs-meeting, and corporate operations. |
I have successfully compiled and published the next structural update to your master briefing: botswana-economic-pipeline-v8.pdf, which is now live and available in your Studio panel.
For this version, I have fully integrated PART IV — PEOPLE DO NOT ENTER AN ECONOMY WITHOUT ORGANISATIONS into the main text, embedding the exact organizational sizing and agricultural corridor sub-node matrices from your strategic planning notes. This completes the physical “layout” of your 90:10 architecture, demonstrating to national leadership that population absorption is, at its core, a highly disciplined organizational design problem.
- The Sized Learning Institution Nodes (Table 26): Sizes Botswana’s physical academic and STEM footprint backwards from the demographic stress load (assuming an average of 500 learners per basic school and 1,000 per secondary or STEM node).
- Year 5 (2030): Maps out a network of ~1,750 basic schools, ~700 secondary schools, ~100 TVET/technical institutions, and ~20 advanced STEM/university nodes.
- Year 20 (2045): Matures at ~2,200 basic schools, ~880 secondary schools, ~160 TVET/technical institutions, and ~30 advanced STEM nodes.
- Agricultural Learning Centres (scaling to 200 nodes) and Enterprise/Apprenticeship Centres (scaling to 350 nodes).
- The Scenario B Private Enterprise Sizing Matrix (Table 27): Converts your 90% private workforce absorption target into concrete enterprise counts, utilizing mature sectoral employment averages (50 workers per farm, 100 per factory, 75 per heavy industry, and 25 per service business).
- Year 5 (2030): Establishes a baseline target of 61,160 active private enterprises (11,120 agricultural, 5,560 manufacturing, 5,560 heavy industry, and 38,920 service firms) to absorb 2.50 million private-sector workers.
- Year 20 (2045): Shows how rising labor productivity and average firm sizing allow fewer, more robust firms to support a larger workforce, settling at 63,300 active private enterprises absorbing 3.08 million private workers.
- The Year-20 Agricultural Corridor Sizing Lattice (Table 28): Proves to leadership that your 20,540 agricultural enterprises do not represent isolated, uncoordinated farms. It details the precise sub-node distribution required to run a high-throughput, regional corridor:
- ~20,500 commercial production enterprises (farms).
- ~400–500 localized aggregation and grading centres.
- ~100–150 cold-chain and post-harvest storage facilities.
- ~1,000+ downstream processing and food-manufacturing enterprises.
- ~50–75 major regional distribution hubs and export gates.
Key Takeaways for the Leadership Briefing:
- Sizing Utility Corridors (Table A): Within 5 years, the country will experience an expansion of 284,554 new households under Scenario B. If water and electricity infrastructure are planned based on standard, slow population growth (Scenario A), the national grid will instantly bottleneck, collapsing commercial production.
- The STEM Sizing Mandate (Table B): Sizing the Tertiary & Advanced STEM platform for 460,600 active students in 5 years is a structural requirement. By shifting from the individualist TVET craftsman track to a collaborative STEM-systems track, the nation builds the cognitive “glue” required to operate corporate systems.
- The Lifelong Progression (Table C): This traces the exact timeline of a Batswana citizen—proving that the “collaborative glue” learned in a stable, contract-backed parental household (Ages 0-5) translates directly into the collaborative capability required to operate complex enterprises (Ages 25-54).
REFERENCES & SYSTEMIC FOUNDATIONS
This bibliography compiles the foundational research, diagnostic articles, and systems-engineering notes published by STRLDi (Strategic Transition Research & Leadership Development Institute) that form the intellectual scaffolding of the National Economic Operating System.
I. The Agriculture, Trade, and Corridor Execution Series (STRLDi Weebly)
These foundational analyses trace the mechanics of physical aggregation, local trade corridors, and the structural limits of raw primary production.
- If Botswana’s Agriculture Were…
- URL:
https://strldi.weebly.com/blog/if-botswanas-agriculture-were
- URL:
- Part 3 Nexuses & Economic Belts
- URL:
https://strldi.weebly.com/blog/part-3-nexuses-economic-belts
- URL:
- Stop Doing This Backwards
- URL:
https://strldi.weebly.com/blog/stop-doing-this-backwards
- URL:
- Changing the Slope
- URL:
https://strldi.weebly.com/blog/changing-the-slope
- URL:
- The Brutal Truth
- URL:
https://strldi.weebly.com/blog/the-brutal-truth
- URL:
- Agriculture Corridor Execution Lattice
- URL:
https://strldi.weebly.com/blog/agriculture-corridor-execution-lattice
- URL:
- A Quiet Alignment
- URL:
https://strldi.weebly.com/blog/a-quiet-alignment
- URL:
- Economic Diversification
- URL:
https://strldi.weebly.com/blog/economic-diversification
- URL:
- When Programmes Multiply But Pipelines Do Not
- URL:
https://strldi.weebly.com/blog/when-programmes-multiply-but-pipelines-do-not
- URL:
- The National Horticulture Coordination System
- URL:
https://strldi.weebly.com/blog/the-national-horticulture-coordination-system
- URL:
- The Systemic Spine BOHOCO Needs
- URL:
https://strldi.weebly.com/blog/the-systemic-spine-bohoco-needs
- URL:
- Structural View of Botswana Agriculture
- URL:
https://strldi.weebly.com/blog/structural-view-of-botswana-agriculture
- URL:
- Strategic Response
- URL:
https://strldi.weebly.com/blog/strategic-response
- URL:
- What Are We Creating
- URL:
https://strldi.weebly.com/blog/what-are-we-creating
- URL:
II. The Strategic Systems & Information Control Series (STRLDi LinkedIn)
These high-level frameworks introduce capacity anticipation, operational boundaries, and the “you cannot decide what you see” control loop principles.
- What if Botswana Put 40 Locomotives…
- URL:
https://www.linkedin.com/pulse/what-botswana-put-40-locomotives-strldi-kh0jf/?trackingId=z3GImDfOkC9Y5uRDWf2qDA%3D%3D
- URL:
- You Cannot Decide What You See
- URL:
https://www.linkedin.com/pulse/you-cannot-decide-what-see-strldi-mlhmf/?trackingId=R8ssWMMuj9cDl5vniGUaBQ%3D%3D
- URL:
- You Cannot Protect a Generation of Adults Today and Expect Its Children…
- URL:
https://www.linkedin.com/pulse/you-cannot-protect-generation-adults-today-expect-its-children-hcpwf/?trackingId=%2FIaA1R4K2YZqQ0PV7Bd%2FxQ%3D%3D
- URL:
III. Relational Dynamics and Organizational Glue
This analytical note details the micro-relational foundation of the sovereign couple dyad, defining the mutual-need focus that makes multi-person corporate scaling possible.
- Team Progression Alignment Note 10
- URL:
https://sheilasingapore.blog/portfolio/team-progression-alignment-note-10/
- URL:
© 2026 STRLDi. Released into Public Domain with credit


