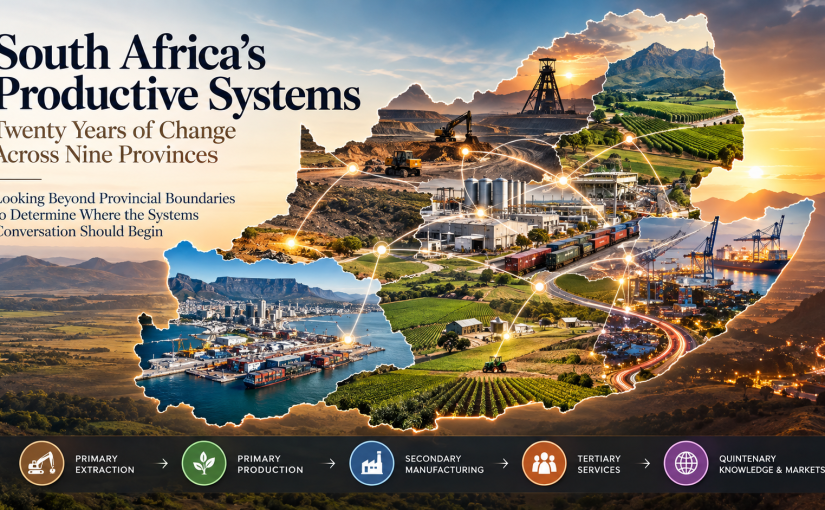
Looking Beyond Provincial Boundaries to Determine Where the Systems Conversation Should Begin — a STRLDi analysis of South Africa’s nine provinces’ productive structures from 2004 to 2024, using Gross Value Added (GVA) to determine an engagement sequence for systems-level intervention.
The Question Behind the Analysis
South Africa has nine provinces, each with its own productive assets, economic history, infrastructure, institutions and development priorities. Over many years, the country has produced plans, strategies, policies and programmes addressing agriculture, industry, infrastructure, mining, manufacturing, employment and regional development. The question behind this analysis is therefore not whether South Africa has thought about these issues before. It is why the system has not moved in the way it could have, or why it has moved in the way it has.
Determining Where the Engagement Should Begin
That question led me to examine the productive structure of the nine provinces over twenty years, from 2004 to 2024, to determine where STRLDi should begin its engagement, in what sequence, and what questions should guide each conversation.
I deliberately chose Gross Value Added (GVA) to see where economic activity is actually creating value, rather than allowing the movement of money to obscure the underlying productive output. The analysis therefore looks beneath monetary flows to where extraction, production, processing, services and knowledge-based activity are generating value.
For me, this is ultimately about where the hands, intentions and minds of people are engaged in productive activity — not simply where money is moving or where relief is being provided. An economy seeking to engage its population at scale must understand where people are participating in the creation of value.
Reading the Productive System
The five-sector structure allows me to examine the productive system as a whole — from Primary Extraction and Primary Production through Secondary, Tertiary and Quintenary activity — and what this reveals about where people can participate in producing, transforming and adding value. An economy designed for broad employment cannot rely principally on the movement of money or the provision of relief; it must build productive capacity through which people can create value.
The analysis uses these five sectors through two lenses: how each province ranks against the other eight within each sector, and how the five sectors rank within each province. Together, these show both a province’s position relative to others and the configuration of its own productive structure.
The intention is not another provincial league table, but to observe system behaviour over time, identify persistence and movement, and open a different conversation about what may be keeping the wider productive system from changing.
What Changed — and What Did Not?
Twenty years gives us an opportunity to look beyond a snapshot. A province may appear relatively stable when compared with the others while important changes are taking place within particular sectors, and those movements may tell us something about the way the productive system is behaving.
The first question is therefore: how does each province rank against the other eight provinces in each of the five economic sectors? A rank of 1 represents the highest relative provincial position and 9 the lowest within that sector; the figures are not a composite score.
Provincial Sector GVA Ranks: 2004 → 2024
| Province | Primary Extraction | Primary Production | Secondary | Tertiary | Quaternary & Quintenary |
|---|---|---|---|---|---|
| Eastern Cape | 9 → 9 | 9 → 7 | 4 → 5 | 4 → 4 | 3 → 3 |
| Free State | 5 → 5 | 4 → 3 | 6 → 6 | 8 → 8 | 5 → 8 |
| Gauteng | 4 → 4 | 6 → 8 | 1 → 1 | 1 → 1 | 1 → 1 |
| KwaZulu-tal | 7 → 7 | 1 → 2 | 2 → 2 | 3 → 3 | 2 → 2 |
| Limpopo | 2 → 2 | 5 → 5 | 8 → 8 | 5 → 6 | #N/A → 4 |
| Mpumalanga | 3 → 3 | 3 → 4 | 5 → 4 | 7 → 5 | #N/A → 6 |
| North West | 1 → 1 | 8 → 6 | 7 → 7 | 6 → 7 | 6 → 7 |
| Northern Cape | 6 → 6 | 7 → 9 | 9 → 9 | 9 → 9 | 7 → 9 |
| Western Cape | 8 → 8 | 2 → 1 | 3 → 3 | 2 → 2 | 4 → 5 |
Source: STRLDi analysis of the underlying provincial sector data, 2004–2024.
What becomes visible is not a simple story of provinces moving up or down. Gauteng, for example, remains at 1 in Secondary, Tertiary and Quintenary while its Primary Production position moves from 6 to 8; Eastern Cape moves from 9 to 7 in Primary Production while remaining unchanged in Tertiary and Quintenary; and Mpumalanga moves in Secondary and Tertiary while retaining its Primary Extraction position.
The change table makes the pattern more explicit.
Change in Provincial Sector Rank: 2004 → 2024
| Province | Primary Extraction | Primary Production | Secondary | Tertiary | Quaternary & Quintenary |
|---|---|---|---|---|---|
| Eastern Cape | 0 | +2 | -1 | 0 | 0 |
| Free State | 0 | +1 | 0 | 0 | -3 |
| Gauteng | 0 | -2 | 0 | 0 | 0 |
| KwaZulu-tal | 0 | -1 | 0 | 0 | 0 |
| Limpopo | 0 | 0 | 0 | -1 | #N/A |
| Mpumalanga | 0 | -1 | +1 | +2 | #N/A |
| North West | 0 | +2 | 0 | -1 | -1 |
| Northern Cape | 0 | -2 | 0 | 0 | -2 |
| Western Cape | 0 | +1 | 0 | 0 | -1 |
This is important because stability itself becomes something to understand. Where a position has remained unchanged, the question is not necessarily why nothing happened; it is what structures, relationships or productive conditions may have continued to reproduce that position over twenty years.
Where a position has moved, the question is equally important: what changed, what drove the change, and did the change strengthen the wider productive system or simply move one part of it?
What Is Happening Inside the Provinces?
The second lens takes us inside each province. Instead of asking where a province stands against the other provinces, it asks how the five sectors relate to one another within that province and whether that internal relationship has changed between 2004 and 2024.
Sector Position Within Each Province by GVA: 2004 → 2024
| Province | Primary Extraction | Primary Production | Secondary | Tertiary | Quaternary & Quintenary |
|---|---|---|---|---|---|
| Eastern Cape | 5 → 5 | 4 → 4 | 3 → 3 | 1 → 1 | 2 → 2 |
| Free State | 4 → 5 | 5 → 4 | 3 → 3 | 1 → 1 | 2 → 2 |
| Gauteng | 4 → 4 | 5 → 5 | 2 → 2 | 1 → 1 | 3 → 3 |
| KwaZulu-tal | 5 → 5 | 4 → 4 | 2 → 3 | 1 → 1 | 3 → 2 |
| Limpopo | 2 → 3 | 4 → 5 | 3 → 4 | 1 → 2 | 0 → 1 |
| Mpumalanga | 3 → 4 | 4 → 5 | 2 → 3 | 1 → 1 | 0 → 2 |
| North West | 2 → 2 | 5 → 5 | 4 → 4 | 1 → 1 | 3 → 3 |
| Northern Cape | 2 → 3 | 4 → 5 | 5 → 4 | 1 → 1 | 3 → 2 |
| Western Cape | 5 → 5 | 4 → 4 | 2 → 2 | 1 → 1 | 3 → 3 |
Source: STRLDi analysis of the relative position of the five economic sectors within each province.
Here again, there is no single story. Eastern Cape, Gauteng, North West and Western Cape retain the same internal ordering, while Free State, KwaZulu-tal, Limpopo, Mpumalanga and Northern Cape show movement across some or several sectors.
Change in Sector Position Within Provinces: 2004 → 2024
| Province | Primary Extraction | Primary Production | Secondary | Tertiary | Quaternary & Quintenary |
|---|---|---|---|---|---|
| Eastern Cape | 0 | 0 | 0 | 0 | 0 |
| Free State | -1 | +1 | 0 | 0 | 0 |
| Gauteng | 0 | 0 | 0 | 0 | 0 |
| KwaZulu-tal | 0 | 0 | -1 | 0 | +1 |
| Limpopo | -1 | -1 | -1 | -1 | -1 |
| Mpumalanga | -1 | -1 | -1 | 0 | -2 |
| North West | 0 | 0 | 0 | 0 | 0 |
| Northern Cape | -1 | -1 | +1 | 0 | +1 |
| Western Cape | 0 | 0 | 0 | 0 | 0 |
The significance is not that movement is automatically good or bad. The significance is that we can now see where there is a question to ask. A persistent structure needs to be understood just as much as a changing one, because persistence is one of the characteristics of a system that repeatedly produces a particular outcome.
From the Data to an Engagement Sequence
This is what the analysis was ultimately undertaken to determine: where should STRLDi begin the conversation, and in what sequence should the nine provincial leaderships be engaged?
What particularly impressed me was that three provinces have continued to give attention to agriculture and manufacturing despite considerable odds. The data suggests that their productive systems have not simply drifted towards sectors in which fewer people can participate directly; there has been continued effort to retain and advance productive capacity in sectors that can engage people in creating value.
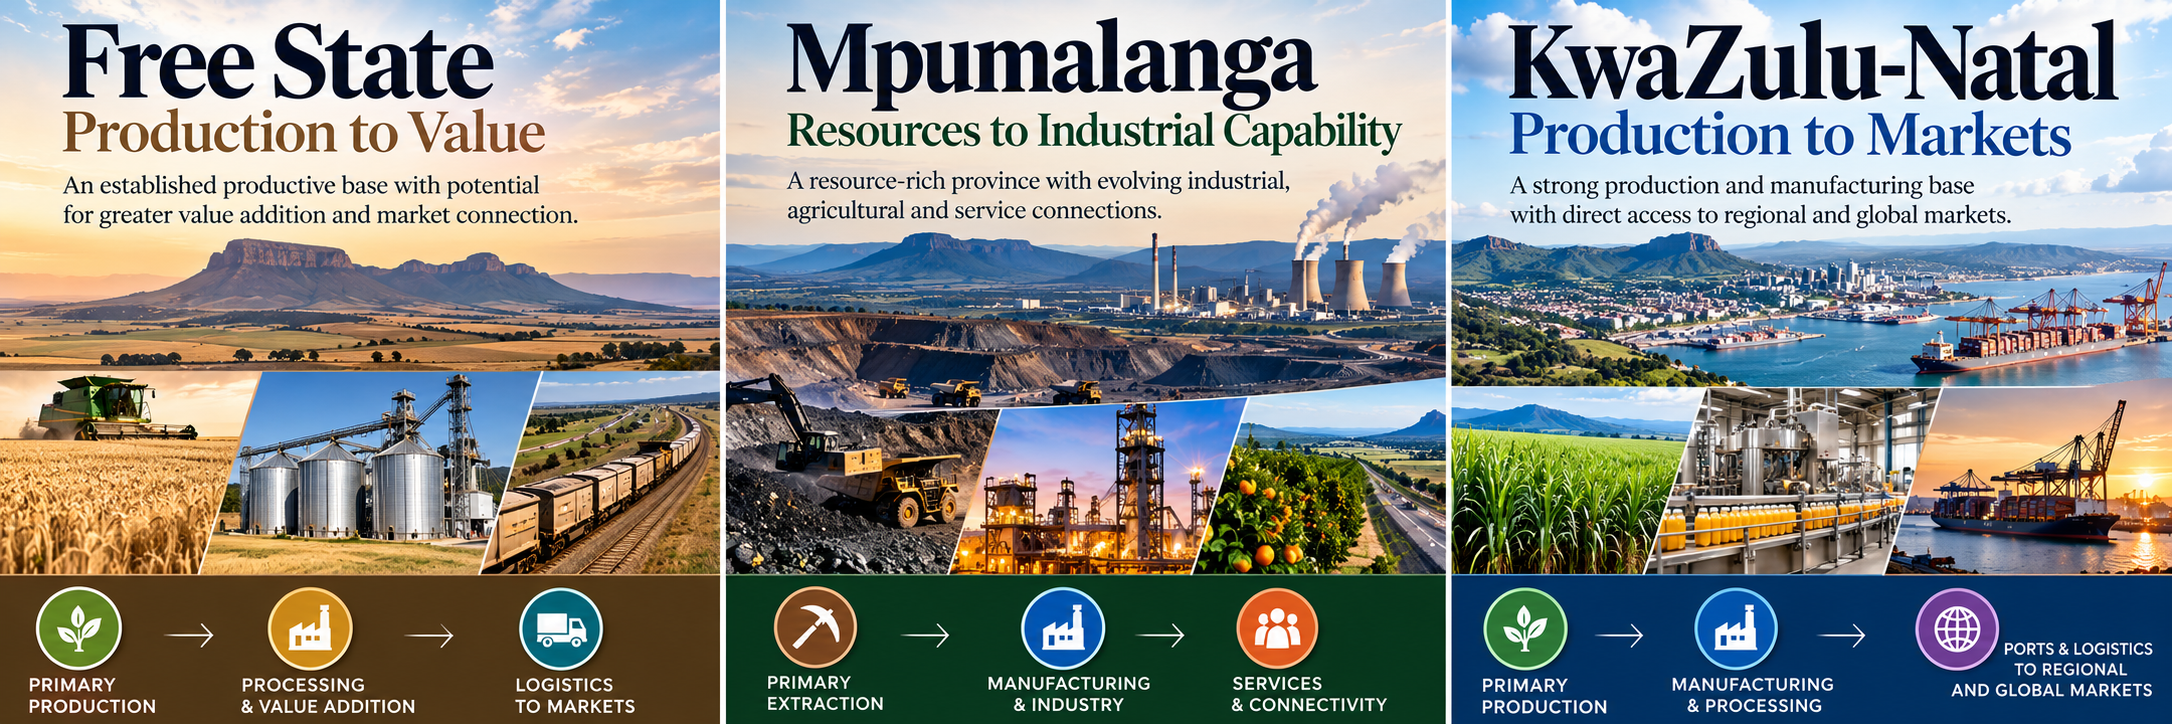
The analysis of Free State, Mpumalanga and KwaZulu-tal showed me something specific about their productive orientation. Across the twenty years, agriculture and manufacturing have retained an important place in their productive structures, with each province, in different ways, holding on to or advancing its position in these sectors. These are particularly important to me because, in an economy deliberately designed for employment absorption, they offer greater scope for engaging large numbers of people directly in production, processing and value addition.
The resulting sequence is therefore an engagement sequence, not a provincial ranking. It reflects the particular patterns revealed through the two analytical lenses and the questions those patterns raise for the next stage of the research:
- Free State
- Mpumalanga
- KwaZulu-Natal
- North West
- Western Cape
- Eastern Cape
- Northern Cape
- Limpopo
- Gauteng
This is why I have chosen to begin with the first three. I want to take the research into these provinces because making the productive relationships already present in their economies visible through a systems lens may provide the impetus to propel their productive systems to levels they may not yet have anticipated.
Population Growth and Productive Capacity
The productive-sector analysis needs to be read against the population each province carries. I therefore compared annualised GVA growth from 2004–2024 with population growth, adding GVA per capita and population density to provide scale and spatial context.
Provincial Population and GVA: 2004–2024
Ranked by GVA growth relative to population growth
| Rank | Province | 2024 Population | Population Growth | 2004 GVA | 2024 GVA | Annualised GVA Growth | GVA − Population Growth | GVA per Capita | Density/km² |
|---|---|---|---|---|---|---|---|---|---|
| 1 | Limpopo | 6.40m | 1.15% | 64,852 | 513,800 | 10.90% | +9.75 pp | 80,281 | 50.9 |
| 2 | Mpumalanga | 5.06m | 1.74% | 73,505 | 511,981 | 10.19% | +8.45 pp | 101,182 | 66.1 |
| 3 | Eastern Cape | 7.18m | 0.50% | 102,193 | 502,698 | 8.29% | +7.79 pp | 70,013 | 42.5 |
| 4 | Northern Cape | 1.37m | 1.35% | 28,365 | 148,531 | 8.63% | +7.28 pp | 108,417 | 3.7 |
| 5 | Free State | 3.04m | 0.69% | 70,871 | 328,415 | 7.97% | +7.28 pp | 108,031 | 23.4 |
| 6 | KwaZulu-tal | 12.31m | 1.19% | 220,336 | 1,067,492 | 8.21% | +7.02 pp | 86,716 | 130.5 |
| 7 | North West | 4.16m | 1.41% | 83,579 | 414,346 | 8.33% | +6.92 pp | 99,603 | 39.6 |
| 8 | Western Cape | 7.56m | 2.13% | 196,099 | 937,721 | 8.14% | +6.01 pp | 124,037 | 58.4 |
| 9 | Gauteng | 15.93m | 2.21% | 456,837 | 2,200,600 | 8.18% | +5.97 pp | 138,157 | 876.3 |
The additional lens strengthens the questions arising from the productive-sector analysis. Free State, Mpumalanga and KwaZulu-tal remain the starting point because their selection arises from the structure and movement of their productive sectors, particularly agriculture and manufacturing. The GVA-population relationship gives each province a further question to take into the engagement.
Three-Phase Engagement
Phase I — Provinces 1–3
Free State → Mpumalanga → KwaZulu-tal
The starting phase focuses on provinces where the productive-sector analysis points to persistent attention to agriculture and manufacturing, alongside different population and GVA conditions.
Phase II — Provinces 5–7
Northern Cape → Limpopo → North West
The second phase extends the inquiry into different combinations of resource endowment, primary production, productive expansion, spatial scale and regional connectivity.
Phase III — Provinces 4, 8 and 9
Eastern Cape → Western Cape → Gauteng
The final phase brings the inquiry into three major and very different productive systems, completing the provincial picture and allowing the findings from the earlier phases to inform these engagements.
The sequence is an engagement sequence, not a provincial ranking. It reflects where the systems inquiry begins, how it expands, and the questions each phase is intended to open.
This is the point of the analysis: to move from observing provincial economic performance to understanding the productive structures that determine how people participate in creating value.
What Could the Pipeline Mean for Employment and Income?
The employment question is inseparable from the productive structure that generates work. If the objective is to engage the population productively, the central question is where productive capacity can be built so that people participate in producing, processing and adding value. This is why the position of agriculture and manufacturing within the provincial productive system matters, and why the movement visible in the three provinces caught my attention.
The proposed pipeline approach considers both biological production and non-biological extraction. Biological production can move through processing, manufacturing, distribution and markets; non-biological extraction can move through beneficiation, processing, manufacturing, infrastructure and markets. In both cases, the focus is on carrying value further through the system and expanding the productive activity generated along the way.
The scale of the employment challenge provides an important reference point. The working scenario starts from approximately 12.073 million formal jobs and applies differentiated growth rates across successive periods, allowing the employment trajectory to develop over time.
Using the working population trajectory of approximately 65 million in 2026 rising to 82.5 million by 2056, the table shows:
| Horizon | Year | Total Population | Formal Employment Scenario | % of Total Population in Formal Employment | Additional Jobs from 2026 |
|---|---|---|---|---|---|
| Starting point | 2026 | 65.00 million | 12.07 million | 18.6% | — |
| 5 years | 2031 | 67.76 million | 14.69 million | 21.7% | +2.62 million |
| 10 years | 2036 | 70.65 million | 18.75 million | 26.5% | +6.67 million |
| 20 years | 2046 | 76.82 million | 33.57 million | 43.7% | +21.50 million |
| 30 years | 2056 | 82.50 million | 54.69 million | 66.3% | +42.61 million |
Working scenario, not a forecast.
Important: the intermediate population figures are derived from the working 65 million → 82.5 million population trajectory; they are not additional official population forecasts. The employment figures remain the working scenario, not a forecast.
These numbers do not claim that the proposed corridors will automatically produce these jobs. They establish the scale of productive expansion that would need to occur if South Africa is to substantially increase formal economic participation over the coming decades. The next stage of the research is therefore to determine how much employment and income could potentially be carried by the productive pipelines emerging from the provincial analysis.
Why These Corridors?
The proposed corridors begin with the productive relationships that the analysis suggests should be examined across provincial boundaries. Infrastructure follows from understanding those relationships and determining what is required to strengthen them.
South Africa may already have identified many of the geographical, industrial and logistical relationships reflected in these corridors. The deeper question is why those relationships have produced the levels of value creation, employment and household income they have, and what would enable them to produce more.
The initial corridor hypotheses include a biological production relationship connecting Free State, KwaZulu-tal and Gauteng; mineral value capture connecting the Northern Cape towards the Cape ports; a mineral, energy and biomass relationship connecting Mpumalanga with Gauteng and the Richards Bay and Maputo systems; a SADC production relationship running through Limpopo and Gauteng towards Zimbabwe and the wider SADC market; and an industrial reconnection between Eastern Cape, inland production areas and the ports.
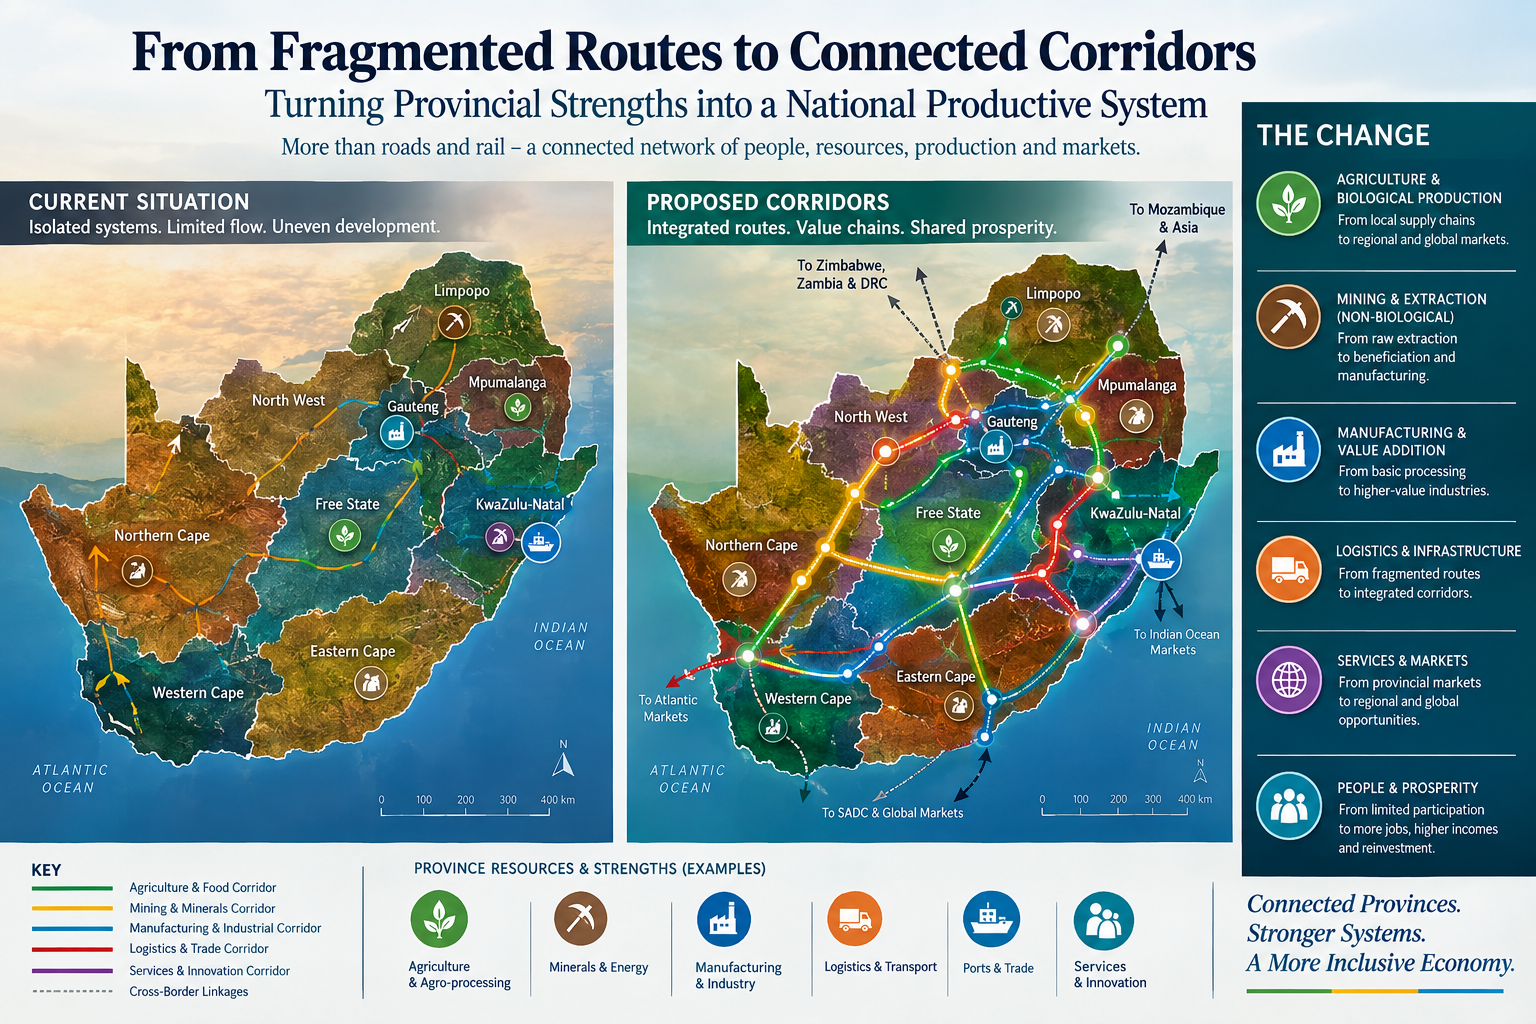
These are productive-system hypotheses: places where production, extraction, processing, manufacturing, logistics and markets may already be connected in ways that warrant closer examination.
The question is whether these relationships can be understood as parts of a more deliberate pipeline. When biological production and non-biological extraction move through processing, beneficiation, manufacturing, logistics and markets across provincial boundaries, employment and income can be generated at multiple points along the chain, extending the value created from the original production or extraction.
Why the Provincial Conversation Cannot Stop at the Provincial Boundary
The provincial analysis begins to reveal productive relationships extending beyond provincial boundaries. Production, processing, manufacturing, energy, logistics and markets interact across borders, creating opportunities to connect productive capacities so that value created in one part of the system generates further activity elsewhere.
The corridor question therefore extends beyond transport to how the capabilities of one part of the system connect with another, and what happens when those relationships are weak, fragmented or poorly understood.
South Africa may already have considered many of these relationships through previous plans, corridors and development strategies. The question is why the system has moved as it has, and what would enable it to move further, given the knowledge, resources, institutions and plans built over time.
This is also why the pipeline must be considered alongside people. The productive chain is ultimately productive capacity → processing → manufacturing → services → markets → employment → household income → reinvestment, with each stage influencing what becomes possible further along the chain.
Why Does the System Keep Reproducing the Issue?
At this point, the analysis returns to the question with which it began: what is the structure of the economy organising people to do?
Are the hands, intentions and minds of the population being increasingly engaged in productive activity, or is the system increasingly organised around managing the consequences of people remaining outside it? This shifts the conversation from relief for unemployment towards understanding the structures that determine whether people can participate in production, value addition and the creation of economic capacity.
This is the distinction between addressing a visible condition and understanding the structures that keep producing it. A persistent issue can survive repeated interventions when those interventions provide relief or partial movement without changing the relationships that reproduce the underlying condition.
This systems-thinking question sits behind the STRLDi work. The Institute’s foundational research on persistent unemployment in Botswana was undertaken to understand why a persistent issue remains persistent despite interventions intended to address it. The study provides the foundation for looking beyond the visible symptom to the structures, relationships and mental models contributing to its continued reproduction; it provides the research approach rather than a direct diagnosis of South Africa.
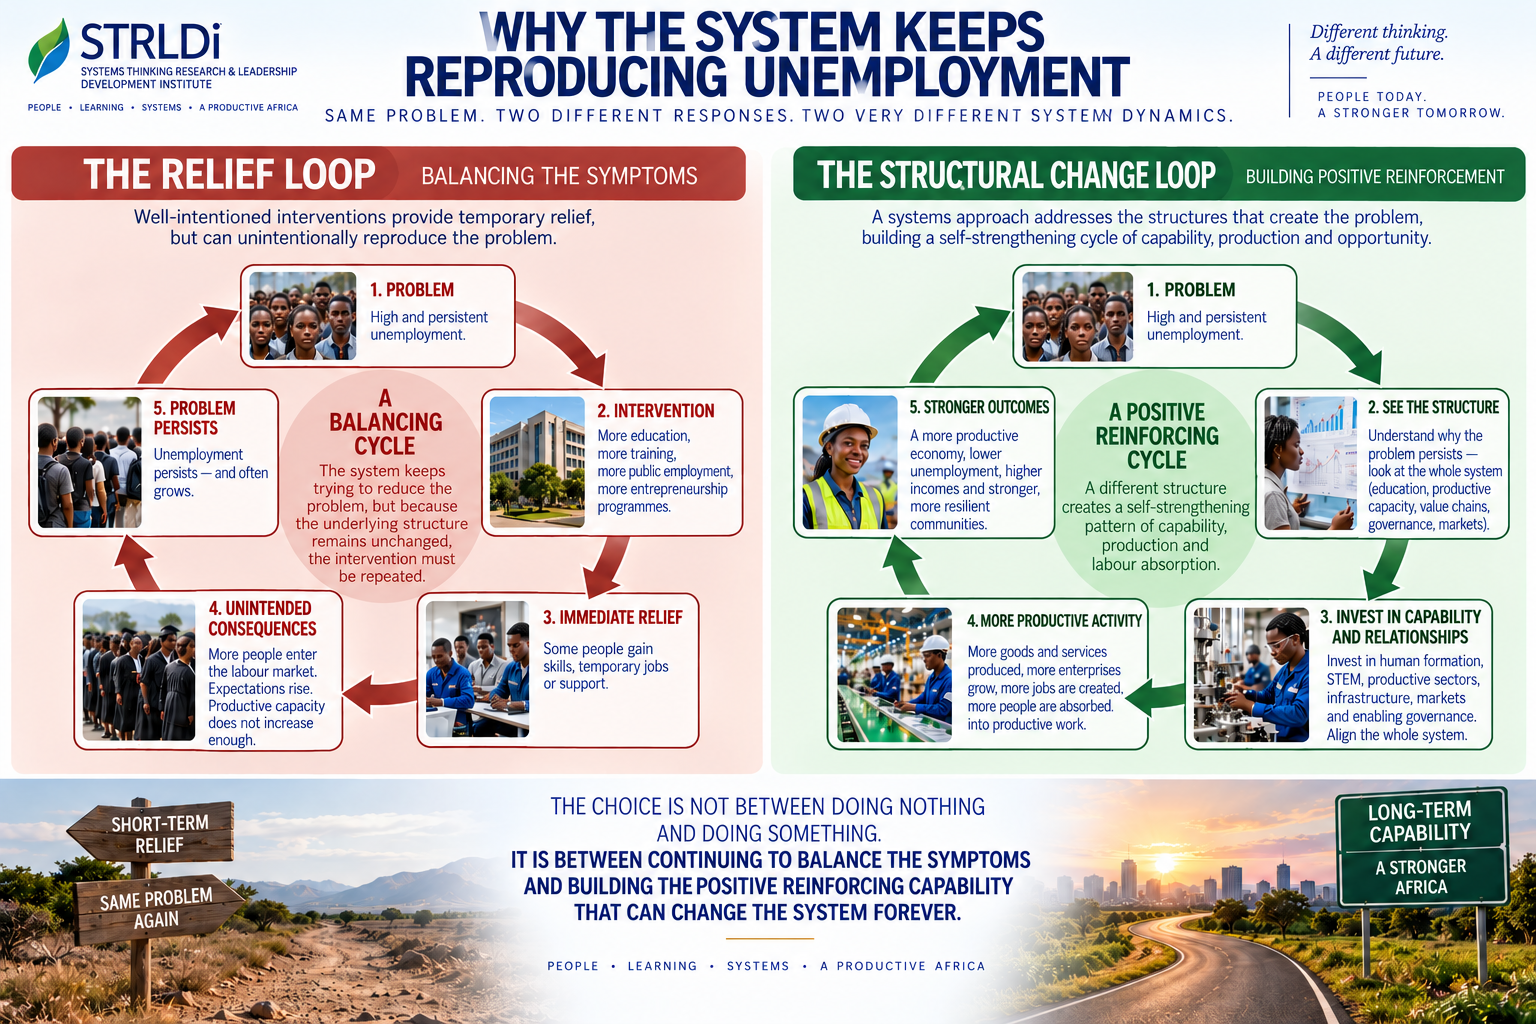
The distinction between the Relief Loop and the Structural Change Loop captures this difference: one continues to intervene around symptoms and obtain temporary relief; the other asks what must change in the structure for a different pattern of behaviour to reproduce itself.
That is the point of inflection this analysis is intended to create.
The Point of Inflection
The twenty-year provincial analysis brings the question back to the productive structure that sits beneath unemployment. The STRLDi unemployment study in Botswana began from the same fundamental concern: understanding why unemployment persists despite repeated interventions. Study Unemployment — The Report The South African analysis now extends that line of inquiry into productive sectors, asking where agriculture, extraction, manufacturing, services and knowledge activity are creating value, and how those productive relationships can engage more people.
The implications extend into education and human formation, household dynamics and the construction of productive pipeline spines. A pipeline spine connects productive capacity to processing, manufacturing, markets and reinvestment; its physical expression may include roads, rail, ports and other infrastructure, but the spine is the economic relationship, not the vehicle or infrastructure carrying it. This is the same question raised in What Will Botswana Put on 40 Locomotives? — what must the productive economy build so that infrastructure becomes economically necessary and increasingly utilised? What Will Botswana Put on 40 Locomotives?
The purpose of the initial engagement is to share the findings, put the assumptions before those who understand the provincial realities, allow the analysis to be interrogated, and determine whether what is being observed in the data corresponds with what is happening on the ground. What is learned then becomes part of the next conversation.
This is why the engagement sequence matters. The first province is not necessarily the most important province; it is the first point of learning. The next province provides another part of the system, and the sequence progressively builds the understanding required to examine the national picture.
Why Start With National and Provincial Planning?
This thinking is required across government, business, institutions, communities and households. The public sector is a necessary starting point because national and provincial governments have the mandate and institutional reach to see across the parts of the system that individual organisations cannot see on their own.
National planning shapes many of the conditions within which productive systems operate — infrastructure, human formation, public investment, land, regulation, institutional coordination, economic priorities and intergovernmental relationships. Business, communities and other institutions provide essential productive capacity and execution, while the public sector provides a vantage point from which the system as a whole can be seen and coordinated.
The objective is therefore to enable government to create the conditions for the country’s distributed productive capabilities to connect and reinforce one another, while business and other actors bring the capacity to produce, process, manufacture, distribute and invest.
The Development Pathway: From Research to Productive Transformation
Whether undertaken at national level or through the Office of the Premier, the pathway begins with leadership engaging deeply with the research and then building the capability to carry the work forward within its own system.
1. Study the Research and Establish the Diagnostic Base
Leadership studies the STRLDi research, including the unemployment study and the productive-systems analysis, and uses these as the starting point for mapping its own research agenda.
The objective is to understand the persistent issues affecting the province or country, identify the structures reproducing them, and determine the productive pathways through which those structures could begin to change.
National or provincial leadership first completes an initial (pre-contract) three-day Executive Systems Programme, followed by a 25-day modular programme equivalent to a postgraduate certification, equipping leadership with the frames and tools to discover, understand, and work with dynamic complexity. This begins to shift the way leadership sees and approaches complexity, distinguishing the muscles required to manage detail complexity—likened to running a sprint—from those required to work with dynamic complexity, where persistent problems exist, which is more like running a marathon.
https://strldi.weebly.com/executive-systems-programme-landingpage.html
2. Engage the Population
The leadership then engages the population in understanding what the province needs to know about itself in order to make the shift.
This creates a research process grounded in the lived reality of households, workers, businesses, institutions, communities and other actors who participate in — or remain outside — the productive system.
3. Regear Education and Public-Service Capability
In parallel, education begins to shift towards the capabilities required by the emerging productive system, with STEM re-geared across both education and the public service.
This is human formation for the productive pathway: developing the knowledge, thinking, technical capability and institutional capacity required to participate in and coordinate a changing economy.
4. Build Systems-Thinking Capability Within Government
At the same time, the province identifies other persistent issues, their leverage points and their relationships to the broader system, integrating these findings into provincial strategic planning.
A basic systems-thinking course is developed and progressively led by provincial staff, beginning to build understanding among ministerial and senior leadership within the province. The capability therefore becomes progressively embedded within the institution itself.
5. Build the Economic Pipeline
Planning then turns explicitly to the economic growth pipeline: demand, throughput and supply spines.
The province begins mapping where demand exists, what productive capacity can meet that demand, what throughput is required between production and markets, and where the critical economic spines need to be developed.
6. Build the Production Pipelines
The economic map is translated into actual production pipelines — connecting biological production and extraction with processing, manufacturing, logistics, markets and reinvestment.
This is where the productive relationships identified through research begin to become development programmes and investment pathways.
7. Monitor the Movement of the Needle
The province establishes a disciplined process for observing whether the system is changing.
The question becomes: Is the needle moving? Are productive capacities expanding? Are more people entering productive activity? Is value moving further through the pipeline? Are employment, household income and reinvestment responding?
The monitoring therefore looks for movement in the system, rather than simply measuring completion of departmental programmes.
8. Build the Next Layer of Provincial Capability
While the first phase is being implemented, the province simultaneously develops the capability required for subsequent phases.
The leadership that began by studying the research progressively becomes capable of conducting its own research, identifying persistent issues, finding leverage points, designing productive pathways, coordinating implementation and learning from the movement of the system.
That gives the pathway a very different character:
Research → Population engagement → Human formation → Systems capability → Economic pipeline → Production pipelines → Monitoring → Institutional capability
And critically, the capability remains with the province. STRLDi provides the methodology, research foundation and developmental pathway; the provincial leadership progressively develops the capacity to carry the work itself.
This is the practical meaning of the three phases you have established:
Phase I — Provinces 1–3: establish and work through the pathway.
Phase II — Provinces 5–7: extend the pathway while building greater provincial capability.
Phase III — Provinces 4, 8 and 9: apply the accumulated learning across the remaining major productive systems.
The provinces therefore become progressively more capable while the research itself moves forward.
STRLDi: From Understanding Today to Transforming Tomorrow
This is where the work of STRLDi becomes relevant. The Institute’s research is concerned with persistent issues and with identifying the structures and relationships that keep reproducing those issues despite repeated interventions. The purpose is not simply to relieve the symptoms of a persistent problem, but to understand what keeps producing them and where intervention can change the structure itself.
The provincial GVA analysis is one expression of that approach. It is an attempt to see the productive system beneath the movement of money, to identify where productive capacity has been retained or advanced, and to examine what relationships could enable that capacity to engage more people in productive activity and generate greater employment and value creation. The research is therefore not starting from the assumption that the provinces have done nothing; it is starting from what the data shows they have been doing and asking what more may become possible.
STRLDi was established around a different premise from conventional problem-solving: that persistent issues need to be understood as systems before lasting change can be designed. Its work begins with study and understanding, moves through causal analysis and identification of leverage areas, and then seeks to develop the capability to observe, learn, recalibrate, and apply that learning to national development.
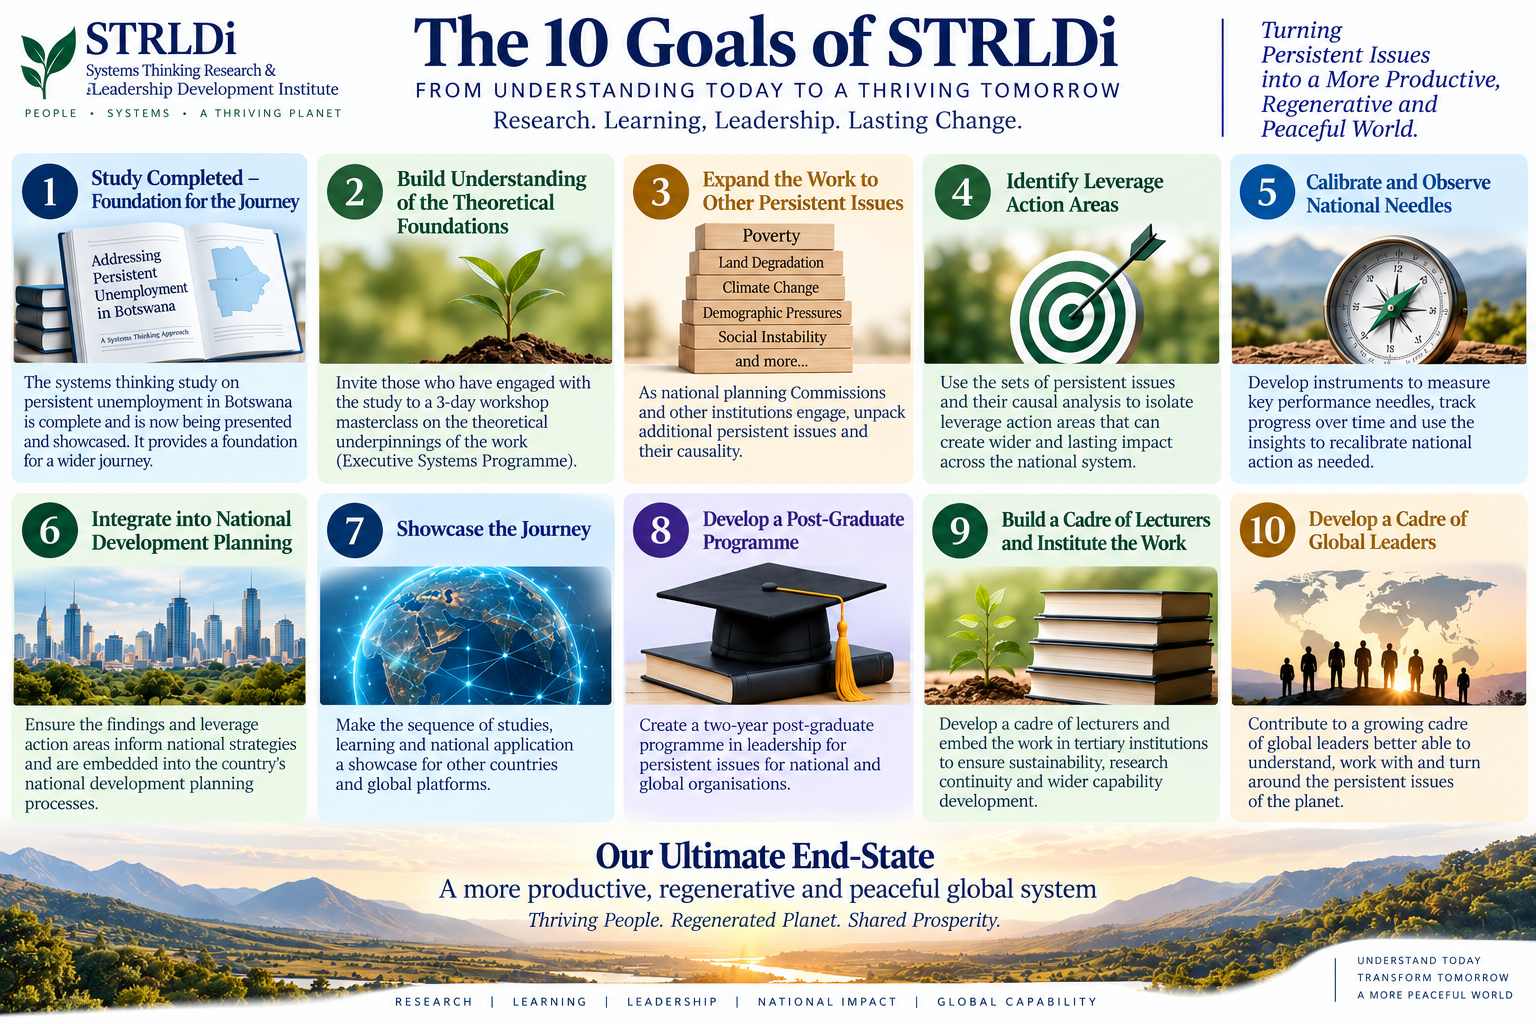
The Institute’s ten goals express that journey: complete the foundational study; build understanding of the theoretical foundations; expand the work to other persistent issues; identify leverage action areas; calibrate and observe national needs; integrate findings into national development planning; showcase the journey; develop postgraduate learning; build a cadre of lecturers and institutional capability; and ultimately contribute to a cadre of global leaders able to work with persistent issues.
The purpose is not simply to produce research papers. It is to build a repeatable capability for turning understanding into action and action into lasting change.
The End-Goal
The ultimate end-goal of the work is broader than any one province, sector or employment programme: a more productive, regenerative and peaceful global system.
That means thriving people with meaningful opportunities to contribute; productive and resilient economies capable of generating sufficient opportunities; regenerated ecosystems and responsible stewardship of the planet’s resources; capable nations that can anticipate and address persistent issues; and global systems characterised by greater stability, cooperation and shared prosperity.
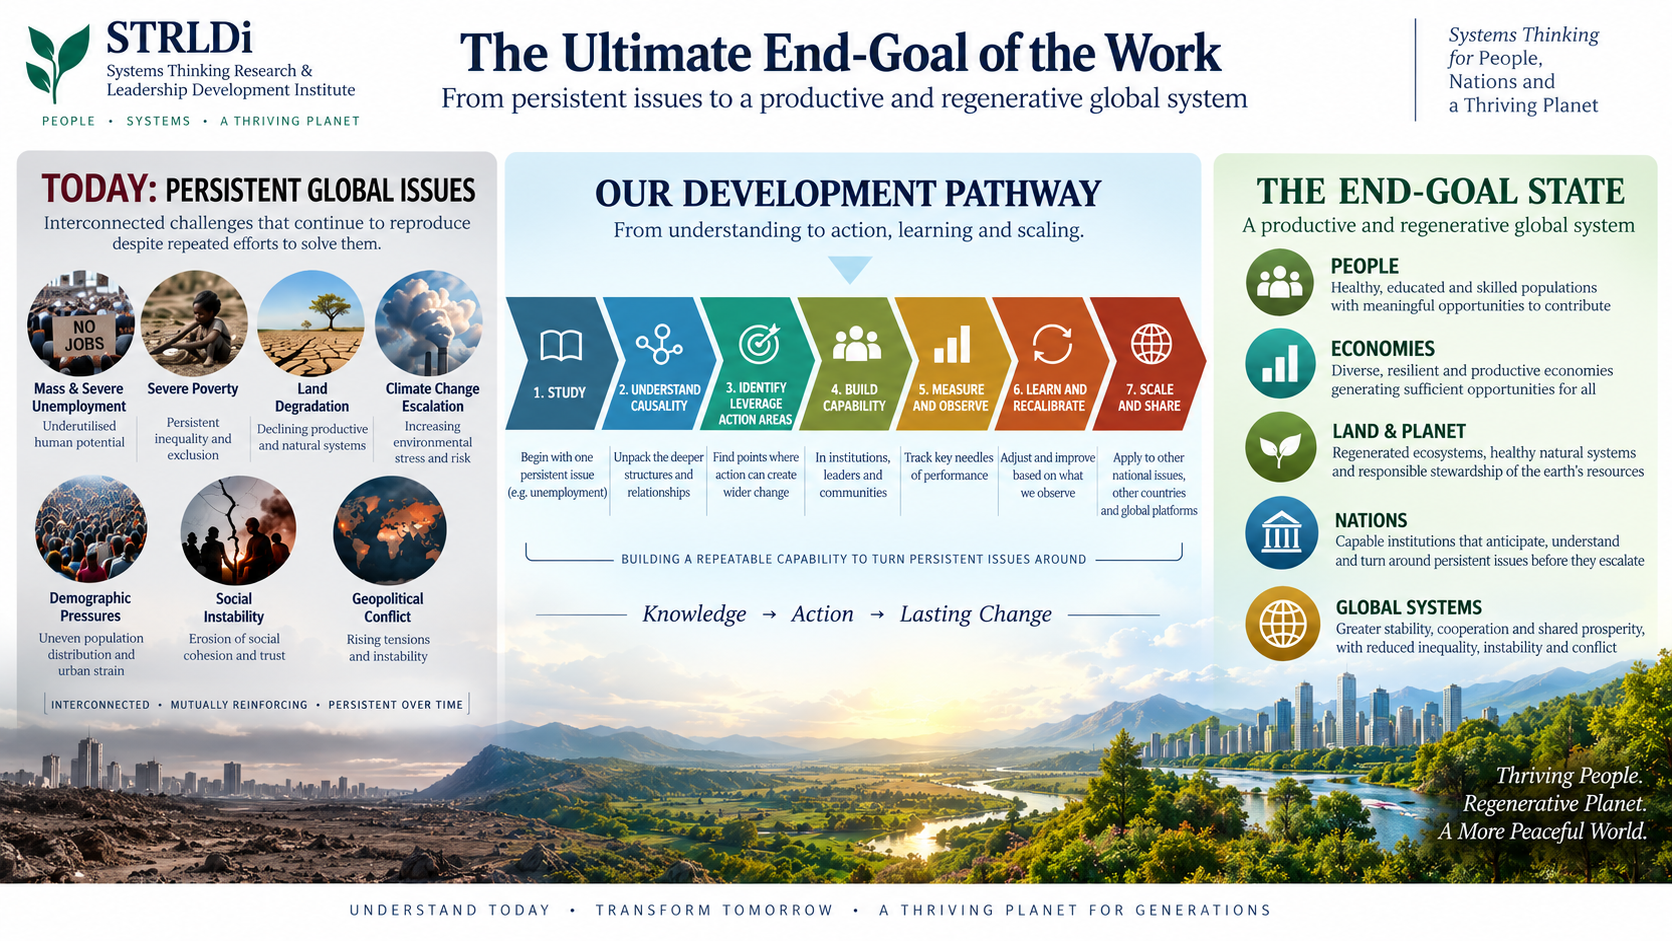
The provincial productive-system analysis is therefore one part of a much larger journey. It provides a practical opportunity to apply systems thinking to a national economic question, learn from the way the system is actually behaving, identify where leverage may exist, and determine what needs to change before attempting to prescribe what should happen next.
An Invitation to Engage — Botswana
I am making the initial sharing of this research available without a fee to provincial leadership interested in examining these questions. The purpose is not to sell a predetermined programme or arrive with an answer that provincial leadership is expected to adopt; it is to share the findings, subject them to interrogation, test the assumptions and determine whether there is a basis for taking the work further.
Where there is interest, STRLDi can facilitate a focused half-day working session or a more concentrated retreat with provincial leadership and the relevant technical teams. STRLDi is based in Botswana, and provincial leadership is welcome to come to Botswana for such a session, providing an opportunity to step away from the immediate institutional environment and spend focused time examining the findings and the questions arising from them.
The conversation would begin with the evidence and with what has actually happened over time. The purpose is to find the point at which understanding can lead to a different question, a different intervention and, ultimately, a different pattern of system behaviour.
TL;DR – Key Learnings: South Africa’s Productive Systems Analysis (2004-2024)
Core Analytical Framework
The Five-Sector Productive Structure
- Primary Extraction → Primary Production → Secondary → Tertiary → Quintenary
- Uses Gross Value Added (GVA) rather than monetary flows to reveal where actual value creation occurs
- Focuses on “where hands, intentions and minds of people are engaged in productive activity”
Dual Lens Approach
- Inter-provincial: How each province ranks against the other eight within each sector
- Intra-provincial: How the five sectors rank within each province
Critical Findings
Stability as a System Signal
- All 9 provinces maintained unchanged Primary Extraction rankings over 20 years
- Stability itself requires understanding—it reveals structures that reproduce particular outcomes
- Persistence is a feature of systems, not evidence of inaction
Three Priority Provinces Identified
Free State, Mpumalanga, and KwaZulu-Natal distinguished by:
- Sustained focus on agriculture and manufacturing despite challenges
- Sectors enabling direct population participation in value creation
- Resistance to drift toward service-only economies
Notable Provincial Movements
- Gauteng: Dominant in Secondary, Tertiary, Quintenary (all rank 1), but Primary Production declined (6→8)
- Eastern Cape: Improved Primary Production (9→7) while maintaining other positions
- Mpumalanga: Advanced in Secondary (+1) and Tertiary (+2)
- Free State: Significant Quintenary decline (-3)
Conceptual Distinctions
Relief Loop vs. Structural Change Loop
- Relief Loop: Addresses symptoms, provides temporary solutions, system returns to original state
- Structural Change Loop: Changes underlying structures that reproduce problems
- Key insight: Persistent issues survive when interventions provide relief without changing reproducing relationships
Pipeline vs. Infrastructure
- Pipeline spine = the economic relationship connecting production→processing→manufacturing→markets→reinvestment
- Infrastructure (roads, rail, ports) is the vehicle carrying the relationship, not the relationship itself
- Question: “What will the economy put on the infrastructure?” (productive capacity must precede infrastructure investment)
Productive Structure vs. Money Movement
- Economy must be examined by where people create value, not where money circulates
- Employment absorption requires productive capacity, not just financial flows or relief programs
Strategic Implications
Engagement Sequence (Not Ranking)
Phase I: Free State → Mpumalanga → KwaZulu-Natal
Phase II: Northern Cape → Limpopo → North West
Phase III: Eastern Cape → Western Cape → Gauteng
Rationale: Begin where agriculture and manufacturing remain strong, offering greater employment absorption potential
Five Corridor Hypotheses
Cross-provincial productive relationships:
- Biological production: Free State → KwaZulu-Natal → Gauteng
- Mineral value capture: Northern Cape → Cape ports
- Mineral/energy/biomass: Mpumalanga → Gauteng → Richards Bay/Maputo
- SADC production: Limpopo → Gauteng → Zimbabwe/SADC
- Industrial reconnection: Eastern Cape → inland → ports
Employment Scale Challenge
Working scenario (not forecast):
- 2026: 12.07M formal jobs (18.6% of 65M population)
- 2031: 14.69M jobs (21.7%) — +2.62M jobs needed
- 2046: 33.57M jobs (43.7%) — +21.5M jobs needed
- 2056: 54.69M jobs (66.3%) — +42.61M jobs needed
Systems Thinking Methodology
STRLDi’s Approach
- Study persistent issues as systems, not isolated problems
- Understand structures that reproduce outcomes over time
- Identify leverage points for structural change
- Build capability to observe, learn, recalibrate
- Develop cadre of systems-capable leaders
Key Question Framework
- Not “why hasn’t anything happened?” but “what structures have continued to reproduce this position?”
- Not “what should we do?” but “what is the system organizing people to do?”
- Not “how do we create jobs?” but “where can productive capacity engage people in value creation?”
The Development Pathway
Eight-Stage Process
- Study research and establish diagnostic base
- Engage population to understand lived reality
- Regear education and public-service capability (STEM focus)
- Build systems-thinking capability within government
- Build the economic pipeline (demand, throughput, supply spines)
- Build production pipelines (biological and non-biological)
- Monitor system movement (“Is the needle moving?”)
- Build next layer of provincial capability
Critical feature: Capability remains with the province, not dependent on external consultants
Regional Development Vision
Beyond National Boundaries
- Corridors can become development pathways for landlocked countries
- Southern African productive system where market access accelerates development
- Complementary production across national boundaries
- Infrastructure becomes economically necessary rather than speculative
End Goal (Five-Part Vision)
- Thriving people with meaningful contribution opportunities
- Productive, resilient economies generating sufficient opportunities
- Regenerated ecosystems with responsible stewardship
- Capable nations addressing persistent issues
- Stable global systems with cooperation and shared prosperity
Practical Application
Engagement Model
- No-fee initial sharing with provincial leadership
- Half-day working sessions or focused retreats
- In Botswana (neutral ground away from institutional pressures)
- Purpose: interrogate findings, test assumptions, determine basis for further work
- Start with evidence of what has actually happened, not prescriptions
The Central Question
“The question is not whether South Africa has thought about these issues before. It is why the system has not moved in the way it could have, or why it has moved in the way it has.”
This shifts focus from planning to understanding system behavior and the structures that enable or constrain productive transformation.
Post-Article Reflection: From Provincial Systems to a Southern African Productive System
The provincial analysis opens a further question. What happens when productive corridors extend beyond provincial and national boundaries and begin to connect the productive capacities of Southern Africa?
The significance of such corridors is not only what they do for South Africa. Corridors that connect South African production centres to ports and regional markets can also become pathways for landlocked and developing economies to reach markets more efficiently. Earlier and more reliable access to markets can create the conditions for production to expand, investment to follow, and productive capacity to develop.
This introduces a different dimension to regional development. A corridor is not simply infrastructure connecting two points; it can become a development pathway, linking production to processing, manufacturing and markets across national boundaries. As the productive capacity of one country grows, it can create opportunities for complementary production in another.
For Botswana and other landlocked countries, this raises an important future question: how can national productive capacities connect into the larger corridors being developed around them, so that access to markets becomes an accelerator of development rather than simply a route for imported goods?
The South African provincial analysis therefore opens a much larger field of enquiry — from provincial productive systems, to national corridors, to a connected Southern African productive system in which access to markets can itself become a driver of development.
This is a conversation for the next stage of the work.
Entities Mentioned
Organization
STRLDi (Systems Thinking Research & Leadership Development Institute)
Institute conducting the productive systems analysis; based in Botswana; author’s affiliated organization
Person/Author
sheilasingapore
Strategy Development Consultant; author of the article; works with sectoral, national and regional leaders using The Fifth Discipline tools and practices
Country
South Africa
Subject country of the productive systems analysis, nine provinces studied
Country
Botswana
Base of STRLDi; site of foundational unemployment research; proposed location for engagement sessions
Province (South Africa)
Eastern Cape
Ranked 4th in engagement sequence; improved Primary Production rank
Province (South Africa)
Free State
Ranked 1st in engagement sequence; priority province for agriculture/manufacturing
Province (South Africa)
Gauteng
Ranked 9th (last) in engagement sequence; dominant in Secondary, Tertiary, Quintenary sectors
Province (South Africa)
KwaZulu-tal (KwaZulu-Natal)
Ranked 3rd in engagement sequence; priority province for agriculture/manufacturing
Province (South Africa)
Limpopo
Ranked 6th in engagement sequence; part of SADC production corridor hypothesis
Province (South Africa)
Mpumalanga
Ranked 2nd in engagement sequence; priority province; part of mineral/energy/biomass corridor
Province (South Africa)
North West
Ranked 7th in engagement sequence
Province (South Africa)
Northern Cape
Ranked 5th in engagement sequence; part of mineral value capture corridor
Province (South Africa)
Western Cape
Ranked 8th in engagement sequence
Country
Zimbabwe
Connected via proposed SADC production corridor through Limpopo and Gauteng
Regional Organization/Market
SADC (Southern African Development Community)
Wider regional market connected via proposed production corridor
Location
Richards Bay
Part of mineral, energy and biomass corridor connecting Mpumalanga and Gauteng
Location
Maputo
Part of mineral, energy and biomass corridor connecting Mpumalanga and Gauteng
Key Terms & Definitions
Economic Metric
Gross Value Added (GVA)
Used to identify where economic activity is actually creating value, distinct from monetary flow
Sector
Primary Extraction
First of five sectors in the productive structure framework
Sector
Primary Production
Second sector in the productive structure framework
Sector
Secondary Sector
Third sector in the productive structure framework
Sector
Tertiary Sector
Fourth sector in the productive structure framework
Sector
Quaternary & Quintenary Sector
Fifth sector in the productive structure framework, knowledge-based activity
Conceptual Model
Relief Loop
Continues to intervene around symptoms and obtain temporary relief
Conceptual Model
Structural Change Loop
Asks what must change in the structure for a different pattern of behaviour to reproduce itself
Conceptual Term
Pipeline Spine
The economic relationship connecting productive capacity to processing, manufacturing, markets and reinvestment
Referenced Related Works
- Study Unemployment — The Report: STRLDi’s foundational research on persistent unemployment in Botswana (link: https://strldi.weebly.com/study-unemployment-the-report.html)
- What Will Botswana Put on 40 Locomotives?: LinkedIn article raising the question of what the productive economy must build so that infrastructure becomes economically necessary (link: https://www.linkedin.com/pulse/what-botswana-put-40-locomotives-strldi-kh0jf)
- Executive Systems Programme: See Beyond the Obvious. Lead What Truly Shapes Performance (link: https://strldi.weebly.com/executive-systems-programme-landingpage.html).
- Every organisation eventually reaches a point where experience, expertise and commitment are no longer enough to explain why some problems persist. Strategies are refined, structures are strengthened and new initiatives are introduced, yet familiar patterns continue to reappear in different forms. Leaders often find themselves working harder within increasingly sophisticated organisations while sensing that something more fundamental remains beyond view.
- The Executive Systems Programme has been developed for leaders who recognise this moment. It offers a disciplined way of understanding the relationships, interactions and patterns that shape organisational behaviour over time, enabling decisions that are informed not only by what is immediately visible but also by the deeper structures from which persistent outcomes emerge.
- Beyond the Programme: For many participants, the Executive Systems Programme marks the beginning rather than the conclusion of their engagement with STRLDi. As leaders continue applying systems thinking within their organisations, many choose to deepen their understanding through the Institute’s growing body of publications, practitioner communities and advanced development opportunities. Others engage with STRLDi as research, strategy and leadership partners as new organisational and institutional challenges emerge.


