Identifying System Archetypes from Behaviour Over Time
Instructions
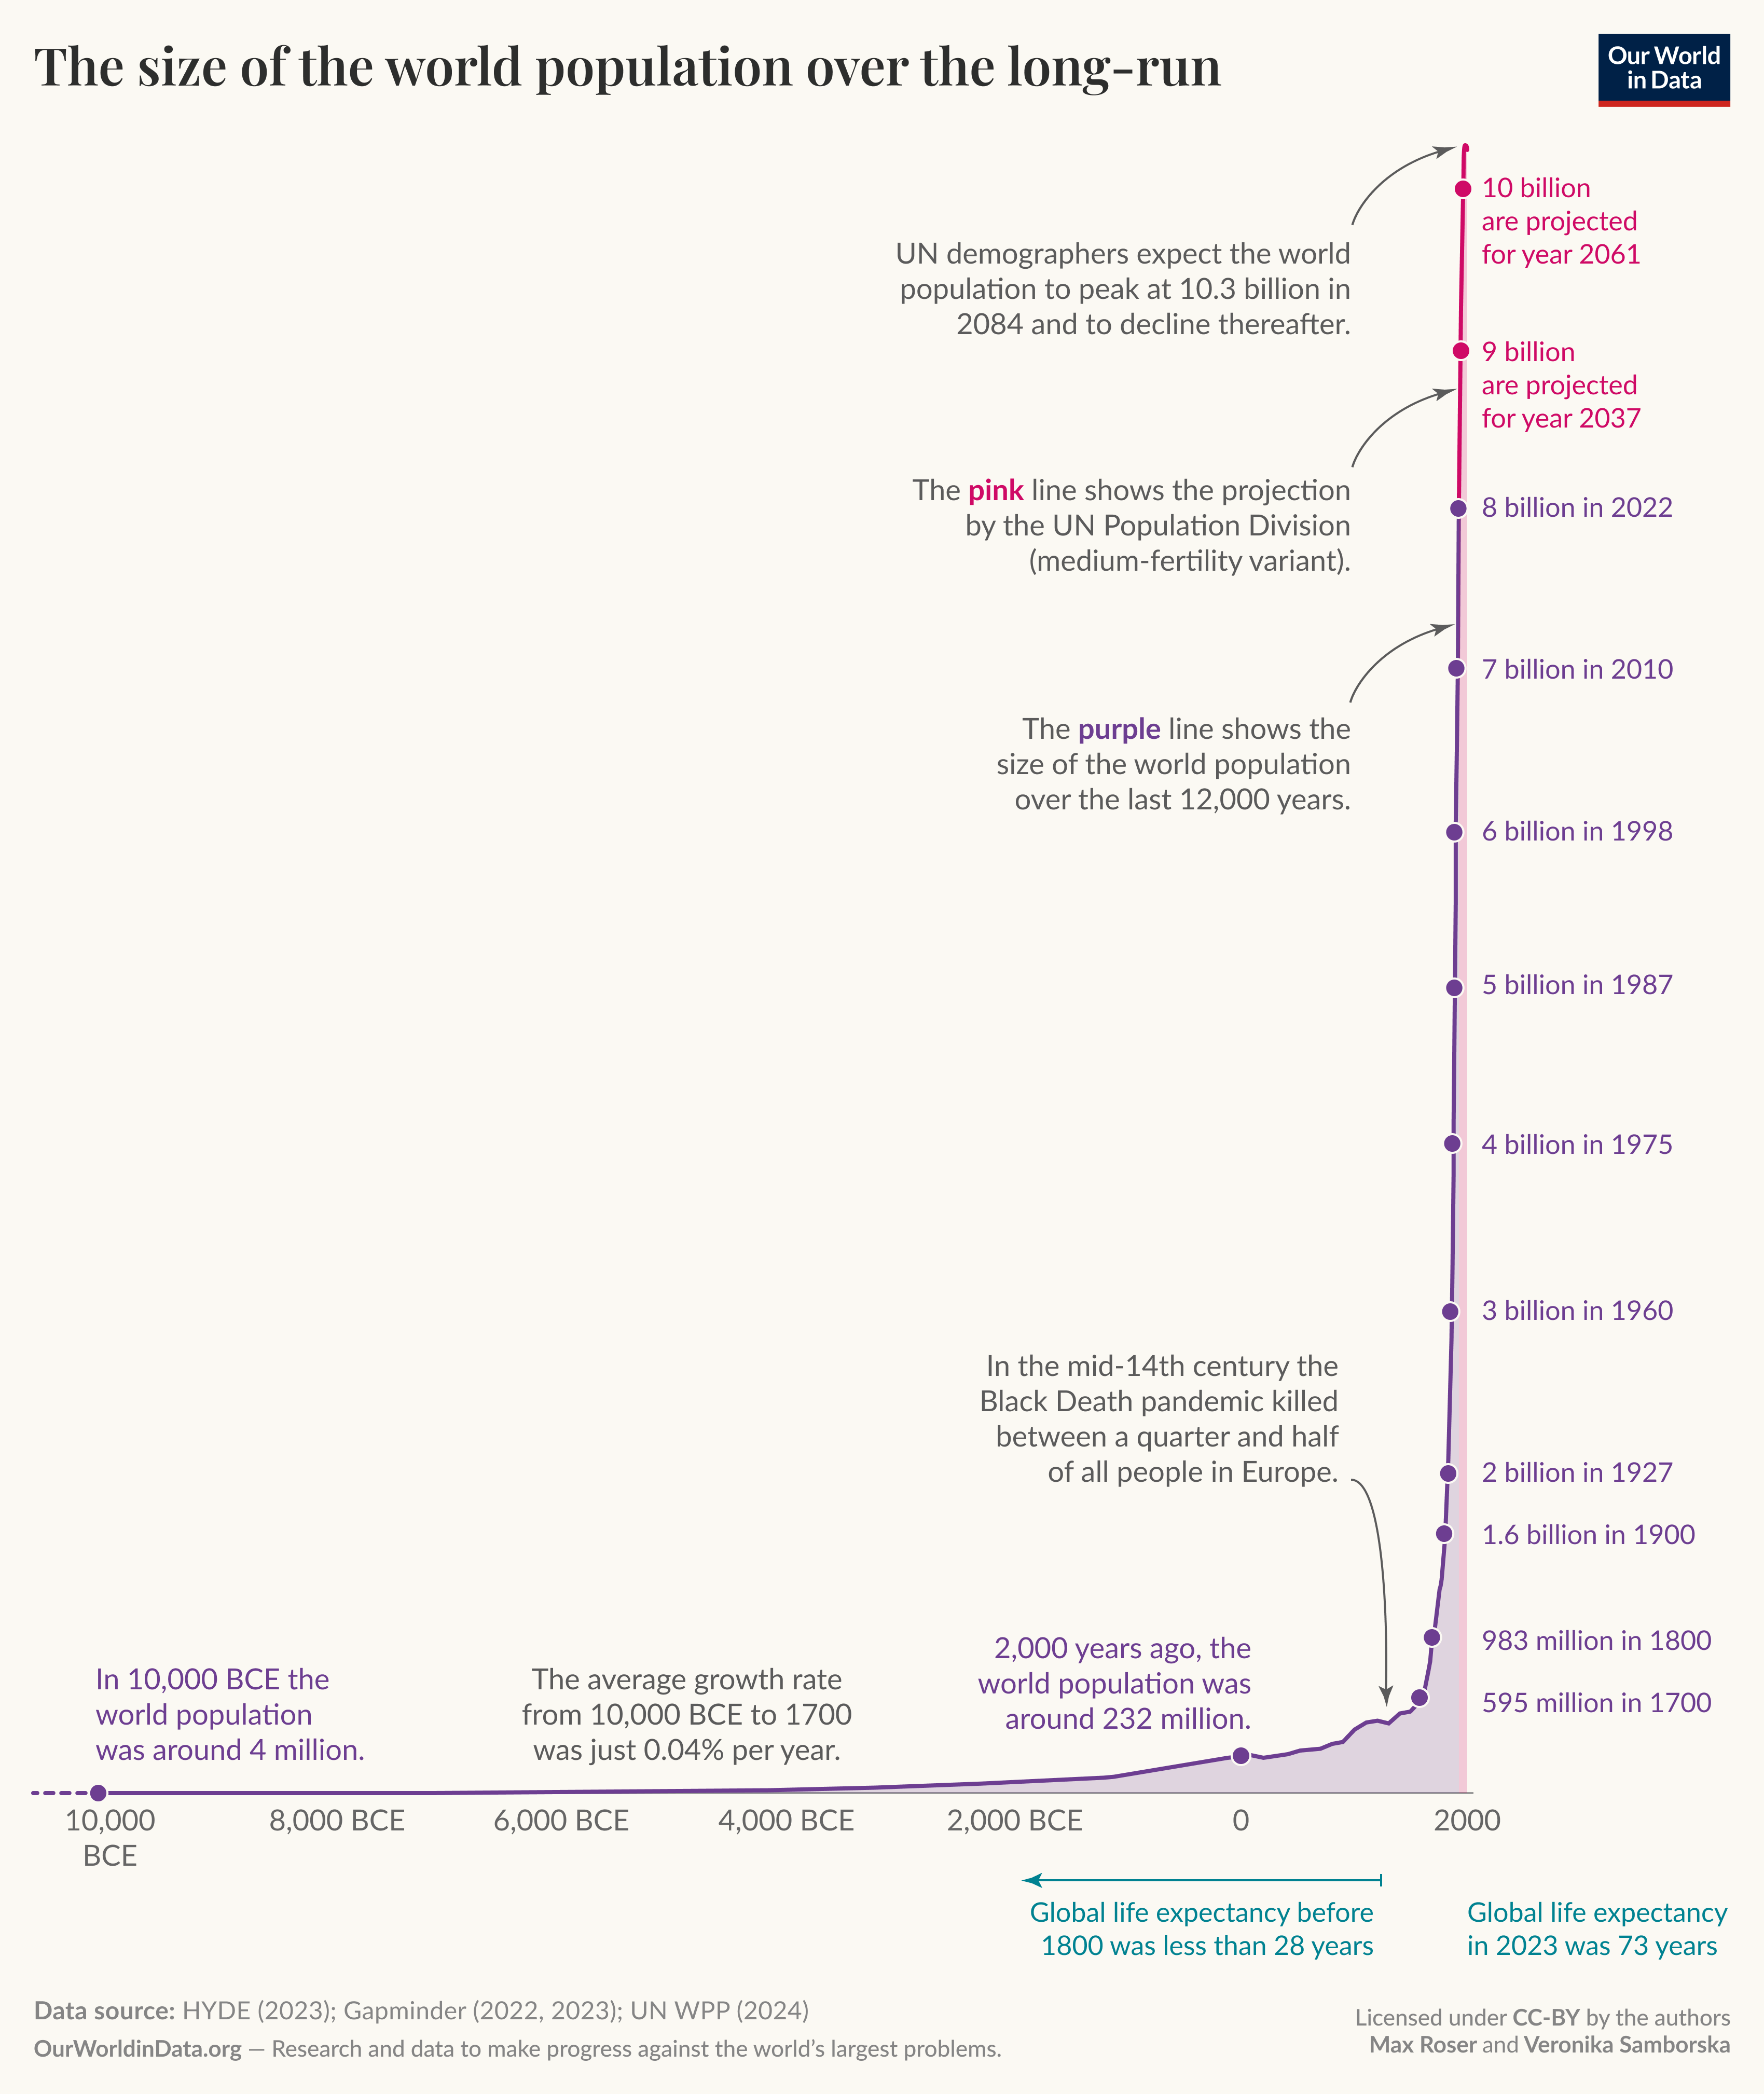
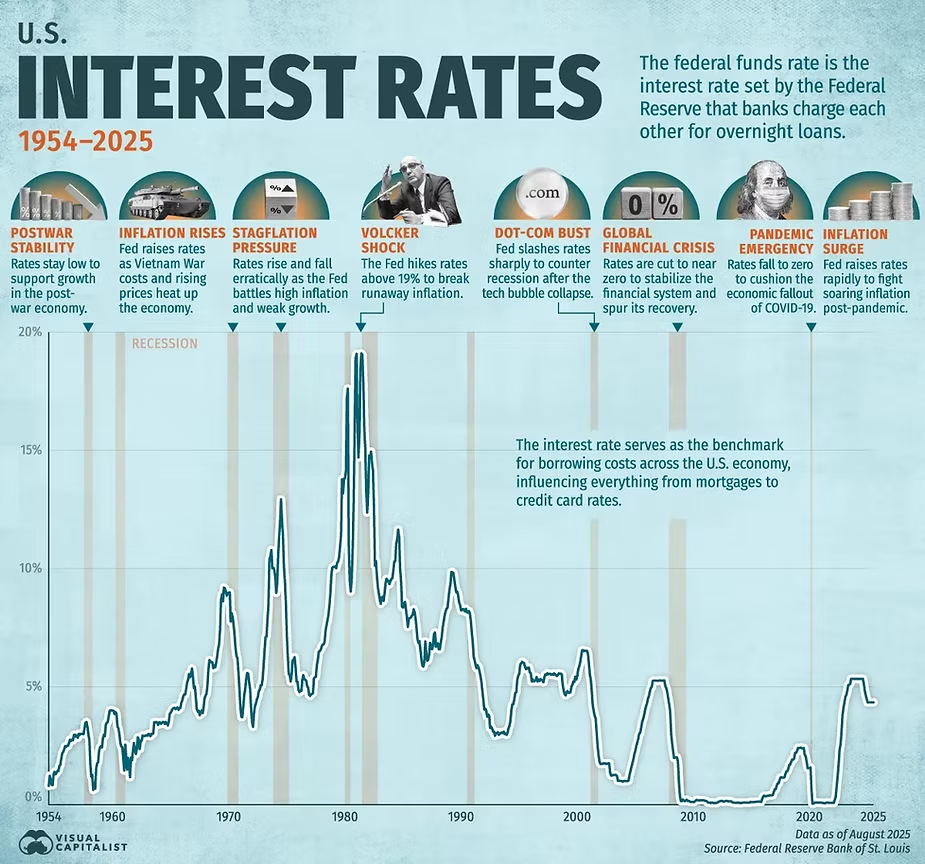
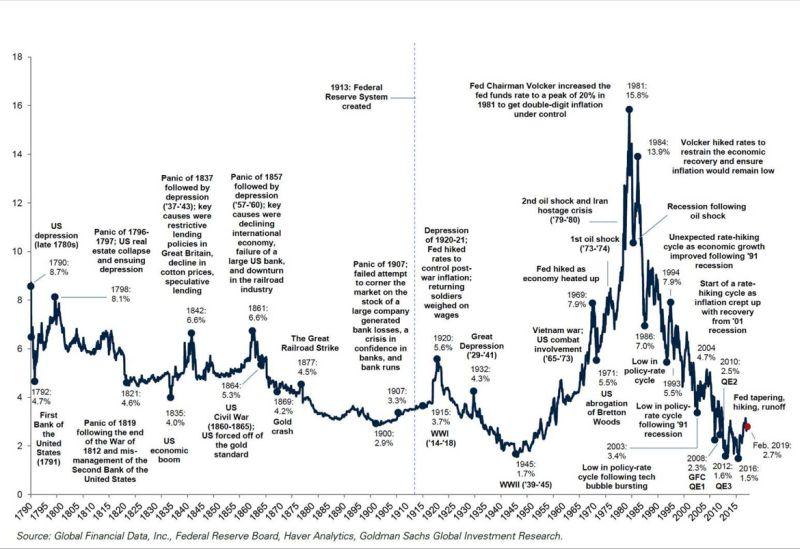
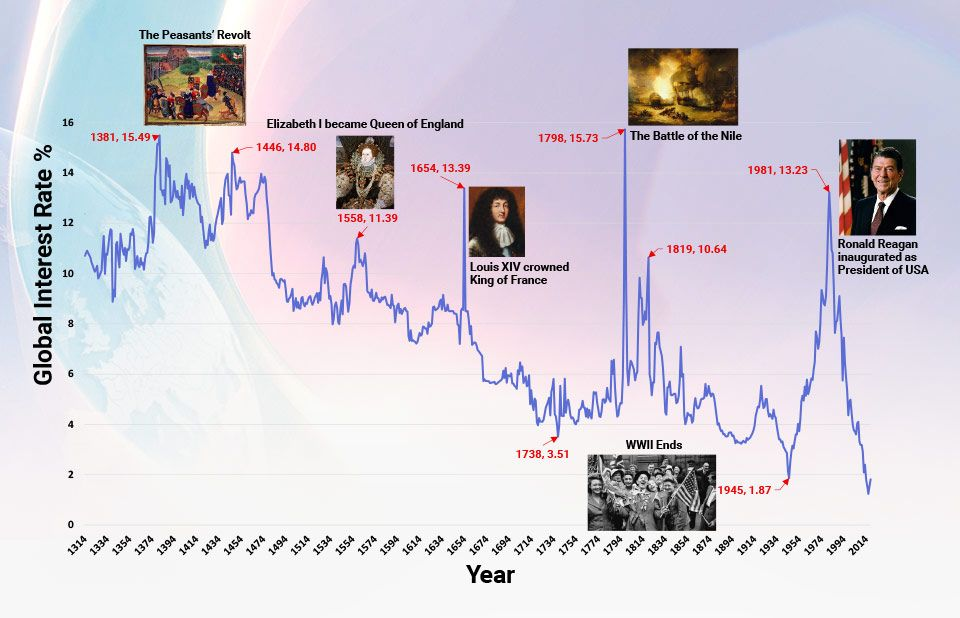
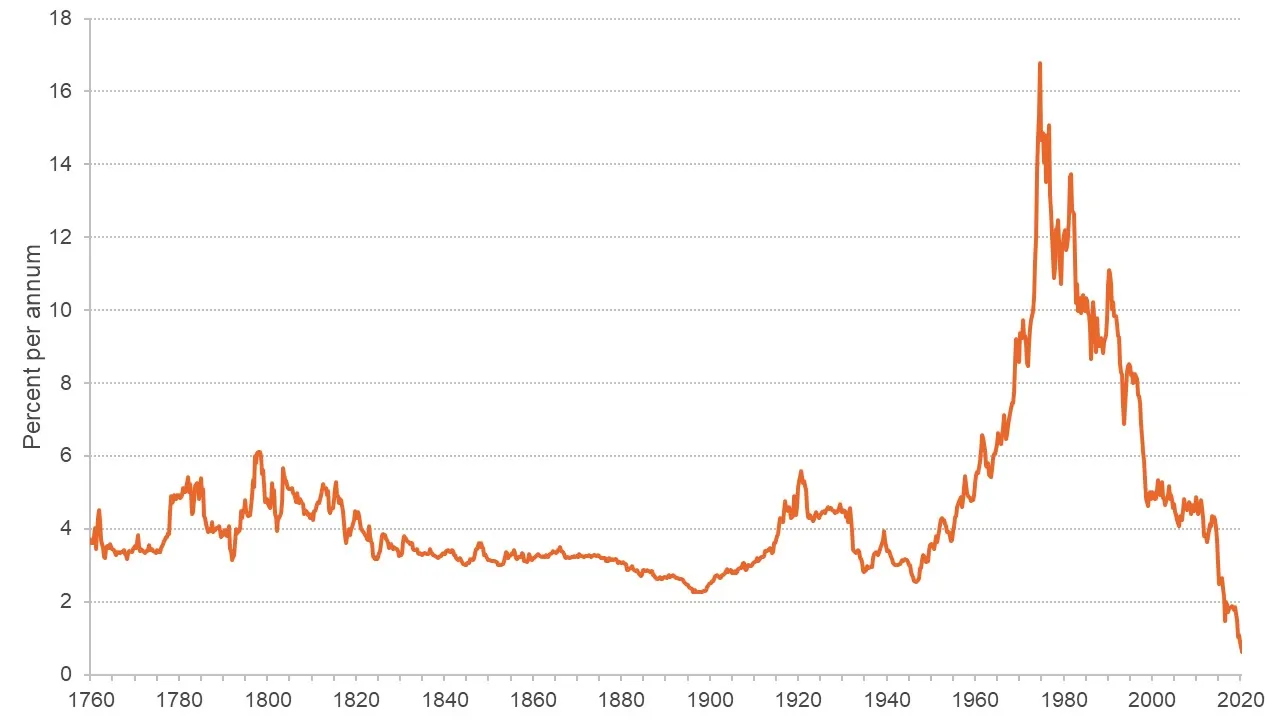
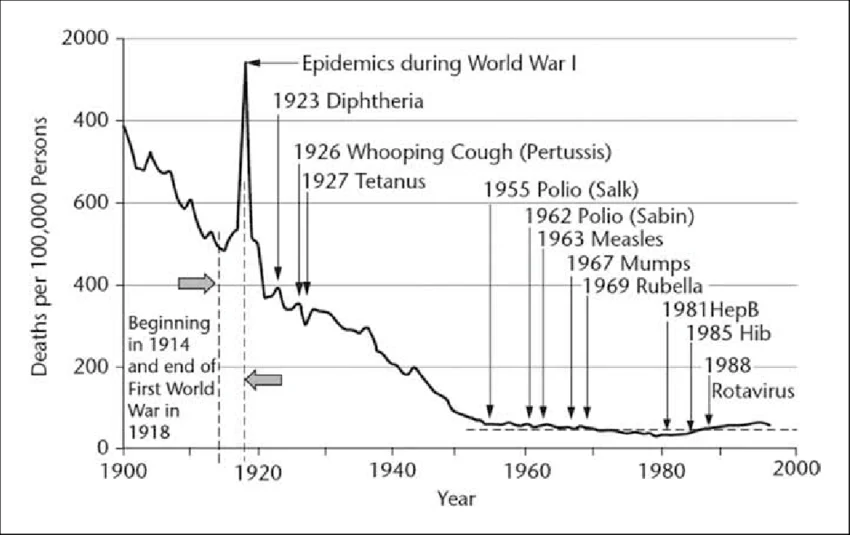
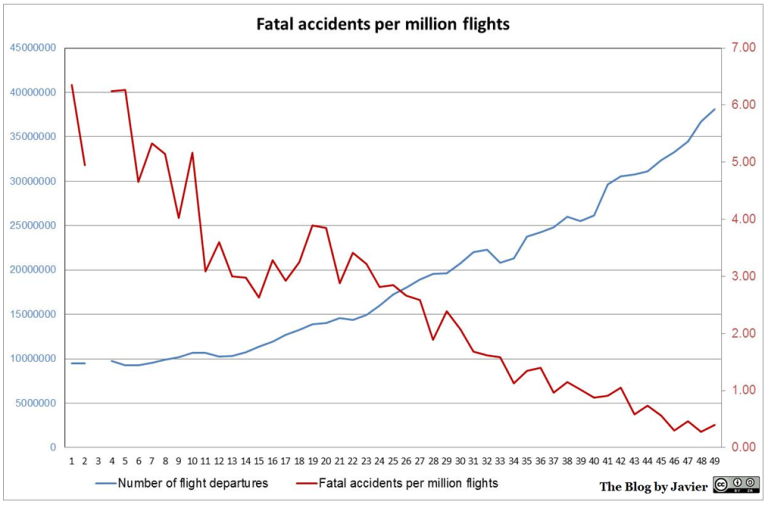
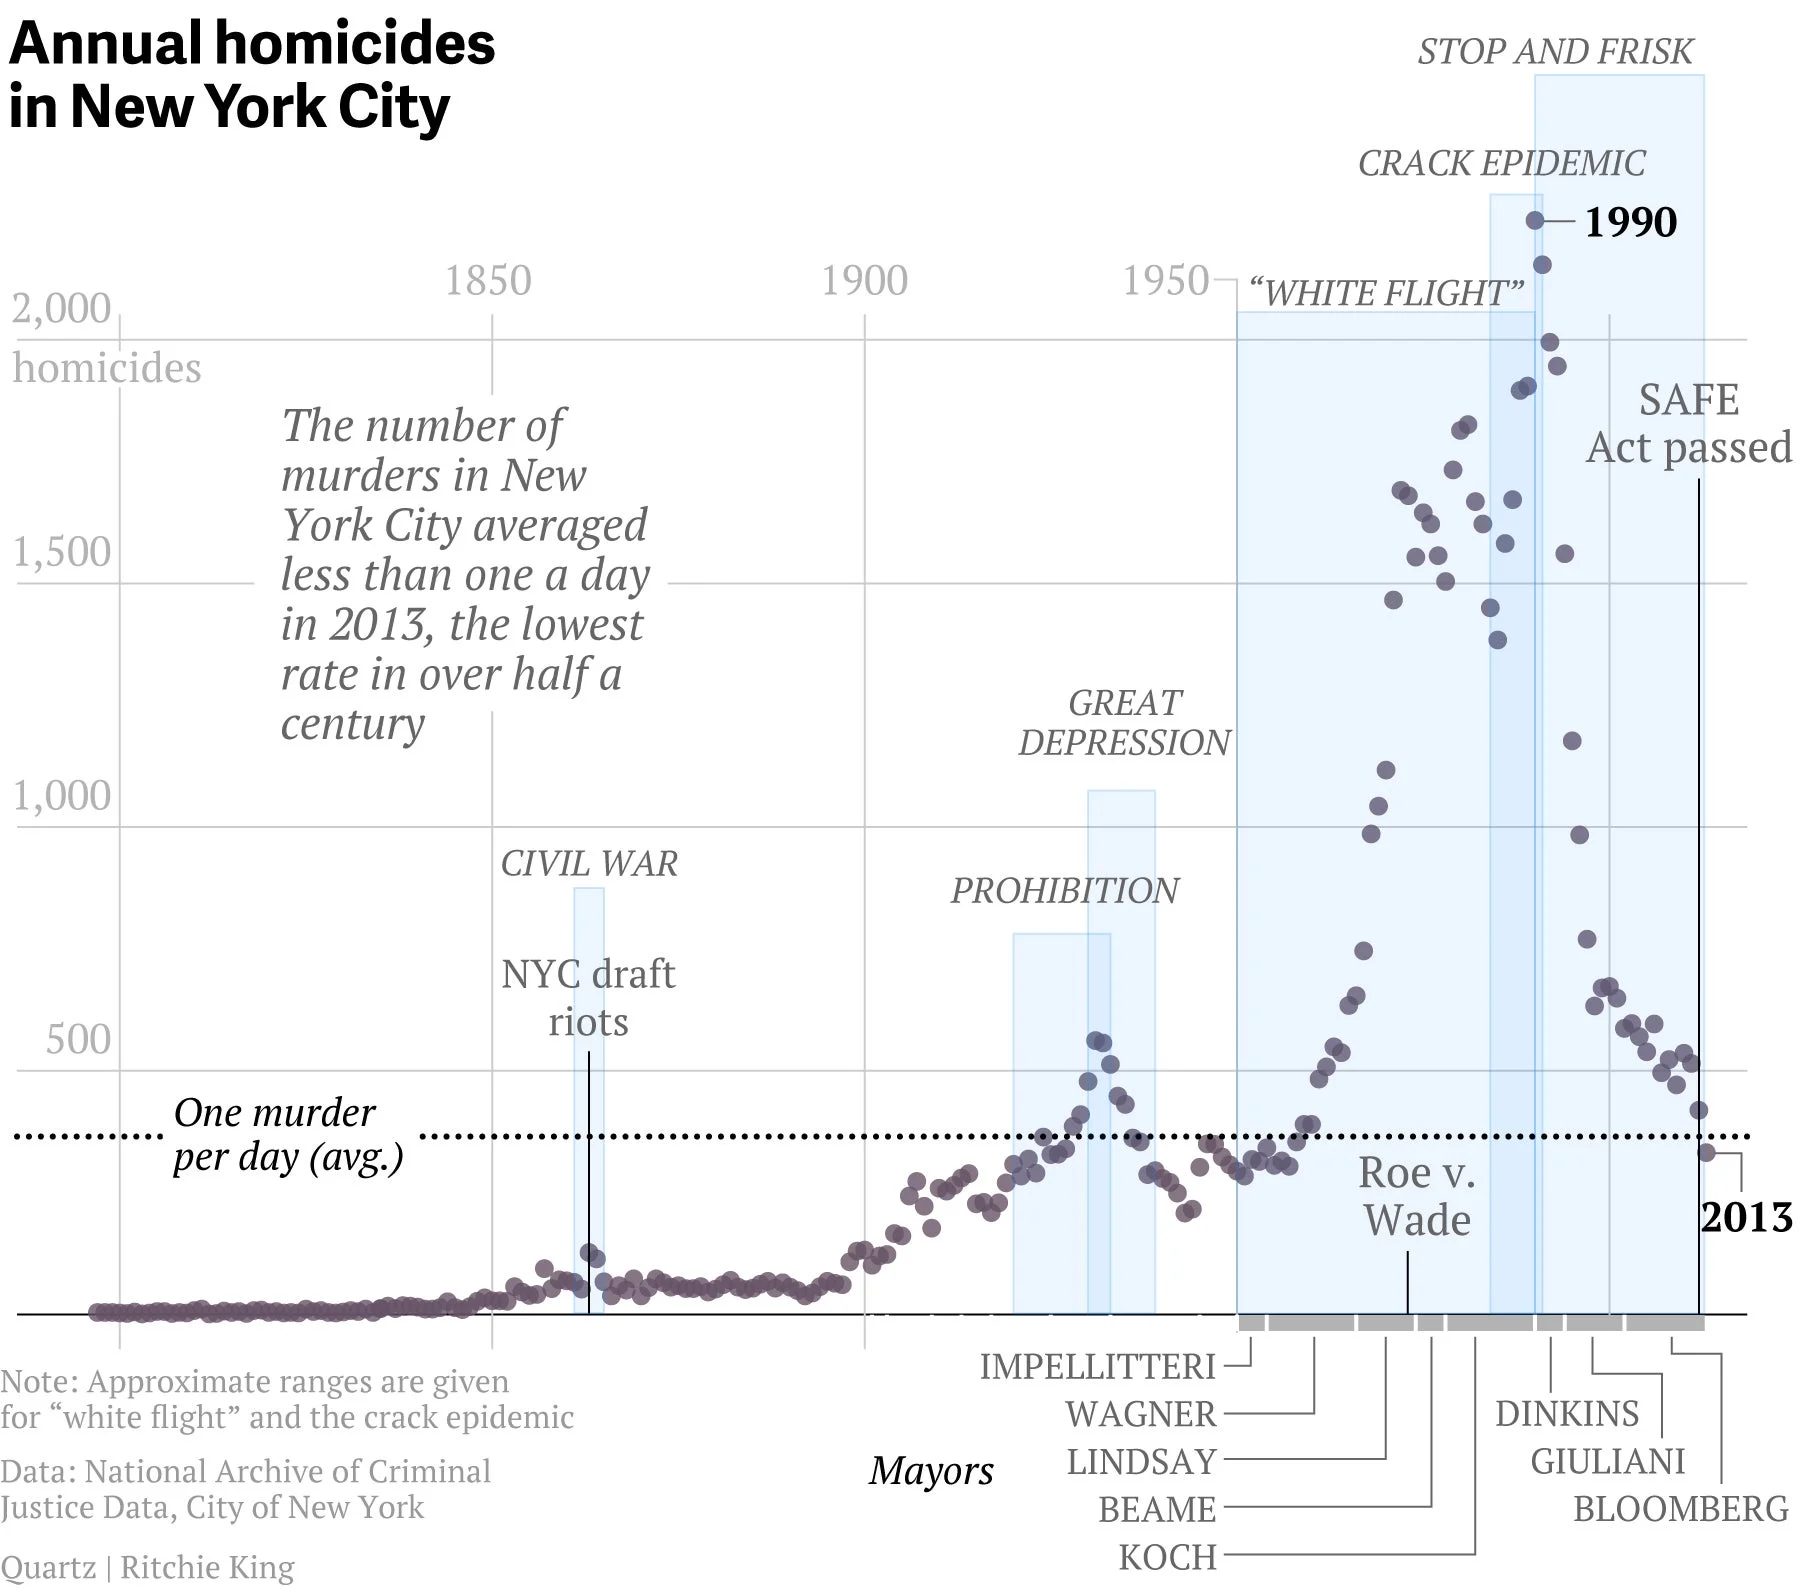
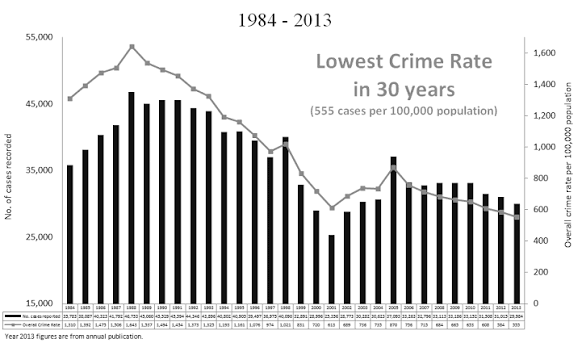
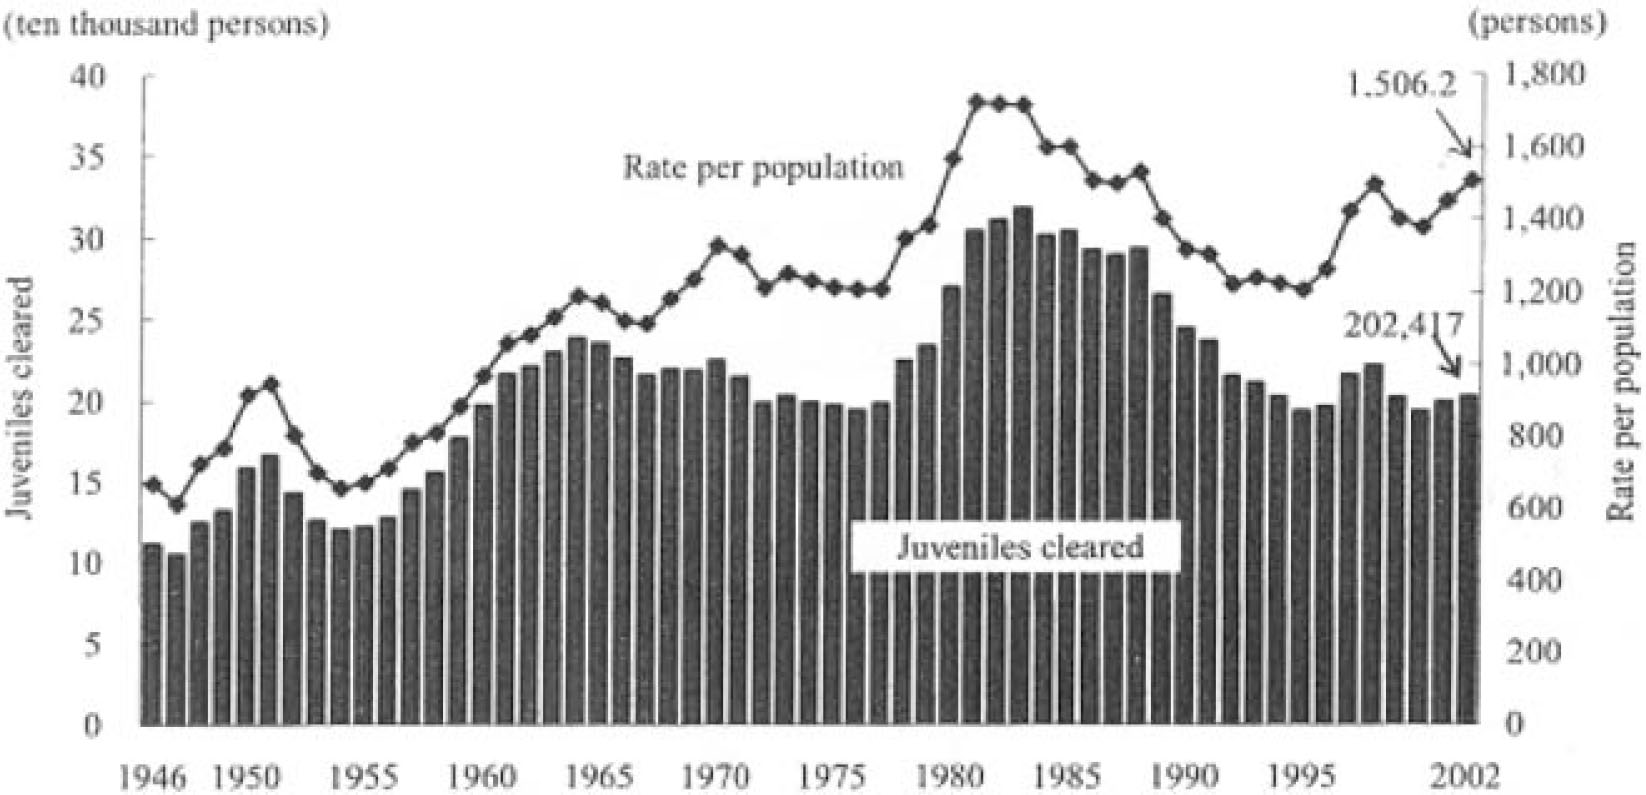
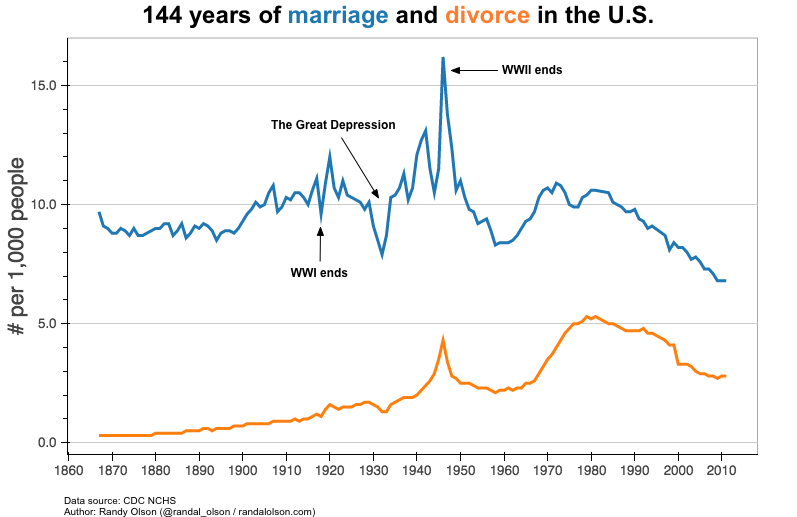
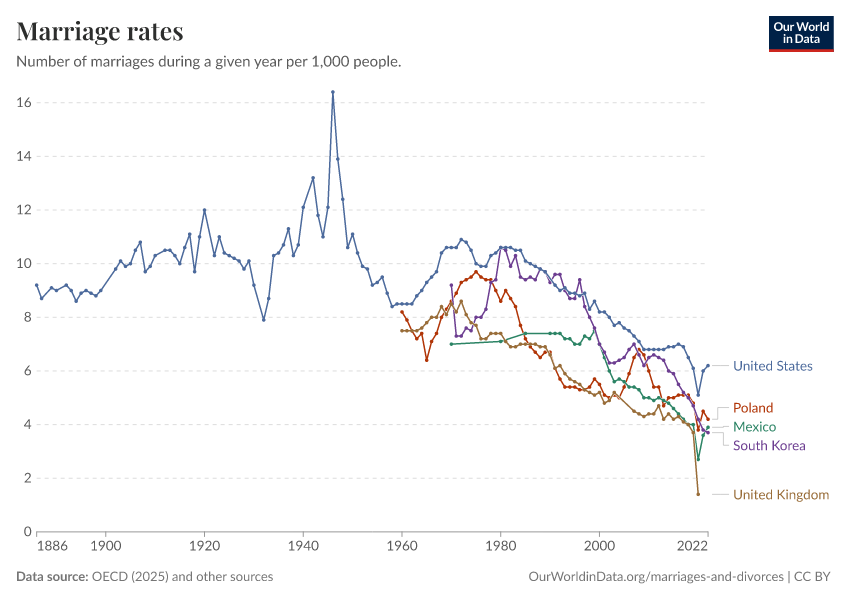
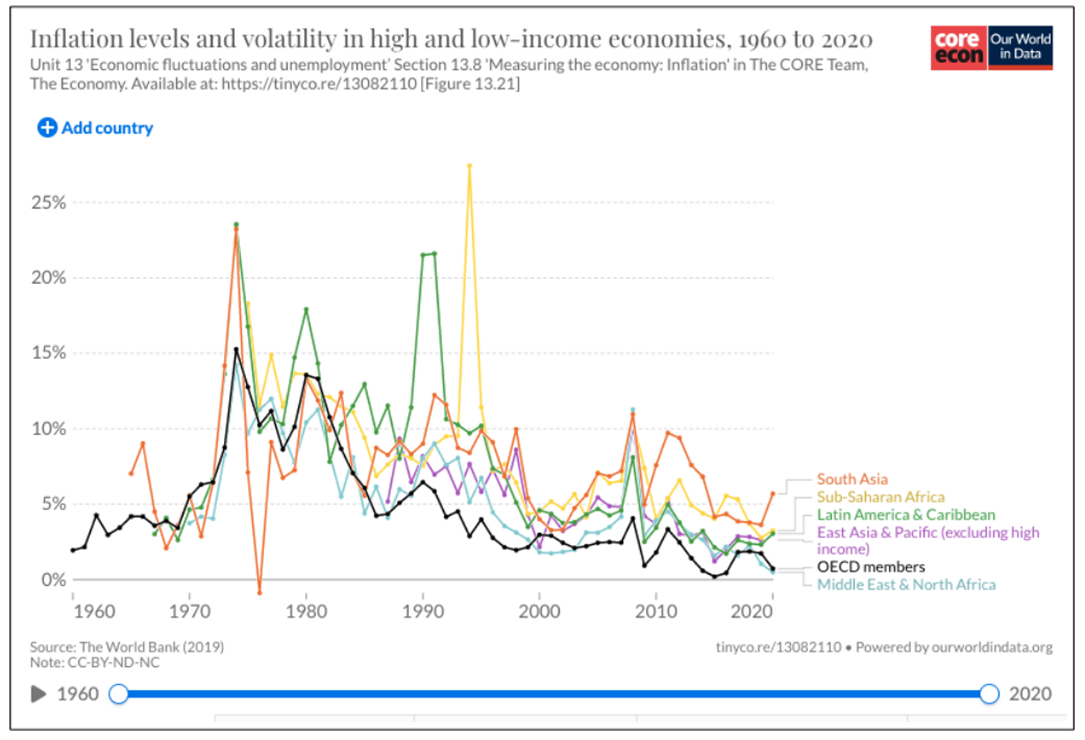
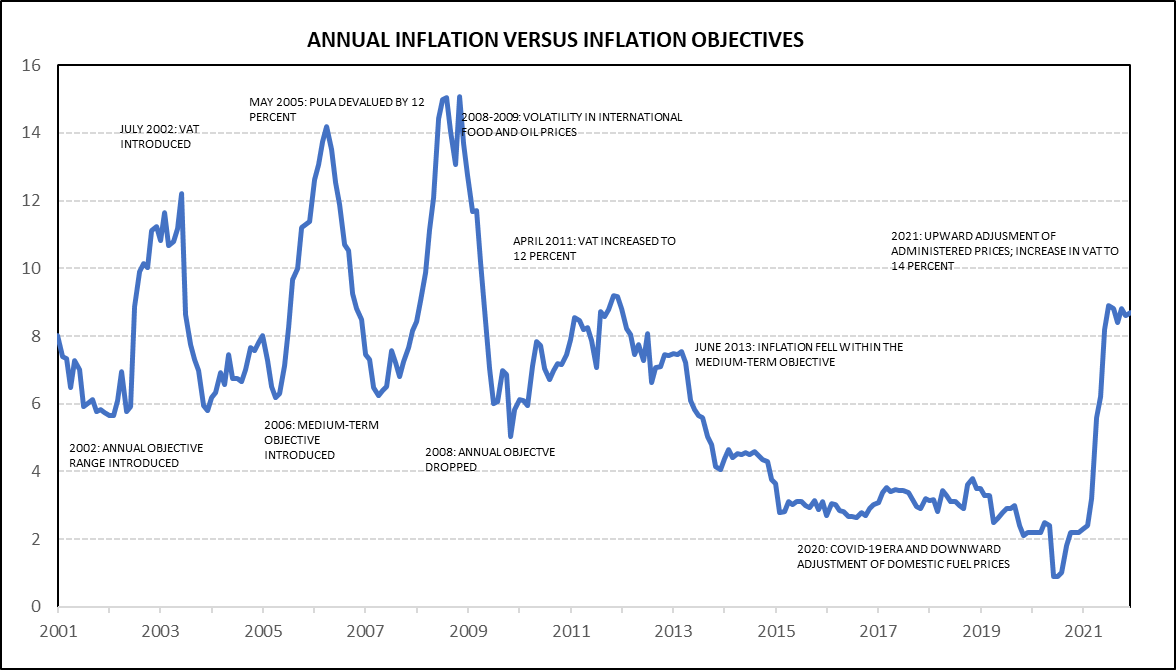
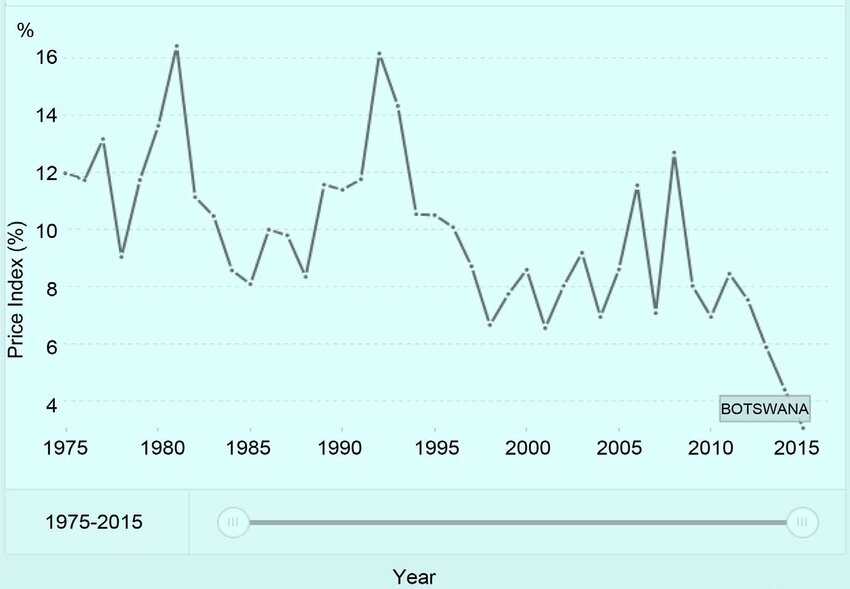
You are presented with a series of Behaviour Over Time (BOT) graphs. Your task is to study each graph carefully and determine what the behaviour is telling you about the underlying system.
Do not begin by looking for an archetype. Begin with the BOT. For each graph:
- Read the behaviour over time.
Describe what the graph is doing: Is it accelerating, declining, oscillating, stabilising, diverging, repeatedly returning, or displaying another recognisable behaviour? - Identify the quadrant.
Place the BOT in the appropriate quadrant according to the system-archetype framework being used in this exercise. - Identify the causal loops.
Determine which reinforcing (R) and/or balancing (B) loops could generate the behaviour shown. Do not assign loop polarity from the name of a variable or from what you expect the archetype to be. - Identify the domain.
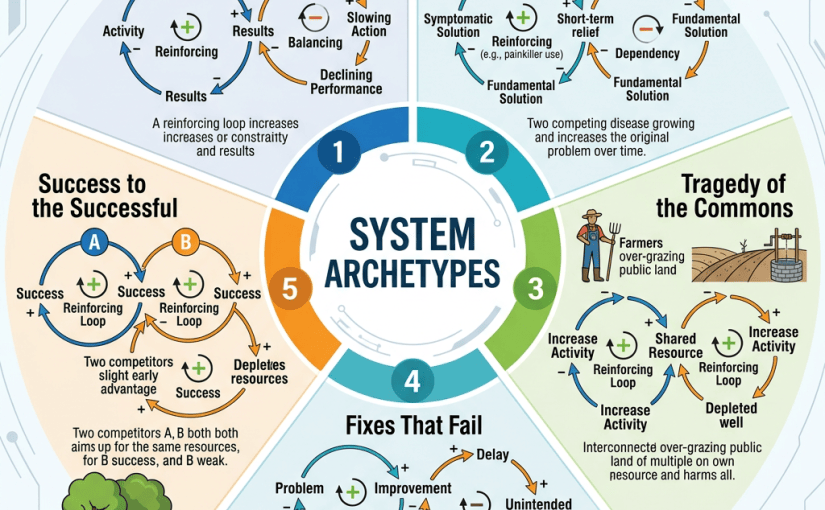
Consider the domain in which the behaviour is occurring and what kind of systemic situation the BOT may represent. - Identify the system archetype.
Only after completing the preceding steps, identify the archetype that best accounts for the behaviour. - State the evidence.
Briefly explain why you identified the archetype. Your explanation should refer to the behaviour shown and the causal structure you believe could produce it.
The Discipline
The purpose of the exercise is not to see how quickly you can name an archetype. It is to test whether you can remain with the behaviour long enough to recognise the structural clues that point toward one.
Remember the sequence:
BOT → Behavioural Signature → Loops → Structure → Archetype
If the BOT does not provide enough evidence to make a confident identification, say so rather than forcing the graph into a familiar archetype.
Important
An archetype must be earned by the behaviour and structure.
Do not reverse the process:
❌ “This looks like Success to the Successful, therefore the graph must represent Success to the Successful.”
Instead ask:
“What behaviour am I seeing? What combination of loops could produce it? What structure would account for that behaviour?”
Then determine whether an archetype is recognisable.
What We Are Looking For
We are particularly interested in whether you can distinguish between:
- the shape of the BOT and the story you associate with it;
- a recurring behavioural signature and an isolated event;
- a causal loop and a variable simply increasing or decreasing;
- a structural explanation and a mental-model explanation;
- and finally, recognition of an archetype and imposition of an archetype.
This assignment is therefore another step in developing the practitioner’s ability to see before explaining.