Building Long-Horizon Capacity for Systems Leadership & Strategic Stewardship
Author: sheilasingapore
I am a Strategy Development Consultant working with sectoral, national and regional leaders develop the confidence and habits they need with The Fifth Discipline tools and practices to make a systemic impact on growing their nation and economies. My practice spans 25 years. For more information about the works, click here: https://sheilasingapore.wordpress.com/introduction/about/ and here: https://strldi.weebly.com/sheiladamodaran.html
Systems at Edge: The Five-Card Masterstroke & The Shift to Abundance
The Ground Indonesia Is Moving
TL;DR: Indonesia’s recurring haze is connected to more than fires. It raises questions about how land, livelihoods, education, technical capability and industrial development interact. This article traces five connected parts of that system and explores how Indonesia and its regional partners could move from repeatedly managing crises to building the productive capacity that prevents avoidable hardship. The invitation is to examine the system together and identify what could change its outcomes.
Key Learnings: Systems Thinking Applied to Indonesia’s Haze Crisis
Core Thesis
The recurring haze crisis in Indonesia is not merely an environmental problem but a systemic economic issue requiring integrated solutions across five interconnected domains (“cards”).
The Five-Card Framework
Card 1: Land & Environment
16 million of 24 million hectares of Indonesian peatland are fire-prone
637,000-900,000 hectares burned in 2026 (after declining to 214,000 in 2025)
283,000+ respiratory illness cases reported across 7 provinces
Key insight: Agricultural residues (palm oil waste, crop stalks) could become productive inputs rather than disposal problems, creating economic alternatives to burning
Card 2: Employment & Livelihoods
146.54 million employed vs 140.66 million not employed (2026 projection)
64 million out of 288.6 million population formally employed (34% of employable population or 1 in 5 population with formal employment)
Target: Move 90-128.8 million workers from informal to formal employment
Calls for validation before claiming definitive numbers
The Fundamental Question
“What if the recurring haze were not only an environmental problem, but also an outcome of how land, labour, education, production and income interact?”
This reframes the crisis from:
❌ Environmental enforcement problem
✅ Economic system design challenge
Possible Next Steps for Exploration
Explore economic restructuring with Indonesian partners. STRLDi would be pleased to share its national unemployment and economic diversification study, which applies systems thinking to examine the factors that may be sustaining unemployment and constraining diversification. The study could provide a starting point for a shared understanding of the challenges and the approach to exploring them.
Examine the commercial viability of converting agricultural biomass into compost, including its potential contribution to soil restoration and productive agriculture.
Model the enterprise requirements for a potential shift of 48.8 million people into formal employment, identifying the sectors, investment, production capacity and markets needed to support such a transition.
Explore a regional STEM educator exchange programme to strengthen mathematics and science teaching, technical skills and the development of future industrial capability.
Map production requirements across connected sectors to identify opportunities for coordinated investment, regional cooperation, value addition and employment creation.
Most Powerful Insight
“Relief is essential. Accountability is essential. But lasting change requires redesigning the system that reproduces the crisis.”
The haze persists not because people don’t know it’s harmful, but because the economic system makes burning rational for individual actors while distributing costs across the entire region. Only by changing the underlying economic incentives can the pattern be broken.
When the system changes, the smoke clears. It does not have to be forever.
Author’s Note:
I lived in Singapore and experienced the haze for almost 20 years until I moved to Botswana in 2008 for work. Now, nearly 20 years later, in 2026, the region continues to experience recurring haze and its consequences.
Indonesia’s haze crisis fluctuates in severity, but it has not been eliminated. Reported burned area fell from approximately 1.16 million hectares in 2023 to 214,000 hectares in 2025, before surging to an estimated 637,000 hectares in January–August 2026; subsequent estimates reached 637,000–900,000 hectares by October. In October 2026, PM₂.₅ in Singapore reached 284 µg/m³, while more than 283,000 respiratory illness cases were reported across seven Indonesian provinces. These figures show that a period of declining fires can be followed by a major resurgence. The challenge, therefore, is not simply to suppress fires each year, but to change the underlying conditions so that the system no longer repeatedly produces them.
That passage of time prompted me to ask: why does the problem persist, and what would it take to shift the system that reproduces it?
I have proposed assembling a team, including Indonesian partners, to explore how economic restructuring could address both unemployment and recurring haze. I would be happy to share STRLDi’s signature study as a starting point for this work.
Relief is essential. Accountability is essential. But lasting change requires redesigning the system that reproduces the crisis.
What can we build together that changes the outcome?
Imagine placing five cards on a table in front of someone responsible for the future of Indonesia: peatland fires and transboundary haze; a vast workforce with insecure livelihoods; mathematics and technical capability; a regional manufacturing opportunity; and a country repeatedly exposed to natural calamities. Each card belongs to a different policy domain. Each has its own institutions, budgets, experts, and performance measures.
Now imagine that the five cards are not separate problems. They are connected parts of a single economic system.
What would become visible if we stopped looking at each card independently and began tracing the relationships between them? What if the recurring haze were not only an environmental problem, but also an outcome of how land, labour, education, production and income interact? And what if the same system that repeatedly generates vulnerability could be redesigned to produce the conditions for greater security and abundance?
A note on the projections: The population figures used in this article are projections, not exact predictions. Any error is too small to materially alter the systems argument or justify delaying the work proposed here. The purpose is to understand how Indonesia can build an economy that prevents recurring fires, protects human health, and creates productive livelihoods. The work must now move forward.
This is an inquiry into that possibility. It begins with the ground itself.
Palm Oil Production and Haze: A Global Comparison
The global palm oil industry produces an estimated 81.44 million tonnes of palm oil in the 2025/26 marketing year. Indonesia and Malaysia account for approximately 82% of that output. Yet the recurring haze affecting Southeast Asia is not a uniform consequence of palm oil production around the world. It is associated particularly with fires in Indonesia, where plantation development, peatland drainage, land clearing and drought interact.
1. Global production by country
The following table uses USDA Foreign Agricultural Service estimates for the 2025/26 marketing year.
Producing country
Palm oil production
Share of world output
Indonesia
46.70 million tonnes
57.3%
Malaysia
20.20 million tonnes
24.8%
Thailand
3.90 million tonnes
4.8%
Colombia
2.00 million tonnes
2.5%
Nigeria
1.50 million tonnes
1.8%
Guatemala
995,000 tonnes
1.2%
Papua New Guinea
830,000 tonnes
1.0%
Brazil
660,000 tonnes
0.81%
Ecuador
640,000 tonnes
0.79%
Côte d’Ivoire
630,000 tonnes
0.77%
Other producers combined
Approximately 3.39 million tonnes
Approximately 4.2%
World total
81.44 million tonnes
100%
The other producing countries include Ghana, Cameroon, the Democratic Republic of the Congo, Guinea and other countries in tropical Africa, Latin America and Asia. The USDA summary groups smaller producers together, so a complete country-by-country volume list requires the underlying production dataset.
2. Where is haze attributable to palm oil production?
The critical distinction is between smoke from all fires in a palm oil-producing country and smoke attributable specifically to fires associated with oil palm production. These are not interchangeable quantities.
Country or region
Evidence on palm-oil-related haze
Indonesia
The strongest documented connection to recurring transboundary haze. Research has measured fires and smoke associated with oil palm concessions in Sumatra and Kalimantan.
Malaysia
Experiences domestic land and peat fires, as well as haze transported from Indonesia. Malaysian companies also operate plantations in Indonesia, so the location of a company’s headquarters does not establish where its fire emissions occur.
Thailand
A major producer, but not a principal source of the recurring Sumatra–Kalimantan transboundary haze. A comparable national estimate of haze specifically attributable to oil palm was not established in the sources reviewed.
Colombia, Nigeria, Guatemala, Papua New Guinea, Brazil, Ecuador and Côte d’Ivoire
Produce palm oil, but the sources reviewed do not provide comparable country-level quantities of haze attributable specifically to oil palm production. This is not evidence that their production causes zero smoke.
3. How much haze can be attributed to oil palm?
A peer-reviewed study by Marlier and colleagues, published in Environmental Research Letters in 2015, examined fires during Indonesia’s 2006 burning season. It found that fires within the combined oil palm, timber and logging concessions accounted for about 41% of total fire emissions in Sumatra and 27% in Kalimantan. Those figures cover three industries, not palm oil alone.
Within those concessions, the estimated contribution differed sharply by island: oil palm accounted for approximately 10% of concession-related fire emissions in Sumatra and 67% in Kalimantan during that study period. These are historical estimates of fire emissions, not percentages of all haze in Indonesia today, and they should not be presented as current global attribution figures.
The study’s geographical contrast is important. It shows that even within one country, the relationship between palm oil production and fire emissions differs by location. Peatland extent, drainage, the type of land being cleared, the distribution of concessions, and the proximity of fires to populated areas all influence the outcome.
4. Why does production result in severe haze in some locations but not others?
Three mechanisms help explain the difference:
Peatland drainage: Draining peat for plantation development lowers the water table, allowing organic soil to dry and become combustible. Peat fires can smoulder underground for weeks or months.
Land clearing and fire use: Fires may be used to clear land, including land being prepared for plantations. Fires that escape control can spread well beyond the original clearing site.
Drought: Prolonged dry conditions, including those associated with El Niño, increase the likelihood that fires will ignite, spread, and persist. Winds can carry the resulting smoke across national borders.
NASA’s analysis of the 2015 Indonesian fire season documented these mechanisms and showed why attributing all Indonesian fire emissions to oil palm alone would be inaccurate: fires are also associated with timber, logging, small-scale agriculture and other land uses.
Conclusion
The global comparison establishes a clear starting point: Indonesia and Malaysia produce the overwhelming majority of the world’s palm oil, but the recurring transboundary haze crisis is particularly associated with fires in Indonesia. The available research also demonstrates that the contribution of oil palm to fire emissions varies substantially between regions, even within Indonesia.
There is no comparable global dataset in the sources reviewed that quantifies the amount of haze attributable specifically to palm oil production for every producing country. Accordingly, a country-by-country table assigning tonnes of smoke or percentages of haze to each producer would go beyond the available evidence. The next step in establishing that comparison would be to combine plantation and concession maps with satellite-detected fires, land-cover changes, peatland data and atmospheric emissions modelling for each producing country.
Card 1 — The ground beneath the smoke
Indonesia’s peatlands are not ordinary agricultural land. Peat stores large quantities of carbon in waterlogged organic matter. When peatlands are drained, the ground can dry, oxidise, and become vulnerable to fire. Fires can burn below the surface, persist after flames appear to have disappeared, and produce haze that crosses national borders. The consequences extend beyond forests: public health, transport, schools, business operations and regional relations are all exposed.
The scale is not abstract. In October 2026, Reuters reported estimates of 637,000–900,000 hectares burned during the 2026 fire season, with more than 283,000 respiratory illness cases reported across seven Indonesian provinces. These are reported estimates and cases, not a definitive final national tally. Reuters also reported that approximately 16 million of Indonesia’s 24 million hectares of peatland were considered fire-prone, and that only a small proportion of peatland affected by earlier restoration efforts had been restored. See Reuters’ October 2026 reporting on peatland degradation and its regional haze explainer.
The familiar response is to suppress fires, restore damaged land, enforce regulations and prepare for the next dry season. These activities matter. But another question sits underneath them: what economic arrangement makes the land-clearing decision attractive in the first place, and what alternative would make it more valuable to keep the ground productive and wet?
Consider the agricultural residues generated by Indonesia’s productive economy: oil-palm empty fruit bunches, crop stalks and other plant materials. These can be waste-disposal problems, or they can become feedstock for processing enterprises. The distinction depends on collection systems, processing technology, quality control, transport costs, market demand and the economics of the alternative uses.
The proposition is not to extract peat and sell it as compost. It is to protect peatlands while investigating whether above-ground agricultural residues can be processed into mature organic soil amendments. Such products might serve Indonesian agriculture, support soil restoration in suitable highland farming areas, or find export markets if the economics and agronomic evidence justify it.
Peatlands in Indonesia range in depth from shallow deposits of 50 cm to extreme depths of more than 17 to 18 meters, with an overall average depth of roughly 5 to 6 meters. [1, 2]
Key Facts About Indonesian Peat Depths
General Distribution: Most Indonesian peatlands (about 80%) are less than 3 meters (300 cm) deep, while deeper layers occur in specific inland basins and river valleys. [1]
Deepest Sites: Inland and upstream sites—such as those near Putussibau in West Kalimantan and areas in Sumatra and Papua—can reach 10 to 18 meters deep (equivalent to a six-story building). [1, 2, 3]
Coastal vs. Inland: Coastal peatlands are generally shallower because they formed more recently after sea levels stabilized, whereas inland tropical peatlands have accumulated organic matter for tens of thousands of years. [1]
Regulatory Threshold: Under Indonesian regulations like Presidential Decree No. 32 of 1990, peatlands 3 meters or deeper are designated as protected ecosystem functions for water, carbon, and biodiversity, while shallower peats (<3 meters) are more frequently exposed to agricultural conversion. [1, 2]
Garlic provides one possible test case. Research in northwest Ethiopia has examined the effects of fertilizer and manure on garlic yields and soil properties (study record). This does not establish that Indonesian compost would be commercially viable in Ethiopia, or that compost alone could replace Indonesian food imports. It establishes a reason to investigate soil restoration, nutrient requirements, crop response and the economics of transporting or producing compost locally.
The first question, therefore, is not simply how to stop the fire. It is how to create a productive economic use for materials and land that the present system undervalues.
Pause here:If agricultural residues could support commercial processing, soil regeneration and stable employment, what would have to change for that value to be realised at scale?
Card 2 — The ground beneath livelihoods
The next card appears to belong to a different discussion: employment. Yet it is connected to the haze. The question is not simply how many people have jobs, but how livelihoods, land use and the organisation of production interact—and whether the economy offers people viable alternatives to practices that impose costs on the wider population.
Indonesia’s population was approximately 285.7 million in 2025, according to UNFPA’s population data. The planning model explored in this analysis uses a population of approximately 287.2 million in 2026, rising towards 318 million by 2046. The 2046 figure is a model projection, not an observed population count; its assumptions need to be stated and tested.
A growing population requires more than more jobs in the abstract. It requires productive capacity that grows fast enough to provide incomes, goods and services for the people entering the workforce. The critical question is whether the economy creates enough year-round, sufficiently productive work to reduce reliance on irregular or seasonal earnings.
The working population table estimates 146.54 million people employed and 140.66 million not employed in a population of 287.2 million. These figures must be interpreted carefully: people who are not employed are not necessarily unemployed, since this category also includes children, students, retirees and others outside the labour force.
Workers involved in field-burning activities — illustrative assumption
1.00 million
0.35%
Key insight: People won’t stop burning if they lack economically viable alternatives
The formal and informal employment figures above retain the original working model’s estimates; they do not reconcile with the 146.54 million employed total and must therefore be treated as a separate, unreconciled scenario pending verification against official Indonesian labour-force data. The seasonal-worker and field-burning figures are illustrative assumptions, not official statistics. These categories overlap and must not be added to the employment totals.
The relationship worth investigating is this: where households face irregular income and few accessible alternatives, immediate cash can outweigh the longer-term environmental costs of a land-clearing practice. A worker cannot be expected to exchange a day’s income for an uncertain promise of future sustainability. Nor can a prohibition, by itself, create the productive jobs that make a different choice economically possible.
This does not establish that informal workers or seasonal agricultural workers are responsible for fires. The question is who carries out or commissions field burning, what economic incentives sustain it, who benefits, and who bears the costs. The illustrative estimate of one million people involved in field-burning activities must be validated before it can be presented as a national count; it may also overlap with agricultural employment, seasonal work, and informal employment.
This is where Card 1 and Card 2 begin to connect. If biomass collection and processing were developed into viable enterprises, agricultural residues could generate demand for collection, sorting, transport, compost production, quality testing, packaging, distribution and equipment maintenance. But the number of jobs, their duration, their wages, and their capacity to displace harmful practices would all have to be demonstrated. They cannot be assumed from the volume of available biomass alone.
The proposed three-stage wage bridge gives the question a measurable form:
Development stage
Proposed monthly wage range
What would have to support it
Years 1–5: establish a wage floor
US$250–350
Reliable biomass supply, viable farm and collection operations, and contracted demand
Years 5–10: accumulate productive capital
US$450–650
Local processing, packaging, machinery services and higher-value production
Years 10–20: capture the industrial dividend
US$800–1,200
More technically demanding manufacturing, engineering and industrial management
These are proposed targets, not forecasts or established Indonesian wage outcomes. They would need to be tested against local wage levels, productivity, prices, regional differences, business costs and international competitiveness. The model’s ambition is to move people towards formal, year-round employment—not to claim that every informal worker can be absorbed by a single bioeconomy.
The model also proposes a long-term target of moving 48.8 million people from informal into formal employment. That is an exceptionally large transformation. Its feasibility depends on the total investment required, the number and scale of viable enterprises, labour productivity, the pace of industrial expansion and the jobs created elsewhere in the economy. The number is a hypothesis to test, not a result already achieved.
The deeper systems question is whether Indonesia can redirect economic activity towards forms of production that provide livelihoods while restoring land, reducing the incentives for harmful burning and creating more value domestically. If short-term land-clearing incentives remain economically attractive while alternatives remain inaccessible, the pressures sustaining the problem may persist even when authorities intervene against the fires.
Pause here:If a national economy needs to create productive employment on this scale, which industries could absorb labour while simultaneously addressing environmental damage, food vulnerability and dependence on imported value-added products?
Card 3 — The ground beneath technical capability
The third card is mathematics.
In the OECD’s PISA 2022 results for Indonesia, Indonesian 15-year-old students scored 366 in mathematics, compared with the OECD average of 472. Only 18% reached at least Level 2 proficiency, compared with 69% across OECD countries. Among the 81 participating countries and economies, Indonesia’s score was near the bottom of the distribution, at approximately 70th place in a simple ranking by mean score.
Top 10 countries and economies in PISA 2022 mathematics
Rank by mean score
Country or economy
Mathematics score
1
Singapore
575
2
Macao (China)
552
3
Chinese Taipei
547
4
Hong Kong (China)
540
5
Japan
536
6
Korea
527
7
Estonia
510
8
Switzerland
508
9
Canada
497
10
Netherlands
493
Source: OECD, PISA 2022 results. These are positions in a simple ordering by mean mathematics score; statistical uncertainty means adjacent positions should not be interpreted as definitive differences in performance.
The contrast raises a fundamental national planning question: what mathematical capability does Indonesia need to plan its economy, determine what it should produce and at what scale, build its industries, and equip its population to participate in them?
Mathematics is needed first to calculate what Indonesia should produce, in what quantities, where, when, and for which markets. This requires calculating the land, capital, energy, transport, infrastructure and workforce needed across connected sectors. Mathematics is then needed inside each enterprise to calculate soil nutrients, compost formulation, agricultural yields, material balances, processing temperatures, machinery capacity, costs, quality and productivity. IT can support and automate these processes, but it cannot replace the mathematical reasoning required to design and manage them.
1. The mathematics capability gap
PISA 2022 mathematics benchmark
Score or result
Indonesia
366
OECD average
472
Finland
484
Indonesian students reaching at least Level 2
18%
OECD students reaching at least Level 2
69%
Proposed first Indonesian milestone
420
Proposed longer-term milestones
450–480, then 500+
The proposed milestones are planning ambitions, not forecasts. The objective is to strengthen foundational mathematics across the school population while developing the advanced capabilities required for engineering, manufacturing, research and industrial innovation.
2. Education capacity: examine teachers, not just headcount
Our working model applies assumed student-to-teacher ratios to Indonesia’s reported 44.59 million students.
School level
Students in working model
Assumed ratio
Teachers calculated
Primary
24.02m
13:1
1.85m
Junior secondary
10.11m
9:1
1.12m
Senior and vocational secondary
10.46m
17:1
0.62m
Total
44.59m
—
3.59m
The important question is whether Indonesia has the right distribution of qualified mathematics and science teachers, effective teaching methods and classroom support—not simply whether it needs more teachers.
3. Bring regional STEM teaching capability into Indonesian schools
Indonesia could mobilise experienced mathematics and science teachers, teacher educators and technical specialists from across the region, including suitably qualified retired educators from Singapore and Malaysia who are willing to participate. They would work alongside Indonesian teachers, teacher-training institutions and technical schools, strengthening teaching capability at every level.
The programme would begin in primary school, where mathematical foundations are established, and continue through junior and senior secondary education, vocational schools, universities and postgraduate specialisation. The purpose would not be to rely indefinitely on imported educators. It would be to strengthen Indonesian teachers and institutions so that they can sustain and multiply the capability themselves.
Mathematics and science would also be taught in connection with what Indonesia needs to calculate, design and produce. Students would see how mathematical reasoning applies to agriculture, soil restoration, food processing, machinery, metallurgy, manufacturing and other productive sectors. The curriculum would develop both the ability to calculate and the ability to understand what those calculations make possible.
4. A 15-year STEM pipeline, with industrial development beginning around Year 6
The education pathway and the industrial pathway must develop together. Indonesia should not have to wait 15 years for the first results: the full horizon develops successive generations of capability, while selected postgraduate specialists return earlier to help build productive sectors.
Period
Education and specialist development
Industrial development
Years 1–5
Strengthen mathematics and science from primary school through secondary and tertiary education. Bring regional STEM educators into Indonesian schools and teacher-training institutions. Select and groom strong Indonesian postgraduate mathematics, science and engineering specialists for placements in Singaporean and Malaysian firms.
Identify priority sectors, calculate production requirements, prepare investment and infrastructure, and establish the enterprises and technical capacity that returning specialists will help develop.
Around Year 6
The first cohort of groomed postgraduate specialists begins returning to Indonesia. School-level education, teacher development and subsequent specialist cohorts continue.
Returning specialists begin helping to establish and strengthen processing industries, engineering teams, technical training, maintenance capacity and applied research.
Years 6–10
Continue strengthening mathematics and science teaching at all levels. Develop further cohorts of specialists through regional firm placements and advanced technical learning.
Expand productive enterprises, build local technical teams and connect education and research to actual industrial requirements.
Years 11–15
Produce successive generations of graduates and specialists with stronger mathematical, scientific and engineering foundations. Build Indonesian institutions’ ability to train and develop their own specialists.
Expand industrial capability and develop a larger generation of Indonesian engineers, technical leaders and industrial innovators able to design, improve and scale production.
The placements in Singaporean and Malaysian firms must be structured as deliberate learning experiences. Participants should learn how enterprises are financed, engineered, operated, maintained and scaled, and how technical decisions connect to costs, productivity, quality and markets. Their return should be linked to identified sector-development roles and credible investment plans, rather than treated as a placement programme that ends when graduates come home.
5. Calculate the enterprises and jobs the pipeline must support
The employment model must connect the desired shift towards formal employment to actual production capacity. The working proposal aims to move 48.8 million people from informal to formal employment over time. This is a target, not an established forecast, and the number of enterprises required cannot be calculated responsibly without specifying sector output, enterprise scale, productivity and employment assumptions.
Production sector
What must be modelled
Employment calculation
Biomass collection and transport
Tonnes collected, routes, equipment and operating shifts
Jobs per unit of biomass handled
Commercial agriculture
Hectares, crop mix, yields and seasonal labour
Jobs per hectare and per tonne produced
Bio-compost and agricultural processing
Plant capacity, throughput and automation
Jobs per plant at each capacity level
Food manufacturing and import substitution
Domestic output targets, imports replaced and market demand
Jobs per unit of production
Nickel and other manufacturing
Plant capacity, production stages and technical requirements
Jobs by occupation and plant
Machinery and industrial equipment
Domestic manufacturing and maintenance demand
Jobs per production facility
Logistics, research and technical services
Supply-chain volume and specialist requirements
Jobs linked to sector output
The calculations must run in both directions. Planners need to determine the required output, number and scale of enterprises, jobs by sector and occupation, and mathematical and technical capabilities required. They can then calculate the number and distribution of teachers, training places and specialist-development opportunities needed to supply those capabilities. The model must also test whether investment, infrastructure, productivity and market demand can sustain the planned output and employment.
The 15-year STEM pipeline is therefore not a separate education initiative. It is the capability-building component of the economic plan: stronger mathematics education from primary school onwards, regional educators multiplying Indonesian teaching capacity, postgraduate specialists learning inside Singaporean and Malaysian firms, and the first returning specialists helping to build Indonesian industries around Year 6.
The central question for national planners is: What must Indonesia learn to calculate, design and produce—and at what scale—to build the economy its population needs?
Pause here: Mathematics and STEM capability
If a country must calculate what to produce, in what quantities, where and when—and then engineer the processes that make production possible—what mathematical and scientific capabilities must it build from primary school onwards, and how can those capabilities be connected to industrial development within the first six years?
Inflection: From the need for jobs to the knowledge and technical capability required to create them.
Card 4 — The ground beneath the regional economy
The fourth card concerns geography, capital and markets.
Indonesia has the population, natural resources and potential production scale to support much more extensive manufacturing and agricultural processing. Singapore has strengths in finance, international trade, logistics, headquarters functions and intellectual property. Malaysia has industrial experience, engineering capability and manufacturing supply chains. India offers a much larger market that could be connected to a regional production network.
These roles are a proposed architecture for cooperation, not a claim that the countries have agreed to such an arrangement.
Under this model, the division of productive functions would be deliberate:
Partner
Potential contribution to an integrated production system
Indonesia
Agricultural and mineral resources, production sites, processing capacity, workforce development and domestic industrial expansion
Singapore
Capital mobilisation, headquarters functions, intellectual property, green finance, logistics and access to international markets
Malaysia
Machinery, factory engineering, industrial equipment, technical services and manufacturing partnerships
India
A large additional market for products and industrial supply chains, subject to commercial and trade conditions
The point is not merely to trade more. It is to connect capabilities so that more stages of production can be developed, retained and expanded within the region.
The combined population of ASEAN and India is approximately 2.1 billion people, depending on the reference year and population estimates used. That is a measure of potential market scale, not proof of purchasing power or guaranteed demand. A market of that size becomes economically meaningful only when products are competitive, distribution works, standards are met, trade arrangements are viable and households or businesses can afford what is produced.
The potential industrial network is broader than compost. Agricultural processing, machinery, oleochemicals, mineral downstreaming, battery materials, logistics and other manufacturing activities could provide different layers of demand for technical skills and productive investment. The exact portfolio would need to emerge from market analysis, resource assessments, infrastructure requirements and commercial feasibility—not from assuming that every proposed industry will succeed.
For the bioeconomy example, the commercial test is particularly important. Is it more economical to transport wet compost across long distances, or to process residues near their source and export a higher-value, quality-controlled product? Would the economics support local soil-restoration markets first, with export markets only where they make sense? What equipment, standards, energy, water, transport and working capital would be required? These are questions for agronomists, engineers, investors and producers to investigate together.
The regional arrangement also creates a reason to invest in the STEM pipeline. Indonesia would not merely need workers to collect biomass; it would need people who can operate plants, design equipment, improve processes, manage industrial quality and develop products for competitive markets. Singapore and Malaysia would not merely be sources of finance or machinery; their institutions and enterprises could become partners in capability development. India would not simply add a population figure; it would need to become a real market for specific products at competitive prices.
Pause here:Regional production architecture
What if Indonesia’s productive resources and workforce, Malaysia’s industrial expertise, Singapore’s capital and regional coordination, and access to ASEAN and Indian markets were planned as complementary parts of one production system? What could the region produce together that individual countries would struggle to build alone?
Inflection: From developing national capability to organising regional capability at scale.
Card 5 — Calamity, kinship, education and the capacity to build abundance
1. The scale of Indonesia’s exposure to calamity
Indonesia’s geography exposes its population to earthquakes, tsunamis, volcanic eruptions, floods, droughts and fires. The OECD reported that between 2000 and 2022, natural-hazard disasters caused almost 190,000 deaths and affected nearly 24 million other people in Indonesia. The 2004 Indian Ocean tsunami alone caused more than 167,000 deaths in Indonesia.
The regional comparison is important: Indonesia is among Southeast Asia’s most disaster-exposed countries, but it should not be described as ranking first in every measure. For example, an ESCAP analysis of disaster fatalities relative to population over 1970–2024 places the Philippines above Indonesia on average annual disaster mortality as a percentage of population.
Measure
Evidence
What it tells us
Indonesia, disaster deaths, 2000–2022
Almost 190,000
The cumulative human cost is substantial
Indonesia, people affected, 2000–2022
Nearly 24 million
Disasters affect far more people than those killed
Indonesia, 2004 tsunami deaths
More than 167,000
A single event can overwhelm households and institutions
Indonesia, WorldRiskIndex 2025
Score 39.80; third globally in the working material
High combined exposure and vulnerability
Southeast Asia, disaster deaths relative to population, 1970–2024
Philippines ranks above Indonesia in the cited comparison
Indonesia’s position depends on which measure is used
Sources: OECD, ESCAP and the WorldRiskReport.
2. The emerging hypothesis from my Saudi study
An emerging insight from my unpublished study of Saudi Arabia is that religion may help sustain kinship structures that become critical to survival under conditions of severe hardship and calamity. These structures can organise protection, mutual assistance, family obligations and continuity when individuals and households face threats beyond their capacity to manage alone.
I want to examine whether this relationship helps us understand Indonesia. When protection and survival occupy a large place in social organisation, what influence might that have on educational priorities, the allocation of human effort and the development of scientific, technical and productive capability? The question is not whether religious commitment prevents innovation, but whether institutions shaped partly by the need to protect people from hardship also help determine how much capacity a society builds to reduce that hardship.
3. What proportion of Indonesia’s students passes through madrasahs?
Indonesia’s formal madrasah system has three main levels: Madrasah Ibtidaiyah (MI), primary; Madrasah Tsanawiyah (MTs), junior secondary; and Madrasah Aliyah (MA), senior secondary. The latest BPS figures for the 2025/26 school year give the following enrolments.
Formal madrasah level
Students enrolled, 2025/26
Madrasah Ibtidaiyah (MI) — primary
4,330,436
Madrasah Tsanawiyah (MTs) — junior secondary
3,172,978
Madrasah Aliyah (MA) — senior secondary
1,584,663
Total across the three levels
9,088,077
Source: BPS-Statistics Indonesia, Ministry of Religious Affairs school statistics for 2025/26. These are enrolments at three different educational stages, not a count of unique individuals or the cumulative number educated through madrasahs since independence.
These figures establish the scale of the formal madrasah system today: more than nine million student enrolments across its three levels. They do not yet tell us what proportion of Indonesia’s population has passed through madrasahs since independence in 1945, because students move between stages and generations, and the figures do not include every form of pesantren education.
4. What does a student spend time learning?
The Grade 10 curriculum comparison gives us a direct measure of how scheduled learning time differs between formal madrasah and mainstream senior secondary education.
Grade 10 subject group
Madrasah Aliyah (MA)
Mainstream SMA
Dedicated Islamic religious subjects
432 periods annually
Religious education is included in a different curriculum structure
Mathematics
144 periods
144 periods
Natural sciences
252 periods
324 periods
One teaching period is 45 minutes. These figures are drawn from the curriculum structures discussed earlier; the categories are not fully equivalent, so this table compares the specified subject allocations rather than total curriculum time.
The comparison shows that the formal MA curriculum allocates substantial dedicated time to Islamic religious studies, while the cited Grade 10 SMA structure allocates more scheduled time to natural sciences. Mathematics receives the same number of periods in the two structures. The question is what these differences mean when considered alongside national learning outcomes and the skills demanded by a productive economy.
5. The national capability question
Indonesia’s PISA 2022 mathematics score was 366, compared with the OECD average of 472. Only 18% of Indonesian students reached at least Level 2 proficiency in mathematics, compared with 69% across OECD countries.
At the same time, BPS reported that in August 2025 Indonesia employed 41.25 million people in agriculture, forestry and fishing, against 20.31 million in manufacturing. The national unemployment rate was 4.85%, representing 7.46 million people.
Indicator
Indonesia
Development question
PISA mathematics score, 2022
366
How widely is mathematical capability being developed?
Students reaching at least PISA Level 2 in mathematics
18%
How large is the pipeline of students with foundational mathematical proficiency?
Employment in agriculture, forestry and fishing, August 2025
41.25 million
How can agricultural productivity and value addition increase?
Employment in manufacturing, August 2025
20.31 million
What would expand the country’s industrial employment capacity?
Unemployed people, August 2025
7.46 million
What productive enterprises and jobs can absorb available labour?
These figures do not prove that madrasah education causes Indonesia’s mathematics or employment outcomes. They establish the national development challenge against which the educational system and its different pathways can be examined.
The question is whether Indonesia’s educational pathways, social institutions and economic structure together provide enough of the capabilities needed to move from a large population and resource base to widespread technical competence, productive enterprises and secure employment.
6. From a State of Defense to a State of Abundance
A society exposed to severe calamities must protect its people. The question is whether protection remains predominantly a response to recurring hardship, or whether it is accompanied by sufficient investment in the productive capacity that can reduce vulnerability over time.
State of Defense describes the repeated mobilisation of resources to withstand and recover from shocks. State of Abundance describes the building of technical knowledge, productive enterprises, secure livelihoods and resilient infrastructure, while retaining the capacity to respond to disasters.
The five cards connect at this point: land management affects fire risk; biomass can become a productive input; production requires technical capability; technical capability depends on education and training; and industrial development requires enterprises, investment and markets. The challenge is to organise these elements so that protection is strengthened by the capacity to create value and reduce avoidable hardship.
Pause here:
If the institutions that help a population survive calamity also shape how its people learn, work and organise their lives, how can Indonesia build on those institutions to develop the mathematical, scientific, technical and productive capabilities needed to reduce the hardship future generations must endure?
Inflection:From repeatedly managing the consequences of hardship to building the capacity to prevent avoidable hardship.
From five cards to one economic pipeline
The system can be represented as a chain of relationships:
Population and education → technical capability → investment and enterprises → production and processing → markets → employment and income → household security and reinvestment.
Land, soil, food security and disaster resilience both shape and are shaped by this pipeline. The relationships also run in reverse. A more productive economy can create resources for education and restoration; better technical capability can improve production and environmental management; more secure incomes can widen the choices available to households. Whether these feedback effects become strong enough to change the overall trajectory is an empirical question.
The proposed transformation therefore has several different horizons. Immediate livelihood and residue-collection experiments could test whether alternative income can be generated without burning. Over the first five years, regional partnerships and processing enterprises could establish whether there is a commercially viable base for expansion. Over 10–20 years, if investment, markets and education align, higher-value production could create demand for a larger and more specialised technical workforce. The 15-year STEM pipeline would need to begin early because industrial capability takes time to develop.
The model’s wage bridge—US$250–350 a month in the first stage, US$450–650 as processing and manufacturing expand, and US$800–1,200 in higher-value industrial roles—is one way of making the ambition measurable. So is the proposed target of moving 48.8 million workers into formal employment. Neither should be treated as guaranteed. Both require a transparent account of investment, enterprise numbers, productivity, wage affordability, labour demand and the pace at which jobs can actually be created.
The same discipline applies to import substitution. The working material cites Indonesian imports of more than 2.6 million tonnes of soybeans annually and approximately 600,000 tonnes of garlic. These figures need to be checked against the relevant trade year and commodity definitions before publication as current totals. Even when import volumes are confirmed, compost alone cannot be assumed to replace those imports: crop suitability, seed, irrigation, varieties, agronomy, storage, processing, prices and farmer incentives all affect domestic competitiveness. The opportunity is to test whether better soil management and stronger agricultural value chains can contribute to reducing food vulnerability—not to promise that one input can solve it.
The practical question is whether Indonesia can move from treating peatland fires, informal employment, educational capability, food imports, manufacturing and disaster exposure as separate policy concerns to examining their combined economic consequences. A systems view does not remove the need for specialist knowledge. It gives specialists a common structure in which to test how their decisions affect one another.
That is the work of discovery: establish the data, map the causal relationships, test the assumptions, identify the leverage points, and learn whether the proposed pathway can work at scale.
Questions for Systems Thinkers
To our readers across regional planning, institutional investment, research, and corporate strategy:
💡 What surprised you most about how peatland hydrology, highland food import substitution, and mathematics education lock into a single economic pipeline?
🚀 What excited you about the prospect of a 20-year cross-border bioeconomy pipeline connecting Singapore, Malaysia, Indonesia, and an ASEAN + India market of 2.14 billion people?
🔍 What curiosity did this raise for you regarding how we measure informal labor and soil capital?
🧭 What would you like to see happen next—or what would you personally like to do next to explore this?
🛠️ If our region were to actually execute an idea of this scale—what do you think it would take to pull it off?
Neurobiology, Causal Discovery and the Architecture of Productive Capability
By Sheila Damodaran | STRLDi Systems Diagnostics & Policy Architecture
Executive Summary
When a Nation Learns to See
Neurobiology, Causal Discovery and the Architecture of Productive Capability Sheila Damodaran | STRLDi Systems Diagnostics & Policy Architecture
A nation’s productive capacity begins before the factory, the farm, the laboratory or the technology. It begins in the cognitive architecture of the people who will have to create, operate, improve and reproduce those systems. Learning changes that architecture: repeated experience strengthens and reorganises neural networks, making previously learned relationships increasingly available for recognition and use. (STRLDi)
The article examines what happens when learning moves beyond receiving information to discovering relationships. Mathematics provides a clear progression: Objects → Quantities → Counting → Symbols → Operations → Relationships → Equations → Models → Prediction → Verification. STEM repeatedly exercises this movement from observation to relationship, causality, modelling and verification. This matters because productive economies depend upon people who can discover how things work, reproduce what works and improve it.
The article then makes a critical distinction between productive and speculative orientations. Productive learning follows Observe → Measure → Connect → Model → Test → Produce → Improve. A speculative orientation can pursue results through authority, consensus, trends and anticipated gain without understanding the relationships producing the result. The national question is therefore not simply how many people have been educated, but what cognitive practices the education system has repeatedly exercised across the population.
For national leadership, this becomes an economic question. A country may possess extensive information, qualified people and numerous strategies while continuing to intervene at the level of visible events because the structures producing those events remain unseen. Causal capability changes the question from “What is happening?” to “What relationship is producing it?” and then to “Where can we intervene to change the behaviour of the system?” (STRLDi)
For Botswana and Africa, the implications are material: productive capability underpins agriculture, manufacturing, engineering, technology, healthcare, infrastructure, employment and household income. The educational choices made today therefore help determine the cognitive capabilities available to build tomorrow’s productive economy.
The article’s central challenge to national leadership is consequently:
What are we teaching the brains that will have to think for the nation?
There is a moment in learning that is easy to overlook because it happens so quickly. We encounter something that is present before us, but its relationship to other things is not yet visible; we look again, work with it, turn it around in our minds, and then suddenly we see it. The world has not necessarily changed in that moment. Our capacity to represent the world has changed. Something that was previously experienced as separate pieces has become a relationship.
Consider a child given 11 apples and then another 12 apples. At first there are simply two groups of objects. The child can count the first group, count the second, bring the quantities together, and eventually recognise that 11 + 12 = 23. What has been learned is much larger than the number 23: the child has connected objects to quantities, quantities to symbols, symbols to operations, and operations to a result. The child is beginning to construct a representation that can be used again.
This is an important distinction because learning is not exhausted by receiving information. The learner has to establish relationships among representations and be able to retrieve and use those relationships when the situation changes. The difference becomes particularly important when we move from learning an answer to learning how one thing produces another.
The question that follows is therefore more interesting than whether the child remembers that 11 + 12 equals 23. What happened in the learner that made the relationship available for the next time? And what happens when the relationship being learned is no longer as simple as two groups of apples, but a relationship among people, institutions, resources, incentives, behaviour and time?
That is where the biology of learning begins to matter for strategy.
The brain as a changing architecture
The brain is not a static container into which information is deposited. Learning involves changes in the function and organisation of neural circuits: existing connections can become stronger or weaker, new synaptic connections can form and stabilise, dendritic spines can change, and networks can be reorganised through experience. The important point for our purposes is that experience changes the machinery through which subsequent experience is interpreted.
At a synapse, coordinated activity can engage mechanisms of synaptic plasticity. At many excitatory synapses, activity involving NMDA receptors permits calcium to enter the postsynaptic neuron, initiating intracellular processes that can increase the effectiveness and number of AMPA receptors. This is one mechanism associated with long-term potentiation, through which a connection becomes more readily activated in the future.
The process can extend beyond changes in synaptic strength. Dendritic spines—the small protrusions on dendrites where many excitatory synapses occur—can change in size, shape and stability. Research using longitudinal imaging has shown that motor learning is accompanied by structural changes in dendritic spines, including the formation and stabilisation of new spines and the organisation of newly formed connections into functional clusters.
This matters because the language of “making connections” is therefore more than a convenient metaphor. Learning can alter the physical and functional organisation of the networks through which relationships are represented. We should be precise about the claim: we cannot look into a living human brain and watch an individual synapse appear every time someone understands an idea. Much of the detailed microscopic evidence comes from animal models, while human research gives us complementary evidence about learning and brain plasticity. But the broader biological principle is well established: experience-dependent plasticity changes the learner.
The implications become more interesting when the experience being repeated is not simply exposure to information, but active discovery of relationships.
What exactly is being learned?
Return to the apples. The child does not need to retain an isolated fact called “23.” The useful learning lies in the relationship that makes 23 the result of combining 11 and 12. Once that relationship is understood, it can be used to solve another problem: 14 + 9, 27 − 8, or a problem that has never previously been encountered.
The learner has therefore acquired something that can travel. The representation can be retrieved, applied, tested and extended. A relationship discovered in one situation becomes available as a structure for understanding another. Learning has moved from possession of information toward capability.
Now imagine replacing the apples with something far more consequential.
A country experiences rising unemployment. At the same time, imports increase, domestic production remains weak, businesses struggle to expand, young people leave certain sectors, foreign exchange comes under pressure and household purchasing power changes. Each observation can be reported separately. Each can generate a policy response. Yet the relationships among them may remain invisible.
The national strategist therefore faces a problem that is structurally similar to the child’s problem, although vastly more complex: how do we move from seeing separate things to seeing the relationships among them?
That is the question this article follows.
B. THE JOY OF SEEING
There is another feature of learning that deserves our attention before we go further. The joy of discovery does not have to be manufactured from outside the learner. Curiosity arises because something is unresolved; exploration follows; a relationship becomes visible; and the joy arrives with the discovery itself. The learner does not first calculate that understanding will produce a reward and then decide to pursue it. The experience of seeing what was previously unseen carries its own satisfaction.
The child who discovers that 11 + 12 = 23 experiences something different from receiving a sweet for getting the answer right. The sweet is an externally supplied reward; the discovery changes what the child can do. The child can now recognise the relationship again, use it somewhere else, and begin asking another question. The mind can generate its own reward when it discovers that it has become more capable of seeing.
This gives us a much more interesting learning loop:
Curiosity → Exploration → Discovery → Joy → Curiosity
The joy is not a prize placed at the end of the process. It is part of the experience of the relationship becoming visible. Because the learner has changed, the next question can be approached from a new position of capability, and that new capability opens another field of curiosity.
This matters enormously when the relationship being discovered is causal. A person working through a causal diagram may begin with several apparently unrelated events. They identify variables, trace relationships, follow consequences through time, discover that an effect feeds back into an earlier condition, and suddenly the behaviour of the whole system begins to make sense. The moment of recognition is itself an experience of increased capability.
This may be one reason why the joy of genuine learning can be so powerful. It does not depend on consuming something that has been placed outside the learner; it arises from the learner’s own transformation. A farmer who discovers why a crop is failing, an engineer who discovers why a machine is repeatedly breaking down, a scientist who sees a relationship in the evidence, a manufacturer who identifies the constraint in a production process, and a systems practitioner who suddenly sees the loop producing a persistent national problem are all experiencing different versions of the same phenomenon: the world has become more intelligible because the mind has become more capable of seeing it.
The significance for education and national capability is therefore profound. If the experience of becoming more capable can itself generate curiosity and joy, then the question is not simply how to motivate people to learn. It is also whether our learning environments give people enough opportunity to experience the satisfaction of discovering something that they can subsequently use.
When the reward comes from somewhere else
This provides a useful contrast with substance use, which we will examine more fully in the appendix. Psychoactive substances can alter neurotransmission and systems involved in reward, attention, memory, perception, inhibition and decision-making, while repeated exposure can produce adaptation and strengthen the significance of substance-related cues.
The systems question is therefore worth asking in both cases: what has repeated experience been teaching the brain to attend to, pursue, remember and reward? In learning, curiosity can lead to discovery and the discovery itself can generate joy; in substance use, the desired external stimulus can become increasingly embedded in patterns of reward, expectation and behaviour.
Experience shapes the learner. That proposition will become increasingly important as we move from individual learning to the learning of causal structures.
C. WHEN SEEING CHANGES
Consider a stereogram.
The page appears to contain a field of dots. Nothing announces the hidden image. The dots themselves do not rearrange when the three-dimensional form suddenly appears. Yet after the perceptual shift, many people can look at the same image again and find the structure much more readily.
What changed?
The image did not.
The observer’s capacity to organise the information changed.
The significance of this experience is not that a stereogram teaches systems thinking by itself. It gives us a concrete experience of a phenomenon that matters greatly in systems work: something can be present in the information before us while remaining unavailable to our current way of seeing. The challenge is not always a lack of data. Sometimes the challenge is that we have not yet acquired the representation through which the relationships in the data become perceptible.
This is why the discipline of staying with the information matters. When the dots initially appear meaningless, the temptation is to force an interpretation, search for a familiar answer or abandon the exercise. The more productive question is different: What did I do differently when I could not see the structure and then suddenly could?
That question takes us directly into causal discovery.
D. LEARNING TO SEE CAUSALITY
The stereogram gives us an experience that is central to systems thinking. The information is already present, yet the structure is initially invisible; then, through a change in the way we attend to and organise the information, the relationship appears. The dots have not moved. What has changed is the capacity of the observer to see what the dots collectively contain.
This is where learning causal relationships begins. We encounter an event, but the event is only what is visible at a particular moment; we begin to ask whether it belongs to a pattern, what variables are moving, what affects what, and what follows from the relationship we have identified. The mind moves progressively from Event → Pattern → Variable → Relationship → Causality.
Once a causal relationship has been identified, the learner follows it. What does this change produce? What does that consequence change? What happens after that? The learner follows the river of causes, allowing the consequences to lead to the next relationship rather than stopping at the first explanation that seems plausible.
The chain may cross levels of the system. An individual action can affect a household; household behaviour can affect an organisation; organisational behaviour can affect an institution; institutional behaviour can affect a sector; sector behaviour can affect the national economy. At each stage, the learner asks the same question: what does this change produce, and what does that consequence change?
Eventually, the causal chain can return to the condition with which it began. An effect becomes part of the conditions that influence its own cause, and feedback becomes visible. We can then begin to distinguish between reinforcing structures, in which change feeds further change, and balancing structures, in which forces work to counteract change.
The progression has now become:
Event → Pattern → Variable → Relationship → Causality → Causal Chain → Feedback → Loop → Behaviour Over Time
The final test is whether the structure we have identified can explain the behaviour we actually observe. Measurement over time allows the learner to compare the behaviour of the system with the behaviour implied by the model. The diagram is therefore not an ornament or a story about the system; it is a proposition about how the system works, available to be tested against reality.
From the diagram to recognition
Only then does the systems archetype become important. An archetype is not something the learner needs to memorise before beginning the investigation; it is something that can be recognised after the relationships have been followed sufficiently far for the underlying structure to become visible. A learner who has worked through several apparently different situations may eventually encounter a new one and recognise that the same structural pattern is operating beneath a different surface story.
That moment matters. The learner has acquired a structure that can travel.
The farmer may encounter it in production, the business leader in growth, the public servant in administration, and the national strategist in economic policy. The events differ, the language changes, and the actors are different, yet the learner begins to recognise the relationship pattern.
And then comes the question that matters most to strategy:
Where can the structure be changed?
The most visible symptom is not necessarily the point at which the system is most responsive. Once the learner can see the structure, attention can move towards leverage: the point at which changing one part of the system can alter the behaviour of the whole. When we do see it, the mind learns to move the forest, not just the tree.
E. FROM TEACHABILITY TO NATIONAL PRODUCTIVE CAPABILITY
When Learning Changes the Learner
What happens when a person repeatedly travels the pathway from observation to relationship, causality and verification? They observe, question, identify variables, construct relationships, follow consequences, test explanations, recognise structures and apply what they have learned to another situation. Learning is therefore doing more than adding information to memory; experience participates in changing the organisation of the neural systems through which subsequent experience is interpreted.
Neuroscience gives us several ways of understanding this. Synaptic connections can change in strength; dendritic spines can change in size, shape and stability; new synaptic connections can form and stabilise; and axonal structures can be remodelled through learning. Research using longitudinal imaging has directly observed structural changes associated with learning, including the formation and stabilisation of new dendritic spines and changes in axonal boutons during motor learning.
The point is that repeated experience changes the learner. When a person repeatedly constructs and retrieves relationships, tests them against experience and applies them in new contexts, the brain is repeatedly engaged in representing those relationships. Over time, those representations can become increasingly accessible, allowing the learner to recognise structures that previously remained invisible.
This is what makes the transition from drawing a causal loop to seeing a causal loop so important. At first, the learner needs the diagram to make the relationships visible; with practice, the learner can begin to perceive the relationships before the diagram has been completed. The diagram has become part of the learner’s way of seeing.
That capacity begins earlier than the systems diagram. It begins with something very simple: the willingness to keep looking when the answer has not yet been found.
Teachability Keeps the Question Open
A child begins with a question because something in the world does not yet make sense. Curiosity keeps the question open; teachability allows the learner to remain open long enough for experience, evidence and discovery to change what the learner understands. The movement is therefore not simply from question to answer, but through Curiosity → Exploration → Discovery → Capability → Joy → New Curiosity.
Teachability is important because the learner must be able to let an existing representation change. A question can lead to an answer that confirms what was already believed, or it can lead to a discovery that reorganises what the learner thought was possible. The capacity to learn is therefore also the capacity to have one’s representation of reality changed by what reality reveals.
This is where the joy of discovery becomes part of the learning system. Something unresolved creates curiosity; exploration exposes relationships; discovery produces recognition; recognition produces capability; and capability opens another question. The learner can therefore become increasingly willing to explore because the reward is contained in becoming more capable of seeing.
The same thing happens when a systems archetype becomes visible. A person may have looked at unemployment, poverty, imports, weak production or household distress as separate conditions, and then suddenly see the relationships connecting them; the behaviour over time begins to make sense because the learner has discovered the structure beneath the events. A new way of seeing has become available.
STEM: Building and Expanding the Architecture for Seeing Relationships
We can now ask what kinds of learning repeatedly place the developing mind on this pathway from observation to relationship, causality and verification.
Consider mathematics. It begins with objects that can be counted and quantities that can be compared. Quantities become numbers; numbers become symbols; symbols are manipulated through operations; operations reveal relationships; relationships become equations; equations become models; models generate predictions; and predictions can be tested against reality.
The movement can begin with 11 apples and 12 apples and eventually reach money, time, distance, rates, fractions, decimals, algebra, trigonometry, physics and chemistry. At each stage, the learner is repeatedly moving between representations and reality, establishing relationships, carrying those relationships into another context, making predictions and discovering whether the predictions hold.
This repeated movement builds and expands the neural architecture. Existing pathways can become stronger and more accessible while new representations and relationships become connected to the architecture already built. The learner is progressively building an expanding architecture for seeing relationships.
The significance is cumulative. The child does not learn counting and then leave that architecture behind; counting becomes available for arithmetic, arithmetic for algebra, algebra for modelling, modelling for prediction, and prediction for verification. The architecture becomes increasingly capable of representing relationships that cannot be seen directly.
That is the movement from seeing the tree to seeing the forest. The learner no longer depends entirely on the immediate physical object because an internal representation of the relationship has become available for use. STEM therefore provides a sustained developmental pathway through which the learner repeatedly practises moving from what is observed to what is related, from relationship to causality, and from causality to something that can be tested.
NON-STEM: What Is the Learner Being Trained to Do?
The distinction becomes important here because education can organise learning around different forms of cognitive practice. Where the learner is predominantly trained through received accounts, interpretation, memory, reproduction and authority, the learner can become highly capable at handling and reproducing representations while receiving less sustained practice in establishing relationships against observable reality through measurement, modelling, prediction and verification.
The learner encounters events, people, societies, ideas and interpretations through accounts that have already been constructed by others. History provides an interpretation of an event; literature provides interpretations of meaning; law provides interpretations of rules and cases; economics and social sciences provide explanations of behaviour and outcomes. The learner can become highly knowledgeable within these fields while the causal relationships underlying the account remain mediated through interpretation.
The learner therefore becomes accustomed to a different relationship with knowledge: receive the account, understand the interpretation, remember it and reproduce it. Where the underlying relationships have not been established and verified by the learner, the explanation can move from evidence into interpretation and from interpretation into speculation.
This distinction is about what the learner repeatedly practises the brain to do. The brain develops through what it repeatedly does, and therefore the question is not simply how much information a population has accumulated, but what kinds of relationships its people have spent years learning to see, test, reproduce and improve.
Productive Capability and Speculative Capability
The difference becomes visible in the pathway each form of learning tends to support.
A productive orientation asks: What do we have? What can we make from it? What relationship produces the result? Can we reproduce it? Can we improve it? What happens if we change this variable? Its movement is:
Observe → Measure → Connect → Model → Test → Produce → Improve
The productive learner continually returns to reality to discover whether the relationship holds. The farmer observes soil, water, seed and yield; the engineer works with force, material and design; the manufacturer works with inputs, processes, variation and output; the technician works through relationships among components to identify what is producing the observed behaviour.
A speculative orientation moves differently. It can ask: Who says it? Who believes it? What is trending? What might happen? What can I gain if I get in early? What does the market think? The emphasis moves toward social confirmation, authority, expectation, attention and anticipated gain while the underlying causal structure can remain unexamined.
Its reinforcing sequence becomes:
Social Reinforcement → Trending → Speculation → Authority → Consensus → Anticipated Gain → Repetition
One pathway continually asks how the result is produced. The other can proceed through what people believe will produce the result.
A productive society is therefore one that learns to discover and reproduce the relationships that produce results. A speculative society can pursue results without understanding the relationships that produce them. That distinction reaches beyond education because the cognitive orientation eventually enters the workplace, the enterprise, the institution and the economy.
The Employment Each Economy Naturally Creates
The type of economy a society builds creates its own employment structure. A productive economy requires people who can create, operate, maintain, measure, diagnose, improve and scale productive systems. Its employment therefore extends through agriculture, engineering, manufacturing, construction, energy, water, infrastructure, technology, ICT, logistics, maintenance, technical operations, science, production management and the productive services that connect these systems to markets.
The engineer works with forces, materials and structures. The agricultural scientist works with soil, water, nutrients, plant physiology and yield. The manufacturer works with inputs, process, quality, throughput, cost and demand. The technician works through relationships among components to diagnose behaviour and restore or improve system performance. The scale changes; the cognitive act remains: discover the relationships that produce the behaviour.
A speculative economy generates a different centre of gravity. Its employment naturally expands around administration, representation, communication, allocation, brokerage, sales, advocacy, negotiation, compliance, promotion, coordination and the circulation of information and claims. These occupations can be necessary within a productive economy as well, but where the productive base is thin, more human effort is concentrated around distributing, administering, representing and managing what already exists rather than continuously expanding the systems that produce new value.
The distinction is therefore between the economy that produces the things people need and the economy that principally moves, allocates, represents or interprets what has already been produced. The balance between these forms of activity determines the depth of productive capability available to the population.
From the Brain to the Economy
The causal chain now becomes visible:
Childhood Learning → Neural Development → Cognitive Capability → Technical Capability → Productive Capability → Productive Systems → Employment → Income → Household Capacity → National Productive Capacity
The individual brain is connected to the economy through a long river of causes. A child learning to see relationships becomes an adult capable of working with increasingly complex relationships; those capabilities become embedded in enterprises and institutions; enterprises and institutions become part of production systems; production systems create employment and income; and the resulting economy becomes the environment in which the next generation is formed.
This is the Self → Nation → Self relationship. What the individual learns becomes part of what the institution can do; what institutions can do becomes part of what the economy produces; what the economy produces shapes the opportunities available to the next generation. Human formation therefore becomes economic formation, and economic formation becomes the environment for the next generation of human formation.
The Scale of the Challenge
Southern Africa is home to approximately 400 million people. The scale of formal employment within that population is considerably smaller.
Southern Africa
People
Total population
~400 million
Labour force
~147 million
Employed
~133 million
Informal employment
~85 million
Formal employment
~24–48 million, depending on definition/year
For this argument, we use 50 million formal jobs as the working figure.
If 5% productive capability supports 50 million formally employed people, and the objective is to reach 300 million formally employed people, the mathematics is straightforward:
300 million ÷ 50 million = 6
The productive capability therefore needs to grow sixfold.
5% × 6 = 30%
Today
Required
Population
400 million
400 million
Formal employment
50 million
300 million
Productive capability
5%
30%
People representing that capability
20 million
120 million
Therefore:
400 million × 30% = 120 million people.
The scale is now visible. The productive capability represented by 5% of the population has to become 30% if the same relationship between productive capability and formal employment is used to explore a sixfold increase from 50 million to 300 million formal jobs.
What Percentage of the Population Needs STEM-Based Capability?
There is an important distinction between STEM occupations and the much larger population whose work depends upon STEM-based productive capability. The relevant question is therefore not simply how many people carry a STEM occupational title, but how many people have developed the capability to participate in creating, operating, maintaining and improving the productive systems on which the region depends.
For the Southern African question, 30% is the planning number emerging from the sixfold calculation in this argument: approximately 120 million people out of 400 million participating in the STEM-based and STEM-enabled productive capability required to build and operate the productive systems of the region.
That number gives the educational question a very different scale. We are no longer looking at the formation of a small technical minority; we are looking at the development of a substantial proportion of the population whose formative years have prepared them to work with relationships, systems, measurement, modelling, prediction, verification and improvement.
The question therefore becomes:
How many people must spend their formative years building and expanding the cognitive architecture required to understand, create, operate, maintain and improve the productive systems through which 400 million people can live and work?
The answer begins with the child.
Build the neuron. Build the capability. Build the productive system. Build the employment. Build the national wealth.
F. FROM SEEING STRUCTURES TO NATIONAL CAPABILITY
A national economy can be presented as a collection of indicators: unemployment, inflation, exchange rates, investment, imports, exports, productivity, wages, skills and production. Each number can be reported and debated while the relationships producing the pattern remain invisible. Causal learning changes the question: what does rising import dependence do to domestic production; what does weak production do to foreign-exchange demand; what does foreign-exchange pressure do to input costs; what happens to businesses when working capital is eroded; and what happens to production capacity as businesses contract?
The question then becomes where does the consequence return? Making the arrow visible allows the relationship to be investigated, measured, revised and tested. A causal diagram turns an implicit theory of the system into something that can be examined against reality, moving the learner from event → pattern → relationship → causality → feedback → archetype → leverage.
Once the structure is visible, strategy can move upstream from symptom to cause and from cause to leverage. The most visible part of a problem is not necessarily where the system is most responsive, and the learner who can see the structure can begin to change the forest rather than continually treating the tree. Seeing the structure changes what becomes possible to change.
The individual learner and the nation then become part of the same system:
Self → Nation → Self
The individual learns within institutions created by society; the capabilities developed by individuals accumulate within organisations and institutions; and those institutions shape the productive, social and learning environment in which the next generation develops. What the individual learns becomes part of what the institution can do, and what the institution can do becomes part of the environment in which another individual learns.
This is why national capability begins before the strategy document. It begins with what people have learned to see, how they have learned to establish relationships, how they have learned to test what they believe to be true, and whether they can turn that understanding into productive action. A country can have enormous quantities of information, qualified people, strategies and policies while the structures producing persistent outcomes remain invisible.
The opportunity is therefore to develop a population capable of moving from event to pattern, pattern to relationship, relationship to causality, causality to feedback, feedback to archetype and archetype to leverage. That is the capability through which a population can begin to understand the systems it has inherited and develop the capacity to change the relationships through which those systems reproduce themselves.
G. WHEN A NATION LEARNS TO SEE
The argument began with a child learning that 11 + 12 = 23. The child learned more than an answer; the child learned a relationship that could travel, be retrieved, applied and extended. At national scale, the same developmental principle becomes a question of whether enough people have built and expanded the cognitive architecture required to see relationships among production, employment, income, institutions, technology, resources, behaviour and time.
This is where the individual brain and the productive economy meet. Childhood learning → neural development → cognitive capability → technical capability → productive capability → productive systems → employment → income → household capacity → national productive capacity. The population therefore carries within its people the capabilities from which its productive systems can be built, operated, maintained and improved.
The scale we have reached in this argument is therefore significant. 400 million people; 50 million formal jobs; 5% productive capability; 300 million formal jobs as the working employment objective; 30% productive capability; 120 million people. The calculation gives us a way to see the scale of human capability that would have to be built and expanded for the productive economy to operate at that level.
BUILD THE NEURON. BUILD THE NATIONAL WEALTH.
Education therefore becomes inseparable from national productive capability because what is repeatedly exercised in the developing brain eventually becomes part of what people are capable of doing in the economy. The question is what proportion of the population will spend its formative years learning to observe, measure, connect, model, test, produce and improve, and therefore become capable of participating in the productive systems required by the population.
This brings the biological argument and the economic argument into the same frame. The child who learns to see relationships is developing a capability; the adult who carries that capability into agriculture, manufacturing, engineering, technology, construction, energy, infrastructure, health, logistics or other productive work becomes part of a productive system; and that productive system creates the goods, services, enterprises and employment through which people live.
The relationship is therefore:
Neural architecture → Human capability → Productive capability → Productive systems → Formal employment → Income → National wealth.
The article has travelled from the child to the neuron, from the neuron to capability, from capability to productive systems, from productive systems to employment, and from employment to the scale of the population that has to be supported. The relationship is now visible: human formation is part of productive formation, and productive formation determines the capacity of an economy to create the work through which its people live.
When the relationships become visible, the question changes. It is no longer simply what a nation knows, how many people it has educated, or how many qualifications it has issued; it becomes what its people have learned to see, what they have learned to build from what they see, and whether the resulting capability is large enough for the population they must support.
And that brings the argument back to the child with the question.
What are we teaching the brains that will have to think for the nation?
APPENDIX
A. NEUROBIOLOGY OF LEARNING AND STRUCTURAL CHANGE
The central argument of this article begins with a simple proposition: experience changes the learner. Neuroscience gives us several mechanisms through which this can occur, including changes in synaptic strength, dendritic spine structure, formation and stabilisation of synaptic connections, axonal organisation and network-level reorganisation. These processes are collectively part of the broader phenomenon of neural plasticity.
A neuron receives and integrates information through its dendrites and cell body and communicates with other cells through its axon. Communication between neurons commonly occurs at synapses, where chemical or electrical signals are transmitted from one cell to another. Dendritic spines are small structures on dendrites that frequently contain excitatory synapses and can change structurally in response to activity.
Key terms
Synapse — a specialised junction through which one neuron communicates with another neuron or another target cell.
Synaptogenesis — the formation of synaptic connections.
Synaptic plasticity — activity-dependent changes in the strength or efficacy of synaptic connections.
Long-term potentiation (LTP) — a form of persistent strengthening of synaptic transmission following particular patterns of activity. Research has shown that LTP can be accompanied by structural enlargement of individual dendritic spines and changes in AMPA-receptor-mediated currents.
Dendritic spine — a small protrusion from a dendrite where many excitatory synapses are formed. Spines can change in size, shape and stability as part of activity-dependent plasticity.
Experience-dependent plasticity — changes in neural structure or function associated with experience and learning.
The scientific literature does not support the simplistic proposition that every new fact produces one new synapse. Learning involves existing networks becoming stronger or weaker, connections being reorganised, and in some circumstances new synaptic structures being formed and stabilised. The more useful statement for this article is therefore: learning changes the organisation and function of neural networks through experience-dependent plasticity.
Learning and new synaptic connections
Research has provided unusually direct visual evidence of structural change during learning. Hedrick and colleagues used longitudinal in-vivo two-photon imaging together with correlated electron microscopy to examine dendritic spines in the motor cortex of mice during motor learning. They found that learning induced new excitatory synapses in the form of dendritic spines and that new spines were incorporated into functional clusters associated with learned movement.
This is particularly relevant to the argument developed in the article because the research concerns the binding of new information into existing functional organisation. The finding does not demonstrate that learning a systems archetype in a human produces a particular microscopic synaptic pattern. It does, however, provide biological evidence for a broader principle: learning can involve the formation, selection, stabilisation and functional organisation of new connections.
More recent research has extended the observation beyond postsynaptic dendritic spines. A 2025 Nature study using longitudinal two-photon imaging found that motor learning dynamically remodelled corticostriatal axonal boutons in awake mice. Newly formed boutons were more likely to be associated with rewarded movements and to be stabilised during learning, while some boutons associated with unrewarded movements were eliminated.
The significance is not that causal diagramming should be equated with motor learning. The significance is that learning is biologically active. Behavioural experience can participate in the reorganisation of the structures through which information is selected, represented and transmitted.
APPENDIX B. THE SYSTEMS THINKING / ARCHETYPE METHOD
The purpose of causal diagramming is to make relationships explicit enough to examine.
The practitioner begins with an observed event or condition and asks whether it forms part of a pattern over time. Variables are then identified, relationships between variables are examined, and causal chains are followed until feedback becomes visible. Once the loop is understood and its behaviour over time examined, a recurring structural pattern may be recognised as a systems archetype.
The important learning transition occurs when the practitioner encounters a new situation and recognises a structure previously learned elsewhere. The surface story changes, but the underlying relationship pattern becomes familiar.
This is consistent with the broader systems-thinking literature on archetypes. Systems archetypes are intended to help practitioners recognise recurring structural patterns beneath apparently different events; as the patterns become internalised, situations can be understood as larger systemic structures rather than isolated occurrences.
The language of causal links
In causal loop diagramming, S or same-direction relationships indicate that a change in one variable produces a change in the same direction in another, while O or opposite-direction relationships indicate a change in the opposite direction. Feedback structures are then identified as reinforcing (R) or balancing (B) loops. The Systems Thinker provides a useful reference on this language and the associated archetype structures.
The discipline is deliberately empirical. A causal link is a proposition to be examined, not a fact simply because an arrow has been drawn. The diagram makes the practitioner’s theory visible so that evidence, measurement and further observation can challenge or strengthen it.
APPENDIX C. SUBSTANCE USE: WHEN THE BRAIN LEARNS THAT THE REWARD MUST COME FROM OUTSIDE
Substance use provides a powerful counterpoint to the joy of learning because it shows that the brain learns from whatever experience is repeatedly reinforced. Psychoactive substances can directly alter systems involved in reward, motivation, attention, memory, perception, inhibition and decision-making; with repeated exposure, the brain adapts to the substance, while cues associated with its use can acquire the power to trigger anticipation, craving and drug-seeking. NIDA describes how repeated exposure can produce tolerance and withdrawal, and how, over time, drug use may shift from seeking pleasure to seeking relief from the distress that appears when the drug is absent. (NIDA IRP)
This creates a profound change in the relationship between reward and the learner. The joy of discovery arises when the mind discovers that it can now see, understand or do something it could not previously see, understand or do; the capability itself becomes rewarding. With a substance, the pleasurable state is produced externally by the pharmacological action of the substance, and repeated experience can teach the brain to want that externally produced state again. The desire therefore becomes increasingly attached to the return of the reward, rather than to the development of the capability that generated the reward.
This is where dependence becomes particularly important to the systems argument. As repeated exposure changes reward and stress systems, and as environmental cues become predictors of drug effects, the absence of the substance can itself become a signal of threat or distress. NIDA describes withdrawal-related anxiety, irritability and unease and notes that, with increasing drug use, a person may use the drug to obtain relief from this discomfort rather than simply to experience the original high. (NIDA IRP) In severe dependence, the learned relationship can therefore become something like: substance → relief/normality; absence → distress/threat → urgent desire for substance. That does not mean every dependent person literally believes they will die without the substance, but the brain can learn the substance as something it urgently needs, and for some substances withdrawal itself can be medically dangerous.
The contrast with learning is therefore sharper than simply natural reward versus drug reward. In discovery, the sequence can be:
Question → Exploration → Discovery → Capability → Joy → New Question
The reward is generated by becoming more capable, and that capability remains available to the learner. With repeated substance reinforcement, the sequence can become:
Substance → Pharmacological Reward → Relief/Pleasure → Anticipation → Desire → Repetition → Adaptation → Greater Need for the Substance
The systems question is therefore no longer merely What gives the brain pleasure? It is:
What is the brain learning that it needs in order to experience joy?
One pathway teaches the brain, I can discover something and become more capable. The other can teach the brain, I need something outside myself to produce the state I want to feel. That distinction matters because repeated experience does more than produce a momentary feeling: it teaches the brain what to pursue, what to anticipate, what to remember and what it comes to regard as necessary. (NIDA Archives)
APPENDIX D. ROAD ACCIDENTS: WHEN THE BRAIN CANNOT SEE THE CONSEQUENCE
A road accident appears first as an event: a vehicle collides with another vehicle, a pedestrian, an object or the road environment. Systems thinking takes us further by asking what was happening in the moments before the collision, what conditions shaped those moments, and what consequences continue long after the vehicle has stopped. Driving under the influence of a psychoactive substance brings the brain itself into the causal structure, because the substance can alter perception, attention, coordination, judgement and the capacity to process what is happening on the road.
The immediate relationship is therefore straightforward:
Substance → altered brain function → impaired perception/judgement/reaction → poorer driving decisions → increased crash risk → injury or death
WHO identifies driving under the influence of alcohol and other psychoactive substances as a significant road-traffic risk factor. The effects vary by substance, but psychoactive substances can impair functions required for safe driving; WHO also identifies speed, unsafe vehicles, unsafe infrastructure and inadequate post-crash care as other interacting risk factors. (World Health Organization)
The deeper question concerns what repeated substance exposure does to the learner. NIDA describes changes associated with addiction in brain systems involved in reward, stress, judgement, decision-making, learning, memory and behavioural control. With repeated exposure, reward circuitry adapts to the presence of the drug, while changes involving stress and prefrontal systems can contribute to compulsive use and reduced impulse control. (National Institute on Drug Abuse)
This matters because seeing a consequence requires more than having eyes on the road. The brain has to hold the present action together with what may happen next: speed with stopping distance, intoxication with impaired judgement, crossing the centre line with collision, collision with injury, injury with consequences for a family, and repeated risky behaviour with the possibility of eventually producing a pattern of harm. Learning depends on neural plasticity — connections are strengthened, weakened, formed and remodelled through experience. Substance exposure can alter these systems, which means that the capacity to connect action → consequence can itself become part of the problem.
The road therefore becomes a real-time test of consequence-processing. A driver under the influence may have the physical ability to see another vehicle while having impaired capacity to judge its speed, distance or significance; the driver may see the pedestrian while failing to integrate the information rapidly enough to produce the appropriate response. WHO reports that psychoactive substances increase crash risk, while cannabis, for example, can impair psychomotor performance, divided attention and the organisation and integration of complex information. (World Health Organization)
The two chains meet in the driver. The immediate accident is the visible event; the altered capacity to see and process consequences can be part of the structure beneath the event. This is why the systems question cannot stop at the collision, the driver or the substance. We have to follow the river of causes backwards into the brain and forwards through the road, the household, the health system and the economy.
Speed gives us another way to see the same principle. Under constant braking conditions, stopping distance contains both the distance travelled while the driver reacts and the distance required to brake; as speed rises, the braking component rises approximately with the square of speed. A substance that delays perception or reaction therefore enters a physical system in which the road continues to move while the brain is still processing what it has seen.
The consequence may arrive in seconds. The neural and social consequences may continue for years.
That is the systems-thinking shift: from the accident we can see, to the brain that was processing the situation, to the relationships that produced the behaviour, to the consequences that continue after the event.
APPENDIX E. GENDERED VIOLENCE AND HOMICIDE: WHEN THE CONSEQUENCE DISAPPEARS FROM VIEW
A murder arising within an intimate relationship appears first as an event: one person has killed another. The event is visible and final, yet the causal structure surrounding it may have been developing for months or years through controlling behaviour, jealousy, repeated conflict, threats, violence, separation, economic dependence, substance use, access to weapons and the social conditions surrounding the relationship. WHO describes intimate partner violence as involving physical, sexual and psychological harm as well as controlling behaviours, and identifies interacting individual, relationship, community and societal factors associated with violence against women. (World Health Organization)
The systems question therefore begins before the murder:
Where violence has already entered the relationship, the structure can become reinforcing:
Control → Resistance → Conflict → Escalation → Violence → Fear/Submission → Increased Control
The violence itself then changes the conditions from which the next episode emerges. WHO identifies controlling behaviour, power inequality, attitudes that justify violence, harmful alcohol use and exposure to violence in childhood among factors associated with intimate partner and sexual violence. These factors operate across individual, relationship, community and societal levels, so the event cannot adequately be understood by examining the final act alone. (World Health Organization)
The brain has to see what happens next
This brings the neurological question directly into the system.
To restrain an action, the brain has to connect what I am experiencing now with what this action will produce next. Anger, jealousy, perceived rejection or humiliation can narrow attention toward the immediate emotional experience; emotion-regulation difficulties have also been found to be associated with intimate-partner-violence perpetration in a meta-analysis of 62 samples. (PubMed)
Substances can enter the same structure. Alcohol and other psychoactive substances can alter judgement, inhibition, perception and emotional processing, while harmful alcohol use is identified by WHO as a risk factor associated with intimate partner violence. (World Health Organization) The resulting problem is therefore larger than the question of whether someone was angry or intoxicated at the moment of the killing: what has happened to the person’s learned capacity to connect an immediate impulse with its downstream consequences?
The immediate consequence may be experienced by the perpetrator as the ending of an unbearable emotional state. The longer causal chain may contain consequences that the brain, in that moment, fails to integrate: death, imprisonment, children losing a parent, families losing both people, economic disruption, trauma and years of social consequences.
This is where the phrase passion can become analytically interesting. The event may appear to be a sudden explosion, yet the system may have been accumulating structure long before the explosion: a pattern of control, interpretation, emotional activation, conflict and reinforcement. The killing is the visible event at the end of a river of causes.
From the individual to the system
The consequences then travel outward:
Violent Act → Death/Injury → Children and Family → Household Disruption → Economic and Social Consequences → Community/Institutional Response
This wider structure matters because gender-related killings are not simply a collection of isolated interpersonal events. UNODC estimates that in 2024 almost 60% of all women and girls intentionally killed globally were killed by intimate partners or other family members, compared with 11% of male homicide victims killed in the private sphere. The UNODC data therefore reveal a distinct relationship between gender, intimate relationships and lethal violence. (UNODC)
The systems perspective allows us to hold both levels simultaneously: the person made the action, while the action occurred within a structure that had been forming around the person. Understanding that structure does not remove individual responsibility; it makes visible the points at which the trajectory could have changed.
That is the deeper connection with the road-accident example. In both cases, the final event is preceded by a failure or alteration in the processing of consequences. On the road, the driver may fail to integrate speed, perception, reaction and stopping distance quickly enough; in relationship violence, an escalating emotional and relational structure can overwhelm the capacity to connect the immediate action with the human consequences that follow.
The systems question becomes:
What has to be learned, reinforced, weakened or interrupted in the brain, the relationship and the surrounding system so that the next consequence can be seen before the action produces it?
That takes us directly from the murder as an event to the architecture that made the event possible — and therefore to the points at which the architecture can be changed.
The systems practitioner therefore keeps asking:
What happens next?
And then:
What does that consequence change?
That is how an event becomes a causal structure.
APPENDIX F. OTHER STRLDi CASE APPLICATIONS
Human–Wildlife Conflict: Escalation
Human–wildlife conflict can be examined as an escalation structure when actions taken by one side alter the behaviour of the other, which then generates further response from the first. The value of the archetype is that it allows the practitioner to move beyond the sequence of individual incidents and examine the feedback structure sustaining the escalation.
Unemployment: The Onion
The unemployment study provides a particularly useful illustration of moving beneath the visible event. The number of unemployed people is an observable condition, but the system producing persistent unemployment may involve multiple layers of education, skills, production, investment, enterprise formation, labour demand, institutional arrangements and economic structure.
The Onion archetype provides a way to ask what lies beneath the visible condition and what relationships repeatedly reproduce it.
Urgent Files: VDM Case
The urgent-files case illustrates another important distinction: organisations often respond to the most visible and immediate event while the structures generating recurring urgency remain intact. The Vision Deployment Matrix provides a complementary way of moving across levels of perspective—from events and patterns toward systemic structures, mental models and vision.
Daniel H. Kim’s Vision Deployment Matrix was developed as a framework for understanding current reality and desired future reality across multiple levels and for identifying the gaps and actions required to move between them.
STRLDi’s use of the VDM builds on this lineage while integrating it into its broader systems-diagnostic practice. The purpose is ultimately the same: to change the level at which a situation can be seen, and therefore the level at which it can be acted upon.
APPENDIX G. RESEARCH, REFERENCES AND VISUAL EVIDENCE
Neurobiology and learning
Hedrick et al., 2022 — Learning binds new inputs into functional synaptic clusters via spinogenesis. The study used longitudinal in-vivo two-photon imaging and correlated electron microscopy to examine learning-related spine formation in mouse motor cortex.
Sheng et al., 2025 — Remodelling of corticostriatal axonal boutons during motor learning. The study tracked thousands of axonal boutons during motor learning and found dynamic structural and functional remodelling associated with learning.
Matsuzaki et al., 2004 — Structural basis of long-term potentiation in single dendritic spines. This study demonstrated activity-dependent structural enlargement of individual dendritic spines associated with synaptic potentiation.
Lamprecht & LeDoux, 2004 — Structural plasticity and memory. A review examining evidence connecting learning, memory and enduring changes in synaptic structure and function.
Daniel H. Kim — Vision Deployment Matrix: A Framework for Large-Scale Change. Kim’s framework describes five levels of perspective and provides a way of connecting current reality, desired future reality, gaps and action.
Systems Archetypes as Structural Pattern Templates. This reference explains how archetypes can function as recurring structural patterns that help practitioners recognise similar dynamics across apparently different situations.
These sources provide the evidence base for the discussion of speed, human error, safe-system design and the interaction of road, vehicle and human factors.
These provide current global evidence on prevalence and the interacting individual, relationship, community and societal factors associated with violence against women.
APPENDIX H — STEREOGRAM: EXPERIENCE THE SHIFT IN SEEING
The stereogram is included in the article as an experience, not simply as an illustration. The reader is asked to look at a repeated pattern and discover a three-dimensional structure that is already encoded in the image. The important moment is the perceptual shift: the pattern remains the same, while the organisation of what the observer sees changes.
The official Magic Eye instructions recommend bringing the image close to the face, allowing the eyes to relax as though looking through the image into the distance, and slowly moving the image away until the hidden structure emerges. Once the hidden image is perceived, the depth becomes increasingly apparent. (Magic Eye)
For readers who want to understand the technique in more detail:
Magic Eye 3D — The Complete Guide — provides a step-by-step explanation of how to relax the eyes and allow the hidden image to emerge.
The scientific principle is stereopsis: the visual system combines slightly different information from the two eyes to construct depth. Autostereograms exploit this mechanism by embedding repeated patterns with carefully controlled horizontal shifts, allowing a three-dimensional form to emerge when the visual system fuses the appropriate elements. (Sinauer Associates)
Why it belongs in this article
The stereogram provides a small but powerful experience of the distinction between information being present and structure being seen. The reader initially has the same visual information as before the hidden image appears; what changes is the organisation through which that information is perceived. That makes the stereogram a useful bridge into the article’s larger question: what happens when learning gives the mind a new structure through which relationships that were previously invisible become visible?
And importantly, the stereogram should appear in the body of the article itself, in Section C, with the appendix providing the instructions and external resources for readers who want to try it. The reader should experience the phenomenon first and read the technical explanation afterwards.
APPENDIX I — STRLDi REFERENCES: SYSTEMS THINKING, CAUSAL DISCOVERY AND SYSTEM ARCHETYPES
The systems-thinking component of this article builds on the body of work developed by Sheila Damodaran and the Systems Thinking Research & Leadership Development Institute (STRLDi) through research, practice, training and application across persistent organisational, societal and national issues.
1. What are System Archetypes?
This provides the foundational STRLDi treatment of system archetypes as recurring structural patterns composed of interacting reinforcing and balancing feedback loops that generate characteristic behaviour over time. It also establishes the distinction between archetypes as diagnostic structures and their use as narrative or facilitation devices. (STRLDi)
2. Uncovering System Archetypes — Systemic Structures
This reference sets out the practical discipline of causal-loop construction, including variables, S/O relationships and the even–odd O rule for distinguishing reinforcing and balancing loops. It is particularly relevant to this article’s progression from variable → relationship → causality → loop → archetype. (STRLDi)
STRLDi’s treatment of dynamic complexity distinguishes the visible event from the behaviour over time and systemic structure producing persistent behaviour. It provides an important foundation for the article’s proposition that learning to see means moving progressively beneath events toward relationships, feedback and structural persistence. (STRLDi)
4. Shared Vision: Envisioning the Whole for the Future
This work develops the movement across Events, Patterns, Systemic Structures, Mental Models and Vision, and includes STRLDi’s treatment of the Vision Deployment Matrix. It is relevant to the article’s movement from observing reality toward understanding the structures that generate it and then identifying where change can occur. (STRLDi)
5. Practicing the Five Disciplines — STRLDi Compendium
The STRLDi Compendium brings together Behaviour Over Time, Causal Loop Diagrams, Vision Deployment Matrix, leadership reflection and the Laws of Dynamic Complexity as a repeated learning rhythm. This is especially relevant to the article’s argument that systems thinking is developed through practice: seeing a pattern, uncovering its structure, identifying leverage and learning to recognise the structure again. (STRLDi)
The Onion represents Sheila Damodaran’s development of a way of seeing the whole system through recurring systemic structures. Its significance for this article is particularly strong because it illustrates the transition from individual archetypes toward interconnected structures operating across persistent national and societal issues. (STRLDi)
This framework places System Archetypes, the Onion Model and Causal Loop Diagrams at the structural level, distinguishing them from tools concerned primarily with events, patterns, alignment or execution. It provides a useful reference for the article’s argument that different tools enable different levels of seeing. (STRLDi)
8. STRLDi Training: Deepening the Systems Thinking Discipline
This programme material documents the deliberate training pathway through which learners move from causal loops and behaviour-over-time graphs to system archetypes and strategic intervention. Of particular relevance to this article is the description of the learner acquiring a new way of seeing the behaviour of reinforcing and balancing loops over time. (STRLDi)
STRLDi’s comprehensive archetype reference brings together the major archetypes—including Reinforcing and Balancing Loops, Fixes That Fail, Shifting the Burden, Limits to Growth, Escalation, Success to the Successful, Drifting Goals, Growth and Underinvestment, Tragedy of the Commons and Accidental Adversaries—as a practical working reference. (STRLDi)
The development of this work extends over decades of practice, beginning with the observation of recurring patterns and developing through Behaviour Over Time, System Archetypes, organisational learning and the application of systems thinking to organisational, national and global issues. (STRLDi)
STRLDi explicitly acknowledges Dr Daniel H. Kim for the creation of the Vision Deployment Matrix™, published in The Systems Thinker in 1995. The STRLDi work builds on this foundation as part of its broader practice of moving between events, patterns, systemic structures, mental models and vision. (STRLDi)
These references establish that the systems-thinking portion of When a Nation Learns to See is not being assembled from generic descriptions of systems thinking. It emerges from STRLDi’s own body of practice and inquiry into persistent behaviour, causal structures, system archetypes, dynamic complexity, the Vision Deployment Matrix and the development of systemic interventions.
—should therefore be presented as part of the intellectual and practical development of this work, with the individual STRLDi references above allowing readers to follow the deeper material.
And I would make Appendix I the author’s reference base, while the preceding scientific appendix remains the evidence base for the neurobiology. That cleanly separates the two: the neuroscience tells us what is known about learning and neural plasticity; the STRLDi references show the body of systems-thinking practice through which we have developed the question of what happens when people learn to see causal structure.
A FINAL NOTE ON THE EVIDENCE
The central proposition of this article is deliberately broader than any single neuroscience experiment. The research establishes that learning is accompanied by changes in neural function and, in relevant experimental settings, by structural changes in synapses, dendritic spines and axonal boutons. The systems-thinking proposition is that repeated practice in representing and recognising causal relationships can develop a transferable capability for seeing recurring structures.
The bridge between those two bodies of knowledge should therefore be stated carefully. We do not have evidence that learning a particular systems archetype creates a particular identifiable synapse, nor should we claim that a causal-loop diagram maps directly onto a microscopic neural structure. What the evidence permits us to say is more useful: the brain is plastic, experience changes neural organisation, and deliberate learning can develop new capabilities of perception, representation, retrieval and application.
The national proposition follows from there. If causal structures can be learned, recognised and transferred across situations, then a society can deliberately cultivate people who are increasingly capable of seeing the relationships that produce persistent outcomes. That makes systems intelligence a candidate for national capability formation—not because the brain is a metaphor for the nation, but because the people who constitute the nation’s institutions are the brains through which its strategies are conceived.
A Direct Question for the Presidency, Cabinet and the Nation
Yes. Botswana can get its STEM right.
But Botswana will not get STEM right by simply adding more STEM subjects, building more laboratories, purchasing more computers or announcing another education reform. The country will get STEM right when it decides, clearly and deliberately, what kind of economy it intends to build—and then works backwards to construct the human capability required to carry it.
This is the point at which the national conversation must become more honest. STEM is not an education programme sitting beside the economy. STEM is part of the productive architecture of the economy itself, because the people who understand mathematics, science, engineering and technology are eventually the people who plan, design, operate, repair, improve and create the systems upon which a modern productive nation depends.
President Khama’s question—Can Batswana get their STEM right?—therefore deserves a direct answer. Yes, they can. But Botswana must first decide what economic performance it intends to achieve, what productive sectors must carry that performance, what those sectors must produce, and how many people, with what capabilities, will be required to do the work.
Only then can the country know what STEM it needs to build.
The question, therefore, is not simply whether Botswana can get STEM right. The deeper question is whether Botswana is prepared to count the future economy it intends its people to build—and then deliberately work backwards to prepare them to build it.
Economic Performance ↓ Productive Sectors ↓ Enterprises and Production ↓ Occupations ↓ Capabilities ↓ Teachers, Trainers and Institutions ↓ Education Investment
ARTICLE CONTENT SHEET
Building the Human Capability Required to Carry Botswana’s Future Economy
1. Can Batswana Get Their STEM Right?
The central question for Botswana’s future economic capability.
2. The Question Is Bigger Than the Classroom
Why STEM is an economic and national capability issue.
3. The Structural Trap
Why improving education alone will not solve the problem.
4. The Ground Is Moving
Population growth, technological change and rising economic requirements.
7. The Country Cannot Afford to Discover Its Needs Too Late
Why Botswana must count the future before the future arrives.
8. The National STEM Capability Architecture
STEM Council
National Capability Architecture
Administration
Curriculum Design
Teacher Training
Assessment
Experienced Batswana
Overseas expertise
Foreign specialist capability
9. When Will Capability Begin to Show?
Years 1–5 — Capability begins
Years 6–10 — Capability becomes visible
Years 11–20 — Capability reproduces itself
10. What the Twenty-Year Shift Would Actually Build
The economic and human capability Botswana would progressively develop.
11. What Would This Cost Botswana?
Annual investment
Twenty-year investment
Cost per capita
Investment relative to national economic capacity
The cost of acting versus the cost of not acting
12. The Decision Before the Presidency
The shift does not need to alarm Botswana.
The alarm should come when Botswana refuses to count what the future requires.
↗️THE QUESTION IS BIGGER THAN THE CLASSROOM
Botswana must begin by recognising that the problem does not start inside the school. A child can pass mathematics, science and technology examinations and still emerge into an economy with too little productive space in which to use those capabilities. Equally, an economy can say that it wants engineers, scientists, technicians and technology specialists while continuing to produce too few teachers, laboratories, technical environments and enterprises capable of developing and absorbing them.
This is the chicken-and-egg structure Botswana must deliberately break.
The country cannot wait for the jobs before building all the capability, because in some cases capability itself is one of the conditions required for the jobs to emerge. An investor considering a manufacturing operation, advanced agricultural system, engineering facility or technology business does not look only for land and tax incentives; the investor also looks for people capable of operating, managing, improving and growing the system.
This means Botswana can become trapped between two apparently reasonable questions. The education system asks, Why produce people for jobs that do not yet exist? The productive economy asks, Why create the jobs here if the people required to operate the system do not yet exist?
And while the two sides wait for each other, the nation stands still.
The Data Should Make Botswana Pause
Botswana is not starting this conversation from a position of abundance. Statistics Botswana currently records a national population of 2,359,609 from the 2022 Census, while its published official formal employment indicator is around 30%. The scale of the problem therefore cannot be understood merely as an individual failure to find work; it must be understood as a question about the productive capacity of the national system to create sufficient places for people to contribute. (Statistics Botswana)
The STRLDi work, What Are We Creating?, deliberately moves the question further. It asks Botswana not simply to count the people it has today, but to look forward and determine the engineers, mathematicians, scientists, technicians, ICT specialists, agricultural specialists, managers and producers the country will require if it intends to build a substantially larger productive economy. (National Strategy Firm)
That changes the starting point completely.
The question is no longer:
How many STEM learners do we have?
The question becomes:
What productive economy are we creating, and how many people with what capabilities will be required to sustain it?
↗️BOTSWANA MUST WORK BACKWARDS FROM THE FUTURE
This is where the architecture of national thinking must turn around. The education system cannot simply begin with the schools it currently has, the teachers currently available, and the budget currently allocated, and then ask what kind of people can be produced from those existing inputs. That approach allows yesterday’s capacity to determine tomorrow’s possibility.
Botswana must instead begin with the future productive outcome. If the country intends to build larger productive sectors in agriculture, manufacturing, industry, energy, technology and services, then it must determine the enterprises required; from those enterprises, the occupations required; from those occupations, the capabilities required; and from those capabilities, the education and training architecture required to produce them. (National Strategy Firm)
The national sequence should therefore be:
FUTURE ECONOMIC PERFORMANCE
↓
PRODUCTIVE SECTORS
↓
ENTERPRISES
↓
OCCUPATIONS
↓
CAPABILITIES
↓
TEACHERS, TRAINERS AND INSTITUTIONS
↓
CURRICULUM, ASSESSMENT AND LEARNING ENVIRONMENTS
↓
NATIONAL INVESTMENT
That is how Botswana gets STEM right.
↗️WHAT DOES THE FUTURE ECONOMY ACTUALLY REQUIRE?
Botswana has spent many years discussing economic transformation in broad terms. The country must diversify the economy. Manufacturing must grow. Agriculture must become productive. More young people must enter STEM fields. Unemployment must fall. These statements are familiar and, in themselves, difficult to disagree with. But eventually a country must move beyond agreeing that more is required and begin asking how much more, for what purpose, and by when.
A President cannot build an economy with the word more. A Minister cannot plan a productive sector with the word growth. An education system cannot prepare the workforce with the instruction to produce better skills. At some point, every national ambition must become a number.
That is the point Botswana must now reach. How many people will the country require to plan the economy? How many will be required inside public institutions to carry out the plans? How many farmers, manufacturers, engineers, technicians, machine operators, researchers and logistics personnel must be on the ground? And how many of them must possess sufficient STEM capability for Botswana to keep up with the ground moving beneath the global economy?
The Numbers Are Not The Final Answer. They Are The Beginning of The Question.
The numbers presented here are STRLDi horizon-planning proxies. They are not being presented as a final government manpower establishment, and they should be tested, verified, and refined by Botswana’s institutions using their own administrative, population, education, labour, and sectoral data. Their purpose is to make the approximate order of magnitude visible before the country discovers, too late, that it has not prepared enough people.
This distinction is important. STRLDi is not presenting Botswana’s official national manpower establishment. But Botswana cannot wait for an official establishment before beginning to see the scale of the future economy. The purpose of these numbers is to cause the country to look hard enough that it begins checking for itself.
Because once the numbers are visible, the questions change. The Presidency can ask whether the country has counted enough people. Ministers can ask whether their institutions possess enough technical capability. Education institutions can ask whether they are producing the people the economy will require. And the country can finally begin to plan backwards from the economy it must build rather than forwards from the institutions it already has.
The Economy Must First Be Seen As People
Botswana’s future economy will not be carried by institutions alone. It will be carried by people performing different functions at different points in the national system. Some people must see and plan the whole economy. Others must translate the plans into public execution. Others must physically produce, process, build, operate and move value through the system.
These are three different national requirements. They should not be confused with one another. A country can have people producing without sufficient coordination. It can have planners without sufficient execution. And it can have institutions executing activities without knowing whether those activities are moving the economy towards the productive capacity required by the population.
The STRLDi horizon model therefore begins by separating the economy into three broad capability populations:
Those who plan and direct.
Those who carry out and coordinate the plans.
Those who physically produce and move value.
Only when all three populations are counted can Botswana begin to see the actual size of the national economic task.
First, Someone Must See The Whole Economy
A farmer can see the farm. A manufacturer can see the factory. A logistics operator can see the goods moving through a route. A school can see the students passing through its classrooms. A ministry can see the programmes under its responsibility.
But who sees the whole movement?
Who sees the population entering the system? Who sees the future demand they will create? Who calculates the food, manufactured goods, infrastructure, energy, water, skills and productive capacity required to carry them? Who connects those requirements to the education system before the future workforce arrives?
That is the first workforce Botswana must count.
The First National Requirement: Those Who Plan And Direct
The initial STRLDi proxy identifies approximately 6,000 people required across national planning, sector planning, demand definition, capability forecasting, productive coordination and national economic direction. This number is not intended to describe 6,000 people sitting in offices producing reports.
These are the people required to make the economy visible.
They must be able to define national and sectoral demand. They must identify what Botswana needs to produce for itself and what it intends to supply beyond its borders. They must forecast productive requirements, identify skills, connect infrastructure, monitor bottlenecks and continuously adjust the national operating system as population, technology, markets and productive conditions change.
The requirement grows because the economy itself must grow in complexity and capability.
National Planning & Direction
Today
5 Years
10 Years
20 Years
Planning and Direction Personnel
6,000
7,500
9,000
12,000
The number begins at 6,000 because planning itself is a national capability. Botswana cannot expect a future economy carrying more people, more productive sectors, more technology, more infrastructure and more regional trade to be continuously directed by an invisible or fragmented planning capability.
But Planning Does Not Make The Economy Move
A national plan does not grow food. It does not manufacture goods. It does not operate machinery. It does not move products across the country or into regional markets.
Someone must carry the plan through the system.
This is where Botswana’s public institutions enter the pipeline. Ministries, Sector Operator Units, Corridor Operators, standards institutions, public research institutions, infrastructure institutions and other national functions must translate economic direction into conditions under which production can actually occur.
This is not the same as asking whether institutions are busy.
The question is whether institutions are moving the productive pipeline.
The Second National Requirement: Those Who Carry Out The Plan
The initial STRLDi proxy identifies approximately 24,000 people required across public pipeline execution functions today. As the productive system expands, this rises towards approximately 32,000 personnel within five years, 42,000 within ten years, and 60,000 within twenty years.
These personnel sit across the functions required to turn national direction into economic movement. They include people capable of coordinating productive sectors, recognising technical capability, managing standards, connecting infrastructure, processing requirements, monitoring production conditions and removing institutional bottlenecks.
Public Pipeline Execution
Today
5 Years
10 Years
20 Years
Public Execution Personnel
24,000
32,000
42,000
60,000
These numbers matter because the productive economy cannot move faster than the institutions through which it must pass.
A trained producer can be ready. A manufacturer can have the machinery. A farmer can have the land. But if the technical approval, infrastructure connection, standard, water requirement, power requirement, quality verification or other institutional function remains red, the productive system stops.
This is why the public sector cannot stand outside the productive economy and simply regulate it. It is part of the machinery that determines whether the economy moves.
The Public System Must Know What It Is Looking At
This creates a further requirement that Botswana has not sufficiently counted.
How many people inside the public system have sufficient STEM capability to recognise the productive skills the national pipeline requires?
The question matters because the future economy will become more technically demanding, not less. Agriculture is becoming increasingly scientific and technology-driven. Manufacturing requires growing familiarity with production systems, machinery, materials, automation and quality. Logistics increasingly depends on technology, data and complex systems.
The people planning and carrying out the national economic architecture cannot remain technically distant from the systems they are responsible for moving.
The more familiar public institutions become with the productive capabilities required by the national pipeline, the easier it becomes to recognise those capabilities when they appear. Skills can be assessed more intelligently. Infrastructure can be planned with greater precision. Standards can be applied with greater understanding.
The institutional lights begin to turn green faster and more often.
Then Comes The Largest Requirement: The People Who Produce
Planning and public execution create the conditions.
But the economy is ultimately carried by people who physically produce value.
These are the farmers producing raw materials. The manufacturers converting raw materials into goods. The engineers designing and improving systems. The technicians maintaining machinery. The machine operators running production lines. The quality specialists ensuring that goods meet standards. The logistics operators moving products from one point to another.
This is where the national pipeline finally becomes visible on the ground.
The initial STRLDi horizon proxy places the direct productive workforce requirement at approximately 200,000 people today. Within five years, the requirement rises towards approximately 365,000 people. Within ten years, the productive workforce requirement reaches approximately 620,000 people.
By the twenty-year horizon, the proxy points towards approximately 1,115,000 people directly engaged in the productive economy.
The Productive Economy Cannot Remain Small While The Population Grows
This is the number that should cause the country to stop.
Botswana cannot carry a significantly larger future population with a productive economy that expands only marginally. More people will require more food, more goods, more infrastructure, more energy, more services and more productive capacity. The productive system must therefore expand ahead of the population pressure arriving behind it.
The question is not whether Botswana needs one million additional government jobs.
It does not.
The question is whether Botswana can build a productive economy in which approximately 1.115 million people are directly engaged in producing, processing, manufacturing, building, maintaining, operating and moving value by the twenty-year horizon.
Direct Productive Workforce
Today
5 Years
10 Years
20 Years
Productive Workforce
200,000
365,000
620,000
1,115,000
That is the size of the question.
Where are these people going to come from?
The Economy Must Now Be Broken Open By Sector
The answer cannot remain hidden inside one national total.
A country does not produce one million people called “the workforce.” It requires people across specific productive sectors, performing specific functions, with specific capabilities. Agriculture requires a different combination of people from manufacturing. Manufacturing requires different capabilities from energy. Logistics requires different capabilities from construction.
This is why Botswana must begin counting its future workforce sector by sector.
The initial STRLDi productive workforce proxy is as follows:
Productive Sector
Today
5 Years
10 Years
20 Years
Agriculture & Primary Production
80,000
130,000
190,000
300,000
Agro-Processing
12,000
25,000
50,000
100,000
Manufacturing
25,000
50,000
100,000
220,000
Construction & Industrial Infrastructure
20,000
35,000
60,000
100,000
Energy, Water & Utilities
8,000
15,000
25,000
45,000
Transport & Logistics
15,000
30,000
55,000
100,000
ICT, Data & Industrial Services
10,000
25,000
50,000
100,000
Other Productive Services
30,000
55,000
90,000
150,000
TOTAL
200,000
365,000
620,000
1,115,000
Now the future economy begins to take shape.
Agriculture Alone Requires A Much Larger System Than Farmers
Agriculture becomes the first place where the national numbers can be seen in detail.
The twenty-year horizon points towards approximately 300,000 people directly engaged across agriculture and primary production. But this number must not be imagined as 300,000 isolated farmers operating independently.
A productive agricultural economy requires producers, farm managers, technicians, soil specialists, irrigation personnel, equipment specialists, quality personnel, aggregation systems, and people capable of connecting production to processing and markets.
The farmer is one part of the productive system. The farm is not the whole pipeline.
This is why the STRLDi Agricultural Corridor architecture is important. It connects national demand to Sector Operator Units, Corridor Operators, production clusters, farmers, aggregation, logistics and markets. Every handover requires people, capability and physical capacity.
From The Farm, The Economy Must Keep Moving
Raw agricultural materials do not automatically become economic value.
They must be aggregated. They may require cleaning, grading, storage, processing, packaging, cold-chain systems and transportation. They may then enter manufacturing before reaching domestic, regional or international markets.
This is where the economy begins to multiply its productive workforce.
The movement from approximately 80,000 people in agriculture and primary production today towards 300,000 within twenty years therefore cannot be planned as an agricultural programme alone. It must be planned together with the processing, manufacturing, infrastructure, logistics and technical systems required to receive the output.
Otherwise Botswana can successfully increase production only to discover that it has nowhere for the production to go.
Manufacturing Is Where STEM Must Become Physical
The manufacturing numbers are equally important.
The STRLDi proxy moves manufacturing from approximately 25,000 people today towards 50,000 within five years, 100,000 within ten years, and approximately 220,000 within twenty years. This is not a call for Botswana to simply establish more small businesses.
It is a call to build productive capability capable of converting raw materials into completed goods at speed, volume and quality.
This is where the meaning of industrial engineering must be understood correctly.
The requirement is not limited to mining engineers or civil engineers. Botswana requires people capable of understanding the complete movement from raw material to finished product. Raw materials produced by people and the productive land must increasingly enter machinery and systems capable of producing completed goods at exceptional speed and consistency.
The Country Must Learn To See What It Already Uses
Batswana use vehicles.
Batswana wear clothes.
Batswana consume processed food.
Batswana use machinery.
Batswana drink coffee, wines and beverages.
Batswana use sauces, packaging, household goods, medical products, electronics and construction materials.
The question is therefore not whether people in Botswana use manufactured goods. The question is why so much of the knowledge required to produce those goods remains outside the national productive system.
Every product represents a production process.
Every production process represents knowledge.
Every machine represents engineering.
Every factory represents the organisation of people, technology, materials, energy, quality and logistics.
The future STEM architecture must enable Botswana to increasingly understand and participate in these processes rather than simply consume their outcomes.
The STEM Question Now Becomes Impossible To Avoid
Once the productive workforce requirement is placed on the table, the STEM question changes completely.
The country is no longer asking how many students should take science and mathematics because STEM is fashionable or because international development frameworks recommend it. Botswana must ask how much technical capability is required to operate the economy it intends to build.
The STRLDi proxy identifies approximately 76,050 STEM-capable personnel required across the productive system today. This rises to approximately 142,250 within five years, 248,000 within ten years, and approximately 457,250 within twenty years.
Nearly half a million STEM-capable people.
That is the number the country must now look at.
STEM Cannot Be Left Inside The Classroom
The STEM requirement must be distributed throughout the economy.
It must exist in agriculture.
It must exist in agro-processing.
It must exist in manufacturing.
It must exist in construction and infrastructure.
It must exist in energy and water.
It must exist in logistics.
It must exist in ICT and industrial services.
And critically, it must increasingly exist inside the public institutions responsible for planning and carrying the national pipeline.
The sectoral proxy makes the scale visible:
STEM-Capable Workforce
Today
5 Years
10 Years
20 Years
Agriculture & Primary Production
24,000
39,000
57,000
90,000
Agro-Processing
5,400
11,250
22,500
45,000
Manufacturing
12,500
25,000
50,000
110,000
Construction & Industrial Infrastructure
8,000
14,000
24,000
40,000
Energy, Water & Utilities
4,400
8,250
13,750
24,750
Transport & Logistics
5,250
10,500
19,250
35,000
ICT, Data & Industrial Services
6,000
15,000
30,000
60,000
Other Productive Services
10,500
19,250
31,500
52,500
TOTAL
76,050
142,250
248,000
457,250
Now the education question has a destination.
Can Botswana Produce Half A Million STEM-Capable People?
This is where the country must now confront the education pipeline honestly.
If Botswana currently produces only a relatively small proportion of graduates with a reasonable level of STEM capability, then the question is no longer simply whether STEM results should improve. The question becomes whether the current education pipeline can physically produce the numbers required by the future economy.
The twenty-year horizon points towards approximately 457,250 STEM-capable people distributed across the productive system alone. This excludes the wider technical familiarity increasingly required within planning, public execution and supporting institutional functions.
Botswana must therefore begin counting backwards.
How many STEM-capable people must be added each year?
How many teachers must be capable of teaching them?
How many teacher trainers are required?
How many laboratories?
How many technical institutions?
How many apprenticeships?
How many industrial placements?
How many experienced practitioners must be brought back into education?
The future workforce cannot be produced by wishing harder.
This Is Why The STEM Architecture Must Begin Now
The twenty-year shift does not mean Botswana will wait twenty years before capability begins to appear.
That would be a misunderstanding of the architecture.
The first capabilities must begin appearing within the first five years.
The first five years are when Botswana builds the people and institutions capable of changing the education and economic pipeline. Experienced STEM professionals, including Batswana with demonstrated capability in industry, education, administration, research and technical practice, must be identified and positioned where their experience can begin reshaping the architecture.
By the second five-year period, the first major cohorts moving through the strengthened system should begin entering the wider productive economy.
By ten years, Botswana should be seeing the architecture changing the workforce on the ground.
By twenty years, the country should possess a significantly deeper domestic capability capable of reproducing itself.
The Four Capability Populations Must Now Be Built Together
The numbers also reveal that Botswana cannot depend upon one generation of students to carry the entire transition.
The country must work with four capability populations simultaneously.
The first is the existing capability pool: experienced Batswana in the country and abroad, technical specialists, engineers, scientists, researchers, teachers and practitioners whose accumulated knowledge can immediately help build the national architecture.
The second is the existing workforce: people already inside public institutions and productive sectors who require upgrading and repositioning as the national pipeline becomes more technically demanding.
The third is the future workforce: children and young people moving through basic education, secondary education, TVET, universities, apprenticeships and practical industry experience.
The fourth population is perhaps the most important of all: the people who build the other three.
Who Will Build The People Who Must Build The Economy?
Teachers cannot be treated as an afterthought.
Teacher trainers cannot be treated as an administrative support function.
Curriculum architects cannot be isolated from the economy they are preparing people to enter.
Assessment cannot measure only whether students remember what was taught if the national objective is to determine whether they can understand, apply, design, solve and produce.
The people building the capability pipeline are themselves the first capability pipeline Botswana must strengthen.
That is why the proposed STEM Council and Capability Architecture are not simply education reforms.
They are part of national economic infrastructure.
When The Numbers Are Put Together, The National Task Becomes Visible
The three major capability populations can now be placed together.
Core Economic Capacity
Today
5 Years
10 Years
20 Years
National Planning & Direction
6,000
7,500
9,000
12,000
Public Pipeline Execution
24,000
32,000
42,000
60,000
Direct Productive Workforce
200,000
365,000
620,000
1,115,000
TOTAL CORE CAPACITY
230,000
404,500
671,000
1,187,000
The STEM-capable workforce must then be developed through and alongside this system.
At the twenty-year horizon, Botswana is not simply looking at a larger population.
It is looking at the requirement to carry more than 1.18 million people across the core functions of planning, public execution and direct productive activity.
And approximately 457,250 STEM-capable people must increasingly form part of the productive capability required on the ground.
Now The Question Must Reach The Presidency
These numbers are not intended to alarm Botswana into paralysis.
They are intended to prevent Botswana from being alarmed later by a future it could already see coming.
The country does not have to build everything tomorrow.
But it must know what tomorrow requires today.
A twenty-year requirement can be broken into five-year movements. A ten-year capability requirement can be translated into annual education output. A workforce requirement can be broken into sectors. A sector requirement can be broken into occupations. Occupations can be translated into capabilities.
And those capabilities can finally be translated into:
teachers, trainers, curriculum, laboratories, technical institutions, apprenticeships, industrial experience and national investment.
The Shift Does Not Need To Alarm Botswana
The shift is large.
But large does not mean impossible.
The country does not need to find 1.18 million people tomorrow morning. It does not need to produce half a million STEM-capable people in a single year. It does not need to build every factory, laboratory, corridor and productive system at once.
It needs to begin moving deliberately and at the right scale.
The first requirement is to count.
The second is to define.
The third is to build backwards.
And the fourth is to keep moving before the ground moves further away.
The Alarm Should Come When Botswana Refuses To Count
The real danger is not discovering that the country requires more capability than it currently possesses.
Every country building a more sophisticated economy discovers capability gaps.
The real danger is refusing to see the gap until population pressure, unemployment, technological change and global competition have already widened it.
The alarm should not be the number.
The alarm should be discovering twenty years from now that Botswana knew people were coming, knew the global economy was moving, knew its productive system required greater technical capability—and still did not count what it needed to build.
That is the price future generations should not be asked to pay.
The Decision Is Now Simple
Botswana can continue to speak about STEM, employment, diversification and economic transformation as separate national conversations.
Or it can begin connecting them.
Population tells us how many people are coming.
Demand tells us what they will require.
The productive sectors tell us what must be produced.
The workforce numbers tell us how many people are required.
STEM tells us what level of capability must increasingly exist throughout the system.
Education tells us how the capability must be reproduced.
And the National Economic Operating System tells us how the whole country can begin moving together.
That is the pipeline.
And now, for the first time, the pipeline is beginning to show not only how Botswana must move—but how many people Botswana must carry as it moves.
The Missing Pathway to Prosperity
A country cannot indefinitely educate, qualify and raise the expectations of its population without also expanding the productive pathways through which people can build a future. When the economy does not create sufficient opportunities to produce, invent, manufacture, build enterprises and solve real problems, the search for prosperity does not disappear. It simply moves elsewhere.
This is where Botswana must take a harder look at the horizon. A population that cannot see a credible pathway from education to productive participation may increasingly become vulnerable to speculative pathways to wealth—quick-return schemes, gambling behaviour, unsustainable financial speculation, pyramid structures and other forms of economic activity built around the hope of getting rich without producing anything of lasting value.
The issue is not simply individual behaviour or poor decision-making. People respond to the pathways they can see. If productive enterprise appears slow, inaccessible or unrewarding, while speculative opportunities promise immediate returns, some people will inevitably move towards the latter. A nation must therefore ask itself a more difficult question: What economic pathways are we placing in front of our people—and what are we leaving them to invent for themselves?
This is why the STEM question is larger than education. Botswana does not simply need young people who can pass science, mathematics, engineering and technology subjects. Botswana needs an economy capable of giving those capabilities somewhere productive to go. Otherwise, the country may continue producing educated people with increasing expectations while leaving the productive architecture required to absorb their knowledge dangerously underdeveloped.
The alternative to speculation is not telling people not to speculate. The alternative is building a visible productive pathway through which people can see how knowledge, skill, enterprise, invention and work can lead to prosperity.
↗️THE COUNTRY CANNOT AFFORD TO DISCOVER ITS NEEDS TOO LATE
Botswana cannot wake up in 2040 and suddenly discover that it needs engineers. It cannot arrive at the point of industrial expansion and then discover that there are insufficient production managers, technicians, quality specialists, engineers or mathematics teachers. By the time the shortage becomes visible inside the economy, the education system may already be ten or twenty years behind the requirement.
That is the nature of human capability. A laboratory can be built within a relatively short period; a highly capable science teacher takes years to develop. A computer can be purchased immediately; a mathematician capable of teaching children to think mathematically cannot be purchased in the same way.
A productive workforce is not manufactured overnight.
The country therefore has to see capability as a national production system. Children enter the system today, teachers develop over time, technical capability deepens through practice, enterprises become more sophisticated and institutions learn how to carry increasingly complex work. If Botswana waits until the economy demands the capability at scale, it will already be late.
This Is Where The Shock Must Come
The shock Botswana needs is not that building national capability will take twenty years.
The shock should be that the country will spend the next twenty years doing something anyway.
It can spend twenty years responding to unemployment after it appears. It can spend twenty years managing the consequences of insufficient capability, training people for opportunities that have not yet been deliberately created and importing expertise that Botswana could have begun building within its own population.
It can spend twenty years watching talented Batswana leave because the productive economy has insufficient room for what they can do. Or it can spend twenty years constructing the mathematical, scientific, technical, engineering and productive capability that allows the next generation to enter a fundamentally different economy.
That is the choice Botswana faces.
And this is why the shift should not alarm the country. The alarm should come when Botswana decides not to make the shift and discovers, twenty years later, that the world continued moving while the country remained organised around capabilities the future no longer rewards.
The Most Important Question: Who Does Botswana Already Have?
Before Botswana spends billions searching for solutions outside its borders, the country should first conduct a serious national search for the capability it already possesses. There are Batswana who have demonstrated exceptional ability in mathematics, science, engineering, technology, technical fields, research and specialised professions over decades of work, academic achievement and professional performance.
Some are inside Botswana. Some are working overseas. Some have spent their professional lives inside industries and institutions whose level of technical complexity Botswana has not yet created sufficiently at home.
And some are now approaching the point at which they will retire.
Botswana must ask itself a difficult question.
What happens if a country spends decades producing, educating and exposing capable people to the world—and then allows their accumulated knowledge to leave the productive life of the nation without deliberately transferring it into the next generation?
That is not simply a retirement question.
It is a national capability question.
The 45–55 Capabilty Window
The proposal requires Botswana to deliberately identify Batswana approximately within and around the 45–55 age range, together with others approaching retirement, who have demonstrated exceptional STEM capability through sustained records of achievement. The identification should not depend simply on academic qualifications, titles or institutional seniority, but on what the individual has actually demonstrated an ability to understand, build, solve, design, manage, teach, discover or improve.
This group may contain engineers who have worked on complex systems, scientists who have undertaken advanced research, mathematicians, technology specialists, technical professionals, manufacturing experts, agricultural scientists, researchers, educators and Batswana who have acquired capabilities inside international organisations and industries. The country must find them before their accumulated knowledge simply disappears from the national system.
Not all of them should become classroom teachers.
That would be another mistake.
Botswana should instead ask where each person’s capability creates the greatest multiplication effect.
Do Not Bring Them Home To Fit Into The Old Box
This is where the national architecture must become bold.
Botswana should not invite highly capable people back into the country merely to place them inside ordinary administrative structures and ask them to conform to salary scales and job descriptions that were never designed for the work they are capable of doing. The country would be importing or recovering capability, only to reduce it to fit inside the very structures that failed to produce sufficient capability in the first place.
The question should not be:
What position can we give this person?
The question should be:
What part of Botswana’s future capability can this person help us build?
That distinction is enormous.
A highly capable engineer may not be most valuable teaching thirty children in a classroom. That same engineer may be capable of designing a national technical curriculum, developing two hundred teachers, creating apprenticeship standards, redesigning engineering learning environments and helping establish the relationship between schools, technical institutions and productive enterprises.
Botswana must therefore stop thinking only in terms of positions and begin thinking in terms of national capability production.
The Proposal: A National STEM Capability Architecture
Botswana should establish a National STEM Capability Architecture whose purpose is to build the mathematical, scientific, engineering and technical capability required to improve the nation’s economic performance over the next twenty years. This should not be another project sitting temporarily within one ministry, dependent upon the political cycle or changing whenever an administrator changes.
It should be treated as a long-term national capability system.
The system should identify exceptional Batswana first and place them where their knowledge can multiply through the national architecture. Where Botswana does not possess sufficient capability locally, the country should deliberately recruit international specialists—not as permanent substitutes for Batswana, but as capability builders with a clear national knowledge-transfer responsibility.
The architecture should be designed to answer one question every year:
Is Botswana becoming more capable of producing and sustaining the economy it says it wants?
If the answer is no, the system must be able to show where the capability pipeline has broken.
The First Principle: Build The People Who Build The People
This is where Botswana can become dramatically smarter.
The country should not focus first on how many children can be placed into STEM programmes. It should focus on who will build the teachers, who will design the learning architecture, who will determine the mathematical progression, who will construct the assessment systems and who will connect STEM learning to the productive economy.
The people who build the people are the first production constraint.
The STRLDi capability work already identifies teachers as a national production constraint because the specialist capability of teachers must precede the workforce those teachers are expected to produce. If Botswana requires significantly larger numbers of mathematically, scientifically and technically capable people, then it must first establish the people capable of producing them at scale. (National Strategy Firm)
This means that the country’s strongest people should not automatically disappear into retirement or remain isolated within private careers. Some should become the national capability builders responsible for transferring what they know into teachers, institutions, curriculum systems and ultimately generations of Batswana.
That is where the transformation begins.
THE CENTRAL QUESTION
Can Batswana get their STEM right?
Yes.
But Botswana must stop treating STEM as something the education system does to children and begin treating STEM capability as something the entire nation deliberately builds for the future economy. The country must work backwards from the economic performance it intends to achieve, identify the productive sectors and occupations required, calculate the human capability required and then build the education architecture capable of producing those people before the economy reaches the point at which it desperately needs them.
The country already has a starting advantage.
There are Batswana who have spent decades acquiring knowledge, experience and capability. Some are still working. Some are overseas. Some are approaching retirement.
Botswana’s first act of intelligence may therefore be to recognise its own intelligence.
The next question is no longer whether the country has capable people.
The next question is whether Botswana has the national architecture intelligent enough to find them, organise them, protect their work from short-term interference and allow them to build the people who will build the future. (National Strategy Firm)
THE QUESTION PRESIDENT KHAMA ASKED
Can Batswana Get Their STEM Right?
This question is much larger than education.
It is larger than examination results, science laboratories, mathematics classrooms or the number of students graduating with qualifications. President Khama’s question reaches into the productive capability of the nation itself. Can Botswana deliberately produce the mathematical, scientific, technical and engineering capability required to build the economy that will sustain its people?
The answer is yes.
But Botswana will not get there by continuing to treat STEM as another department within an education system that was designed for a different economic era. The country must decide whether STEM is simply a collection of subjects, or whether it is part of the national production architecture through which Botswana develops the people capable of building, operating, improving and renewing its economy.
The Country Must Start With an Uncomfortable Truth
Botswana cannot wait for an advanced economy to appear before deciding to produce the people required to operate one.
It cannot wake up in 2040 and discover that it needs mathematicians. It cannot wait until manufacturing expands before deciding that it needs production managers, engineers, technicians, quality specialists and people capable of designing and operating increasingly complex systems.
That sequence is backwards.
Capability must sometimes come before the job because capability itself can become one of the conditions required for the job, enterprise and investment to emerge. This is the structural argument developed in STRLDi’s What Are We Creating?: Botswana must work backwards from the productive economy it intends to create, through the occupations required, to the capabilities required, and finally to the education system that must produce them. (National Strategy Firm)
↗️THE STRUCTURAL TRAP BOTSWANA MUST BREAK
The Job Cannot Always Come First
Few productive enterprises create few productive jobs.
Few productive jobs discourage young people from entering particular fields. Fewer people enter those fields, investors struggle to find the capability required, investment remains constrained, and the shortage of productive enterprises continues.
Then the country looks at the absence of jobs and asks:
Why train people for jobs that do not yet exist?
But the investor can equally ask:
Why build here when the people required to operate the system do not yet exist?
That is the reinforcing structure Botswana must deliberately break.
The Nation Must Build Capability Before the Shortage Becomes Permanent
The education system must therefore stop looking only backwards at what the economy currently demands.
Its responsibility is to see the economy that Botswana intends to create and begin producing the human capability required to operate it. Mathematics, science, engineering, technology and technical capability must become part of a twenty-year national production programme, not a series of disconnected education projects.
Botswana’s current institutional system already contains important functions across curriculum development, STEM education, educational research, inspectorate services, teacher administration, educational technology and planning. The problem is not necessarily that these functions do not exist; the problem is whether they are being deliberately integrated around one measurable national capability outcome. (Government of Botswana)
↗️THE OVERARCHING NATIONAL ARCHITECTURE TO STEER STEM DEVELOPMENT
Botswana cannot expect STEM development to steer itself simply because different institutions are responsible for education, skills, qualifications, research, science and technology. The future STEM requirement of the country crosses institutional boundaries, beginning with the productive economy and moving through human capability, tertiary education, technical training, schools, teachers and the population already outside the formal education system.
The country therefore requires an overarching national architecture capable of continuously connecting these movements. Its purpose is not to create another layer of bureaucracy. Its purpose is to ensure that Botswana continues to know what STEM capability it requires, in what numbers, for which productive purposes and how that capability must be developed as the ground continues to move.
This architecture should be deliberately small at its centre, but capable of reaching across the national system. The initial proxy proposed here is a core national steering capability of approximately 75–100 people, organised around one National Steering Group and three connected Councils.
THE CORE NATIONAL STEERING CAPABILITY
National Steering Function
Indicative Number
National Steering Group
30–40
Productive Economy Council
15–20
Human Capability and STEM Council
15–20
Adult Capability and Transition Council
15–20
TOTAL CORE STEERING CAPABILITY
75–100
These should not be understood as four separate committees operating independently from one another. Together, they provide the national capability required to see the economy Botswana is building, the people required to carry it, the STEM capability required to support it and the existing population that must transition with the country.
The numbers are deliberately modest. The purpose is not to place hundreds of people at the centre of government. The purpose is to ensure that sufficient capability exists to see the relationships that no single Ministry or institution can be expected to hold alone.
1. THE NATIONAL STEERING GROUP — 30–40 PEOPLE
The National Steering Group provides the overarching direction required to keep STEM development connected to Botswana’s wider national requirements. Its responsibility is to see the relationships between the changing productive economy, human capability, STEM development and the institutions responsible for carrying them.
Its work is to ensure that Botswana does not calculate its future capability requirements once and then leave them inside a report. As the world changes, the country must continue to ask what is changing, what new capability is required, what capability is becoming insufficient and whether the national system is moving quickly enough.
The Group must therefore be capable of seeing the movement, connecting the requirements and keeping the national direction visible. It does not replace Ministers or existing institutions. It ensures that the future requirement does not disappear between them.
2. THE PRODUCTIVE ECONOMY COUNCIL — 15–20 PEOPLE
STEM cannot be steered without understanding the productive economy it is expected to support. The first Council therefore ensures that the changing productive requirements of Botswana remain visible to the national capability system.
Its central question is:
What must Botswana become capable of building, producing, operating and improving?
The answer affects the science, mathematics, engineering, technology and technical capability the country must develop. If Botswana intends to build increasingly complex productive sectors, it must know what capabilities those sectors require before expecting the education system to produce them.
This Council therefore connects STEM development to the productive future. It helps ensure that Botswana does not develop capability merely because it is fashionable, while failing to develop the capabilities required by the economy the country itself intends to build.
3. THE HUMAN CAPABILITY AND STEM COUNCIL — 15–20 PEOPLE
The Human Capability and STEM Council focuses directly on the national question of what Batswana must become capable of doing. Its responsibility is to translate changing national requirements into the human capability that Botswana must deliberately develop.
Its central question is:
What mathematical, scientific, engineering, technological and technical capability will Botswana require—and how will the country build it at the scale required?
This requires the Council to look across the entire capability pathway. It must understand the relationship between tertiary institutions, technical education, schools, curriculum, mathematics, science, teachers, research and the wider systems responsible for developing capability.
Its responsibility is therefore larger than advocating for more STEM subjects. It must help Botswana continuously understand the depth, direction and scale of STEM capability required as the productive economy grows and changes.
4. THE ADULT CAPABILITY AND TRANSITION COUNCIL — 15–20 PEOPLE
Botswana cannot prepare for the future by concentrating only on children and young people currently moving through the education system. The country must also understand what happens to the population already here.
The Adult Capability and Transition Council therefore focuses on the existing workforce, unemployed population, experienced professionals and adults whose skills and capabilities may require upgrading as the productive economy changes.
Its central question is:
How does Botswana carry the people it already has into the productive economy ahead?
This includes recognising existing capability, identifying skills that can be built upon and determining where adults require new scientific, technical and productive capability. Without this deliberate transition pathway, Botswana could redesign its future education system while leaving a significant part of its existing population outside the economy it is trying to build.
THE PUBLIC SYSTEM MUST ALSO DEVELOP THE CAPABILITY TO STEER
The development of a STEM-intensive productive economy has another implication that Botswana must now confront. The public institutions responsible for planning, recognising, assessing, regulating and supporting the national pipelines must themselves increasingly possess sufficient STEM and technical familiarity.
A country cannot consistently recognise capabilities it does not understand. It cannot confidently assess increasingly complex technical proposals, recognise emerging skills or regulate new productive activities if the institutions carrying those responsibilities remain technically distant from the capabilities appearing before them.
The more familiar public institutions become with the scientific, engineering, technological and technical capabilities required by Botswana’s productive pipelines, the better able they will be to recognise them, support them and help the national system move faster.
This does not mean that every public officer must become an engineer or scientist. It means that Botswana must deliberately build sufficient STEM and technical depth within the public system to ensure that the people responsible for steering, planning and recognising capability can understand what they are looking at.
BOTSWANA ALREADY HAS INSTITUTIONS — BUT THEY MUST NOW BE EXAMINED AGAINST THE FUTURE REQUIREMENT
Botswana does not begin from an institutional vacuum. The country already has Ministries, authorities, councils, universities, technical institutions, research bodies and public organisations responsible for different parts of education, skills, qualifications, science, technology and economic development.
But the existence of an institution and the existence of a mandate should not automatically be confused with readiness for the future requirement now emerging.
An institution may be carrying out its current mandate effectively while still lacking the shared national picture, STEM depth or future capability required to carry the next stage of Botswana’s development. The national task is therefore not simply to tell institutions to work together. It is first to establish what they must together become capable of seeing and carrying.
The detailed institutional mapping accompanying this article therefore proposes that Botswana examine its existing institutions against the national STEM and capability requirement—not to assume failure, but also not to assume readiness where readiness has not yet been tested.
STEERING STEM IS A CONTINUOUS NATIONAL RESPONSIBILITY
The proposed architecture is necessary because STEM development cannot be treated as a once-off reform. The productive economy will continue to change. Technology will continue to change. Scientific capability will continue to deepen. The skills required today will not necessarily be sufficient tomorrow.
Botswana therefore requires the ability to continuously observe these movements and adjust its national capability development accordingly. The purpose of the architecture is to give the country the capacity to continue asking the right questions before capability shortages become national crises.
The wider National STEM Capability Architecture can then carry the work of developing capability through education, teacher development, curriculum, assessment, research and delivery. The Steering Architecture ensures that the country continues to understand why that capability is required, where it is required and how the requirement is changing.
THE QUESTION BEFORE NATIONAL LEADERSHIP
The question before Botswana is therefore no longer simply whether more learners should study STEM.
The question is whether the country is prepared to establish the national capability required to continuously determine what STEM Batswana will need to know, build, operate and create as the productive economy moves forward.
The initial numbers are clear:
30–40 people
to provide overarching national steering.
15–20 people
to keep the productive economy connected to capability.
15–20 people
to steer human capability and STEM development.
15–20 people
to ensure that the existing population transitions with the country.
Approximately 75–100 people to provide the core national capability required to continuously steer the STEM requirement.
The detailed composition, existing institutional landscape and capability requirements are set out in the accompanying Appendix.
↗️THE NATIONAL STEM CAPABILITY ARCHITECTURE
A Country Cannot Transform STEM Through One Ministry Alone
The proposed architecture should therefore sit above the normal cycle of ministerial programmes.
STEM capability development should become a national strategic function, with Presidential and Cabinet-level protection, because the capability being produced will determine the country’s future productive capacity. Education remains central, but it cannot carry the architecture alone because the outcome belongs equally to industry, agriculture, energy, technology, research, labour and national economic development.
The architecture should contain four connected engines.
National Engine
Primary Responsibility
National Outcome
1. National STEM Architecture & Administration
National standards, capability requirements, long-term planning
One coherent national architecture
2. Curriculum, Assessment & Knowledge Engine
Curriculum design, mathematics and science standards, assessment
Students develop real capability, not examination memory
3. Teacher Capability & Professional Excellence Engine
Teacher recruitment, development, specialist career pathways
World-class STEM teaching capability
4. Delivery, Research & Economic Connection Engine
Laboratories, workshops, tertiary institutions, industry and research
STEM capability connects to productive activity
These four engines must not operate as four new bureaucracies.
They are four national functions within one architecture. Their purpose is to ensure that administration does not design without knowledge, curriculum does not operate without capable teachers, teachers are not trained without the infrastructure required to teach, and students are not developed without a clear connection to the productive economy they are expected to enter.
The Presidency Must Protect the Outcome
A National STEM Capability Council should be established with a twenty-year mandate.
Its responsibility should not be to manage schools day by day. Its responsibility should be to protect the national outcome, review the capability pipeline annually, ensure continuity across political terms and intervene when the system begins drifting away from its purpose.
This is where national security enters the discussion.
A country that cannot produce sufficient mathematical, scientific and technical capability eventually becomes dependent on others to design, operate, repair and develop increasingly important parts of its productive system. That dependence may not appear dangerous when the economy is simple; it becomes increasingly serious as technology, energy, production, infrastructure and national systems become more complex.
↗️WHEN THE CAPABILITY BEGINS TO SHOW
The twenty years represents the period required to embed, multiply and mature the capability architecture across generations. It is the time horizon for Botswana to move from dependency and fragmentation towards a self-renewing national STEM capability system.
Years 1–2: Botswana Begins Using Capability It Already Has
The first capability appears immediately, because Botswana is not starting with nothing.
The National STEM Capability Corps would identify and mobilise Batswana who have already demonstrated exceptional capability in mathematics, science, engineering, technology, research, teaching and industry. The country begins benefiting from existing capability in Year 1, particularly in administration, curriculum design, assessment, teacher training and national STEM architecture.
Foreign specialists would also begin filling critical gaps during this period.
So the first question is not:
“When will Botswana become capable?”
The first question is:
“How quickly can Botswana organise the capability it already possesses?”
Years 3–5: The First Structural Shift Becomes Visible
By Years 3 to 5, Botswana should begin seeing the first visible change inside the education architecture.
Specialist teachers would be teaching, teacher trainers would be developing other teachers, curriculum changes would be moving through schools, and a new assessment system would begin measuring deeper mathematical, scientific and technical capability.
This is also when the first economic effects should begin to emerge.
Better teaching produces stronger learners. Stronger learners enter tertiary, technical and professional pathways differently. Existing industries begin gaining better access to developing capability, while Botswana becomes increasingly capable of identifying where its next productive gaps will emerge.
By Year 5, Botswana should expect to see:
Capability Area
What Should Begin Showing
National leadership
Clear STEM capability architecture
Teachers
First specialist teacher corps established
Curriculum
Stronger mathematics and science progression
Assessment
Shift towards reasoning and application
Students
Improved capability beginning to emerge
Tertiary education
Stronger connection to national capability requirements
Industry
Better identification of future skills gaps
Diaspora
Proven Batswana capability integrated into the system
The country should not wait five years to see everything. It should see the system beginning to move within the first two years and visible structural change by Year 5.
Years 6–10: Capability Begins Multiplying
This is where the architecture becomes more powerful.
The people recruited during the first five years are no longer working alone. Teachers they trained are now teaching others. Teacher trainers are producing more teacher trainers. Curriculum specialists are improving the curriculum based on evidence.
This is when Botswana begins moving from importing and organising capability to multiplying capability.
The first cohorts who entered a strengthened system earlier in their education will begin moving into tertiary institutions, technical education, apprenticeships, research and employment. At the same time, the productive economy should increasingly be connected to the capability pipeline rather than simply complaining about skills shortages after they emerge.
By Year 10, Botswana Should See a National Difference
By this point, the change should no longer be confined to individual schools or programmes.
Botswana should have a recognisable STEM architecture, a specialist teaching profession, stronger teacher development capability, improved assessment, clearer connections between productive sectors and education, and a growing domestic base of people capable of leading the system.
This is where the nation should begin seeing capability become an economic variable rather than simply an education outcome.
That distinction is critical to your argument.
Years 11–15: The Economy Begins Receiving the New Generation
This is where the deeper national effect begins.
Children who entered the strengthened system earlier are now moving into universities, technical institutions, enterprises, research environments and productive sectors. The country should begin receiving a generation with stronger foundations in mathematics, scientific reasoning, technology and technical problem-solving.
But there is an important warning here.
Education capability alone will not transform the economy.
If Botswana produces stronger STEM capability without simultaneously expanding productive sectors, enterprises, research, technology, manufacturing and other economic opportunities, the country may simply become better at producing people for other countries.
This is why your argument is stronger than a STEM education reform proposal.
The STEM architecture must move together with the productive sector architecture.
Years 16–20: The Capability Becomes Self-Renewing
The final period is not when capability suddenly starts.
It is when Botswana should increasingly have the ability to renew the capability without depending structurally on the original intervention. The country should be producing its own curriculum leaders, specialist teachers, teacher trainers, assessment experts, researchers, engineers and technical professionals at sufficient scale.
Foreign experts should increasingly become collaborators rather than permanent substitutes.
The diaspora capability programme should increasingly become a two-way international knowledge network rather than a rescue mechanism.
That is what the twenty years is really buying Botswana: the ability to continue building capability after the original national push has matured.
THE REAL CAPABILITY TIMELINE
Period
What Happens
Capability Stage
Year 1
Identify and mobilise existing Batswana capability
Capability organised
Years 1–2
Specialists and foreign experts begin rebuilding architecture
Capability activated
Years 3–5
Teachers, curriculum and assessment begin changing
Capability becomes visible
Years 6–10
Teachers and institutions begin multiplying capability
Capability expands
Years 11–15
Stronger cohorts enter tertiary and productive systems
Capability enters the economy
Years 16–20
Domestic system increasingly renews itself
Capability becomes self-sustaining
THE MOST IMPORTANT POINT FOR THE PRESIDENCIES
I would therefore change the language in the report.
We must not allow a President or Minister to hear “twenty years” and conclude that Botswana is being asked to wait twenty years for results.
I would say:
Botswana will begin seeing capability immediately because the country already possesses people with exceptional capability. Within five years, the national architecture should begin visibly changing teaching, curriculum and assessment. Within ten years, Botswana should see capability multiplying across the system. Within fifteen years, a new generation should increasingly be entering the productive economy. Twenty years is the period required not to begin capability, but to embed it deeply enough that the nation can renew its own capability for generations to come.
USE THE PEOPLE BOTSWANA HAS ALREADY PRODUCED
The Country Should Stop Looking Only at Young Graduates
Botswana has spent sixty years producing people.
Some are inside the country. Some are overseas. Some have worked in universities, laboratories, engineering firms, technology companies, manufacturing organisations, financial institutions, research centres and international institutions.
Others have demonstrated exceptional STEM capability over decades but are approaching the point at which the formal system begins to think about retirement.
This may be one of the greatest untapped national assets Botswana possesses.
The country should establish a National STEM Capability Corps focused initially on Batswana approximately between the ages of 45 and 55, while remaining open to exceptional individuals outside that range. This is not a retirement programme; it is a national knowledge mobilisation programme designed to bring proven capability into the architecture at the point where the country needs it most.
Not Everyone Must Return to the Classroom
This is important.
A scientist who has spent twenty years conducting research should not automatically be told to become a secondary school teacher. An engineer who has led complex production systems should not automatically be placed into a conventional teaching post.
The country should use people according to the capability they have demonstrated.
Capability Demonstrated
Possible National Role
International STEM leadership
National architecture and strategy
Exceptional teaching ability
Specialist STEM teacher
Research experience
Research and curriculum development
Engineering or industrial leadership
Technical curriculum and practical learning
Assessment expertise
National assessment architecture
University leadership
Teacher education and specialist development
Industry experience
Apprenticeship and productive learning systems
Technology leadership
Digital and AI capability architecture
The country should create a national database identifying Batswana with demonstrated STEM capability, including those living abroad, those working internationally and those whose past performance already shows exceptional ability.
Botswana should not begin by asking who is available. It should begin by asking who has demonstrated the capability required.
PAY FOR THE CAPABILITY YOU NEED
A Specialist Teacher Should Not Be Paid as Though the Capability Is Ordinary
This is one of the hardest changes Botswana may need to make.
If the country requires exceptional mathematicians, scientists, engineers and technical specialists to become teachers, curriculum architects and teacher trainers, it cannot always expect them to accept compensation that ignores their market value outside the classroom.
The country must stop confusing the importance of a role with the salary grade attached to the institution employing it.
A person who can earn substantially more designing systems, conducting research or working in industry may still choose to teach if Botswana creates a national professional pathway that recognises both the importance and the scarcity of the capability being contributed.
Create a National Specialist STEM Profession
The proposed system should therefore establish a specialist pathway outside the normal assumption that every teacher must progress through the same administrative hierarchy.
A National STEM Fellow, for example, may be a mathematician, scientist, engineer or technical specialist whose primary contribution is teaching, mentoring teachers, designing curriculum or strengthening assessment. The person should be paid according to the strategic value and scarcity of the capability—not merely according to the title attached to the post.
This does not mean ordinary teachers should become unimportant.
It means Botswana must recognise that some capabilities are genuinely scarce and that the country cannot build a world-class STEM system while pretending scarcity does not exist.
Where Botswana Cannot Supply the Capability, Import It
The country should not be embarrassed by this.
Every developing and industrialising nation has learned from capability developed elsewhere. The question is whether foreign expertise is brought in temporarily to fill gaps forever, or whether it is deliberately connected to a national knowledge-transfer architecture that allows domestic capability to replace it over time.
The proposal is therefore for twenty-year specialist contracts, where necessary, for foreign experts in curriculum design, mathematics education, science education, teacher training, technical education and assessment.
Their mandate must be clear:
Build the system. Train the people. Transfer the knowledge. Produce the next generation of Botswana capability.
Political cycles should not be permitted to casually dismantle the architecture, and professional disputes should not be allowed to destroy the long-term national outcome. That does not mean removing legitimate professional rights; it means protecting the national transformation programme from short-term institutional instability.
↗️WHAT THE TWENTY-YEAR STEM SHIFT WOULD ACTUALLY BUILD
Years 1–5: Build the Architecture
The first five years are not primarily about producing more graduates.
They are about constructing the national machinery required to produce capability consistently for the next generation. Botswana must identify its STEM talent, recruit the first national capability corps, establish specialist teacher pathways, redesign curriculum progression, rebuild teacher training and establish an independent assessment architecture.
The first phase must also establish a National Capability Observatory linking education, employment, occupations, enterprise and economic intelligence.
Years 1–5
Primary Work
National STEM capability census
Identify existing and diaspora capability
STEM Capability Corps
Recruit proven Batswana specialists
Foreign specialist programme
Fill critical capability gaps
Curriculum architecture
Mathematics, sciences, engineering and technology progression
Teacher transformation
Specialist training and market-rate pathways
Assessment reform
Test understanding, reasoning and application
Capability Observatory
Track people from learning to productive participation
Infrastructure audit
Laboratories, workshops, digital and practical facilities
Years 6–10: Build the Production Capacity
By the second phase, the architecture must begin producing at scale.
Teacher capability should be multiplying through teacher trainers. Schools should increasingly have access to practical science, technical and digital learning environments, while tertiary and TVET systems begin working directly backwards from the occupational capability required by productive sectors.
This is where the system begins moving from reform to production.
The measure of success should no longer be simply how many students passed an examination. Botswana should begin asking how many students developed mathematical reasoning, scientific understanding, technical competence, problem-solving ability and the capacity to continue learning in increasingly complex environments.
Years 11–20: Deepen and Replace Dependency
The final ten years should see Botswana increasingly replacing imported capability with Batswana developed through the architecture.
The country should have sufficient domestic capability to lead curriculum development, teacher education, assessment, research and specialist STEM instruction. Foreign experts should increasingly become collaborators rather than structural substitutes.
The final outcome is not a STEM project.
It is a country that has developed the institutional capacity to continue producing the capability required by its own future.
↗️WHAT WOULD THIS COST BOTSWANA?
The First Principle: Do Not Confuse the Transformation Cost With the Entire Education Budget
Botswana already spends heavily on education and related public services.
For 2026/2027, the Ministry of Child Welfare and Basic Education budget presented to Parliament was approximately P12.913 billion, comprising about P11.833 billion recurrent expenditure and P1.080 billion development expenditure. The proposed national recurrent budget for the same financial year was P67.78 billion, illustrating that the proposed STEM transformation must be understood as an additional strategic investment layered onto existing national expenditure, not as a replacement for the entire education budget. (Parliament of Botswana)
The question therefore becomes:
What additional investment would Botswana need to make if it deliberately decided to build the capability architecture described above?
Working Twenty-Year National STEM Transformation Model
Investment Area
Average Annual Investment
20-Year Investment
National STEM Capability Corps
P350 million
P7.0 billion
Specialist market-rate teachers
P600 million
P12.0 billion
Foreign expert capability gaps
P250 million
P5.0 billion
Curriculum, assessment & teacher training
P300 million
P6.0 billion
Laboratories, workshops & productive learning
P600 million
P12.0 billion
TVET, tertiary & specialist pipeline
P450 million
P9.0 billion
Adult conversion & retraining
P200 million
P4.0 billion
Research, Observatory & national systems
P150 million
P3.0 billion
Indicative Total
P2.9 billion
P58.0 billion
This is an indicative transformation model, not yet a Treasury costed programme.
The exact figure would change after Botswana completes a national capability census, school infrastructure audit, teacher skills audit, diaspora mapping and occupational forecast. But the purpose of the model is to answer the question that leadership must first understand: is the scale of investment beyond Botswana, or is it a strategic national choice?
The Answer Is That the Shift Is Large—But Not Alarming
Using the World Bank’s 2025 population estimate of approximately 2.562 million people, an average annual investment of P2.9 billion represents approximately P1,132 per person per year. (World Bank Open Data)
That is approximately:
Measure
Indicative Cost
Annual national investment
P2.9 billion
Population base
2.562 million
Annual cost per person
P1,132
Monthly cost per person
P94
Twenty-year cumulative investment
P58 billion
Twenty-year cumulative cost per person*
Approx. P22,600
*Using today’s population only for illustration. Actual population will change over twenty years.
P94 per person per month.
That is the scale of the question Botswana is being asked to consider when spread across the entire nation.
THE SHIFT DOES NOT NEED TO ALARM BOTSWANA
THE ALARM SHOULD BE WHAT HAPPENS IF BOTSWANA DOES NOT MAKE IT
P2.9 billion per year sounds large when placed alone on a page.
But nations do not build their futures by asking whether a number looks large before asking what the number is expected to produce. The proper comparison is not between P2.9 billion and zero. The proper comparison is between P2.9 billion invested deliberately and the cost of continuing to spend for twenty years without building the capability required.
Botswana will spend the next twenty years regardless.
The country will spend on education. It will spend on unemployment programmes, allowances, social protection, public administration, infrastructure, imported expertise and repeated interventions designed to respond to problems after they have appeared.
The question is what those twenty years will produce.
The Nation Has Two Twenty-Year Futures
Botswana can spend twenty years managing the consequences of insufficient capability.
It can spend twenty years responding to unemployment after it appears. It can spend twenty years training people for opportunities that do not yet exist, importing capability it could have begun building itself and watching talented people leave because the economic system does not yet have sufficient room for them.
Or—
it can spend those same twenty years constructing the capability that will allow the next generation to enter a different economy.
That is not an education expenditure decision.
That is a national economic transformation decision.
THE COUNTRY HAS TO BUILD THE CAPABILITY BEFORE THE SHORTAGE BECOMES PERMANENT
Botswana’s population was estimated by the World Bank at approximately 2.562 million in 2025, while the country’s unemployment rate was reported at 24.5% using the ILO modelled estimate. The STRLDi national employment work argues that the country must look beyond unemployment as a percentage and understand whether the productive economy is expanding sufficiently to sustain the population entering it. (World Bank Open Data)
A country can reduce visible pressure temporarily without removing the structural constraint.
That is why the STEM question cannot be answered only by counting graduates. The country must ask whether it is producing the people required to expand productive capability across agriculture, manufacturing, technology, energy, logistics, infrastructure, research and the wider economy.
The needle Botswana must move is therefore not simply:
More STEM graduates.
The needle is:
Higher national economic performance capability.
↗️THE DECISION BEFORE THE PRESIDENCY
BOTSWANA DOES NOT HAVE TO BE FRIGHTENED BY THE SIZE OF THE SHIFT
A twenty-year national capability programme may sound long.
But nations are built through long work. Children take time to grow, teachers take time to develop, institutions take time to learn, enterprises take time to strengthen and productive sectors take time to emerge.
There is nothing alarming about planning for that reality.
What should concern Botswana is the alternative.
The country will still arrive twenty years from now. The children entering school today will still become adults. The global economy will still become more technologically complex, and other countries will still be building the mathematical, scientific, technical and productive capabilities required to participate in it.
The question is what Botswana will have built by the time it arrives.
CAN BATSWANA GET THEIR STEM RIGHT?
Yes.
But the country must stop treating the question as though it belongs only to teachers, education officials or universities. It belongs to the Presidency because the outcome affects the future capability of the State; it belongs to Ministers because the people required by their sectors must be deliberately produced; and it belongs to the nation because future generations will inherit the economic system built from today’s decisions.
Botswana must find its people.
Find the Batswana who have demonstrated exceptional mathematical, scientific, engineering, technological and technical capability.
Bring them into the national architecture.
Place the best of them where their capability creates the greatest multiplier effect: administration, curriculum design, teacher education, assessment, research, technical education and, where exceptional teaching ability exists, directly into the classroom.
Pay specialist teachers according to the market value and strategic importance of their capability.
Where Botswana cannot yet supply the expertise, bring in the best foreign specialists and give them a long enough mandate to build something real.
Not for two years.
Not for the duration of one project.
For as long as the country requires to build the domestic capability that will eventually replace them.
THE FINAL QUESTION
The shift proposed here does not need to alarm Botswana.
At an indicative average of approximately P1,132 per person per year, or about P94 per person per month, the national investment required to begin deliberately rebuilding STEM capability is substantial—but it is not beyond the scale of a country already spending tens of billions of pula annually on public services and development. Botswana’s education system alone has a 2026/2027 proposed ministry budget of approximately P12.9 billion, demonstrating that the issue is not whether the country already invests significant resources, but whether a sufficiently deliberate share is organised around the production of the future capability the economy will require. (Parliament of Botswana)
The alarm should come when Botswana decides not to make the shift.
Because the price will not be paid immediately by those making the decision today.
It will be paid by the children who discover too late that their country did not build the teachers capable of teaching them. It will be paid by the young engineer who enters an economy too small to use what she can do, by the enterprise that cannot find the capability required to expand, and by the nation that continues asking why investment does not come while refusing to build one of the conditions that investment increasingly requires.
The future does not ask Botswana whether it feels ready.
It is already coming.
The question before the Presidencies, Ministers and national leadership is therefore not whether Botswana can afford to become smarter.
The question is whether Botswana can afford not to.
THE SPINE OF THE REPORT
Section 1 — The Mirror: What Is Botswana Creating?
Section 2 — President Khama’s Question: Can Batswana Get STEM Right?
Section 3 — The Structural Trap: Why Botswana Must Break the Cycle
Section 4 — Count the Future: What Does the Economy Actually Require?
Section 5 — The National STEM Capability Architecture: Building the Pipeline to Produce It
Section 6 — Use the People Botswana Has Already Produced: Experience, Expertise and National Capability
Section 7 — Pay for the Capability the Nation Needs: Teachers, Specialists and the STEM Workforce
Section 8 — The Twenty-Year Transformation Architecture: When Will Capability Begin to Show?
Section 9 — What Would It Cost Botswana—and Why the Shift Should Not Alarm the Nation?
Section 10 — The Decision Before the Presidencies: The Price of Building the Future—or Discovering It Too Late
APPENDIX
THE NATIONAL ARCHITECTURE FOR STEERING STEM DEVELOPMENT
APPENDIX A — PURPOSE OF THE ARCHITECTURE
The proposed architecture responds to a simple national requirement. STEM development cannot be effectively steered by looking only inside the education system.
The capabilities Botswana must develop are influenced by:
the productive economy;
changing technology;
scientific development;
workforce requirements;
population change;
education;
technical training;
research;
and the capability of the existing adult population.
These relationships require continuous national attention. The architecture therefore provides a mechanism through which Botswana can repeatedly connect the changing productive requirement to the STEM and human capability required to carry it.
The proposed numbers are proxies for discussion and verification, not final staffing instructions. Their purpose is to make visible the scale of national capability that may be required and invite Botswana to test, refine and establish the appropriate structure.
APPENDIX B — THE CORE NATIONAL STEERING CAPABILITY
Component
Indicative Number
Primary Responsibility
National Steering Group
30–40
Connect and steer the whole national requirement
Productive Economy Council
15–20
Keep productive requirements visible
Human Capability & STEM Council
15–20
Connect requirements to STEM and human capability
Adult Capability & Transition Council
15–20
Transition existing population capability
TOTAL
75–100
Continuous national steering of STEM requirements
The architecture should be understood as one connected national capability, rather than four independent organisations.
APPENDIX C — THE NATIONAL STEERING GROUP
Indicative Size: 30–40 People
The National Steering Group requires sufficient diversity of capability to see the relationships across the national system. Membership should therefore be determined by the capability required to carry the work rather than institutional seniority or representation alone.
The Group should collectively be capable of understanding:
productive economic development;
national demand and future requirements;
science and technology;
mathematics and STEM;
engineering and technical capability;
human capability development;
education;
research;
workforce requirements;
demographic change;
national planning;
data and measurement;
and institutional execution.
The exact composition should be determined through a national capability assessment. Botswana should not assume that people currently holding positions automatically possess the combination of knowledge required to steer the whole system.
APPENDIX D — THE PRODUCTIVE ECONOMY COUNCIL
Indicative Size: 15–20 People
The Council provides continuous visibility into the productive capabilities Botswana must build.
Its responsibilities include examining:
changing national demand;
regional and international movement;
productive sectors and sub-sectors;
emerging production requirements;
technology requirements;
scientific and technical requirements;
productive infrastructure;
workforce requirements;
and changing capability gaps.
The Council should not simply respond to whatever economic activity happens to emerge. Its role is to help make the future productive requirement sufficiently visible for Botswana to deliberately prepare the capability required.
APPENDIX E — THE HUMAN CAPABILITY AND STEM COUNCIL
Indicative Size: 15–20 People
The Council connects the productive requirement to the human capability required.
Its responsibilities include examining:
STEM requirements;
mathematics and science foundations;
engineering capability;
technological capability;
technical capability;
tertiary education;
technical and vocational education;
teacher capability;
curriculum;
assessment;
research;
capability reproduction;
and future skills requirements.
The Council should continuously ask:
What capability does Botswana require?
How many people require it?
At what depth is it required?
Where in the capability pathway must it be developed?
Is Botswana producing it quickly enough?
APPENDIX F — THE ADULT CAPABILITY AND TRANSITION COUNCIL
Indicative Size: 15–20 People
The Council ensures that national STEM and capability development does not focus only on future generations.
Its responsibilities include examining:
existing workforce capability;
unemployed population capability;
experienced professionals;
transferable skills;
capability gaps;
skills recognition;
reskilling;
technical upgrading;
transition into productive sectors;
and pathways for adults into emerging occupations.
The Council should help Botswana answer:
What capability does the population already possess?
What can be built upon?
What must be upgraded?
What new capability is required?
How quickly can adults transition into emerging productive pathways?
APPENDIX G — THE EXISTING INSTITUTIONAL LANDSCAPE
Botswana Should Begin With What Already Exists
The proposed architecture does not assume that Botswana must create entirely new institutions. The first task is to map existing institutions against the future STEM requirement and determine where existing mandates, capability and institutional arrangements already align—and where they do not.
The institutions requiring examination include those responsible for:
Economic and National Planning
national economic planning;
finance and public investment;
statistics and national measurement;
national development.
Productive Development
trade;
industry;
agriculture;
manufacturing;
infrastructure;
transport and logistics;
energy;
investment;
research;
standards and productive regulation.
Education and STEM
school education;
curriculum;
mathematics and science;
tertiary education;
technical and vocational education;
teacher development;
science and technology;
research and innovation.
Human Capability and Skills
human resource development;
qualifications;
skills recognition;
workforce development;
technical training;
adult learning;
employment and transition.
INSTITUTIONS MUST BE MAPPED BY NAME
The next national exercise should identify and examine the relevant Botswana institutions individually, including bodies such as:
Human Resource Development Council (HRDC);
Botswana Qualifications Authority (BQA);
Statistics Botswana;
Botswana Institute for Technology Research and Innovation (BITRI);
Universities and tertiary institutions;
Technical and vocational institutions;
relevant Ministries;
public research bodies;
standards and regulatory institutions;
and public institutions connected to productive development.
This list should be completed and verified against the current Botswana institutional landscape. No institution should be automatically assumed to be carrying the future STEM requirement merely because part of its present mandate appears related to STEM, skills or qualifications.
For example, a qualifications institution may have an essential role in recognising and assuring capability without necessarily being responsible for determining the national STEM requirement. A human resource development institution may have an important skills function without necessarily possessing the full productive economy and STEM architecture required to steer the national system.
Mandates must therefore be mapped against the future requirement—not simply accepted as evidence of capability.
APPENDIX H — THE INSTITUTIONAL MAPPING FRAMEWORK
Every relevant institution should be examined against the following questions:
Assessment
National Question
Current Function
What does the institution currently do?
Future Position
Where does it sit in the future STEM and capability requirement?
Required Capability
What must it become capable of doing?
Current Strength
What capability does it already possess?
Capability Gap
What does it not yet possess or understand?
STEM Familiarity
Does it have sufficient technical depth to recognise required capability?
Pipeline Connection
Does it understand what comes before and after its function?
Readiness
Can it carry the future requirement at the required speed?
This exercise should be based on evidence rather than assumption.
APPENDIX I — PUBLIC-SECTOR STEM AND TECHNICAL CAPABILITY
Botswana’s STEM requirement is not confined to learners, teachers, universities and laboratories. As the productive economy becomes more scientifically and technically complex, the public system responsible for steering and supporting it must also become more capable.
This includes sufficient STEM and technical familiarity among those responsible for:
national planning;
economic development;
technical assessment;
infrastructure;
productive regulation;
standards;
qualifications;
skills recognition;
public investment;
research;
and technology-related decision-making.
The requirement should be understood in practical terms. The public system must increasingly know what it is looking at.
A person does not need to become a scientist to understand how to ask better scientific questions. A planner does not need to become an engineer to understand what engineering capability a national project requires. But a nation attempting to build a more complex productive economy cannot afford a public system that remains unfamiliar with the capabilities it is expected to recognise and support.
APPENDIX J — THE RELATIONSHIP BETWEEN THE TWO ARCHITECTURES
The article now contains two connected but distinct requirements.
THE OVERARCHING NATIONAL STEERING ARCHITECTURE
Its role is to continuously connect:
Productive Economy
↓
Human Capability
↓
STEM Requirement
↓
Existing Population
↓
Future National Requirement
THE NATIONAL STEM CAPABILITY ARCHITECTURE
Its role is to develop and reproduce STEM capability through:
national STEM administration;
curriculum and knowledge;
teacher capability;
mathematics and science;
assessment;
delivery;
research;
tertiary education;
technical capability;
and connection to the productive economy.
The relationship is therefore:
The National Steering Architecture keeps the future STEM requirement visible.
The National STEM Capability Architecture develops the capability required.
This distinction allows Botswana to steer STEM development continuously without expecting the education system alone to determine the economic and productive requirements of the country.
APPENDIX K — WHAT SHOULD HAPPEN NEXT
The article does not propose that Botswana immediately establish structures without examination.
The next step should be to:
1. VERIFY THE NATIONAL CAPABILITY REQUIREMENT
Test the productive, human and STEM numbers against national data.
2. MAP THE EXISTING INSTITUTIONAL LANDSCAPE
Identify by name where existing institutions already align.
3. ASSESS ACTUAL CAPABILITY
Determine what institutions and personnel can currently carry.
4. IDENTIFY THE GAPS
Establish what capability Botswana lacks.
5. DETERMINE THE NATIONAL STEERING REQUIREMENT
Confirm the appropriate composition and size of the 75–100-person core architecture.
6. BUILD CAPABILITY
Strengthen Botswana’s own people and institutions while drawing on expertise from those who have successfully travelled ahead.
7. DEVELOP SUCCESSORS
The purpose must be capability transfer and long-term national independence.
Yes, Ms Sheila Damodaran. This should sit clearly in the Appendix, because it explains a principle that national leadership must understand: Botswana cannot afford the pride of learning alone when the lives of future generations depend on how quickly the country learns.
I would write it as follows.
APPENDIX L: INTERNATIONAL CAPABILITY TRANSFER — LEARNING FAST ENOUGH FOR THE CHILDREN OF BOTSWANA
BOTSWANA MUST NOT LEAVE ITS CHILDREN TO DISCOVER THE WORLD ALONE
There is a child in Botswana today who will enter adulthood twenty years from now. That child does not yet know whether Botswana will have built an economy capable of carrying his or her ambitions, skills and hopes. The child does not know whether there will be a laboratory to work in, a factory to design, a farm to modernise, a technology to develop, a business to build or an institution capable of recognising what he or she can do.
What that child knows, twenty years from now, may depend on what Botswana decides to learn today. If the country waits to discover everything for itself, debates every step until the world has moved again and refuses to learn from those who have already travelled ahead, the child will eventually carry the cost of time that was lost before he or she was old enough to speak.
That is the responsibility before national leadership. The future cannot be left to children who have not yet entered the workforce to solve for themselves. The adults of today must build the bridges before the children of tomorrow reach the river.
THE WORLD HAS ALREADY TRAVELLED PART OF THE JOURNEY
Botswana is not the first country to confront the challenge of building a productive economy, developing technical capability or preparing its population for a rapidly changing world. Other nations have spent decades—and in some cases generations—learning how to develop science, engineering, manufacturing, technology, technical education and increasingly capable public institutions.
Botswana should not copy these countries blindly. Their histories, populations, resources and circumstances are different. But neither should Botswana pretend that there is nothing to learn from those who have already travelled through terrain the country is now approaching.
The sensible question is not:
Can Botswana do everything alone?
The more responsible question is:
What can Botswana learn from those ahead, so that its children do not have to spend another generation learning what the world already knows?
LEARN FROM THE WORLD — BUT BUILD BOTSWANA’S OWN CAPABILITY
The purpose of bringing international expertise into Botswana must be made clear from the beginning. Foreign specialists are not brought in to think permanently for Batswana, work permanently for Batswana or become permanent substitutes for Botswana’s own people.
They are brought in because knowledge exists in the world that Botswana may not yet possess in sufficient depth. There are people who have participated in building productive economies, strengthening technical education, developing engineering capability and transforming national systems.
Botswana should learn from them deliberately.
But the relationship must have a clear national direction:
COME AND WORK WITH US.
SHOW US WHAT YOU KNOW.
TEACH US WHAT YOU HAVE LEARNED.
WORK ALONGSIDE OUR PEOPLE.
HELP US BUILD OUR OWN CAPABILITY.
AND THEN WATCH US TAKE IT FURTHER.
That is not dependency. That is how nations learn.
THE COUNTRIES BOTSWANA SHOULD LOOK TOWARDS
Botswana should deliberately seek experience from countries that have demonstrated particular strengths relevant to the capability now required.
Country
Experience Botswana Should Seek to Understand
Singapore
National transformation, economic direction and capability development
South Korea
Industrialisation, STEM, technology and productive capability
Japan
Engineering, industrial systems and technical capability
Germany
Engineering, manufacturing and technical education
Switzerland
Technical and vocational capability development
Finland
Education, teacher capability and learning systems
China
Manufacturing, technological development and productive scale
India
STEM, technology and large-scale human capability
Botswana should not seek to import another country’s system. It should seek people who understand what their countries had to learn, what mistakes were made, what took too long and what capabilities eventually changed the direction of their nations.
The country should look wherever such knowledge exists. The objective is not to collect foreign flags. The objective is to acquire knowledge that helps Botswana build its own future faster and more intelligently.
BOTSWANA SHOULD LOOK FOR BUILDERS — NOT ONLY ADVISERS
There is an important difference between someone who can describe national transformation and someone who has actually participated in building it.
Botswana should therefore look carefully for people who have been close to the work. People who have built productive sectors, developed technical institutions, strengthened science and engineering capability, reformed technical education, developed teacher capability, expanded manufacturing or helped national systems learn to work differently.
This does not exclude academics or consultants. Research and analysis remain important. But Botswana should also seek the experience of practitioners who understand what happens when a national plan reaches the ground.
The child twenty years from now will not benefit simply because Botswana received a beautifully written international report. The child will benefit if Botswana learned how to build something that remained standing after the foreign experts had gone home.
THE INITIAL INTERNATIONAL CAPABILITY REQUIREMENT
Botswana does not require hundreds of foreign consultants scattered across the public system. The requirement should be small, highly selective and connected directly to areas where the country needs to accelerate learning.
The initial proxy proposed for national discussion is:
20–30 INTERNATIONAL SPECIALISTS
working deliberately alongside Botswana’s own national capability.
Capability Area
Indicative International Specialists
National economic and productive transformation
3–4
STEM and scientific capability
3–4
Engineering and manufacturing
3–4
Technical and vocational education
2–3
Mathematics and science education
2–3
Teacher and capability-builder development
2–3
Technology and digital capability
2–3
Adult reskilling and workforce transition
2–3
INITIAL TOTAL
20–30
These are proxies for verification, not final appointments. Their purpose is to make a national principle visible: Botswana may not need an army from outside. But it should not deny itself access to knowledge it genuinely needs simply because that knowledge was first developed somewhere else.
FOREIGN EXPERTISE MUST ENTER WITH AN EXIT PATH
The most important protection against dependency is not refusing help.
It is designing help so that Botswana becomes less dependent over time.
Every international specialist brought into the national capability effort should therefore have a clear responsibility to work alongside and develop Botswana’s own people. Knowledge transfer should not be treated as a pleasant addition to the contract. It should be one of the central measures of success.
The question should always be:
Who is learning alongside this person?
What capability is being transferred?
Who will continue the work when this person leaves?
Has Botswana become stronger because this person came?
If those questions cannot be answered, Botswana has purchased advice. It has not built capability.
THE TWENTY-YEAR TRANSFER PATHWAY
International involvement should reduce as Botswana’s own capability increases.
YEARS 1–5: LEARN AND BUILD
20–30 International Specialists
During the first five years, Botswana should deliberately accelerate learning. International specialists work alongside Batswana to help establish capability, strengthen institutions and transfer practical experience.
The emphasis is not on foreigners doing the work. The emphasis is on Batswana learning while building.
YEARS 5–10: TRANSFER AND LEAD
10–15 International Specialists
By this stage, Botswana’s own people should increasingly lead the work. International expertise becomes more specialised, focusing on mentoring, peer learning, complex technical gaps and areas where the ground has moved again.
The centre of gravity begins moving decisively towards Batswana.
YEARS 10–20: STRENGTHEN AND EXCHANGE
5–10 International Specialists
International relationships remain important because no country stops learning. But by this stage, Botswana should not require outsiders to hold the national direction together.
Batswana should increasingly possess the knowledge, experience and institutional capability to steer their own systems.
International expertise becomes exchange—not rescue.
BY YEAR TWENTY, THE QUESTION SHOULD HAVE CHANGED
Twenty years from now, Botswana should not still be asking:
Who can come and show us what to do?
The question should increasingly become:
What have we learned that we can now contribute to others?
This is the real purpose of capability transfer.
A nation learns.
A nation builds.
A nation leads itself.
And eventually, a nation contributes to the learning of others.
That is how knowledge should move through the world.
THE PRESIDENT’S RESPONSIBILITY MUST BE CLEAR
National leadership must be honest with the country about what is required.
Botswana’s leaders are not here to do the work of every Batswana. No President, Minister, foreign expert or national institution can live another person’s life, acquire another person’s knowledge or build another person’s capability for them.
But leadership has a profound responsibility to ensure that the pathways exist.
The responsibility of national leadership is to help ensure that a child who studies hard does not reach adulthood and discover that there is nowhere to use what he or she has learned. That a young engineer does not have to leave Botswana because there is no productive system capable of absorbing engineering talent. That a scientist does not find that the country has no research pathway. That a skilled technician does not discover that there is no industry requiring technical skill.
Leadership cannot promise every citizen success.
But it can ensure that the country is building somewhere for success to go.
THE CHILD TWENTY YEARS FROM NOW
Twenty years from now, there will be a young Motswana standing somewhere in this country—or perhaps standing at a border, wondering whether the future can only be found somewhere else.
That difference will not be decided on that day.
It will be decided by decisions being made now.
It will be influenced by whether Botswana learned fast enough.
Whether it built the skills it required.
Whether it strengthened its institutions.
Whether it prepared its teachers.
Whether it developed STEM capability.
Whether it built productive sectors capable of carrying skilled people.
Whether it helped adults transition instead of leaving them behind.
And whether it had the humility and wisdom to learn from those who had travelled ahead—not to follow them forever, but to learn how to stand on its own two feet.
The child twenty years from now should be able to look back and say:
They saw the ground moving before we reached it.
They did not leave us to cross the river alone.
They built the bridge while there was still time.
And perhaps that child will never know the names of everyone who argued, planned, counted, challenged and worked to make the future visible.
That does not matter.
What matters is that when the child arrives, there is somewhere to go.
The term farmers’ association is often used as though it describes one organisational model. It does not. Across agricultural systems, farmer organisations perform very different functions — from representing farmers’ interests, to collectively marketing their produce, to providing commercial services, and, in more sophisticated arrangements, coordinating production itself.
This distinction matters for Farmers United (FU). The question is not simply whether FU should become a “better farmers’ association”. The more fundamental question is what economic function FU should perform within Botswana’s emerging national agricultural pipeline, and what a farmer should be paying for when joining it.
I see three distinct models.
1. The Representative Farmers’ Association
The first model exists principally to give farmers a collective voice.
Its members join because the organisation represents their interests before government, regulators, markets and other institutions. It may provide information, networking, training, advocacy, policy dialogue and access to selected services, but it does not necessarily organise the members’ production or take responsibility for getting their produce to market.
This remains an important function. IFAD describes farmer and producer organisations as membership-based organisations that can provide economic services while also enabling farmers to participate in policy dialogue and advocacy. (Nedac)
The value proposition is therefore essentially:
“Your collective voice is stronger than your individual voice.”
The organisation does not need to know exactly how many tonnes each member will produce next season in order to represent the sector.
Its principal assets are membership, legitimacy, information and collective voice.
2. The Producer or Marketing Organisation
The second model moves beyond representation into economic organisation.
Here farmers come together because collective action gives them advantages that they cannot obtain individually. These can include collective purchasing, aggregation, grading, packaging, processing, storage, transportation, marketing, technical assistance and bargaining with buyers.
The European producer-organisation model is a good example. Recognised producer organisations can undertake joint production planning, concentration of supply, marketing, transportation, packaging, storage and other activities designed to improve members’ economic position. (AgGateway)
The World Bank similarly describes producer organisations as jointly owned, member-controlled organisations established for producers’ economic benefit, with functions including bargaining, inputs, technical assistance, processing and marketing. (Rural Development)
The value proposition becomes:
“Together, we can perform commercially important functions more efficiently and with greater bargaining power than we can individually.”
This is much closer to where FU has been trying to go.
It explains the logic behind distribution, storage, aggregation, collective marketing and possibly processing. The farmer pays because collective organisation can reduce transaction costs and improve commercial returns.
But there is a vulnerability in this model: the organisation can begin accumulating infrastructure and operating costs in order to provide services that may not actually need to be provided in-house.
FU’s experience with rented storage is instructive here. If storage becomes an expensive fixed cost, suffers pilferage and does not correspond to a sufficiently predictable flow of produce, the service can destroy rather than create member value.
3. The Production-System Operator
The third model starts somewhere different.
It begins not with:
“What can farmers collectively sell?”
but with:
“What will customers and the wider economy require in the future, and what productive capacity must exist to meet that requirement?”
This is the model STRLDi is beginning to see as the potential destination for FU.
The organisation becomes a linchpin between forecast demand and organised productive capacity.
Its functions would include:
Forecast demand → aggregate demand → translate demand into production requirements → match requirements against proven capacity → allocate production to geographic clusters → monitor fulfilment → identify variance early → coordinate aggregation and logistics → deliver against forecast → learn from actual performance and improve the next forecast.
This is not the place for the fireman.
It requires the mathematician, forecaster, planner and systems operator.
The distinction is fundamental.
A market intermediary asks:
“Who has tomatoes available now?”
A production-system operator asks:
“What will our customers require six months from now, what production capacity will be available then, where will the gaps occur, and what must we do now to prevent them?”
That is a much more demanding organisational capability.
“Membership — Geographic clusters composed of farmers with demonstrated commercial production histories and the capacity to account for their production over time.”
The three models compared
Dimension
1. Representative Farmers’ Association
2. Producer / Marketing Organisation
3. Production-System Operator
Primary purpose
Represent farmers
Improve members’ economic position
Synchronise future demand with productive capacity
Starting point
Farmer
Farmer + market
Demand + productive capacity
Core value
Collective voice
Collective commercial advantage
Forecasting, planning, production assurance and system reliability
Fee for representation, information, networking and advocacy
Fee/service charge for collective commercial services, often supplemented by marketing levies, commissions or transaction-based charges
Fee for access to a forecast-driven production system, with service charges potentially linked to capacity, production or transactions
The third model should not be understood simply as “Model 2 with more services.” It changes the organisation’s operating logic.
The Starting Point: What Does It Mean to Be a Commercial Farmer?
The discussion that prompted this comparison began with a practical observation: many farmers do not have the quantitative capability required to operate within a highly coordinated production system. My response is not to begin by asking how we can teach every farmer mathematics. The more fundamental question is whether a production organisation such as Farmers United should accept farmers who have not yet demonstrated, through the operation of their farms, that they can sustain and grow a livelihood from farming.
For FU, “skin in the game” needs to mean more than having invested money or having an attachment to farming. It should mean that the farm itself has demonstrated the capacity to sustain the farmer’s livelihood and contribute to the farmer’s growth. A farmer who must maintain two or three other jobs simply to keep the farm going is in a different economic position from a farmer whose farm is already generating the income from which the farmer lives, reinvests and grows.
This is not a judgement on the worth of farmers who are still transitioning into commercial agriculture. It is an organisational design decision about the kind of productive capacity FU is prepared to build its system around. If FU is ultimately expected to forecast demand, allocate production, coordinate volumes and timing, and account for delivery against those requirements, it needs members whose farms can produce a sufficiently reliable history of production, revenue, costs, yields and performance from which those calculations can be made.
The proposed 3–5 year production record therefore becomes more than a membership requirement. It becomes the beginning of FU’s quantitative production intelligence. A farmer who can demonstrate what the farm has produced over time is already generating the information from which FU can begin to understand capacity, reliability, seasonality, yield and growth. The farmer does not have to be a mathematician; the farm must, however, be capable of producing evidence that can be worked with mathematically.
This is also why I would resist the temptation to measure FU’s future success by how many farmers it can bring into the system. The objective is not to fill FU with farmers. It is to build reliable productive capacity. If farmers are encouraged to remain permanently dependent on income from several unrelated activities while the farm itself remains commercially weak, the organisation may increase its membership without increasing the productive economy. And when the productive economy remains weak, the infrastructure built to carry it — including our trains — remains underutilised.
The question is therefore not whether every farmer currently possesses the mathematics required of a production-system operator. The question is whether FU can identify, organise and progressively develop farmers whose farms are already demonstrating the productive discipline from which that capability can be built.
What Do Farmers Actually Pay For?
There is no universal global membership fee for farmer organisations. The fee structure depends heavily on whether the organisation is primarily representative, service-based, commercial, cooperative or producer-controlled.
However, current examples give us useful comparative ranges.
Representative and professional agricultural associations
The Zimbabwe Farmers Union (ZFU) currently charges annual membership fees of US$5 for smallholder farmers, US$20 for small-scale commercial farmers and US$40 for large commercial farmers. The membership card also provides access to discounts from participating firms. (ZFU)
The Zimbabwe Agricultural Society charges US$100 annually for individual members, US$150 for husband-and-wife membership and US$200 for corporate members, with lifetime membership at US$2,000. (ZAS)
Practical Farmers of Iowa charges US$50 for individual membership and US$75 for farm/household membership, with lower-cost access membership at US$25. (Practical Farmers)
The West Virginia Farmers Market Growers Association uses a more commercial basis: full producer membership is US$100–350 annually, based on gross sales. (MFVGA)
These examples illustrate the first model particularly well: membership dues primarily support participation, representation, information and member services.
Producer and commercial organisations
The National Hay Association provides a useful example of a producer-oriented fee model. New producer members pay a minimum of US$325, after which annual dues rise with annual tonnage: US$550 for 5,001–10,000 tons, US$825 for 10,001–25,000 tons and US$1,100 for 25,000+ tons. (National Hay Association)
This is particularly relevant because it demonstrates a principle that could matter for FU:
The fee is related to the economic scale of the member’s participation in the system.
An older agricultural cooperative study in the United States similarly found membership fees ranging from US$25 to US$300, with fees serving partly as member capital and as a mechanism for securing financially responsible members. (Agecon Search)
The European/global producer-group ecosystem also illustrates that membership can be tied to the services and commercial functions of the organisation. For example, GLOBALG.A.P.’s current community membership is €2,550/year for producer groups, producer/supplier associations and cooperative groups, compared with €1,550 for individual producers. This is not a farmers’ association fee in the strict sense, but it demonstrates the higher fee level attached to participation by an organised producer group in a technical/commercial standards ecosystem. (GLOBALG.A.P.)
Comparative Membership-Fee Models
Organisation / model
Geography
Organisation type
Current fee basis
Published fee
Approx. USD
Zimbabwe Farmers Union
Zimbabwe
Representative farmers’ union
Farmer category
US$5–40/year
$5–40
Zimbabwe Agricultural Society
Zimbabwe
Agricultural society / farmer community
Membership category
US$100–200/year
$100–200
Practical Farmers of Iowa
USA
Farmer organisation
Individual/farm household
US$25–75/year
$25–75
WV Farmers Market Growers Association
USA
Producer association
Gross sales
US$100–350/year
$100–350
National Hay Association
USA
Producer/marketing association
Annual tonnage
US$325–1,100/year
$325–1,100
GLOBALG.A.P.
Global
Producer/quality ecosystem
Producer group
€2,550/year
≈$2,950
NEDAC
Asia-Pacific
Agricultural cooperative network
Organisation
US$2,500/year + US$500 admission
$2,500/year
FU — proposed Model 3
Botswana
Production-system operator
To be determined from value/cost of forecast-driven production services
Not yet set
Not yet set
USD equivalents for euro-denominated fees are approximate and will vary with exchange rates.
The examples demonstrate something important: membership fees range from nominal representation dues to thousands of dollars for organisations receiving specialised commercial, technical or network services. There is no defensible global benchmark that says a farmer organisation should charge “X dollars per farmer.”
The correct question for FU is therefore not:
“What do other farmers’ associations charge?”
It is:
“What measurable economic value does FU create for a participating farmer, and what does it cost FU to provide that value?”
What This Means for FU
This distinction is particularly important because FU’s members would not be joining merely to belong to an association.
Under the emerging Model 3, the farmer would be joining because FU provides something the farmer cannot efficiently create alone:
forward visibility of demand; production planning; allocation of requirements; coordinated aggregation; commercial scheduling; logistics coordination; performance information; and access to a wider production system.
The fee should therefore be defensible in relation to the economic value of those services.
And there is a further discipline that I think is essential.
Storage, Forecasting and Infrastructure
If FU can forecast demand accurately enough to synchronise production and delivery, it may need less storage, less emergency transport, less working capital tied up in inventory and fewer fire-fighting interventions. FU’s previous experience with a rented storage facility becoming costly and vulnerable to looting is therefore not simply a problem to solve by finding a better warehouse. It is evidence that the organisation should first determine what physical infrastructure the future production flow actually requires.
The more effectively FU can forecast demand and synchronise production with the timing of that demand, the less it should need to hold produce simply because production and the market are out of sequence. Storage will not disappear; rather, it should become a calculated buffer for unavoidable timing differences rather than a substitute for poor forecasting. This potentially reduces the amount of storage, emergency transport and working capital FU needs to carry, while also reducing the risks associated with holding produce for which there is not yet a sufficiently certain destination.
This is an important distinction in moving from the producer/marketing organisation to the production-system operator. The latter does not begin by acquiring infrastructure and then finding a use for it. It builds the production system first and lets the mathematics determine what infrastructure the system actually requires.
That leads to a useful design principle:
Do not build infrastructure and then find a use for it. Build the production system first and let the mathematics determine what infrastructure the system requires.
Setting of Membership Fee
The same principle applies to membership.
Do not set the membership fee first and then invent services to justify it. Define FU’s unique value proposition, establish the cost of providing it, measure the economic benefit to the member, and then determine the appropriate fee structure.
For FU, the strategic choice is therefore much bigger than whether it should be a farmers’ association.
It is whether it should remain primarily a voice for farmers, become a collective commercial organisation for farmers, or evolve into something more demanding: a farmer-owned production-system operator capable of forecasting demand, organising productive capacity and making dispersed farms reliably responsive to the requirements of the wider economy.
That is the question the Phase 1 work needs to answer.
The Thinking Behind This Model
This discussion of farmer organisations is part of a wider body of STRLDi work on how productive systems are connected — from national demand and production, through value addition and logistics, to the infrastructure that ultimately carries economic activity.
1. What Will Botswana Put on 40 Locomotives? A question about what productive economy Botswana must build if its railway is to become an economic corridor rather than an isolated transport asset. (LinkedIn)
2. Agriculture Corridor Execution Lattice The wider architecture for connecting demand, production, aggregation, value addition, logistics and corridor execution — with discipline, standards and time certainty at its centre. (strldi.weebly.com)
3. Study Unemployment: The Report The earlier study from which this line of thinking emerged: understanding unemployment not simply as a labour-market problem, but as an outcome of the design and performance of the national production system. (strldi.weebly.com)
That makes your response to Jimmy much more than a disagreement about whether farmers can do mathematics. It becomes the entry point into the question: what kind of productive organisation does Botswana need if its farmers are to become part of a production system capable of feeding markets, filling corridors and growing the economy?
A question Southern Africa needs to ask itself before it asks its children to carry Vision 2050
There is a question about development in Southern Africa that we do not ask often enough: what kind of citizen are we producing? We speak continually about protecting citizens, supporting citizens, empowering citizens, providing services to citizens and creating opportunities for citizens. These are legitimate responsibilities of government. But alongside them is another responsibility that is rarely placed with equal political force: the responsibility of the adult citizen to become, and to raise, the people capable of producing the society that must eventually stand without being carried.
This is not an argument against protection. A government must protect its people from violence, hunger, disease, extreme deprivation and economic shocks. But protection cannot become the permanent definition of the citizen–state relationship. If today’s adults are continually addressed primarily as people whom government must protect and provide for, while their children are expected to become the engineers, scientists, technicians, entrepreneurs, manufacturers and institutional leaders who will build the future, there is a missing link between the two generations.
Where is the political language that tells the adult citizen: You are not only the person the state must protect. You are also one of the people responsible for producing the capable society that must eventually stand without being carried?
That is the question I believe Southern Africa needs to confront.
The Citizen We Protect and the Institution We Expect to Perform
The Citizen We Protect and the Institution We Expect to Perform
The recent speech on SADC Vision 2050 provides a useful lens through which to examine this question. President Cyril Ramaphosa, delivering the keynote address on 14 August at the SADC Summit Public Lecture at the University of KwaZulu-Natal, Westville Campus in Durban, repeatedly speaks about the lives the region must improve and the conditions its people should experience. Vision 2050 imagines a region where people have food, water, security and comfort, live healthy lives, are educated, possess relevant skills and capabilities, and have access to decent work and sustainable livelihoods.
The language becomes particularly explicit when the speech turns to children: “We must ensure that all children have food, water, and shelter; that they are kept safe.” It then moves to investment through adolescence in the skills of this century, digital literacy and health services, connecting the removal of these barriers directly to the productive capacity of the economy. The speech also addresses health security, equal opportunity, the safety of women, discrimination and violence, migration pressures, climate resilience, food security and the protection of livelihoods. The citizen and population are therefore repeatedly located within a system whose responsibility is to secure the conditions in which people can live and prosper.
That is legitimate. It is necessary. But there is another side to the equation.
The speech also says that Vision 2050 must become a programme of action that shapes decisions, budgets, infrastructure, skills and institutions, and that it must produce results that people can see and feel. It speaks of a shared destiny and therefore a shared responsibility to achieve the Vision. It calls for institutions of learning capable of building a regional pool of knowledge and expertise; for refining and smelting capacity, harmonised standards, infrastructure, investment and industrial planning; and for the creation of capable entrepreneurs and creative people who can build serious businesses and meet export standards.
So the issue is not that the speech contains no language of responsibility. It does. The question is where that responsibility is located, how explicitly it is assigned, and whether the two sides of the social contract are being developed with equal force.
The transcript contains 56 occurrences of “people”, but only one literal occurrence of “citizen”, no literal occurrence of “public servant”, one of “discipline”, one of “accountability” and one of “responsibility”. These are lexical counts, not measures of meaning; the speech also uses terms such as children, young people, women, farmers, communities and students. Nevertheless, they provide a useful first indication of the rhetorical landscape. A substantive reading reinforces the pattern: at least ten distinct passages position the population primarily as people to be protected, provided for or supported, while institutions and the productive system are more often described through capability, standards, infrastructure, investment, expertise, execution and results.
The issue, again, is not that the speech contains no language of responsibility. It does. The concern is the asymmetry.
This is not an argument for withdrawing protection from today’s adults. Protection and capability formation are simultaneous responsibilities. The state must protect its citizens while families, schools, communities, workplaces, institutions and citizens themselves must participate in producing the capability of the next generation. A population cannot remain indefinitely positioned primarily as the object of protection if the same population is expected to become the productive, capable and institution-building force that Vision 2050 requires.
That is the asymmetry worth examining.
It is not an accusation against one politician. It is a question about a political culture that can gradually become accustomed to speaking about citizens through their needs while speaking about institutions through their responsibilities. Over time, the distinction can become so normal that neither side notices what is being lost: the expectation that citizens, families, professionals, institutions and communities are not only recipients of a functioning system but also producers of the capability on which that system depends.
The frog does not jump out of the pot. It becomes accustomed to the temperature. The frog is a metaphor. The danger is real.
Author’s Note
This is not an argument that people who are less privileged should not be provided for or protected; protection and provision remain legitimate responsibilities of the state. The concern is the skewing of the political message when citizens are repeatedly positioned as recipients of protection, provision and support without an equally explicit and sustained expectation that adults, whatever their circumstances, participate in forming capable families, communities, institutions and the next generation.
The counts presented here were generated through AI-assisted analysis of the transcript, rather than through manual word counting by the author. They should therefore be understood as indicative evidence of the rhetorical pattern, not as a formal statistical content analysis.
Toughened by Poverty Is Not the Same as Toughened for Capability
There is an important distinction here.
We do not need to toughen people by making them poor. Poverty is not character formation. Deprivation is not an education strategy. A child should not have to experience hunger, unemployment or insecurity in order to learn persistence.
There is another kind of toughening that Southern Africa urgently needs: toughening people for capability.
It means expecting children to stay with difficult mathematics, difficult science and difficult problems. It means expecting young people to learn, practise, make things, repair things, calculate, experiment and improve. It means expecting adults to work to standards, accept responsibility, meet deadlines and understand that competence has consequences.
A functioning society replaces involuntary hardship with deliberate challenge.
It does not say, “You must suffer so that you become strong.”
It says:
“You are capable of becoming strong, and therefore we will expect more of you.”
That expectation has to begin with adults.
The Intergenerational Contradiction
We tell today’s adults that government will create jobs.
But we need their children to become the engineers, scientists, manufacturers and entrepreneurs who create the industries that create those jobs.
We tell today’s adults that government must provide services.
But we need their children to become the scientists, engineers, technicians and managers who build the systems that deliver those services.
We tell today’s adults that government must protect them from economic insecurity.
But we need their children to become the producers, manufacturers, scientists, entrepreneurs and exporters who create the economic capacity from which that security ultimately comes.
That is the circularity.
We protect one generation while expecting the next generation to build the productive system capable of sustaining that protection.
And that is why the political language matters.
The adult citizen cannot be only the endpoint of government policy.
The adult citizen is also part of the production system that produces the future workforce.
Vision 2050 Is an Industrial Vision
This becomes particularly important because SADC Vision 2050 is not simply a vision of a better-protected population. It is a vision of a vibrant, dynamic and productive region, in which people have skills and capabilities and decent work and sustainable livelihoods. It is explicitly connected to economic integration, industrialisation and the development of regional value chains.
The speech itself makes the industrial contradiction remarkably clear.
Southern Africa possesses the energy, minerals, agricultural resources, skills, markets and financial institutions needed to build a prosperous industrialised region. Yet the region continues to look beyond its borders to supply its people. Its railways were historically built to carry raw minerals to the sea rather than to connect regional economies.
President Ramaphosa puts the problem even more sharply:
“We export the ore and we import the battery.”
The region supplies an industrial revolution happening elsewhere and then purchases the products of that industrial revolution at prices set by others. The stated response is not simply to mine more. It is to use the region’s own resources to drive its own industrial revolution.
The proposed industrial direction includes pharmaceuticals, automation, microprocessing, paper and power, furniture, semiconductors, mineral processing, agro-processing and advanced regional manufacturing.
The speech calls for refining and smelting capacity rather than simply exporting ore; processing plants rather than simply exporting agricultural products; and cars assembled in one SADC country using components manufactured in another. It calls for modern irrigation, seed development, veterinary science and agroecology, and for young people to build businesses that trade seamlessly across SADC.
Every one of these ambitions carries a human-capability requirement.
The STEM Is Already Inside the Industry
By 2050, the RVC pathway requires approximately 165 million STEM-capable people. At the current trajectory, Southern Africa would have only about 60 million. The gap is approximately 105 million people.
The STEM requirement is not something we need to invent for Southern Africa. The industries we say we want are already specifying it for us.
If the region wants batteries, the production system requires chemistry, electrochemistry, materials science, thermodynamics and electrical engineering.
Pharmaceuticals require chemistry, biology, microbiology, genetics, biochemistry, pharmacology and statistics.
Semiconductors require physics, mathematics, materials science and engineering.
Automation requires mathematics, computing, electronics, physics and engineering.
Mineral beneficiation requires geology, chemistry, metallurgy, physics, mathematics and engineering.
Modern agriculture increasingly requires biology, chemistry, genetics, statistics, hydrology, soil science, agricultural engineering and computing.
The scale is the harder question. Our modelling for the RVC pathway indicates that Southern Africa would require approximately 165 million STEM-capable people by 2050. If the present trajectory simply continues, the region reaches only about 60 million. That leaves a capability gap of approximately 105 million people.
2050
STEM-capable people
Current trajectory
~60 million
RVC requirement
~165 million
Capability gap
~105 million
RVC requirement / current trajectory
2.8×
That is why STEM cannot be left as an education-sector aspiration. The productive economy is already telling us what capability it needs. Mathematics is the connective tissue: it sits inside modelling, optimisation, process control, engineering, statistics, artificial intelligence, agricultural forecasting, energy systems and logistics. The question is therefore no longer whether Southern Africa needs more STEM.
The question is whether we are prepared to build the additional ~105 million people capable of doing the work our economic ambitions require.
2050 Is the Destination. The Capability Must Arrive Earlier.
If SADC Vision 2050 is to be more than a statement of where the region would like to be, the capabilities required to deliver it cannot be assembled in 2049. The people who will design, build, operate, manage and continuously improve the economy of 2050 must be entering the capability pipeline now. Training takes years; professional competence takes longer; and industrial capability requires experienced people working inside institutions and productive enterprises, not simply graduates holding certificates.
This changes the calculation. The question is not “How many STEM-capable people should SADC have in 2050?” The harder question is “When must those people begin entering the system, and how many must already be working at each stage, for the 2050 economy to be operational?” If the region requires approximately 165 million STEM-capable people by 2050, and the current trajectory produces only about 60 million, the region faces a capability gap of approximately 105 million people. That gap cannot be closed by a final burst of graduates in the last decade; the capability has to be built, deployed and accumulated progressively over the preceding 20–25 years.
The Capability Cannot Be Built at the Same Speed as the Vision
The implication is blunt: 2040 is not the date by which SADC should decide whether it has enough STEM capability. It is approximately the date by which the capability should already be operating at substantial scale. By 2050, the region should be refining and renewing a functioning capability base, not discovering that it needed one.
Period
What must happen
Approximate capability position
2026–2030
Define the 2050 productive economy and quantify the STEM occupations required. Expand the education, TVET, university, apprenticeship and industry pipeline accordingly.
Capability pipeline being redesigned and scaled
2030–2035
First major expansion of new STEM capability begins entering productive employment in agriculture, manufacturing, infrastructure, energy, mining, logistics, technology and public institutions.
Capability begins working in the economy
2035–2040
The new capability base must be operating at scale. Experienced professionals begin leading and training the next generation.
Major capability stock established
2040–2045
Most of the capability required for the 2050 economy should already be working, with remaining expansion directed toward identified gaps and emerging technologies.
2050 capability substantially operational
2045–2050
The emphasis shifts from creating basic capability to replacing retiring workers, upgrading skills, improving productivity and introducing new technologies.
Capability fully deployed for Vision 2050
This also means that the 165 million STEM-capable people required in 2050 are not a graduation target. They represent the human capability that must be available and functioning across the economy. The education system therefore has to work backwards from that stock: determine how many engineers, mathematicians, scientists, technologists, agricultural specialists, manufacturing specialists, energy professionals, geologists, statisticians, systems modellers and other STEM-enabled occupations are required; determine the training time for each; account for retirement, migration and attrition; and then calculate the annual number who must enter and successfully progress through the pipeline.
The arithmetic begins in 2026 because the economy we want in 2050 has already begun to require the people who will build it.
That child is part of the future productive capacity of Southern Africa.
What is the adult we must be for them?
What Must Change in the Citizen
The question cannot be left with government and the education system.
The citizen is part of the production system.
That means asking more of citizens—not by making them poor, but by raising the expectations attached to adulthood. Parents must ask what their children are becoming capable of doing. Schools must ask whether children can think, calculate, investigate, make and solve rather than merely pass examinations. Universities must ask whether they are producing capability for a production system rather than certificates for a qualification system.
Young people must understand that the world they are entering will not reward certificates alone. It will reward capability.
And governments must ask themselves a corresponding question: if they announce industrialisation, where is the human-capability plan underneath it?
If we want public institutions to become more competent, disciplined and accountable, we must also produce citizens capable of occupying and leading those institutions.
If we want globally competitive industries, we must produce the people capable of making them globally competitive.
If we want children to build a different future, we have to begin producing that capability in them now.
What Happens When Leadership Expects More of Its Citizens?
The question becomes unavoidable when we look at countries whose leaders expected citizens – not institutions – to become active producers of national capability, not simply recipients of what the state provides.
What Did National Development Require of the Citizen?
Work discipline, knowledge, entrepreneurship, technology
Industrial and technical capability
Rwanda — Paul Kagame
Diligence, quality, productivity, responsibility
Human and productive capability
SADC — Vision 2050
What must our citizens become capable of doing?
What capability must the region build?
These were not simply programmes for building better institutions. They were programmes for building people capable of using those institutions to produce national outcomes.
The distinction matters. Institutions provide the platform; people provide the capability that makes the platform productive. Education therefore cannot be treated only as a social service, STEM cannot remain an academic category, and employment cannot be understood simply as something government must provide. If a country wants industrialisation, modern agriculture, manufacturing, technology and sophisticated infrastructure, it must deliberately build citizens capable of designing, calculating, operating, managing and continuously improving those systems.
The question for SADC Vision 2050 is therefore direct: what capabilities are we asking our citizens to acquire because the future economy will require them? And, equally, are our education systems, public services, workplaces and national leadership deliberately building those capabilities at the scale required? The evidence below puts numbers against that question.
The issue is not whether citizens should be protected. They should. The issue is whether protection is being matched by deliberate capability formation. A region cannot build the future it describes in Vision 2050 while leaving the citizen’s contribution to that future implicit.
That is the bridge.
A Starting Point We Cannot Avoid
This is not a scare tactic.
It is an invitation to take the vision seriously enough to ground it in reality.
SADC has given the region a destination. The speech itself says that Vision 2050 must become more than a statement of intent; it must become a programme of action that shapes decisions, budgets, infrastructure, skills and institutions and produces results in the lives of people.
Our concern is that we have not yet worked backwards from that destination far enough.
How many people will Southern Africa have?
How many will need productive work?
What must the region produce for them?
What must it produce for the world?
Which industries must exist?
Where should those industries be located?
What resources and infrastructure will they require?
And finally:
How many STEM-capable people must we have, in each country and across the region, by 2030, 2035, 2040 and 2045, for the 2050 vision to be possible?
We should be willing to discover that our first numbers are wrong.
What we should not be willing to do is proceed without numbers.
The purpose of the RVC Integrated Map is therefore not to tell SADC what its future must be.
It is to help the region see the future it has already said it wants—and then work backwards far enough to discover what must be true today for that future to become possible.
If Vision 2050 is to be real in 2050, the people who will build it must already be on their way.
That is the starting point.
EVIDENCE TABLES
Table 1 — What the Speech Literally Says
Concept
Literal occurrence in transcript
People
56
Citizen
1
Public servant
0
Discipline
1
Accountability
1
Government
2
Institutions
6
Responsibility
1
Methodological note: these are literal word counts. They are not counts of meaning. The speech uses many other terms—children, young people, women, farmers, communities, students and so forth. The counts are therefore an indication of the rhetorical field, not a formal content-analysis result.
Table 2 — Substantive Passages Positioning the Population as Protected, Provided For or Supported
#
Substantive theme
Indicative count
1
Food, water, security and comfort
1
2
Healthy lives/health security
2+
3
Education, skills, capabilities, decent work and sustainable livelihoods
1 major passage
4
Protection of the peoples of the region
2+
5
Protection from global supply-chain disruption, food insecurity and rising costs
2+
6
Equal opportunity for women and men, urban and rural, young and old
1
7
Women being safe / GBV / femicide
1 major passage
8
Migrants protected from discrimination, intimidation and violence
1 major passage
9
Children receiving food, water, shelter, safety and developmental support
1 major passage
10
Access to medicines, vaccines and health products
1 major passage
Indicative substantive total: at least 10 distinct passages
The children’s passage is particularly explicit: “We must ensure that all children have food, water, and shelter; that they are kept safe.”
Table 3 — Women Specifically
Women-specific theme
Indicative substantive references
Equal opportunity for women and men
1
Women must be safe / GBV and femicide
1 major passage
Men and boys must be raised to reject violence and respect/protect women
1 major passage
Support for survivors
1
Economic empowerment of women
1
Women entrepreneurs’ access to procurement and markets
1 major passage
Women as successful enterprise owners and leaders
1
Women-led SMEs / entrepreneurship
1+
At least 6 substantive women-specific passages, with the speech moving between protection, safety, economic empowerment and economic agency. The distinction matters: not every reference to women should be coded as dependency.
Table 4 — The Industry Already Contains the STEM Requirement
The speech itself identifies pharmaceuticals, automation, microprocessing, paper and power, furniture and semiconductor value chains, while also calling for mineral processing, agro-processing, refining, smelting, manufacturing and modern agricultural science.
Table 5 — The Human-Capability Readiness Clock
The STEM Capability Gap: Current Trajectory vs RVC Requirement
Year
Approx. population
STEM-capable under current trajectory*
STEM-capable required for RVC Vision
STEM capability gap
Required / current trajectory
2026
~400m
~25m
~25m
0m
1.0×
2030
~445m
~30m
~45m
15m
1.5×
2035
~480m
~36m
~75m
39m
2.1×
2040
~505m
~43m
~105m
62m
2.4×
2045
~530m
~51m
~135m
84m
2.6×
2050
~550m
~60m
~165m
105m
2.8×
Important: the “trajectory” and “required” figures are working scenarios for the RVC Integrated Map, not existing SADC statistics or adopted SADC targets. The region needs to establish the actual country-by-country baseline and then test these requirements against its industrial production plans.
The central finding is the timing, not the false precision of the first estimate:
The people required for 2050 have to be in formation long before 2050.
Table 6 — Leaders Who Made Citizen Capability Part of the National Development Message
This comparison is not a claim that these leaders alone caused their countries’ economic outcomes. It asks a narrower question: how explicitly did their political language make citizen discipline, responsibility, self-reliance, learning and productive capability part of national development? GDP per capita is included only as economic context.
Indicative rank
Leader / country
Citizen-capability message
2024 GDP per capita, current US$
What citizens were expected to contribute
1
Lee Kuan Yew — Singapore
Work hard; remain disciplined; no one owes you a living; self-reliance; family responsibility; excellence
Human capability, enterprise, institutional and productive capacity
6
Cyril Ramaphosa — South Africa
Strong institutional, skills and industrial capability message; citizen responsibility present but less developed as an explicit economic-formation frame in this speech
~$6,267
What has been explicitly expected? What remains underdeveloped?
The comparison is useful precisely because the leaders do not all use the same model. Lee’s political tradition explicitly emphasised a pragmatic, responsible, disciplined, frugal and hardworking citizen, with social benefits not allowed to erode work ethic. (Public Service Commission) Lee himself described abandoning welfare because he believed it could weaken self-reliance and the desire to excel, while emphasising the need to “bake” the economic pie before distributing it. (Ministry of Foreign Affairs)
Deng made the connection even more directly between education, science, technology and productive capacity, arguing that science and technology were a fundamental productive force and that education and science had to be treated strategically over a 15–20-year horizon. (MOE China) Kagame’s language is particularly close to the proposition at the centre of this article: citizens are individually and collectively responsible for national development, and productivity depends upon diligence, quality and respect for time. (Paul Kagame)
The lesson is not that Southern Africa should copy Singapore, China, Korea, Malaysia or Rwanda.
It is simpler:
Political leadership can ask citizens to become capable of the future they want, while simultaneously building the institutions that enable them to do so.
That is the question Southern Africa now has to ask itself.
Not whether government should protect its citizens.
Not whether institutions should be made more capable.
But whether we are asking enough of the adults who must produce the citizens who will eventually make those institutions—and the economy they serve—capable enough to stand on their own.
On 11 August, President Duma Boko spoke about the urgency with which Botswana must begin to execute. In the remarks shared by Ray Mafoko, he returned to Botswana Railways as an example. He had set a deadline for the railway to become profitable. December came; it was not profitable. His response was blunt: decisions had to be made, the country could not remain “supine” in the face of challenges, and Botswana was in a race against time. Ray Mafoko’s publication of President Boko’s remarks
The statement can be heard simply as an instruction to Botswana Railways: become profitable. But perhaps we should slow down long enough to ask what that instruction actually requires of the economy around the railway. A railway cannot manufacture profitability by instruction. It becomes profitable when there is sufficient economically viable freight to move, when it can move that freight reliably and competitively, and when the productive economy continues to generate more freight as the railway expands. The more useful question, therefore, is not only how do we make Botswana Railways profitable? It is what must Botswana produce, process, sell and move for Botswana Railways to become increasingly profitable?
That takes us into territory that belongs initially to Trade. It takes us beyond the familiar regulatory role of controlling standards, licences, borders and commercial rules and into the economic work of understanding markets, defining demand, organising production opportunities and connecting them to the infrastructure that must carry the resulting goods. Botswana Railways then becomes part of that economic architecture, rather than being left at the end of the system to ask where it will find enough freight.
First, Let Us Look at the Railway We Have
In May 2026, Botswana Railways reported that it had been moving around one million tonnes of freight annually, while approximately 1.4 million tonnes a year were required to cover expenses. At the same time, only 11 of 34 locomotives and fewer than 200 of 1,155 wagons were operational. BR had also recorded an operating loss of P235 million between 2021 and 2024. (Daily News)
The natural response is to look at the 1.4 million tonnes and say: get BR to 1.4 million tonnes.
But that is where we need to be careful. 1.4 million tonnes is a financial threshold. It is not an economic ambition. If we make break-even the destination, we risk designing the railway around survival: reach the line, stay above it, contain costs, avoid taking risks and wait for the next problem. That is a balancing logic. It can keep an organisation alive without necessarily creating the conditions for it to become a growing economic engine.
The alternative is to understand profitability as feedback within a reinforcing economic loop. More viable production creates more freight; more freight creates railway revenue; revenue and investment create more capacity; more capacity allows more production to move; and increased production creates more opportunities for markets, investment and further freight. The question is therefore not simply how BR gets to the break-even line, but what size of productive economy Botswana needs to build around the railway so that the railway can keep growing with it.
Four Stages Give Us Something We Can Actually See
Let us use a simple eight-year planning model in which BR moves from 11 operational locomotives to 20, then 30, then 40. If we use the reported 1.4 million tonnes as the initial working capacity at 11 locomotives and scale the planning capacity proportionally with operational locomotives, the numbers look like this:
BR stage
Operational locomotives
Annual planning capacity
Average per day
Stage 1
11
1.40m tonnes
3,836 t/day
Stage 2
20
2.55m tonnes
6,973 t/day
Stage 3
30
3.82m tonnes
10,460 t/day
Stage 4
40
5.09m tonnes
13,948 t/day
These are planning numbers, not an engineering forecast of BR’s physical capacity. Actual capacity would depend on locomotives, wagons, track, signalling, loading and unloading facilities, maintenance, crews, turnaround times and the ability of the network to handle the resulting train movements. The purpose of the calculation is different. It allows us to see the scale of the productive economy that would need to grow if Botswana progressively restores and expands railway capacity.
Now apply the original planning allocation of 45% agriculture, 35% manufacturing and 20% mining:
BR stage
Total capacity
Agriculture 45%
Manufacturing 35%
Mining 20%
11 locomotives
1.40m
630,000 t
490,000 t
280,000 t
20 locomotives
2.55m
1.145m t
891,000 t
509,000 t
30 locomotives
3.82m
1.718m t
1.336m t
764,000 t
40 locomotives
5.09m
2.291m t
1.782m t
1.018m t
Now stop at the last line for a moment.
At 40 operational locomotives, this planning model would require approximately 2.29 million tonnes of agricultural freight and 1.78 million tonnes of manufactured freight, in addition to approximately 1.02 million tonnes of mining freight. The railway cannot create those goods. Agriculture, manufacturing and mining must create them, markets must absorb them, and the logistics system must be capable of moving them.
So the question becomes very simple:
What will Botswana put on 40 locomotives?
The Goods Are Already Moving
The answer does not begin with a blank sheet of paper. Botswana already has a substantial goods economy moving through its borders.
The 2024 International Merchandise Trade Statistics recorded 2.332 million tonnes of goods excluding oil imported into Botswana. Food and live animals accounted for 667,708 tonnes. Manufactured goods classified chiefly by material accounted for 1.101 million tonnes, machinery and transport equipment another 99,101 tonnes, and miscellaneous manufactured articles 58,476 tonnes. (GBoS Data)
The latter three manufacturing-related categories therefore amounted to approximately:
1,101,325+99,101+58,476 = 1.259 million tonnes
Add food and live animals:
667,708+1,258,902=1.927 million tonnes
Botswana therefore already imported approximately 1.927 million tonnes of food and manufacturing-related goods in 2024 within these categories. That is more than the 1.4 million tonnes that BR has identified as the level required to cover its expenses.
We should not make the foolish conclusion that all 1.927 million tonnes should now move by rail. Some goods are more appropriately moved by road; some are time-sensitive; some are high-value and relatively low-volume; some require short-haul distribution; and some goods will continue to be imported because producing them in Botswana would not be economically sensible.
The significance of the number is elsewhere. The freight market already exists. Botswana is already buying these goods, already paying for them, already bringing them through its borders and already moving them to consumers and businesses.
The question for Trade is therefore not simply where can BR find more freight? It is: which of these existing goods flows are economically suitable for rail, which imports could realistically be replaced by domestic production, and what additional markets could Botswana develop so that production grows beyond the domestic market?
That is a much more productive starting point.
Now Put Today’s Production Beside Tomorrow’s Requirement
Botswana is also not starting its productive economy from zero.
During the 2024/25 cropping season, Botswana reported approximately 144,000 tonnes of crop production, while horticultural production reached 88,670 tonnes, including vegetables and fruit. (Daily News) Government has also reported substantial livestock production, including approximately 69,000 tonnes of beef and 49,000 tonnes of poultry meat in 2022/23.
Using these documented quantities as a working production floor gives:
144,000+88,670+69,000+49,000=350,670 tonnes
This is not a claim that Botswana’s total agricultural production is only 350,670 tonnes. It is a conservative working number from the physical production quantities we can presently place side by side. Eggs have not been converted into tonnes, and other livestock and agricultural products have not been added.
But even this incomplete number is enough to expose the scale of the work ahead.
BR stage
Agriculture freight requirement
Working local production
Today’s production as % of requirement
Production gap
11 locomotives
630,000 t
~351,000 t
55.7%
~279,000 t
20 locomotives
1.145m t
~351,000 t
30.6%
~794,000 t
30 locomotives
1.718m t
~351,000 t
20.4%
~1.367m t
40 locomotives
2.291m t
~351,000 t
15.3%
~1.940m t
The point is not that Botswana cannot get there. The point is that today’s production is not the economy required by a 40-locomotive railway.
Today’s production is the starting point from which that economy has to grow.
At 11 locomotives, the working agricultural production floor represents approximately 56% of the agricultural freight requirement. At 20 locomotives, it represents about 31%. At 30 locomotives, approximately 20%. By 40 locomotives, it represents approximately 15%.
That is the productive gap.
And the productive gap is not a reason to stop.
It is the work.
This Is Where Trade Needs Another Muscle
Trade’s regulatory role remains necessary. Botswana needs standards, licensing, customs, competition rules, consumer protection and a functioning commercial environment. But a country that wants to move from importing a large proportion of its goods to producing, processing and exporting substantially more cannot ask its economic-development ministry to stop at regulating commerce.
Trade has to know where the markets are.
It needs to know what Botswana buys, from whom, in what quantities and at what value. It needs to know which goods are growing in demand, which markets are opening, which imports might be competitively replaced, which products Botswana could export, and what quantities buyers would actually take.
The work then moves backwards from the market. If a buyer requires 20,000 tonnes of a product a year, at a particular specification, during particular months and at a particular price, that is not yet an agricultural programme. It is a market requirement. The next calculation is what production capacity is needed to meet it, who can produce it, where it can be produced, what inputs and infrastructure are required, what processing is necessary, how the output will be aggregated and how it will reach the buyer.
That is where the Ministry’s economic-development mandate becomes different from simply saying “produce more.”
There is another danger here: each part of the economy can become concerned mainly with whether the problem is occurring at its own end. Trade can look at regulation, Agriculture at production, manufacturers at markets, farmers at buyers, logistics operators at freight and Botswana Railways at its available tonnage. Each may have a perfectly reasonable explanation for why its own part cannot move faster. But if the economic system is treated as a collection of separate responsibilities rather than as one connected production-and-market system, the country can spend years improving individual parts while the whole system continues to take on water.
The problem is not necessarily at the end where the water is visible. It may be in the connections between the ends.
What Should the Trade Economic-Development Manual Contain?
If Trade is given an economic-development directive alongside its regulatory mandate, I would expect its operating manual to contain at least the following:
Function
What Trade must actually do
Market intelligence
Maintain a live picture of what Botswana buys, from whom, in what quantity, value and trajectory.
Demand definition
Quantify domestic, SADC and international demand by product, volume, specification, price and timing.
Import replacement
Identify imports that Botswana could realistically produce or process competitively.
Export development
Identify products and markets where Botswana can credibly gain market share.
Product prioritisation
Rank opportunities by market size, margin, feasibility, employment, infrastructure and strategic value.
Production requirements
Translate markets into tonnes, quality, timing, land, water, inputs, technology and processing requirements.
Producer mapping
Know who can produce what, where, at what scale and with what reliability.
Aggregation architecture
Organise dispersed production into commercial volumes, consistent quality and predictable delivery.
Processing
Identify where raw production must be graded, stored, chilled, processed, packaged or transformed.
Buyer development
Build relationships with retailers, processors, institutions, hospitality and regional/international buyers.
Commercial contracting
Develop forward orders, specifications, supply schedules and commercial arrangements that give producers a production signal.
Logistics planning
Map movement from producer to aggregation, processing, distribution and market.
Freight-demand planning
Convert production and markets into tonnes, origins, destinations, seasonality and frequency.
Rail–road allocation
Determine which movements are economically suited to rail, road or intermodal transport.
Investment pipeline
Turn identified market and production gaps into investable projects.
Capability development
Identify missing skills, technology, equipment, finance and management capability.
Production monitoring
Track hectares, yields, throughput, quality, delivery and variance from plan.
Market performance
Measure actual import replacement, market share, exports, prices and commercial returns.
Economic feedback
Feed actual results back into the model and continuously adjust the production programme.
Corridor development
Translate production and market flows into the Botswana Railways corridor: origins, aggregation points, processing nodes, destinations, seasonality, train frequency and capacity requirements.
This does not mean that Trade becomes the farmer, manufacturer, processor, investor, logistics operator or railway. Its job is to see the economic system and organise the information, relationships and decisions that allow those actors to work together.
The sequence is therefore:
That is what makes the railway part of an economic corridor rather than simply a railway company trying to sell transport capacity.
Where Does the Farmer Fit?
This distinction matters because a farmer who asks, “Who will buy what I produce?” is asking a legitimate commercial question. It should not be the farmer’s responsibility to discover the market after production has already taken place. The responsibility for identifying demand, quantifying it, developing buyers and translating that demand into production opportunities belongs within the economic-development function of Trade.
Once that market signal exists, the farmer’s responsibility becomes much clearer. The farmer can determine whether the required crop, livestock or other product can be produced at the required volume, quality, price and time. A Farmers Association or a Centre can then help aggregate production, coordinate growers, improve consistency and organise delivery against that identified demand.
This is where a Centre or Farmers Association can eventually become financially stronger. It does not have to become the buyer of everything, and it should not promise farmers that every crop will automatically be sold. Its role can increasingly be to organise supply against a market that has already been identified, reducing the randomness between production and sale.
The farmer therefore does not have to invent the market.
Trade develops and organises the market opportunity; producers build the capacity to supply it; associations and Centres aggregate that supply; processors add value; investors build missing capacity; logistics operators move the goods; and Botswana Railways becomes the corridor through which an increasing share of the economically suitable long-haul movement can flow.
That is a system in which each participant can see where his or her responsibility begins and ends.
Road Does Not Have to Lose for Rail to Grow
There is also no need to turn this into a fight between Botswana Railways and the freight companies already operating on the roads. A growing productive economy should create more freight, not simply move the same freight from one operator to another. Road remains essential for collection, short-haul distribution and last-mile delivery, while rail can progressively take more of the long-haul, bulk and consolidated movements for which it is economically suited.
We already have a practical illustration of what that can mean. In July 2026, Botswana Railways reported that the share of fuel imports transported by rail had fallen from approximately 70% to below 20% after its fuel tankers were withdrawn from service. The refurbished tankers now returning to service can carry 55,000 litres each, while a full train can move approximately 1.87 million litres, equivalent to roughly 50 fuel trucks. (Daily News)
The point is not that every truck should become a train. The point is that different transport modes can be allocated according to the economics of the movement. As the total productive economy grows, the appropriate share for rail can grow with it. Road operators can become part of the aggregation, distribution and intermodal system rather than being treated as an obstacle to railway recovery.
That is a much more sensible way to think about the relationship.
The Numbers Now Give Us a Different Question
At 11 locomotives, the planning capacity is approximately 3,836 tonnes a day. At 20 locomotives, it is approximately 6,973 tonnes a day. At 30 locomotives, it rises to 10,460 tonnes a day, and at 40 it reaches approximately 13,948 tonnes a day.
The question is not whether Botswana can magically produce enough goods tomorrow to fill 40 locomotives. It cannot. The question is whether Botswana can deliberately build the productive economy that will require 40 locomotives when that capacity becomes available.
That requires Trade to work ahead of the railway. It requires Agriculture to understand the production requirements of identified markets. It requires manufacturers and processors to see opportunities in the goods Botswana currently imports. It requires investors to see bankable production opportunities rather than simply waiting for a fully formed market to appear. It requires farmer organisations to become capable of aggregating commercial supply. And it requires logistics planning to connect all of this physical production to actual buyers.
At 20 locomotives, the planning model calls for approximately 1.145 million tonnes of agricultural freight and 891,000 tonnes of manufactured freight. At 30, those figures rise to 1.718 million and 1.336 million tonnes. At 40, they reach 2.291 million and 1.782 million tonnes.
Those numbers should not make us say, “Botswana cannot do this.”
They should make us ask:
What has to be built for Botswana to do this?
That is the difference between looking at a gap as evidence of impossibility and looking at a gap as a development programme.
Profitability Is Not the Destination
This is why I am reluctant to make the 1.4-million-tonne break-even number the centre of the discussion.
If the system is told repeatedly that BR must reach 1.4 million tonnes, the organisation can become oriented towards achieving and protecting that threshold. The resulting behaviour can become cautious: contain expenditure, protect the existing customer base, avoid capacity commitments, avoid risk and attempt to remain just above the line. The balancing loop then becomes stronger, while the productive economy around the railway remains weak.
A different structure starts with growing demand.
In this structure, profitability is not ignored. It becomes an essential feedback signal. If the additional freight does not produce adequate revenue, the system has to ask why: is the product wrong, is the market wrong, is the price wrong, is the route wrong, is utilisation too low, are turnaround times too long, or is the cost structure too high?
Profitability tells the system whether the reinforcing loop is working. It does not define the size of the economy we should be satisfied with.
That is why the ambition should not be “keep BR above break-even.” The ambition should be to build a productive economy in which BR can progressively increase its capacity because the economy is producing the freight that makes that capacity economically valuable.
So, What Will Botswana Put on 40 Locomotives?
We already have some of the answer.
Botswana is already importing the goods. Botswana is already producing agricultural goods. Botswana already has farmers, manufacturers, processors, freight companies, investors, buyers and a railway corridor. The missing piece is not the complete absence of economic activity. The missing piece is the deliberate connection of these activities at the scale required to transform the productive economy.
That is the work that must now become visible.
Trade can identify the demand and develop the market. Agriculture and producers can build the production capability. Farmer organisations and Centres can aggregate supply. Manufacturers and processors can add value. Investors can build the missing capacity. Logistics operators can collect, consolidate and distribute. Botswana Railways can become the long-haul corridor connecting that growing production to domestic, regional and international markets.
Then the railway is no longer sitting at the end of the system asking:
“Where will I find freight?”
The economic system is feeding the corridor.
Perhaps President Boko knows this.
Perhaps the statement on 11 August was intended to make the country uncomfortable enough to ask what “make Botswana Railways profitable” actually means.
Because the easier question is:
How do we get BR to 1.4 million tonnes?
The harder question is:
What are we going to build in Botswana that will make 40 locomotives necessary?
That question belongs to Trade.
It belongs to Agriculture and Manufacturing.
It belongs to farmers, producer organisations, processors, investors and logistics operators.
And it belongs to Botswana Railways.
Most importantly, it is not a question that requires Botswana to wait until it has all the answers before beginning. The numbers tell us where the gaps are. The gaps tell us what has to be built. And once the country can see what has to be built, the question changes from “Can we do it?” to “What do we need to do first?”
Botswana Railways: freight volumes, break-even requirement, locomotive and wagon availability, and operating losses.DailyNews, 21 May 2026. Botswana Railways records P235 million loss
Botswana’s International Merchandise Trade Statistics. Statistics Botswana — official source for customs-based import and export data. Statistics Botswana explains that the underlying merchandise-trade data originate with BURS Customs & Excise and are transferred to Statistics Botswana for processing. (Statistics Botswana) International Merchandise Trade Statistics — December 2024
Botswana crop and horticultural production, 2024/25. President’s State of the Nation Address reporting approximately 144,000 tonnes of crop production and 88,670 tonnes of horticultural production. DailyNews/BOPA, 11 November 2025. (Daily News) 2024/25 crop and horticultural production figures
Botswana horticultural production and market development.DailyNews, 31 March 2026. This provides the more recent figure of 140,881 tonnes of horticultural production from April 2025 to January 2026, including 114,080 tonnes of vegetables and 26,800 tonnes of fruit, and notes that production exceeded national vegetable demand by 1.8%. (Daily News) Progress in horticultural production
Horticultural import restrictions and domestic production.DailyNews, 29 April 2024. The report records horticultural production rising from 67,000 tonnes in 2021 to 86,000 tonnes in 2023, alongside a substantial reduction in the horticultural import bill. (Daily News) Horticultural import ban and local production
Botswana Railways fuel-corridor example.DailyNews, 15 July 2026. The report states that the share of fuel imports transported by rail had fallen from approximately 70% to below 20%, that a refurbished tanker carries 55,000 litres, and that a full train can carry approximately 1.87 million litres, equivalent to about 50 fuel trucks. (Daily News) Botswana Railways fuel tanker refurbishment and rail freight capacity
One correction:
We would not retain the earlier statement that the 2024 agricultural production floor is exactly 350,670 tonnes without a qualification. The crop/horticulture figure of 144,000 + 88,670 is from 2024/25, while the beef and poultry figures cited are from 2022/23. They are useful for demonstrating scale, but they are not a clean same-year agricultural balance.
More importantly, we now have a newer horticulture figure of 140,881 tonnes for April 2025–January 2026. (Daily News)
So for a publication intended to withstand scrutiny, we retain the ~351,000-tonne figure explicitly as a “working production floor assembled from available documented production series”.
Across very different traditions, one finds recurring attempts to understand why human suffering, conflict and disorder persist, and what allows a different pattern to emerge. The languages are different, and the underlying philosophies should not be collapsed into systems-thinking terminology, but there are striking points of convergence.
Cultural wisdom
What it says about recurring patterns
Response to the vicious pattern
Similarity to Healing the Poison
Important distinction
Hindu traditions — Karma, Samsara, Dharma
Actions and dispositions participate in recurring cycles of consequence and rebirth.
Change conduct, consciousness and alignment with Dharma; ultimately seek liberation from the cycle.
The pattern is not treated as a single event; transformation occurs through changed practice.
Strongly metaphysical and spiritual; liberation from the cycle is central.
Buddhism — Dependent Origination
Suffering arises through interconnected causes and conditions; changing conditions can alter the continuation of suffering. (Stanford Encyclopedia of Philosophy)
Remove or transform the conditions sustaining suffering.
Looks beyond the visible suffering to what continually produces it.
The emphasis is cessation of suffering and liberation, rather than redirecting a social relationship into a virtuous reinforcing loop.
Daoism — Dao, Yin-Yang, Wu Wei
Reality is dynamic, relational and continuously changing; forceful intervention can work against the way things naturally unfold.
Work with the movement of the system rather than imposing unnecessary force.
Strong resonance with working with existing forces rather than fighting them.
Its philosophical centre is harmony with the Dao, not specifically the healing of a reinforcing interpersonal structure.
Chinese Five Elements / Wu Xing
Conditions continually transform and influence one another through cycles of generation and control.
Restore balance within the relationships between the elements.
Recognises that changing one relationship can alter the behaviour of the wider pattern.
More explicitly cyclical and cosmological than the relational intervention in Healing the Poison.
Jainism — Karma and Ahimsa
Actions create consequences that bind the individual to recurring cycles.
Discipline action, reduce harm and progressively purify conduct.
Small disciplined changes in behaviour matter over time.
The objective is liberation from karmic bondage rather than redirecting an existing social reinforcing structure.
Shinto — Renewal and purification
Disorder, impurity and imbalance require restoration and renewal.
Purification, restoration and renewed relationship with the sacred and community.
Does not necessarily destroy what is damaged; restoration is possible.
Its framework is religious and ritual rather than causal-structural.
Indigenous American traditions — Medicine Wheel / Seven Generations
Life is relational and consequences extend across people, generations and the natural world.
Restore relationship, balance and responsibility across the wider community and future generations.
Strong emphasis on the whole relationship system, not merely the immediate event.
Traditions differ substantially among Indigenous nations and should not be treated as one unified philosophy.
African wisdom / Ubuntu
A person’s humanity is constituted through relationships with other people; individual and community flourishing are interconnected. (IUScholarWorks)
Restore relationship, dignity, belonging and communal harmony.
The health of the relationship becomes the medium through which the people within it change.
Ubuntu is broader than a method for reversing a vicious loop; it is a conception of personhood and ethical life.
Norse traditions — cycles of destruction and renewal
Even great orders can enter cycles of destruction and renewal.
Renewal follows destruction and transformation.
Recognises that systems can move through recurring patterns rather than linear progress.
Much more concerned with cosmic destiny and renewal than deliberate human intervention.
Sufi traditions — descent and return
Human life can be understood as movement away from and back towards the source.
Inner transformation, remembrance and return.
The response is transformative rather than simply removing an external problem.
Primarily spiritual and inward.
Kabbalah — Tree of Life
Reality is understood through interconnected dimensions and flows.
Restoration, alignment and repair.
Strong resonance with the idea that the health of the whole depends upon relationships within the whole.
Metaphysical and theological framework rather than an empirical systems methodology.
Greco-Roman / Stoic traditions
Human beings live within larger orders they cannot fully control.
Change one’s response, exercise virtue and live according to reason and nature.
Focuses on changing one’s own contribution rather than attempting to control everything around oneself.
More focused on individual virtue and acceptance than on redirecting a relational feedback structure.
Biblical wisdom
Repeated human responses can deepen either disorder or peace; evil is not to be repaid with evil. The New Testament explicitly calls for living in peace and overcoming evil with good. (Bible Gateway)
Forgiveness, reconciliation, restraint, love and doing good in response to wrongdoing.
Particularly close to the idea of changing the quality of the response so that the next response can be different.
The biblical framework grounds this transformation in relationship with God, sin, grace and moral responsibility.
Quranic wisdom
Human conflict can be transformed through patience, goodness and reconciliation. Qur’an 41:34 explicitly describes responding to evil with what is better, such that enmity may become friendship; 49:10 calls believers to make peace between disputing brothers. (Quran.com)
Respond to wrongdoing with what is better; reconcile and restore peace.
Perhaps one of the clearest parallels: a different response can change the relationship itself.
The framework is explicitly theological and ethical, grounded in obedience to Allah rather than systems theory.
What the comparison reveals
The similarities are therefore not trivial. Across traditions, we repeatedly encounter the recognition that what we repeatedly do to one another becomes part of what happens next; that responding to harm with more harm can perpetuate the condition; that patience, restraint, compassion, forgiveness, discipline or reconciliation can alter the trajectory; and that transformation often requires more than eliminating the immediate event.
But there is also an important distinction. Cultural wisdom generally tells us how to live; systems thinking gives us a way to see the structure through which those behaviours produce consequences. The former may provide the wisdom for the action; the latter can help us understand why the action may have systemic consequences.
That distinction becomes particularly interesting when we turn to Ubuntu.
Part II — Ubuntu: From “I Am Because We Are” to a Healing Structure
Ubuntu is often expressed through the phrase umuntu ngumuntu ngabantu — “a person is a person through other persons.” Contemporary scholarship treats Ubuntu not simply as a slogan about kindness, but as a relational conception of personhood: who we become is constituted through our relationships with others, and communal life is therefore fundamental to human flourishing. (IUScholarWorks)
That immediately creates an interesting point of contact with Healing the Poison.
The uncle did not regard the mother-in-law and daughter-in-law as two isolated individuals, each carrying an independent problem. He saw a relationship in which each person’s behaviour was becoming part of the conditions shaping the behaviour of the other. Ubuntu begins from a different philosophical position, but it reaches toward a similar relational insight: the person cannot be fully understood apart from the relationships through which that person lives and becomes.
Ubuntu Does Not Ask Only, “Who Is Wrong?”
Consider the difference this makes.
If the mother-in-law is declared to be the problem, then the obvious intervention is to change the mother-in-law.
If the daughter-in-law is declared to be the problem, then the obvious intervention is to change the daughter-in-law.
If both are declared to be the problem, we may call a meeting, establish rules, appoint an arbitrator or separate them.
All of these approaches can be useful in particular circumstances. But they remain largely focused on the participants and their behaviour.
Ubuntu shifts the moral gaze towards the relationship. The question becomes not only “What has this person done?” but “What is happening between us, and what kind of people are we becoming through this relationship?”
That is much closer to the uncle’s intervention.
Ubuntu and the Reinforcing Nature of Relationship
Here is where the comparison becomes particularly powerful.
If I treat you with dignity, your response to me may become more trusting.
If you trust me, I may become more willing to listen.
If I listen, you may feel understood.
If you feel understood, you may become more willing to understand me.
Each response becomes part of the condition for the next response.
This is precisely where Ubuntu can be read through a systems-thinking lens without claiming that Ubuntu itself is systems thinking.
The relationship can reinforce humaneness, just as it can reinforce hostility.
Respect can make respect easier.
Trust can make trust easier.
Generosity can make generosity easier.
Humiliation can produce defensiveness.
Defensiveness can produce aggression.
Aggression can produce retaliation.
Retaliation can provide further evidence that the other person cannot be trusted.
The structure is still reinforcing.
What changes is what the reinforcement is producing.
That is remarkably close to the insight contained in Healing the Poison.
Where Ubuntu and the Uncle’s Intervention Meet
The uncle’s intervention can therefore be read as having several points of resonance with Ubuntu.
First, he did not isolate the person from the relationship. The relationship was where the problem lived, and therefore the relationship was also where the possibility of healing existed.
Second, he did not begin with punishment. His intervention did not humiliate the mother-in-law or condemn Li-Li. This resonates with a relational ethic in which restoring humanity is more important than establishing the superiority of one individual over another.
Third, he worked through relationship. Li-Li changed her behaviour, but the objective was not simply to make Li-Li a “better person”. Her changed behaviour altered the interaction, which altered the mother-in-law’s response, which altered Li-Li’s experience again.
Fourth, the change became reciprocal. This is critical. The uncle did not permanently manage the relationship. Once the interaction began producing different responses, those responses began reinforcing one another.
That is the point at which Ubuntu and reinforcing structures meet most powerfully: human relationships can become self-strengthening.
But Ubuntu Is Not the Healing Poison
The distinction is equally important.
Ubuntu does not give us a systems archetype diagram. It does not tell us to draw a reinforcing loop, identify a polarity, locate a delay or search systematically for leverage.
Nor should we force it into those categories.
Ubuntu begins from a much deeper proposition: human being itself is relational. The person is not fully understood as an isolated unit who subsequently enters relationships. Relationship is constitutive of personhood. (IUScholarWorks)
Systems thinking begins somewhere different. It asks us to see patterns of interaction, feedback, causality and structure.
The two therefore illuminate different aspects of the same human reality.
Ubuntu can tell us:
You are a person through other persons.
Systems thinking can ask:
What happens to the relationship when the way you treat one another becomes mutually reinforcing?
And Healing the Poison adds another question:
Can we change what the relationship reinforces without destroying the relationship itself?
The Most Interesting Convergence
This may be where the comparison becomes genuinely useful for STRLDi.
Ubuntu does not merely tell us to be nice to one another. At its deeper level, it suggests that my humanity and yours are not independent variables. What happens between us contributes to what each of us becomes.
The uncle’s intervention makes that dynamic visible.
Li-Li changes.
The mother-in-law responds differently.
Li-Li experiences the different response.
Her capacity to continue behaving differently increases.
The mother-in-law experiences the new relationship.
Her own response changes further.
The relationship begins teaching both participants how to behave differently within it.
That is a reinforcing structure.
But it is now reinforcing Ubuntu-like qualities of relationship rather than hostility.
The Distinction STRLDi Can Add
This is where I think the comparison becomes more than an exercise in finding similarities.
Cultural wisdom may have known for centuries that how we treat one another changes what happens between us. Ubuntu gives that insight a profound philosophical foundation: I am because we are. The Bible and Quran similarly contain powerful teachings about refusing to return evil for evil, pursuing peace, reconciliation and responding to wrongdoing with goodness. (Bible Gateway)
Systems thinking gives us another language for examining how those behaviours accumulate.
It allows us to ask: What happens when this response becomes the cause of the next response? What happens when that pattern repeats? When does it become self-reinforcing? What does it reinforce? And where could one intervene so that the structure begins strengthening something different?
That is not replacing Ubuntu with systems thinking.
It is seeing more deeply into what Ubuntu may already have been telling us.
And perhaps this is the more interesting question for cultural wisdom generally:
Did systems thinking discover these patterns—or did human beings learn to live with them long before we learned to draw them?
The contribution of systems thinking may not be to claim ownership of the wisdom.
The question before marriage is not simply, ‘Whom shall I marry?’ It is, ‘What kind of family are we about to create, and what kind of community will that family become for generations yet to come?
From National Systems Research to the First Human Community
What Kind of Family Are You About to Create?
Questions for Individuals, Couples and Families Before Marriage
Contents
Introduction
Family Formation: The First Human Community
Why the family is society’s first institution
Why marriage is more than a personal decision
The purpose of this framework
Part I – Questions for the Individual
1. The Man Who Has Not Yet Healed from a Previous Relationship
Questions about Healing
Questions about Readiness
Questions about Commitment
Questions about the Family He Hopes to Create
2. The Woman Without Children Who Has Not Yet Healed from a Previous Relationship
Questions about Healing
Questions about Readiness
Questions about Commitment
Questions about the Family She Hopes to Create
3. The Woman Who Has a Child and Has Not Yet Healed from Her Previous Relationship
Questions about Healing
Questions about Her Child
Questions about the Man She Is Considering
Questions about the Child’s Father
Questions about Building a New Family
Questions about Stewardship
4. The Man Who Has a Child and Is Entering a Relationship with a Woman Who Has No Children
Questions about Healing
Questions about His Child
Questions about the Woman He Is Considering
Questions about the Child’s Mother
Questions about Building One Family
Questions about Stewardship
5. The Woman with a Child Entering a Relationship with a Man Who Does Not Have a Child
Questions about Healing
Questions about Her Child
Questions about the Man She Is Considering
Questions about the Child’s Father
Questions about Building a New Family
Questions about Extended Families
Questions about Stewardship
6. The Man Without Children Entering a Relationship with a Woman Who Has a Child
Questions about Readiness
Questions about the Child
Questions about the Child’s Father
Questions about the Woman He Is Considering
Questions about Building One Family
Questions about Extended Families
Questions about Stewardship
Part II – Questions for the Couple
7. Questions Every Couple Should Ask Together
Questions about Shared Values
Questions about Trust
Questions about Communication
Questions about Conflict
Questions about Commitment
Questions about Finances
Questions about Careers and Life Direction
Questions about Children and Parenting
Questions about Extended Families
Questions about Building an Enduring Marriage
Part III – Questions for Parents
8. Parents Who Have Enjoyed an Intact Marriage
Questions about Their Own Motives
Questions about Listening
Questions about the Person Their Child Loves
Questions about Family Formation
Questions about Supporting Rather than Controlling
Questions about Becoming In-Laws
Questions about Stewardship
Part IV – Questions for Every Family
9. Questions Every Family Should Ask
Questions about Character
Questions about Commitment
Questions about Family Formation
Questions about Relationships
Questions about Future Generations
The Question Above Every Other Question
Part V – From Family Formation to Nation Formation
10. The Narratives We Choose to Hold Dear
Everyday Narratives that Shape Society
From Individual Decisions to Social Patterns
The Questions that Change What We Value
Family Stewardship and Intergenerational Responsibility
Narratives that Strengthen Human Capability
From Household Choices to National Outcomes
Part VI – A Gift to Families
11. From Understanding Persistent Unemployment to Strengthening the First Human Community
A Different Understanding of Persistent Unemployment
The Family as Society’s First Institution
Interrupting Reinforcing Cycles
A Contribution to Human Formation
Our Gift
Recommended Reading
A Learning Journey in Family Formation
Understanding Yourself Before Marriage
Preparing for Marriage Together
Love, Communication and Relationships
Blended Families
Parents and Adult Children
Understanding Families as Systems
Systems Thinking and Human Formation
Closing Reflection
Building Families that Build Nations
Family formation as the foundation of human formation.
Human formation as the foundation of productive capability.
Productive capability as the foundation of national prosperity.
The family as society’s first and most enduring human community
Introduction
Family Formation: The First Human Community
Every human being belongs to a family. Whether that experience has been joyful or painful, stable or uncertain, the family is the first community into which we are born and the first place where we learn what it means to trust, to belong, to resolve conflict, to accept responsibility and to care for others. Long before we encounter schools, workplaces, governments or markets, we experience life through the relationships that exist within our families.
For this reason, the formation of a family is not merely a private decision between two adults. It is the creation of a new human community. The decisions made before marriage shape not only the lives of the couple but also the environment within which children may one day grow, grandparents may find new relationships, siblings may gain new family members, and future generations may develop their understanding of love, commitment, security and belonging.
Yet surprisingly little attention is given to the questions that precede this transition. Couples often ask whether they love one another, whether they are compatible, or whether they will be happy together. These are important questions. They are not, however, the only questions. Before creating a family, individuals and those who care about them have a responsibility to think beyond the wedding day and consider the kind of community they are about to establish.
The purpose of this paper is therefore not to tell people whom they should marry, nor to suggest that every family begins under identical circumstances. Rather, it seeks to present a framework of questions that may help individuals, couples and parents reflect carefully before making one of life’s most consequential decisions. Different life circumstances call for different questions. Some people enter marriage after healing from previous relationships, while others bring children, extended family responsibilities or other complexities into the relationship. The purpose of these questions is not to judge those circumstances but to ensure that they are thoughtfully understood before commitments are made.
Every family begins long before a wedding ceremony. It begins in the lives of the individuals who choose to form it. Each person brings into a relationship experiences, values, expectations, wounds, hopes, and responsibilities that inevitably shape the family they are about to create. Before two people can intentionally build a healthy family together, each must first understand the foundations they themselves are bringing into that new community.
For this reason, the questions that follow begin not with the couple, but with the individual. They are not intended to judge anyone’s past or prescribe a particular life journey. Rather, they invite thoughtful reflection towards oneself on whether the foundations being brought into marriage are capable of supporting the kind of family one hopes to build. Every family begins somewhere. These questions encourage us to begin with ourselves.
Part I – Questions for the Individual
The Man Who Has Not Yet Healed from a Previous Relationship
Every relationship leaves behind memories, lessons and, sometimes, wounds. Beginning a new relationship before understanding what remains unresolved from the previous one can unintentionally place new expectations upon a person who did not create those experiences. Before asking whether another person is the right life partner, a man should first consider whether he has become emotionally available to build a new family on its own foundations.
Questions about Healing
Have I fully accepted that my previous relationship has ended?
What emotions still influence my thinking?
Have I forgiven the other person?
Have I forgiven myself?
What lessons have I learned that will help me become a better husband?
What fears from that relationship still influence me today?
If I met my former partner tomorrow, what emotions would still remain unresolved?
Questions about Readiness
Am I seeking companionship, or am I seeking relief from loneliness?
Am I choosing this woman because of who she is, or because she helps me forget someone else?
If this relationship did not continue, would I still know who I am?
Am I emotionally ready to make promises that I intend to keep for life?
Questions about the Family I Hope to Create
What kind of family do I hope to build?
What kind of husband do I hope to become?
What kind of father do I hope my children will one day describe?
What values do I hope will define our home?
What atmosphere do I hope people experience when they enter our family?
The Woman Without Children Who Has Not Yet Healed from a Previous Relationship
The end of a relationship does not necessarily mark the end of its influence. A relationship may end physically while continuing emotionally through disappointment, mistrust, fear or regret. Time alone does not heal these experiences. Healing occurs when a person has reflected on what has happened, accepted what cannot be changed, learned from it and become emotionally available to begin again without asking a new relationship to repair the wounds of the last one.
Marriage invites two people to build a future together. That future is strongest when it is not overshadowed by unresolved questions from the past. Before deciding whether a man is the right life partner, a woman should first consider whether she is free to build a family upon new foundations rather than carrying forward expectations shaped by previous disappointments.
Questions about Healing
Have I fully accepted that my previous relationship has ended?
What emotions from that relationship remain unresolved?
Have I forgiven the other person?
Have I forgiven myself for decisions I now regret?
What fears continue to influence the way I think about relationships?
Can I speak about my previous relationship without anger, bitterness or the desire to prove something?
What have I learned about myself through that experience?
What strengths have emerged because of what I have been through?
Questions about Readiness
Am I seeking a husband, or am I seeking someone to restore what I feel I have lost?
Do I know who I am independently of being in a relationship?
If this relationship did not continue, would I still feel emotionally secure?
Am I choosing this man because I genuinely respect him, or because I am afraid of being alone?
Am I emotionally available to commit myself to another person?
Have I become the kind of woman I hope to bring into a lifelong marriage?
Questions about Commitment
What qualities do I most admire in this man?
What concerns have we openly discussed rather than avoided?
Have we spoken honestly about our expectations of marriage?
How do we each respond when we disagree?
Do I trust his character, or do I simply enjoy his company?
Would I still choose this relationship if life became significantly more difficult?
Questions about the Family I Hope to Create
What kind of family do I hope to build?
What kind of wife do I hope to become?
What values do I hope will shape our home?
What atmosphere do I hope our children will experience every day?
How do I hope our family will relate to grandparents, siblings and the wider community?
What kind of legacy do I hope our family will leave for the next generation?
Questions about Stewardship
Marriage is not only about finding someone to love. It is about accepting responsibility for the wellbeing of another person and for the family that may one day emerge from that relationship.
Am I prepared to place the wellbeing of our future family alongside my own aspirations?
What sacrifices am I prepared to make for the family we hope to build?
How will I contribute to creating trust, stability and peace within our home?
When our children one day observe our relationship, what do I hope they will learn about love, commitment and respect?
If my future daughter asked me why I chose her father, what answer would I hope to give?
These questions are not intended to create doubt where confidence already exists. Rather, they invite a woman to reflect upon the kind of family she is preparing to build and the person she is becoming in the process. The quality of a future marriage depends not only upon finding the right partner, but also upon becoming someone capable of building a home where trust, belonging and enduring commitment can flourish.
The Woman Who Has a Child and Has Not Yet Healed from Her Previous Relationship
When a woman enters a new relationship with a child, she is not making decisions for herself alone. Her child is already part of an existing family system, with relationships, experiences and emotional needs that deserve careful consideration. A new relationship therefore has implications that extend beyond the couple. It affects the child, the prospective husband, both extended families and, in many cases, the child’s biological father.
This does not make the formation of a new family impossible. It does, however, make it more complex. The question is not whether a woman who has a child should marry again. The question is whether everyone involved has taken sufficient time to understand the responsibilities that accompany the creation of a new family. The child’s wellbeing deserves to be considered alongside the hopes and aspirations of the adults.
Questions about Healing
Have I fully accepted that my previous relationship has ended?
What emotions from that relationship still influence my decisions today?
Have I forgiven the father of my child?
Have I forgiven myself for decisions that I now wish had been different?
What fears do I carry into this new relationship?
Am I looking for a husband, or am I hoping someone will solve problems that remain unresolved?
Have I become emotionally available to build a new family?
Questions about My Child
What does my child need most at this stage of life?
How has my previous relationship affected my child?
Have I taken time to understand how my child feels about the changes taking place?
Is my child emotionally ready to meet someone who may become part of our family?
Am I protecting my child’s need for stability while I make decisions about my own future?
If this relationship were not to continue, how would that affect my child?
Questions about the Man I Am Considering
Does he understand that he is entering an existing family system?
Has he shown genuine care and patience towards my child?
Does he understand that my responsibilities as a mother will always remain part of our marriage?
Have we discussed what role he hopes to play in my child’s life?
Is he prepared for the responsibilities that accompany becoming a husband and, potentially, a father figure?
Does he appreciate that earning a child’s trust takes time and cannot be demanded?
Questions about the Child’s Father
These questions are not intended to reopen past conflicts. They are intended to recognise that another parent may continue to influence the life of the child.
What relationship currently exists between my child and his or her father?
What responsibilities does the child’s father continue to fulfil?
Have I been honest with my prospective husband about that relationship?
What boundaries are necessary to protect peace within the new family?
How will important decisions concerning the child be made?
Have we discussed these matters openly before marriage rather than assuming they will resolve themselves afterwards?
Questions about Family Formation
What kind of family are we hoping to create together?
How will my child experience belonging within this new family?
If we later have children together, how will every child experience equal love, fairness and security?
What traditions do we hope to establish as a new family?
How will we build trust between all members of the household?
What values will define the culture of our home?
What conversations should occur now rather than after marriage?
Questions about Stewardship
The formation of a family is an act of stewardship. It requires adults to think beyond their immediate desires and consider the long-term wellbeing of everyone whose lives will be shaped by their decisions.
Am I making decisions that increase my child’s sense of safety and belonging?
Am I giving this relationship sufficient time to develop naturally?
Have I introduced this man into my child’s life gradually and thoughtfully?
Are we building a family on carefully considered commitments, or are we allowing circumstances to determine our future?
Twenty years from now, what do I hope my child will say about the way this family was formed?
These questions are not intended to discourage the formation of blended families. Rather, they recognise that a child already present within the relationship changes the structure of the family from its very beginning. Thoughtful preparation cannot eliminate every challenge, but it can help create a family in which trust, stability and belonging are intentionally nurtured for every member.
The Man Without Children Entering a Relationship with a Woman Who Has a Child
When a man without children enters a relationship with a woman who already has a child, he is making a decision that extends beyond choosing a life partner. He is also deciding whether he is prepared to become part of an existing family. Unlike two people who begin building a family together from the outset, he is entering a family system that already has relationships, routines, memories, responsibilities and emotional bonds. This does not diminish the possibility of building a loving and successful family, but it does require him to understand that he is not simply beginning something new; he is also joining something that already exists.
The quality of the future family will depend not only upon the relationship between the man and the woman but also upon the way in which the child experiences safety, belonging and acceptance. These questions are therefore intended to help a man consider not only whether he loves the woman, but also whether he is prepared for the responsibilities that accompany the family she already brings into the relationship.
Questions about Readiness
Why am I choosing this relationship?
What attracts me most to this woman?
Have I taken sufficient time to understand her life before I become part of it?
Am I emotionally prepared to become a husband and, potentially, a father figure at the same time?
Am I entering this relationship with realistic expectations?
Have I considered the responsibilities that already exist rather than only the future I hope to build?
Questions about the Child
A child is not an addition to the relationship. The child is already an integral member of the family the couple hopes to build.
Am I willing to accept this child as part of the family I hope to create?
What role do I hope to play in this child’s life?
Do I understand that trust cannot be demanded but must be earned?
Am I prepared to invest time, patience and consistency in building that relationship?
How will I respond if the child initially struggles to accept me?
What kind of relationship would I hope this child describes twenty years from now?
Questions about the Child’s Father
The presence of another biological parent introduces relationships that deserve thoughtful consideration rather than avoidance.
What role does the child’s father currently play?
How involved is he in the child’s life?
What responsibilities continue to exist between him and the child?
Have we discussed these matters openly and honestly?
What boundaries will help maintain peace and clarity for everyone involved?
How will disagreements affecting the child be handled?
Questions about the Woman I Am Considering
Have we discussed our expectations of marriage honestly?
Does she understand my hopes and concerns?
Have we spoken openly about parenting?
What values do we hope will shape our family?
How do we resolve disagreement?
What qualities in her give me confidence that we can build a stable family together?
Have we allowed enough time to know one another beyond the excitement of a new relationship?
Questions about Building One Family
One of the greatest responsibilities facing any blended family is not simply living together but becoming one family.
How will we create a sense of belonging for every member of the household?
If we later have children together, how will every child experience equal love, dignity and opportunity?
What family traditions shall we establish together?
How will we make important decisions as parents?
How will we ensure that our home becomes a place of stability rather than uncertainty?
What kind of family culture do we hope future generations will inherit from us?
Questions about Extended Families
Marriage joins more than two individuals. It joins parents, grandparents, siblings and extended families into new relationships.
How will my parents receive this woman and her child?
How will her parents receive me?
Have we discussed the role we hope our extended families will play in our lives?
What expectations should be clarified before marriage?
How can we encourage relationships that strengthen rather than divide our new family?
Questions about Stewardship
The decision to marry is ultimately a decision about stewardship. It is a commitment to care for the wellbeing of others over a lifetime.
Am I prepared to love not only this woman but also the life that comes with her?
Am I willing to place the long-term wellbeing of this family above my own convenience?
Are we making decisions because they are carefully considered, or because circumstances are pushing us forward?
If my future children asked me why I chose their mother, what answer would I hope to give?
If her child asked me, years from now, “When did you decide I was your family?” what answer would I want to be able to give?
The answers to these questions do not determine whether a marriage will succeed. They do, however, encourage a man to recognise that marriage is not simply about finding a life partner. It is about intentionally creating a family in which every person—adult and child alike—can experience trust, belonging, security and the opportunity to flourish.
The Woman with a Child Entering a Relationship with a Man Who Does Not Have a Child
When a woman who has a child enters a relationship with a man who has never had children, she is making a decision that reaches beyond her own future. She is not only considering whether this man may become her husband, but also whether he is prepared to become part of a family that already exists. Her child is not an extension of the relationship; the child is already a person with emotional needs, established relationships, memories and a developing sense of identity. Any new relationship must therefore be considered from the perspective of both the adults and the child.
This requires honesty, patience and maturity from everyone involved. The man deserves the opportunity to understand the responsibilities he is accepting before making a lifelong commitment. Equally, the child deserves the opportunity to experience trust gradually rather than being expected to accept a new parental figure simply because the adults have decided to marry. The woman therefore carries a dual responsibility: to nurture a healthy relationship with the man she hopes to marry while also protecting the emotional wellbeing of her child.
These questions are intended to encourage thoughtful reflection before decisions are made that will shape the lives of everyone who becomes part of the new family.
Questions about Healing
Have I fully accepted that my previous relationship has ended?
Have I forgiven my former partner?
Have I forgiven myself?
Am I entering this relationship because I am ready to build a new family, or because I am trying to recover from the last one?
What lessons have I learned that will help me become a better wife and mother?
What fears or disappointments from my previous relationship still influence my thinking today?
Am I emotionally available to make a lifelong commitment?
Questions about My Child
My child is not simply part of my history. My child is part of my future.
What does my child need most from me at this stage of life?
How has my child experienced the absence of his or her biological father?
Is my child emotionally ready for someone new to become part of our lives?
Am I protecting my child’s need for stability while this relationship develops?
Have I introduced this man into my child’s life gradually and thoughtfully?
Am I allowing my child sufficient time to develop trust naturally?
If this relationship did not continue, how would that affect my child?
Questions about the Man I Am Considering
A man without children may not yet fully understand the responsibilities that accompany becoming part of an existing family. Those responsibilities deserve to be discussed openly rather than assumed.
Does he understand that he is entering an existing family rather than beginning one from the beginning?
Have I been honest with him about my responsibilities as a mother?
Has he demonstrated patience, kindness and consistency towards my child?
Does he understand that trust from a child cannot be demanded but must be earned?
Has he asked thoughtful questions about my child rather than seeing my child as an obstacle to our relationship?
Does he appear ready for the long-term responsibilities of becoming both a husband and a father figure?
Questions about the Child’s Father
The presence of another biological parent is part of the family’s reality. It should neither be ignored nor allowed to create unnecessary uncertainty.
What relationship currently exists between my child and his or her father?
What responsibilities does the father continue to fulfil?
Have I spoken honestly with this man about those responsibilities?
What boundaries will protect the peace and stability of our future family?
How will decisions affecting the child be made?
Have we discussed these matters before making lifelong commitments?
Questions about Building a New Family
Marriage is not simply the joining of two adults. It is the creation of a family in which every member should experience belonging.
What kind of family are we hoping to create?
How will my child know that he or she truly belongs?
How will we build trust between all members of the household?
If we are later blessed with children together, how will we ensure that every child experiences equal love, fairness and dignity?
What values will define the culture of our home?
What family traditions do we hope to establish together?
What conversations should take place now rather than after marriage?
Questions about Extended Families
Marriage joins families as well as individuals. Grandparents, siblings and relatives all become part of the new family system.
How will my parents receive this man?
How will his parents receive both me and my child?
Have we discussed the role we hope our extended families will play in our lives?
Are there expectations that should be clarified before marriage?
How can we encourage relationships that strengthen rather than divide our new family?
Questions about Stewardship
Creating a family is an act of stewardship. It calls adults to think beyond immediate happiness and to consider the lives that will be shaped by the decisions they make today.
Am I making decisions that strengthen my child’s future?
Have I given this relationship sufficient time to mature?
Are we moving towards marriage because we have thoughtfully discerned our future together, or because circumstances are moving us in that direction?
Am I helping this man understand the responsibilities he is accepting, rather than assuming he will learn them after marriage?
Twenty years from now, what do I hope my child will say about the way this family was formed?
If my child one day chooses a life partner, what example do I hope this family will have provided?
No set of questions can remove every uncertainty that accompanies marriage. They can, however, help ensure that decisions are made with greater clarity, honesty and foresight. A woman entering marriage with a child is not simply beginning a new chapter in her own life. She is shaping the future of her child, inviting another person into an existing family, and laying the foundations upon which a new human community may grow. The more intentionally those foundations are established, the greater the opportunity for every member of that family to experience trust, belonging, stability and hope.
Part II – Questions for the Couple
Questions Every Couple Should Ask Together
Choosing to marry is one of the most significant decisions two people will ever make. Yet, in many societies, much of the attention surrounding marriage is devoted to the wedding itself—the ceremony, the celebrations, the guests and the beginning of life together. Comparatively little time is spent asking a more fundamental question: What kind of family are we about to create?
Marriage is more than the union of two individuals. It is the intentional formation of the first human community that the couple will build together. Within that community, values will be practised, responsibilities shared, children nurtured, traditions established and relationships extended across generations. The quality of that community will influence not only the lives of the couple themselves, but also the lives of everyone who comes after them.
For this reason, the most important conversations before marriage are seldom about the wedding. They are about the family that will exist long after the wedding has been forgotten. Couples who invest time in these conversations are not attempting to predict every challenge they may encounter. Rather, they are learning how to think together, how to discern together, and how to build together.
The questions that follow are not intended to determine whether two people should marry. They are intended to help couples see beyond immediate affection and ask whether they are intentionally preparing to establish a family capable of remaining whole, nurturing future generations and contributing positively to the communities and nation of which it will become a part.
Questions about Shared Purpose
Every enduring family begins with a shared understanding of why it exists.
Why do we want to marry?
Beyond loving one another, what purpose do we hope our family will serve?
What kind of home do we hope to create?
What values do we want people to experience when they enter our home?
What do we hope our children and grandchildren will one day say about our family?
Are we building a marriage for ourselves alone, or are we intentionally creating a family that will bless others?
Questions about Character
Strong marriages are built upon character before they are sustained by compatibility.
What qualities do we most admire in one another?
What weaknesses do we each acknowledge?
How do we help one another become better people?
Are we able to challenge one another with honesty and kindness?
What habits should we strengthen before we marry?
What habits should we leave behind?
Questions about Trust
Trust is not established on the wedding day. It is built through consistent choices long before marriage begins.
Can we speak honestly without fear?
Do we trust one another with disappointment as much as with success?
How do we rebuild trust when it is damaged?
What promises do we believe are sacred?
How will we protect trust throughout our marriage?
Questions about Communication and Conflict
Every marriage will experience disagreement. The question is not whether conflict will arise, but how it will be approached.
How do we communicate when we disagree?
Do we listen to understand or merely to respond?
How do we apologise?
How do we forgive?
What subjects are difficult for us to discuss?
How will we make important decisions together?
Questions about Previous Relationships
Every relationship has a history. Wisdom asks whether that history has been understood before a new future is built.
Have we each found peace with our previous relationships?
Are there responsibilities from previous relationships that remain?
Have we been honest with one another about those responsibilities?
Are there conversations that should take place before we marry?
Have we mistaken the passage of time for genuine healing?
Questions about Children and Family Formation
Marriage creates a family. Where children already exist, it enlarges a family that has already begun.
What responsibilities do we already carry?
How will every child experience love, security and belonging?
How will we speak about one another in front of our children?
What traditions do we hope to establish as a family?
How will we build trust patiently rather than expecting it immediately?
What does fairness look like within our family?
Questions about Stewardship
Every family becomes the steward of relationships entrusted to it.
What responsibilities accompany becoming a husband or wife?
What responsibilities accompany becoming a parent or parent figure?
How will we care for relationships that already exist?
What sacrifices will family life require of us?
What does faithfulness look like over the next thirty or forty years?
Questions about Work, Capability and Contribution
Families do not merely consume resources. They also develop the capabilities through which society flourishes.
What attitudes towards work do we hope will characterise our family?
How will we encourage curiosity, learning and discipline?
How will we nurture the talents entrusted to our children?
How will we encourage productive capability rather than dependence?
What example will our own work and service provide?
In what ways do we hope our family will contribute to our community and nation?
Questions about Extended Families
Marriage joins families as well as individuals.
How will we honour our parents while establishing our own family?
What relationships should be strengthened before marriage?
How will we welcome one another’s families into our lives?
What boundaries will help preserve healthy relationships?
How will we resolve tensions should they arise?
Questions about the Future
Every family begins with hope. Stewardship requires that hope to be accompanied by thoughtful preparation.
What kind of family do we hope to become twenty years from now?
What kind of grandparents do we hope one day to be?
What legacy do we hope our family will leave?
What values should survive long after we are gone?
What kind of society do we hope our family will help build?
The Conversation Above Every Other Conversation
As our understanding of family deepens, so too do the conversations we find worth having. We begin to recognise that marriage is not simply about choosing a life partner. It is about choosing the kind of human community we hope to create together. The questions become less concerned with the wedding day and more concerned with the generations that may one day emerge from the family we are forming.
The more we appreciate the interrelationships between family formation and nation formation, the more certain conversations naturally become important. We begin to ask not only whether we love one another, but whether we are preparing to build a relationship that is itself capable of remaining whole. We ask whether responsibilities from previous relationships have been understood and honoured, how children will experience continuity and belonging, how trust will be built with extended families, and whether important relationships should be nurtured before marriage rather than afterwards.
These questions are not intended to prescribe a single model of family life. Rather, they invite couples to recognise that the everyday narratives they choose to live by gradually become the foundations upon which families, communities and ultimately nations are built.
Ultimately, every couple preparing for marriage faces one question that stands above all the rest:
What kind of family are we intentionally choosing to create?
The answer to that question will shape far more than their own lives. It will influence the children they raise, the relationships they cultivate, the values they pass on, the capabilities they nurture and the communities they help to build. In this sense, every marriage is not only a personal commitment. It is an act of stewardship towards future generations, and a quiet but enduring contribution to the formation of society itself.
Part III – Questions for Parents
Parents Who Have Enjoyed an Intact Marriage
Parents who have built an enduring marriage often face one of the most delicate transitions of family life when their children become adults. For many years they have protected, guided and made decisions in the best interests of their children. Gradually, however, that responsibility changes. Adult sons and daughters must make their own decisions, including one of the most significant decisions of all—the choice of a life partner.
This transition requires wisdom from both generations. Parents who continue to control their adult children may weaken the very maturity they have worked hard to develop. Equally, parents who withdraw completely from the conversation may withhold the benefit of experience that could help their children avoid unnecessary pain. The challenge is neither to control nor to remain silent, but to offer wisdom in a way that preserves the dignity and responsibility of the adult child.
Parents who have themselves enjoyed an intact marriage possess something of great value. They have lived through the ordinary demands of building a family over many years. They understand that successful marriages are not sustained by emotion alone but by commitment, sacrifice, forgiveness, patience and shared purpose. Their experience does not make them infallible, but it does place upon them a responsibility to help their children think carefully about the families they hope to create.
The questions below are intended not only for parents to ask their children but also for parents to ask themselves. Discernment requires humility from every generation.
Questions about Our Own Motives
Why do we have concerns about this relationship?
Are our concerns based upon enduring principles or personal preferences?
Are we reacting to circumstances, or have we taken time to understand them?
Are we protecting our son or daughter, or are we protecting our own expectations?
Have we distinguished between what is unfamiliar and what is genuinely unwise?
Have we allowed fear to speak more loudly than understanding?
Questions about Listening
Before parents offer advice, they should first understand.
Have we listened carefully to our son or daughter without interruption?
Have we sought to understand before seeking to persuade?
Have we asked questions rather than reached conclusions?
Do we understand what our child sees in this relationship?
Have we invited honest conversation without creating fear or defensiveness?
Have we made it safe for our child to tell us the whole story?
Questions about the Person Our Child Loves
Every person deserves to be known as an individual before being defined by their circumstances.
Have we taken time to know this person beyond first impressions?
What strengths do we see in him or her?
What qualities would make this person a good husband, wife, father or mother?
Have we allowed one aspect of their life to overshadow the whole person?
What evidence have we seen of maturity, responsibility and integrity?
Have we been fair in our assessment?
Questions about Family Formation
Parents who have enjoyed an intact marriage understand that marriage creates far more than a couple.
What kind of family do we believe our child hopes to build?
Have we helped our child think beyond the wedding day?
Have we discussed the responsibilities of marriage rather than only the happiness it may bring?
Have we encouraged our child to think about future children, extended families and long-term commitments?
Have we asked questions that enlarge perspective rather than narrow it?
Questions about Supporting Rather Than Controlling
The purpose of parental wisdom is not to make the decision on behalf of an adult child but to help that child make a well-considered decision.
Are we offering wisdom or demanding agreement?
If our child ultimately makes a different decision from the one we would make, how will we respond?
Have we respected our child’s responsibility to choose?
Have we created space for thoughtful reflection rather than emotional pressure?
What questions might help our child see what we have learned through experience?
Have we remembered that our role is to prepare our children for independent adulthood, not perpetual dependence?
Questions about Becoming In-Laws
Marriage creates new relationships for parents as well.
If this marriage takes place, what kind of parents-in-law do we hope to become?
How can we contribute to the strength of this new family rather than become another source of tension?
How can we welcome new family members with grace while remaining true to our principles?
What example do we hope to set for our grandchildren?
How can we encourage unity between both families?
What relationships do we hope will exist twenty years from now because of the way we respond today?
Questions about Stewardship
Ultimately, parents are stewards rather than owners of their children’s lives. Their task is not to determine every outcome but to pass on wisdom that equips the next generation to build strong families of their own.
Have we shared the lessons of our own marriage honestly, including the difficulties we have overcome?
Have we demonstrated the kind of marriage we hope our children will build?
Have we encouraged our child to seek wisdom from others as well?
Have we remembered that love sometimes asks difficult questions but always respects another person’s dignity?
When our grandchildren one day ask how this family was formed, what story do we hope they will hear?
Have we done everything within our responsibility to help our child think carefully, while allowing the final decision to remain theirs?
Parents cannot guarantee the future of their children’s marriages. They cannot choose a spouse on their behalf, nor should they attempt to do so. What they can offer is something no one else can provide: the wisdom that comes from years of building a family, the patience to ask questions that broaden understanding, and the reassurance that whatever decision is ultimately made, their love remains steadfast. Their influence is greatest not when they control the decision, but when they help their children become thoughtful stewards of the families they are about to create.
I would close the article with one final section that brings all the categories together. Otherwise, readers may leave thinking the paper is about different kinds of people rather than one common responsibility.
Part IV – Questions for Every Family
Questions Every Family Should Ask
Although every family begins under different circumstances, every family eventually faces the same responsibility: to become a place where its members experience trust, belonging, security, responsibility and hope. The circumstances under which a family begins may differ considerably, but the responsibility to intentionally build that family belongs to everyone.
The questions presented throughout this paper have therefore not been offered to separate people into different groups or to suggest that one family’s journey is more valuable than another’s. Rather, they recognise that different circumstances require different conversations. When those conversations are approached honestly and thoughtfully, they strengthen the foundations upon which healthy families are built.
Whatever our circumstances, every person contemplating marriage should be willing to pause and reflect upon a common set of questions.
Questions about Character
Am I becoming the kind of person I hope my future spouse deserves?
What qualities of character am I still developing?
What habits do I need to change before asking another person to share my life?
What do those closest to me say about my character?
Am I prepared to continue growing throughout my marriage?
Questions about Commitment
Do I understand that marriage is a lifelong commitment rather than simply a personal milestone?
Have I considered what commitment will require when life becomes difficult?
Am I prepared to place the wellbeing of my family alongside my own ambitions and aspirations?
What sacrifices am I willing to make for the family I hope to build?
Questions about Family Formation
What kind of family do I hope to create?
What values will shape our home?
What traditions do I hope future generations will inherit?
What atmosphere do I hope visitors will experience when they enter our home?
How will our family contribute to the wellbeing of our community?
Questions about Relationships
How will we resolve conflict when we disagree?
How will we make important decisions together?
How will we strengthen trust over time?
How will we protect our marriage from unnecessary pressures?
What role will our extended families play in our lives?
Questions about Future Generations
Every decision made today becomes part of someone else’s future.
What kind of childhood do I hope my children will experience?
What lessons do I hope they will learn by watching our marriage?
What stories do I hope they will tell about our family when they become adults?
What kind of grandparents do I hope we will one day become?
What legacy will remain after we are gone?
The Question Above Every Other Question
Every question in this paper ultimately leads to one that stands above all the rest.
What kind of family are we about to create?
Not simply what kind of wedding.
Not simply what kind of marriage.
But what kind of family.
Will it be a family in which trust grows, responsibilities are shared, forgiveness is practised, children experience security, grandparents are honoured, relationships are nurtured and future generations inherit a legacy of stability and hope?
No set of questions can guarantee that a marriage will succeed. Human relationships are too complex for that. Questions, however, can encourage thoughtful reflection before decisions become lifelong commitments. They can help individuals, couples and families recognise dimensions that may otherwise remain hidden until much later.
Perhaps wisdom is not measured by having all the right answers. Perhaps wisdom begins by asking the right questions before creating the family that future generations will one day call their own.
Part V – From Family Formation to Nation Formation
The Narratives We Choose to Hold Dear
Systems rarely change because people are told to behave differently. They change because people begin to see different relationships as important. As our attention shifts, so too do the questions we ask, the conversations we have, and ultimately the decisions we make. Over time, these decisions become the narratives through which societies reproduce themselves.
One of the unexpected insights emerging from STRLDi’s work is that the more we pay attention to the interrelationships between family formation and nation formation, the more certain narratives naturally become dear to us. We begin to value not only successful relationships, but relationships that contribute to the formation of healthy families, healthy communities and capable nations.
This change in perspective does not begin with rules. It begins with different questions. We become interested in whether relationships are being brought to a place of wholeness before new ones are formed. We become curious about how responsibilities are carried from one relationship into another. We become more attentive to how children experience transitions, how extended families are introduced into new relationships, and how trust is intentionally built rather than assumed.
The point is not to prescribe a single way of forming families. Rather, it is to recognise that every society carries narratives that quietly shape what people consider normal, responsible or desirable. Those narratives are rarely questioned because they are embedded in everyday practice.
Consider, for example, practices such as whether a prospective husband should meet the biological father of a child before marriage, or whether parents should get to know the person their son or daughter hopes to marry long before an engagement is announced. These examples are not presented as universal rules, nor are they offered as judgments. They are illustrations of a deeper question: What do our everyday practices reveal about the way we understand family, responsibility and stewardship?
As these conversations deepen, other narratives gradually emerge as worthy of greater attention.
A marriage creates a family, not merely a couple.
Every child deserves relationships that are intentionally built around trust, stability and belonging.
Responsibilities from previous relationships should be understood rather than ignored.
Families are strengthened when important relationships are formed deliberately rather than accidentally.
The quality of future communities begins with the quality of today’s family conversations.
Human capability is first formed within families before it is developed in schools, workplaces and institutions.
The strength of productive sectors ultimately depends upon the quality of the human capability that families help to nurture over generations.
Every generation becomes a steward of the human communities it passes to the next.
These narratives are not offered as conclusions but as invitations to think differently. They encourage us to move beyond asking whether a particular decision is right or wrong and instead ask a deeper systems question:
If this way of thinking were repeated across thousands of families for generations, what kind of society would it gradually create?
That question, perhaps more than any other, bridges the journey from family formation to nation formation. It reminds us that the future of a nation is shaped not only by the policies it adopts or the industries it builds, but also by the narratives its families quietly choose to live by.
Part VI – A Gift to Families
From Understanding Persistent Unemployment to Strengthening the First Human Community
This article is offered as a gift to individuals, couples, parents and families. It is the product of a much larger journey of inquiry that began not with marriage or family life, but with one of society’s most persistent and consequential challenges: unemployment.
For many years, STRLDi has sought to understand why unemployment persists across generations despite repeated economic reforms, investment programmes, labour market interventions and changes in public policy. Rather than examining unemployment as an isolated labour market phenomenon, the Institute adopted a systems perspective, exploring the interrelationships between economic structures, education, governance, demographics, communities and households. The objective was not simply to identify symptoms, but to understand the deeper structures that continually reproduce unemployment over time.
A Different Understanding of Persistent Unemployment
One of the most significant insights to emerge from this research is that persistent unemployment is not generated by the economy alone. It is the downstream expression of multiple reinforcing systems that interact continuously across generations. These systems include demographic dynamics, educational pathways, institutional capability, productive-sector development, household formation and family stability.
The study proposes that unemployment persists because these systems reinforce one another. Children are born into households that become the first environment of human formation. Those households influence educational development, aspirations, resilience, behaviour, values and the capacities that children eventually carry into schools, universities, workplaces and society. Over time, these influences shape the quantity, quality and distribution of human capability entering the national economy.
At the same time, the study observed that where the formation of intact families declines significantly over successive generations, the effects are no longer confined to individual households. They begin to influence the broader human capability available to society. As educational participation becomes increasingly concentrated away from the scientific, technical and productive disciplines upon which agriculture, manufacturing and other productive sectors depend, the nation’s capacity to generate employment grows more slowly than the rate at which new entrants join the labour force. The result is a reinforcing pattern in which unemployment continually reproduces itself across generations.
The Family as the First Human Community
These observations led to an important realisation. The family is not simply a private social institution. It is the first human community and one of the earliest environments in which a nation’s future productive capability is formed.
Within the family, children first learn trust, responsibility, discipline, cooperation, resilience, stewardship and service. These capacities do not remain within the household. They accompany individuals into classrooms, universities, workplaces, businesses, communities and public institutions. Every nation therefore inherits, in part, the cumulative outcomes of the families from which its citizens emerge.
Marriage is consequently much more than the union of two individuals. It is the intentional formation of a community that will shape the lives of future generations and, through them, contribute to the long-term capability of society itself.
Interrupting Reinforcing Cycles
Systems thinking teaches us that persistent outcomes are sustained by persistent structures. If unemployment is reproduced through reinforcing relationships across households, education, productive sectors and institutions, then meaningful national transformation requires more than economic reform alone. It also requires strengthening the human communities through which future generations are formed.
This article therefore seeks to intervene at one of the earliest points in that reinforcing structure. By encouraging thoughtful reflection before marriage, it aims to strengthen the quality of family formation before patterns of instability become embedded across generations. Every healthy family contributes to healthier communities. Healthier communities strengthen institutions. Stronger institutions enhance productive capability. Greater productive capability creates the conditions through which meaningful and sustained employment can grow.
In this way, the intentional formation of one family becomes part of the long-term formation of a nation.
A Contribution to Human Formation
This publication forms part of STRLDi’s broader programme on Human Formation. While the Institute’s work is often associated with national transformation, governance and economic development, these are ultimately expressions of deeper human systems. Institutions do not create themselves. Economies do not organise themselves. Communities do not sustain themselves. Each depends upon people whose character, judgement, resilience and capacity for cooperation were first shaped within families.
For this reason, the strengthening of families is not separate from national development. It is one of its earliest and most enduring foundations.
Our Gift
This article is therefore offered as a gift—not because it claims to provide all the answers, but because it invites deeper questions at one of life’s most important crossroads. It is our hope that individuals, couples, parents and families will pause before making lifelong commitments and ask not only whether they are ready for marriage, but also what kind of family they are about to create.
If these questions help even a small number of families build relationships characterised by trust, stability, responsibility, belonging and hope, they will have contributed to something far greater than successful marriages alone. They will have contributed to the formation of stronger communities, more capable institutions and nations better equipped to create opportunity for generations yet to come.
“Persistent unemployment is not merely an economic problem waiting for an economic solution. It is the downstream expression of interacting human systems whose earliest and most enduring foundation is the family.”
Recommended Reading
A Learning Journey in Family Formation
No single book can fully prepare an individual or a couple for the responsibilities of marriage and family life. Every author approaches the subject from a particular perspective—psychology, family systems, communication, faith, sociology, personal experience or leadership. Together, these works provide complementary insights that can help individuals, couples and families think more deeply about the kind of family they hope to create.
Readers are encouraged to engage with a range of perspectives. Some of the books presented here are grounded in decades of scientific research, others draw from therapeutic practice, while others reflect philosophical, cultural or faith-based traditions. Read together, they provide a rich foundation for understanding the formation of healthy families and communities.
Understanding Yourself Before Marriage
These books encourage personal reflection, emotional maturity and healing before entering lifelong commitments.
Boundaries
How We Love
The Developing Mind
King, Warrior, Magician, Lover
Wild at Heart
Fascinating Womanhood
Preparing for Marriage Together
These books explore communication, commitment, emotional connection and the practical realities of married life.
The Seven Principles for Making Marriage Work
Hold Me Tight
The Meaning of Marriage
Things I Wish I’d Known Before We Got Married
Before You Say ‘I Do’
Saving Your Marriage Before It Starts
Men Are from Mars, Women Are from Venus
Understanding Love, Communication and Relationships
Healthy marriages are sustained not only by commitment but also by the ability to understand one another, communicate effectively and resolve conflict constructively.
The Five Love Languages
Crucial Conversations
Nonviolent Communication
Difficult Conversations
Getting to Yes
Blended Families and Stepfamilies
For individuals entering marriages where one or both partners already have children, these works provide valuable guidance on the gradual formation of trust, belonging and family identity.
The Smart Stepfamily
Stepfamilies
Surviving and Thriving in Stepfamily Relationships
Parents and Adult Children
As children become adults, parents move from directing decisions to offering wisdom. These books explore that important transition.
Parenting Adult Children
Doing Life with Your Adult Children
Boundaries
Understanding Families as Systems
Families do not exist in isolation. They are dynamic systems in which every relationship influences every other relationship. These works provide deeper insight into the structure, dynamics and development of families across generations.
Families and Family Therapy
Family Therapy in Clinical Practice
Family Evaluation
Generation to Generation
The Ecology of Human Development
Systems Thinking and Human Formation
The family is the first and most enduring human community. Understanding families through the lens of systems thinking helps us appreciate how individual choices shape relationships, institutions and society across generations.
The Fifth Discipline
Thinking in Systems
The Social Animal
Concluding Reflection
The purpose of this reading list is not to prescribe a single philosophy of marriage or family life. Rather, it is to encourage thoughtful engagement with a range of perspectives that have shaped scholarship and practice in psychology, family systems, communication, leadership, personal development and human relationships. Each work contributes a different lens through which readers may better understand themselves, their relationships and the responsibilities that accompany the formation of a family.
The questions explored throughout this article invite reflection before marriage. These readings invite continued learning throughout life. Together they remind us that strong families are seldom the result of chance. They are built intentionally—through character, wisdom, mutual understanding, continual learning and the shared commitment to create a home in which every member can experience trust, belonging, responsibility and hope.
The Governance Practice Manual: Transforming Community Aspirations into Better Lives
A Systems Thinking Framework for Local Government and Democratic Stewardship
Author: Ms Sheila Damodaran Organisation: Systems Thinking Research & Leadership Development Institute (STRLDi)
Contents
Foreword
Why This Manual?
From Governance by Compliance to Governance by Practice
The STRLDi Philosophy of Governance
PART I
THE FOUNDATIONS OF GOVERNANCE PRACTICE
Chapter 1
Why Botswana Needs a Governance Practice Manual
Good Laws Do Not Automatically Produce Good Governance
Governance is Practised Before it is Legislated
The Missing Layer in Democratic Governance
A New Philosophy of Governance
Chapter 2
The Governance Practice Framework
From Community Aspirations to Better Lives
The Governance Flow
Roles and Responsibilities Across the System
Every Level Integrates Before Passing Forward
PART II
THE GOVERNANCE PRACTICE CYCLE
Chapter 3
The Community
Where Governance Begins
Identifying Legitimate Aspirations
Community Conversations
Democratic Prioritisation
Creating the Community Mandate
Chapter 4
Village Development Committees
Transforming Conversations into Community Mandates
Facilitating Participation
Validating Community Priorities
Recording Minority Views
Building Community Ownership
Chapter 5
The Ward Councillor
From Representation to Stewardship
Carrying the Community Mandate
Representing Democratically Agreed Priorities
Building Trust Through Continuous Engagement
Returning Accountability to the Community
Chapter 6
The Council
Integrating Ward Priorities into District Development
Practising Law #9
Goal Integration
District Stewardship
Building Reinforcing Development Systems
Chapter 7
Administration
From Political Priorities to Professional Delivery
The Partnership Between Politics and Administration
Sequencing Development
Practising Law #2
Turning Priorities into Results
Chapter 8
Governing Through Financial Constraint
When Scarcity Tests Governance
Financial Constraint as a Test of Governance
Scarcity Reveals the Purpose of Governance
The Chair’s Practice During Financial Constraint
The Councillor’s Practice During Financial Constraint
The Administration’s Practice During Financial Constraint
The Practice of Democratic Re-Prioritisation
The Scarcity Session
The STRLDi Principle: The True Measure of Governance
Chapter 9
The Ministry of Local Government
From Oversight to Stewardship
Building Governance Capability
Governance Learning Across Councils
Supporting Rather Than Rescuing
Creating a National Learning System
Chapter 10
Cabinet
Integrating District Development into National Transformation
National Goal Integration
Regional Reinforcement
Sequencing National Development
Building a Learning Nation
PART III
THE DISCIPLINE OF GOVERNING TOGETHER
Chapter 11
Conflict as a Learning Opportunity
Understanding Conflict Through Systems Thinking
Productive Tension versus Destructive Escalation
Conflict as Diagnostic Information
Building Institutional Capability
Chapter 12
The Goal Integration Practice
Applying Law #9 of Dynamic Complexity
Surface Every Legitimate Goal
Understand the Purpose Behind Every Goal
Discover Causal Relationships
Organise Goals into Sequence
Build Reinforcing Systems
The Role of the Facilitator
PART IV
GOVERNANCE IN PRACTICE
Chapter 13
The Practice of Chairing a Council
Leading Without Dominating
Opening Every Meeting with Purpose
Guiding Through Questions
Strategic Restraint
Chapter 14
The Practice of Membership
Representation and Stewardship
Listening Before Advocating
Working Across Differences
Serving the District
Chapter 15
The Practice of Administration
Professional Stewardship
Political Neutrality
Mutual Respect
Building Trust
Chapter 16
The Measure of Good Governance
Beyond Meetings and Minutes
Measuring Community Outcomes
Governance That Improves Lives
PART V
BUILDING A LEARNING GOVERNANCE SYSTEM
Chapter 17
The Discipline of Continuous Governance Learning
From Firefighting to Learning
Governance Learning Reviews
Institutional Reflection
Learning Questions
Chapter 18
Building a National Learning System
Learning Across Councils
Governance Learning Reports
Sharing Better Practices
Continuous Improvement
Chapter 19
Botswana’s Opportunity
Building a Learning Democracy
Coalition Governance as a National Classroom
The Future of Democratic Stewardship
The Next Stage of Governance Maturity
Conclusion
The Discipline of Governing Together
The Governance Practice Philosophy
Law #2 and Law #9 in Everyday Governance
From Community Aspirations to Better Lives
The STRLDi Governance Model
Appendices
Appendix A
Law #2 of Dynamic Complexity The Harder You Push, the Harder the System Pushes Back
Appendix B
Law #9 of Dynamic Complexity Organising Legitimate Goals into Reinforcing Causal Structures
Appendix C
The Goal Integration Facilitation Guide
Appendix D
Governance Learning Review Template
Appendix E
Council Meeting Practice Checklist
Appendix F
Community Prioritisation Toolkit
Appendix G
Governance Practice Self-Assessment
Appendix H
STRLDi Governance Practice Maturity Model
Chapter 1
Why Botswana Needs a Governance Practice Manual
Good Laws Do Not Automatically Produce Good Governance
For many years, governance reform has focused on strengthening legislation, refining policies and improving institutional structures. These are essential foundations, yet experience repeatedly demonstrates that good laws do not automatically produce good governance. Institutions can possess excellent constitutions, comprehensive standing orders and clear legal mandates, while still experiencing conflict, mistrust and poor decision-making. The missing ingredient is not usually another law. It is the daily discipline of learning how to govern together.
Botswana’s transition into coalition governance has made this distinction more visible than ever before. Councils are now operating in an environment where different political traditions, mandates and priorities must work together in pursuit of one district’s development. The challenge is therefore no longer simply understanding the law; it is learning the practice of governance. Without that practice, institutions naturally fall back into defending positions rather than building shared purpose.
Governance is Practised Before it is Legislated
A common assumption is that once councillors understand the Local Government Act, effective governance will naturally follow. Yet the law can only define powers and responsibilities. It cannot teach people how to build trust, navigate disagreement, integrate legitimate goals or discover the causal relationships that allow different priorities to reinforce one another. These are learned disciplines that develop through deliberate practice.
This manual therefore distinguishes between Governance Law and Governance Practice. Governance Law answers the question, “What are we permitted or required to do?” Governance Practice answers the equally important question, “How do we work together while doing it?” Strong institutions require both.
The Missing Layer
One of the greatest pressures placed upon councils is the expectation that they should reconcile hundreds of competing demands arriving from every ward. Every councillor enters the chamber carrying requests for roads, clinics, water, drainage, housing, youth employment and countless other legitimate aspirations. Expecting councillors to negotiate these competing demands without first establishing which priorities have already been agreed by the communities themselves is both unrealistic and structurally flawed.
The consequence is predictable. Councils become arenas where competing demands collide rather than institutions that integrate agreed priorities into coherent district strategies. The governance process stalls because councillors are asked to resolve conflicts that should have been resolved much earlier in the governance system.
A Different Philosophy of Governance
This manual proposes a different governance architecture. Rather than expecting councils to determine community priorities, communities themselves should first deliberate, prioritise and vote on the outcomes they collectively regard as most important. Councillors then arrive at council carrying a democratic mandate rather than a personal list of competing requests.
The council’s responsibility changes fundamentally. Instead of arguing about which community deserves attention, the council asks a different question: “How do we organise these democratically agreed priorities into a reinforcing causal structure where each investment strengthens another?” The focus shifts from competition to integration, from politics to systems thinking, and from compromise to coordinated development.
Chapter 2
The Governance Practice Framework
From Community Aspirations to Better Lives
Governance is often imagined as beginning in the council chamber. In reality, good governance begins long before councillors gather around a meeting table. It begins in villages, wards and neighbourhoods where citizens identify the opportunities they wish to create and the challenges they want addressed. Every decision taken by a council should therefore be traceable to aspirations that originated within the communities it serves.
The traditional governance model unintentionally reverses this relationship. Communities present long lists of requests, councillors arrive carrying competing expectations, and the council is expected to negotiate priorities on behalf of everyone. This places an impossible burden on councillors because they inherit unresolved differences instead of democratically agreed priorities. The result is delay, frustration and, frequently, conflict.
This manual proposes a different governance architecture. Each level of governance performs a distinct function before responsibility is passed to the next level. Communities determine priorities. Village Development Committees consolidate and validate those priorities. Councillors carry the democratic mandate of their communities. Councils integrate ward priorities into district strategies. Administration determines the most effective sequence for implementation. The Ministry and Cabinet then integrate district priorities into national development.
The important principle is that goal integration occurs at every level before priorities move to the next level. Each level resolves what it is uniquely positioned to resolve. By the time priorities reach Cabinet, they have already passed through several layers of democratic refinement, reducing unnecessary conflict and increasing collective ownership.
Chapter 3
The Community: Where Governance Begins
Many governance systems treat citizens primarily as people who identify problems. A systems perspective suggests something much richer. Communities are not simply the source of complaints; they are the source of legitimate goals. Every aspiration expressed by citizens represents a potential contribution to the future development of the district.
The first responsibility of every community meeting is therefore to create an environment where people can express their aspirations openly. Roads, employment, water, health facilities, recreational spaces, agricultural infrastructure and business opportunities are all legitimate. At this stage, nothing is rejected and nothing is prioritised. The objective is to understand the full landscape of community aspirations before attempting to make choices.
Once all aspirations have been identified, the conversation changes. Rather than asking whether every request can be fulfilled, the community asks a far more disciplined question: “If only three priorities could be achieved over the next three years, which three would create the greatest benefit for everyone?” This simple question transforms governance. Citizens begin appreciating scarcity, recognising trade-offs and thinking collectively rather than individually.
The outcome is not unanimous agreement. Democratic societies rarely achieve unanimity. Instead, the outcome is collective legitimacy. Every resident has had an opportunity to contribute, every aspiration has been heard, and the community has exercised its democratic responsibility to determine its own priorities. Councillors no longer carry competing personal requests; they carry the community’s agreed mandate.
Chapter 4
The Village Development Committee: From Conversation to Community Mandate
The Village Development Committee occupies one of the most important positions within the governance system. Too often it is viewed simply as another administrative structure. In reality, the VDC is the bridge between community conversation and democratic representation. It ensures that community aspirations are transformed into an organised and credible mandate.
The responsibility of the VDC is not to decide what the community should want. Nor is it to substitute its own judgement for that of the people. Its role is to facilitate participation, confirm that the process has been fair and accurately document the priorities emerging from the community. The integrity of the governance system depends heavily upon this stage because every subsequent decision assumes that the community’s voice has been faithfully represented.
The VDC also performs another vital function. It records not only the priorities selected, but also those aspirations that were not selected and the reasons why. This prevents communities from believing that rejected priorities have been forgotten. Instead, they become part of a longer-term development pipeline that can be revisited as circumstances and resources change.
By the time the process leaves the Village Development Committee, something remarkable has occurred. Individual demands have been transformed into a collective community mandate. This is the first major act of goal integration within the governance system and the foundation upon which every higher level of governance depends.
Chapter 5
The Ward Councillor: Carrying a Democratic Mandate
The role of the councillor changes fundamentally within this governance framework. Traditionally, councillors are expected to advocate passionately for every request raised within their wards. While well intentioned, this often places councillors in direct competition with one another as each seeks greater resources for their own communities. The council chamber becomes a contest of competing demands rather than a forum for integrated district development.
Within the Governance Practice Framework, councillors no longer represent personal preferences or competing wish lists. They represent priorities that have already been discussed, debated and democratically endorsed by their communities. Their authority comes not from their ability to argue most forcefully, but from faithfully carrying the collective mandate entrusted to them.
This shift also changes the nature of leadership. Effective councillors are no longer measured by how many projects they secure for their wards alone. They are measured by how effectively they help integrate their ward’s priorities into a development strategy that strengthens the district as a whole. Leadership therefore becomes an exercise in stewardship rather than competition.
The councillor’s responsibility does not end at the council meeting. After every significant decision, the councillor returns to the community to explain what was agreed, why particular priorities were selected, what sequencing was adopted and how future priorities will be addressed. In this way, representation becomes a continuous dialogue rather than a once-off electoral event.
Chapter 6
The Council: Integrating Priorities into a District Strategy
The council chamber should never become the place where communities begin competing with one another. By the time priorities reach the council, they should already represent the democratically agreed aspirations of each ward. The council’s responsibility is therefore not to determine whose priorities matter most, but to discover how those priorities strengthen one another and contribute to the long-term development of the district.
This is where Law #9 of Dynamic Complexity becomes the governing discipline. A district can accommodate many legitimate priorities, provided they are organised into a reinforcing causal structure where each investment creates the conditions for another. Instead of asking, “Which ward should receive the next project?” the council begins asking, “Which investment unlocks the greatest benefit for the district and enables subsequent priorities to succeed?”
The discussion therefore moves away from political bargaining and towards systems thinking. A new access road may not simply improve transport. It may enable agricultural production, strengthen local markets, increase household incomes, expand the local tax base and ultimately provide the revenue needed for future health facilities or recreational infrastructure. The council learns to think in terms of sequences rather than isolated projects, recognising that development is a system rather than a collection of independent activities.
The council also becomes the first institution responsible for balancing local aspirations with district-wide wellbeing. Every ward has legitimate priorities. Every community deserves to be heard. Yet good governance requires councillors to ask not only what benefits their own wards, but what enables the greatest progress for the district as a whole. This represents the transition from representation to stewardship.
Chapter 7
Administration: Turning Priorities into Delivery
Once the council has agreed upon an integrated district strategy, responsibility shifts to the administration. The nature of this responsibility is fundamentally different from that of elected representatives. Councillors determine what should be achieved. Administration determines how it can best be achieved. Confusing these two responsibilities has been the source of unnecessary tension in many governance systems.
Administration begins by testing the feasibility of the council’s priorities. Financial resources, technical capacity, engineering requirements, procurement processes and implementation timelines all influence the sequence in which projects can realistically proceed. This is not an attempt to override political decisions. It is the discipline of ensuring that democratic aspirations are translated into practical and sustainable programmes.
Law #2 becomes particularly important at this stage. The temptation is often to respond immediately to political pressure by attempting to satisfy every demand simultaneously. Systems thinking warns against this approach. The harder institutions push without understanding the order in which causality unfolds, the harder the system pushes back through delays, cost overruns, abandoned projects and declining public confidence. Administration therefore protects the integrity of implementation by recommending realistic sequencing rather than politically convenient promises.
The relationship between council and administration should never be understood as one of competition. Rather, it is a partnership between democratic legitimacy and professional competence. Councillors carry the voice of the people. Administration contributes technical expertise. Neither can succeed fully without the other.
Chapter 8
Governing Through Financial Constraint
When Scarcity Tests Governance
Financial constraints are among the greatest tests of democratic governance. During periods of economic growth, councils can often accommodate many competing priorities without placing excessive strain on relationships. Scarcity changes the conversation. Resources become limited, expectations remain high, and difficult choices can no longer be postponed. The question is no longer whether every aspiration is legitimate, but how legitimate aspirations should be sequenced within finite resources.
The greatest danger during financial constraint is not the reduction in revenue itself. The greatest danger is the gradual shift in the purpose of governance. Councillors naturally begin worrying that if visible projects do not reach their wards, communities may judge them as ineffective during the next election. The council slowly shifts from asking, “What strengthens the district?” to asking, “What protects my political future?” Without disciplined governance practice, scarcity can transform collaboration into competition.
Scarcity Reveals the Purpose of Governance
Periods of abundance seldom expose weaknesses in governance because most priorities can eventually be accommodated. Financial constraint reveals whether institutions truly understand their purpose. Councils that have developed strong governance practices become more disciplined during scarcity. Councils that have not developed these practices often become fragmented as members compete for increasingly limited resources.
This is precisely where Law #2 becomes relevant. The harder councillors push for individual ward projects without first understanding the wider district system, the harder the governance system pushes back. Budgets become increasingly fragmented, strategic investments are delayed, and public confidence declines because many projects begin but few achieve their intended impact.
The Chair’s Practice During Financial Constraint
The Chair carries a special responsibility during periods of scarcity. Rather than allowing the council to negotiate from positions of fear, the Chair must continually return members to the district’s agreed purpose. The role of the Chair is to protect the integrity of the governance process when financial pressure tempts the institution towards short-term political decisions.
The Chair should remind councillors that communities have already participated in determining priorities. The council’s responsibility is not to distribute disappointment equally, but to organise implementation wisely. The central question should never become, “Which ward receives the next project?” It should remain, “Which investment creates the greatest enabling effect for the district and strengthens future opportunities for every ward?”
The Councillor’s Practice During Financial Constraint
Scarcity requires councillors to deepen rather than weaken their relationship with the communities they represent. Honest communication becomes more important than ambitious promises. Communities are generally capable of understanding financial realities when those realities are explained openly and respectfully. What damages trust is not the absence of immediate projects but the absence of transparency.
Councillors should therefore return to their communities and reopen the conversation on priorities whenever financial circumstances change significantly. The question should not be whether promises have been abandoned, but whether the community wishes to maintain the same priorities or revise them in light of new realities. In this way, difficult choices remain democratic rather than becoming purely political.
The Administration’s Practice During Financial Constraint
Administration should guide the council towards understanding the long-term consequences of today’s decisions. Budget reductions often encourage institutions to postpone maintenance, reduce preventive investment or delay infrastructure renewal. While these decisions may relieve immediate financial pressure, they frequently increase costs and reduce service quality in the future.
The administration should therefore present alternative implementation scenarios, identify projects that generate the greatest multiplier effect and distinguish between investments that may safely be delayed and those that must be protected. Professional advice becomes most valuable when it illuminates the long-term behaviour of the system rather than simply describing present financial limitations.
The Practice of Democratic Re-Prioritisation
One of the greatest mistakes councils can make during financial constraint is to assume that previously agreed priorities remain unchanged regardless of changing circumstances. Communities themselves should have the opportunity to reconsider their priorities whenever significant reductions in funding occur. Democracy should not end once priorities have been established. Democracy should continue as circumstances evolve.
Returning to communities for re-prioritisation achieves two important objectives. First, it ensures that scarce resources continue reflecting current public aspirations. Second, it removes the impossible expectation that councillors alone should carry responsibility for every difficult choice. Communities become partners in governance rather than observers of governance.
The Scarcity Session
Whenever projected revenue falls significantly, the council should suspend ordinary budget discussions and convene a dedicated Scarcity Session. The purpose of this meeting is not to determine who loses, but to determine how the district can continue progressing despite reduced resources. Scarcity should become an opportunity for disciplined systems thinking rather than reactive political bargaining.
The discussion should be guided by four questions. Which services must never fail because they protect life, health and public safety? Which investments create the greatest enabling effect for future development? Which projects can be postponed without creating greater long-term costs? How should these decisions be communicated openly to the communities that participated in setting the original priorities? These questions help maintain governance integrity even under severe financial pressure.
The STRLDi Principle
The true measure of governance is not how institutions behave when resources are abundant, but how they prioritise when resources are scarce.
Financial constraint reveals the real culture of governance. It shows whether councillors remain stewards of district development or retreat into defending individual political interests. It reveals whether administration merely manages budgets or helps leaders understand the long-term behaviour of the system. Most importantly, it demonstrates whether communities are treated as partners in difficult decisions or simply informed after those decisions have already been made.
A Governance Practice Manual should therefore treat financial scarcity not as an exception to governance, but as one of its most important disciplines. The councils that emerge strongest from periods of scarcity will not necessarily be those with the largest budgets. They will be those that have learnt to govern together when resources are most constrained.
Chapter 9
The Ministry of Local Government: From Oversight to Stewardship
The Ministry of Local Government has traditionally been viewed as the institution responsible for ensuring compliance with legislation, regulations and established procedures. While this responsibility remains essential, the changing nature of governance requires the Ministry to embrace an additional role—that of steward of governance capability across Botswana.
Every disagreement within a council represents more than a governance challenge. It also represents an opportunity for institutional learning. If one council repeatedly struggles with role clarity between political leadership and administration, the Ministry should ask whether similar tensions are emerging elsewhere. Patterns matter more than isolated events because patterns reveal the underlying structures that require attention.
The Ministry should therefore move beyond responding only when councils experience crisis. Instead, it should actively collect governance lessons from across the country, identify practices that strengthen collaboration and facilitate learning between councils. Every council becomes both a contributor to and a beneficiary of Botswana’s collective governance knowledge.
This also changes the nature of intervention. Rather than immediately imposing solutions, the Ministry first asks what the council itself can learn and resolve. Intervention becomes supportive before it becomes directive. Strong institutions are not those that never experience disagreement, but those that develop the capability to learn from it.
Chapter 10
Cabinet: Integrating District Aspirations into National Development
Cabinet occupies the highest level of political integration within the governance system. By the time priorities arrive at this level, they should already have passed through community conversations, democratic prioritisation, council integration and administrative planning. Cabinet is therefore not expected to resolve local disagreements. Its responsibility is to integrate district development into national transformation.
This requires a different perspective. Rather than viewing districts as competing for limited resources, Cabinet asks how investments in one district strengthen opportunities in another. A transport corridor may benefit several districts simultaneously. Agricultural investment in one region may strengthen food security nationally. National development emerges not from isolated projects but from understanding how regional priorities reinforce one another.
The same discipline of goal integration applies at national level. Cabinet asks which investments create the greatest enabling effect across the country and how limited resources can be sequenced to maximise long-term national benefit. The practice introduced within communities is therefore repeated consistently throughout every level of governance.
Botswana becomes one integrated system of governance. Communities prioritise. Councils integrate. Administration implements. Ministries learn. Cabinet coordinates. Every institution performs a different function while contributing to one common national purpose.
Chapter 11
Conflict as a Learning Opportunity
One of the greatest misunderstandings in governance is the belief that disagreement represents institutional failure. In reality, disagreement often signals that legitimate goals have become visible. The challenge is not the existence of different goals but the absence of a disciplined process for organising them into a coherent system.
This is why the Governance Practice Manual does not begin by asking who is right and who is wrong. Instead, it begins by asking, “What legitimate goals has this disagreement revealed?” Once these goals have been identified, the discussion shifts towards discovering the causal relationships that allow them to reinforce one another. Conflict becomes a source of information rather than a source of division.
The experience of coalition governance illustrates this principle particularly well. Different political parties naturally enter government with different mandates and priorities. This diversity should not be feared. It represents the democratic richness of society. The task of governance is to transform this diversity into coordinated action through dialogue, reflection and disciplined goal integration.
Institutions mature when they stop treating conflict as something to suppress and begin treating it as an opportunity to improve the way they govern. Every disagreement becomes a classroom in which governance capability is strengthened rather than diminished.
Chapter 12
The Goal Integration Practice
Putting Law #9 into Practice
Many governance processes begin with negotiation. Different stakeholders present different priorities, debate their merits and eventually arrive at a compromise. While compromise has its place, it is not the highest expression of governance. Compromise often requires each party to surrender something important. Systems thinking proposes a different discipline. Instead of asking what each party is willing to give up, it asks how every legitimate goal can strengthen the success of another.
This is the practical application of Law #9 of Dynamic Complexity. The law reminds us that a system can accommodate many legitimate goals provided they are organised into a reinforcing causal structure. The responsibility of governance is therefore not to reduce the number of goals but to discover the relationships that enable them to work together. Once these relationships become visible, competition begins giving way to cooperation.
The Goal Integration Practice should become the standard facilitation process used throughout Botswana’s governance system. Communities can use it when identifying development priorities. Village Development Committees can use it when consolidating community mandates. Councils can use it when developing district plans. Ministries can use it when integrating district programmes. The practice remains the same because the systems principle remains the same.
Step One – Surface Every Legitimate Goal
The first discipline is to ensure that every participant feels heard before any attempt is made to solve the problem. Too often, governance begins with argument rather than understanding. People defend positions because they fear their concerns will never be recognised. The first responsibility of the facilitator is therefore to create a safe environment where every legitimate aspiration can be placed on the table without judgement or debate.
This stage deliberately postpones decision-making. No priority is rejected. No comparison is made between one aspiration and another. The objective is to understand the complete landscape of goals before attempting to organise them. People who know they have been heard become far more willing to listen to others. That simple discipline changes the quality of every subsequent conversation.
The facilitator should continually remind participants that the purpose of the meeting is not to determine winners and losers. It is to discover how the aspirations of different people might ultimately contribute to the same future. Listening therefore becomes the first act of integration.
Step Two – Understand the Purpose Behind Every Goal
Once the goals have been identified, the facilitator guides participants beyond the surface of the discussion. Every goal exists because someone believes it solves an important problem or creates an important opportunity. Governance therefore requires understanding not only what people want, but why they want it.
Participants should be encouraged to explain the purpose behind every aspiration. A request for a road may not simply be about transport. It may be about enabling farmers to reach markets, reducing transport costs, attracting investment and improving access to health services. Likewise, a request for a market may not simply be about trading space. It may represent aspirations for employment, entrepreneurship, household income and community resilience.
As the reasons behind each goal become clearer, participants begin recognising that many aspirations are already connected. They are simply being expressed from different perspectives. The discussion gradually shifts from defending positions to exploring relationships.
Step Three – Discover the Causal Relationships
This is the point at which Law #9 truly comes to life. The facilitator no longer asks which goal is more important. Instead, a new question is introduced: “How does achieving this goal make another goal easier to achieve?”
The conversation changes almost immediately. Participants begin identifying enabling relationships that were previously hidden beneath competing demands. One project creates the conditions for another. One investment unlocks opportunities elsewhere. Instead of seeing separate priorities, the group begins seeing an interconnected system.
This stage often transforms the atmosphere within the room. Disagreement gives way to curiosity because participants are no longer competing for limited attention. They are collectively discovering how each contribution strengthens the whole. The system begins revealing its own logic through dialogue.
Step Four – Organise the Goals into a Sequence
Not every goal should be pursued simultaneously. Some investments create the conditions that make later investments more successful. Good governance therefore asks not only what should be done, but when it should be done. Sequencing becomes as important as prioritisation.
The facilitator now guides the group in arranging the goals according to their natural order of causality. Foundational investments are placed first because they unlock multiple future opportunities. Enabling projects follow. Outcome goals emerge later because they depend upon earlier successes. Development ceases to be a collection of unrelated activities and becomes an organised pathway towards shared prosperity.
Participants frequently discover that many disagreements disappear once sequencing has been discussed openly. People realise that their priorities have not been rejected. They have simply found their appropriate place within a larger development journey.
Step Five – Build the Reinforcing System
The final stage asks an important question. Does achieving the last goal strengthen the conditions for achieving the first? If the answer is yes, the group has moved beyond a simple list of projects. It has created a reinforcing system capable of sustaining long-term development.
A new road enables agricultural production. Agricultural production strengthens local markets. Stronger markets generate employment. Employment increases household incomes. Increased household incomes expand the local revenue base. Greater revenue makes it possible to invest in additional infrastructure, which further strengthens agricultural production. The development process becomes self-reinforcing rather than dependent upon constant external intervention.
Participants leave the meeting with something far more valuable than agreement. They leave with a shared understanding of how the district grows as a system. That understanding becomes the foundation for future collaboration because everyone can now see how their contribution advances the collective purpose.
The Role of the Facilitator
The facilitator occupies a unique position within this process. Their responsibility is not to persuade participants towards a particular outcome, nor to impose solutions from above. Their responsibility is to help the system discover its own causal relationships. The facilitator serves the process rather than the outcome.
This requires great discipline. Facilitators must resist the temptation to resolve disagreements prematurely or recommend favourite solutions. Instead, they continually return participants to the central questions. What legitimate goals have become visible? How are these goals related? Which goals enable others? By asking disciplined questions rather than offering immediate answers, facilitators enable groups to develop ownership of both the process and the outcome.
When the meeting concludes successfully, participants should feel that the solution belongs to them rather than to the facilitator. This is the essence of systems leadership. The leader does not create the solution. The leader creates the conditions within which the system discovers its own capacity for coordinated action.
From Conflict to Capability
Many governance systems treat conflict as something to be managed. This manual proposes a different perspective. Conflict is often the moment at which a system reveals the legitimate goals that have not yet been integrated. Rather than fearing conflict, institutions should learn to recognise it as the beginning of a deeper conversation.
The Goal Integration Practice transforms conflict into capability. Every disagreement becomes an opportunity to understand the system more clearly, strengthen relationships and improve future governance. Institutions no longer become stronger because conflict disappears. They become stronger because they develop the capability to organise legitimate differences into reinforcing systems that consistently improve the lives of the people they serve.
Chapter 13
The Practice of Chairing a Council
Leading Without Dominating
The Chairperson occupies one of the most misunderstood positions in local government. Many assume the Chair’s primary responsibility is to maintain order, control meetings and ensure that decisions are reached efficiently. While these responsibilities are important, they are secondary to a much greater responsibility. The Chair is the steward of the governance process. Their success is measured not by how quickly meetings conclude, but by how effectively the council integrates diverse perspectives into coherent district action.
The Chair must therefore distinguish between leading discussions and controlling outcomes. Controlling outcomes often produces compliance without commitment. Leading discussions creates ownership because members participate in discovering the reasoning behind decisions. The Chair’s responsibility is to ensure that every legitimate voice is heard while steadily guiding the council towards its shared purpose.
This requires the discipline of strategic restraint. There will be moments when disagreements emerge and the natural instinct is to intervene immediately. Yet premature intervention often prevents councillors from developing the capability to govern together. The Chair should intervene only when discussions lose respect, lose purpose or lose sight of the district’s shared objectives. In every other situation, disagreement should be recognised as part of institutional learning.
Opening Every Council Meeting
Every meeting should begin by reconnecting members with the purpose of the council. It is remarkably easy for meetings to become consumed by agendas, procedures and reports while gradually losing sight of the people whose lives those discussions are intended to improve. The first responsibility of the Chair is therefore to remind the council why it has gathered.
Before considering individual agenda items, the Chair should briefly restate the district’s agreed development vision and encourage members to approach every discussion through that lens. This simple practice creates continuity between successive meetings and reminds councillors that they are contributing to a long-term development journey rather than a series of isolated decisions.
The Chair should also encourage members to view disagreements constructively. Differences should not be interpreted as obstacles to governance but as opportunities to understand the district more deeply. Establishing this expectation at the beginning of every meeting significantly influences the quality of the discussions that follow.
Guiding Discussions Through Questions
One of the most powerful tools available to a Chair is not authority but inquiry. Questions encourage reflection, reveal assumptions and shift conversations away from personalities towards systems. Well-chosen questions often achieve more than lengthy explanations because they invite the council to think together rather than merely listen.
Throughout discussions, the Chair should consistently return members to a small number of disciplined questions. Which community priority does this proposal address? How does it strengthen the district as a whole? What other priorities does it enable? What unintended consequences might arise? These questions gradually become part of the council’s culture, helping members think systemically rather than reactively.
The quality of governance is often determined by the quality of questions asked around the table. Councils that continually ask who is right tend to produce conflict. Councils that continually ask what strengthens the system tend to produce learning.
Chapter 14
The Practice of Membership
From Representation to Stewardship
Every councillor enters office carrying the trust of the people who elected them. That trust should never be underestimated. Communities expect their representatives to advocate for their interests and ensure that their voices are heard. Representation therefore remains one of the councillor’s most important responsibilities. Yet representation alone is insufficient for effective governance.
Councillors also become stewards of the district as a whole. Every decision they make influences communities beyond their own wards. Leadership therefore requires balancing local commitment with district responsibility. This is one of the most difficult transitions in public leadership because it asks representatives to think beyond immediate political expectations towards long-term collective wellbeing.
The Governance Practice Manual therefore encourages councillors to enter every meeting carrying two commitments simultaneously. The first is loyalty to the democratic mandate received from their communities. The second is loyalty to the long-term development of the district. These commitments are not contradictory. They become mutually reinforcing when councillors understand how district success ultimately strengthens every community within it.
Listening Before Advocating
Effective councillors spend as much time listening as they do speaking. This principle applies equally within communities and within council meetings. Listening is not a sign of uncertainty. It is a discipline through which leaders gain access to perspectives they could never develop alone.
Within the council chamber, listening enables councillors to discover the relationships between their own priorities and those of others. A proposal that initially appears unrelated to one’s ward may ultimately strengthen the conditions necessary for future investments there. Systems thinking therefore encourages councillors to understand before persuading.
The ability to listen deeply also strengthens public trust. Communities quickly recognise representatives who return regularly, explain decisions honestly and continue listening after elections have concluded. Representation becomes an ongoing relationship rather than a periodic campaign.
Chapter 15
The Practice of Administration
Professional Stewardship
Professional administrators occupy a unique position within the governance system. Unlike elected representatives, their authority does not arise from political mandates but from professional expertise, institutional continuity and public service. Their responsibility is to ensure that democratic decisions are translated into practical, lawful and sustainable implementation.
This responsibility requires impartiality. Administrators serve the council as an institution rather than individual political interests. Their advice should therefore remain consistent regardless of which political party or coalition currently governs. Institutional credibility depends upon the confidence that professional advice is guided by evidence, law and good administration rather than political preference.
At the same time, administrators must recognise that elected representatives possess democratic legitimacy. Professional expertise should never become a substitute for democratic decision-making. The most effective governance systems emerge when democratic legitimacy and professional competence operate as complementary strengths rather than competing authorities.
The Practice of Mutual Respect
The relationship between councillors and administrators should never be viewed as a contest for authority. Such a mindset inevitably creates mistrust and defensive behaviour. Instead, both groups should understand themselves as serving different functions within the same governance system. Councillors provide direction. Administration provides capability. Together they create public value.
Mutual respect is strengthened through regular communication, transparent advice and shared understanding of roles. Disagreements should focus upon ideas, evidence and implementation rather than personalities or institutional status. Respect does not eliminate disagreement. It creates the conditions within which disagreement remains productive.
Strong governance therefore depends less upon who possesses greater authority and more upon how effectively different forms of authority are integrated. Democratic authority and professional authority are not rivals. They are partners in public stewardship.
Chapter 16
The Measure of Good Governance
Beyond Meetings and Minutes
Many governance systems measure success through procedural indicators. Meetings are held, reports are tabled, budgets are approved and minutes are adopted. While these activities remain necessary, they are not the ultimate purpose of governance. They are simply the means through which communities seek better lives.
The true measure of governance lies outside the council chamber. It is found in communities that experience reliable water supplies, safer roads, thriving local businesses, cleaner neighbourhoods, stronger schools and expanding opportunities for young people. Governance should ultimately be evaluated by the quality of life it creates rather than the quality of paperwork it produces.
This manual therefore encourages every institution to ask a simple question before concluding its work: How will today’s decision improve the lives of the people we serve? If that question cannot be answered clearly, further reflection may be required before action is taken.
The journey from community aspirations to improved quality of life is neither simple nor linear. It requires patience, disciplined practice and continual learning. Yet when every level of governance performs its distinct role while remaining connected to the larger purpose, governance becomes more than administration. It becomes a living system that continuously transforms the legitimate aspirations of citizens into stronger communities, stronger districts and a stronger Botswana.
Chapter 17
The Discipline of Continuous Governance Learning
From Firefighting to Institutional Learning
One of the greatest weaknesses of many governance systems is that they respond to every crisis as though it were an isolated event. Meetings are convened, investigations are conducted and decisions are made to restore stability. While these responses may solve the immediate problem, they rarely strengthen the institution’s capacity to prevent similar problems from recurring. Governance becomes trapped in a cycle of firefighting rather than progressing towards institutional learning.
Every disagreement within a council should therefore be viewed as an opportunity to understand the governance system more deeply. Instead of asking only what happened, institutions should also ask why this pattern emerged and what it reveals about the way governance is currently practised. The objective is not merely to resolve today’s conflict but to improve tomorrow’s governance.
This requires a fundamental shift in organisational thinking. Conflicts are not interruptions to governance. They are opportunities to refine governance practice. Institutions that learn in this way gradually reduce the frequency and intensity of recurring disputes because every experience contributes to a stronger governance system.
Governance Learning Reviews
Every significant disagreement should conclude with a Governance Learning Review. Unlike disciplinary processes or legal proceedings, the purpose of this review is not to determine blame. Its purpose is to strengthen the institution’s capability to govern more effectively in the future. Every participant contributes to understanding what the system has revealed.
The review begins by reconstructing the sequence of events rather than immediately evaluating decisions. Participants identify where misunderstandings emerged, where assumptions differed and where communication began to break down. Patterns become visible because attention is directed towards the system rather than individual personalities.
The discussion then moves towards improvement. Participants ask what governance practice would have prevented the disagreement, what should become standard practice in future and what lessons should be shared with other councils. Every conflict therefore leaves behind stronger governance than existed before the conflict occurred.
The Governance Learning Questions
The quality of organisational learning depends upon the quality of organisational questions. Rather than asking who was responsible, the Governance Practice Manual encourages institutions to ask questions that deepen collective understanding. Questions shape learning, and learning shapes future behaviour.
Every Governance Learning Review should therefore explore the same disciplined sequence of inquiry. What legitimate goals became visible through this disagreement? What assumptions were different? Which governance practice was absent or insufficient? How should the governance process change so that similar situations strengthen rather than divide the institution?
These questions gradually transform organisational culture. Members become less interested in defending positions and more interested in understanding systems. The institution begins learning collectively instead of merely reacting collectively.
Chapter 18
The Role of the Ministry of Local Government
Building a National Learning System
If every council learns independently, Botswana benefits only from isolated pockets of experience. If every council learns collectively, the entire local government system becomes progressively stronger. This is the opportunity before the Ministry of Local Government.
The Ministry should therefore move beyond being the custodian of legislation and become the custodian of governance learning. Every council already submits financial reports, audit reports and compliance reports. The time has come to introduce Governance Learning Reports that capture the lessons emerging from governance practice across the country.
These reports would not focus on political success or failure. Instead, they would document emerging governance patterns, innovative practices, recurring structural challenges and successful methods of resolving disagreement. The Ministry gradually becomes a national repository of governance wisdom rather than simply a regulator of governance compliance.
Learning Across Councils
Every council in Botswana operates under the same legal framework, yet not every council experiences the same governance challenges. This observation is important because it suggests that the difference may not lie primarily in legislation but in governance practice. Some councils develop stronger habits of collaboration, clearer role understanding and greater trust than others.
Rather than concentrating exclusively on councils experiencing difficulty, the Ministry should also study councils that are functioning well. What governance practices distinguish these councils? How do they handle disagreement? How do councillors and administrators build trust? These questions shift attention from crisis management towards capability building.
The answers should not remain within one district. They should become part of Botswana’s collective governance knowledge, shared through induction programmes, leadership development and ongoing professional learning. Successful governance should become transferable rather than accidental.
Chapter 19
Botswana’s Opportunity
Building a Learning Democracy
Botswana stands at an important moment in its democratic journey. Coalition governance has introduced new relationships, new expectations and new forms of collaboration. Understandably, differences have emerged. Some observers interpret these differences as evidence that governance is becoming more difficult. Systems thinking suggests a different interpretation. Botswana is learning how to govern through diversity rather than despite it.
Every democracy eventually reaches a point where legislation alone is no longer sufficient. Institutions must develop shared practices that enable people with different backgrounds, political traditions and responsibilities to work together with discipline and mutual respect. This is the next stage of democratic maturity. It is not achieved through constitutional amendments alone but through the deliberate cultivation of governance capability.
The Governance Practice Manual therefore represents more than guidance for councils. It proposes a new way of thinking about governance itself. Communities become responsible for identifying and prioritising their aspirations. Councils become responsible for integrating those priorities. Administration becomes responsible for sequencing implementation. Ministries become responsible for learning. Cabinet becomes responsible for national integration. Every institution performs its unique role while strengthening every other institution within the governance system.
Conclusion
The Discipline of Governing Together
The future of governance will not be determined solely by the quality of our laws, the strength of our institutions or the capability of individual leaders. It will be determined by the quality of the practices through which people learn to govern together. Good governance is not an event. It is a discipline that is practised every day, in every meeting, within every village, council, ministry and Cabinet.
The Governance Practice Manual is founded on a simple conviction. People do not elect councils to manage conflict. They elect councils to transform their aspirations into better lives. That transformation cannot occur if communities have never prioritised their own goals, if councils compete instead of integrate, or if institutions respond to every disagreement by searching for blame rather than understanding.
Law #2 reminds us that systems resist when we push before understanding them. Law #9 reminds us that systems can accommodate many legitimate goals when those goals are organised into reinforcing causal relationships. Together these laws offer a new philosophy of governance. Governance is no longer the art of balancing competing interests. It becomes the discipline of discovering how legitimate aspirations strengthen one another and contribute to a shared future.
If Botswana embraces this discipline, it will achieve something far greater than more effective councils. It will develop a governance culture in which every disagreement becomes an opportunity to learn, every institution becomes stronger through practice, and every citizen sees a clear pathway from community aspiration to national development. That is the discipline of governing together, and perhaps the next great chapter in Botswana’s democratic evolution.
Transforming Understanding into Coordinated Action
“Persistent issues cannot be solved by isolated interventions. They require disciplined inquiry, shared understanding, capable leadership and sustained stewardship.”
Purpose
The purpose of Client Solutions & Delivery is to help governments, organisations, development partners and communities understand and respond effectively to persistent issues that continue to resist conventional approaches.
Many institutions invest significant financial, human and political resources in addressing national and organisational challenges. Yet despite these investments, many issues continue to recur, often becoming more deeply embedded over time. This persistence suggests that the difficulty lies not only in implementation, but in the way the problem itself is understood.
Client Solutions & Delivery exists to change that.
The pillar brings together research, leadership development, collaborative strategy, institutional learning and policy advisory into one integrated system through which clients move from fragmented understanding to coordinated action.
Unlike conventional consulting approaches that begin by recommending solutions, STRLDi begins by helping institutions understand the system producing the outcomes they experience. Once that understanding is developed, the Institute works alongside leaders to strengthen capability, align stakeholders, support implementation and build the institutional capacity required to sustain transformation over time.
Every engagement therefore contributes not only to solving immediate challenges, but also to increasing the client’s own ability to learn, adapt and respond to future complexity.
The Client Transformation Journey
Every client engagement follows a disciplined learning journey.
A persistent issue first becomes the subject of systemic inquiry. Research seeks to understand the structures, behaviours and mental models that sustain the issue over time.
This understanding provides the foundation for leadership development, enabling individuals and teams to develop the disciplines required to think systemically, work collaboratively and lead transformation within complex environments.
Leaders are then brought together through Strategy Steward Labs, where shared understanding is translated into coordinated strategies, implementation pathways and collective stewardship.
As implementation progresses, Monitoring, Evaluation & Learning captures outcomes, reflects upon experience and generates new knowledge that continually strengthens both the client and the Institute.
Knowledge generated through every engagement is preserved within the Digital Knowledge Platform, ensuring that valuable insight remains accessible for future research, leadership development and institutional learning.
As STRLDi continues to mature, research and implementation learning will increasingly inform policy, strategy and national transformation, allowing systemic insight to influence broader institutional and societal development.
Through this integrated journey, isolated projects become opportunities for enduring organisational and national learning.
Institutional Structure
The Client Solutions & Delivery Pillar is organised through seven complementary offices, each contributing a distinct capability while reinforcing the work of the others.
1. Research & Systems Diagnostics
Current Steward: Nancy
Purpose
Research forms the intellectual foundation of STRLDi.
Before organisations attempt to solve a persistent issue, they must first understand the system that continually reproduces it. Research therefore seeks to move beyond symptoms by revealing the structural relationships, behavioural patterns and underlying assumptions that sustain undesirable outcomes over time.
Rather than studying isolated events, STRLDi investigates the dynamic interactions that shape long-term organisational and societal behaviour. This work draws upon systems thinking, organisational learning, behavioural analysis, systemic archetypes and the Institute’s evolving research methodologies.
Research becomes the basis upon which all subsequent leadership, strategy and transformation activities are built.
Key Responsibilities
Design and lead systemic research programmes.
Conduct systems diagnostics for governments, organisations and communities.
Develop Behaviour Over Time analyses and causal explanations.
Produce policy-oriented research publications.
Advance STRLDi’s research methodologies.
Supervise research teams and collaborative studies.
Build research partnerships with universities and institutions.
Key Result Areas
High-quality research.
Credible systemic diagnostics.
Knowledge generation.
Publications.
Policy influence.
Research partnerships.
2. Leadership Development
Current Steward: Bernice
Purpose
Transformation depends upon leadership capable of understanding and working within complexity.
Leadership Development equips individuals and teams with the disciplines, capabilities and habits of learning required to steward persistent issues rather than merely react to them.
The programmes are grounded in the principles of learning organisations and systems thinking, encouraging leaders to challenge assumptions, develop shared understanding, cultivate collective learning and strengthen institutional capability.
Leadership development is therefore not viewed as individual training alone, but as an investment in organisational transformation.
Key Responsibilities
Design leadership development programmes.
Deliver executive learning.
Develop facilitators.
Coordinate participant learning journeys.
Maintain programme quality.
Support organisational learning within client institutions.
Key Result Areas
Leadership capability.
Learning culture.
Programme quality.
Client satisfaction.
Organisational development.
3. Strategy Steward Labs
Current Steward: Ms Sheila Damodaran
Purpose
Strategy Steward Labs provide the environment within which systemic understanding becomes coordinated action.
Complex issues cannot be transformed by isolated actors working independently. Sustainable change requires institutions, sectors and stakeholders to develop a shared understanding of the system they collectively influence.
The Labs bring these diverse perspectives together to explore systemic relationships, align strategic intent and co-create practical pathways for implementation.
Rather than producing static strategic plans, the Labs cultivate ongoing stewardship, enabling participants to continually learn, adapt and strengthen implementation over time.
Key Responsibilities
Design and facilitate Strategy Steward Labs.
Coordinate cross-sector dialogue.
Support strategy development.
Facilitate implementation planning.
Build shared ownership.
Strengthen institutional collaboration.
Key Result Areas
Shared understanding.
Coordinated implementation.
Stronger stakeholder alignment.
Improved strategic coherence.
Sustainable transformation.
4. Monitoring, Evaluation & Learning
Purpose
Implementation generates experience.
Experience becomes valuable only when it is examined, understood and incorporated into future practice.
Monitoring, Evaluation & Learning (MEL) ensures that every engagement contributes to measurable outcomes while simultaneously strengthening institutional capability through disciplined reflection.
Evaluation therefore becomes both a mechanism for accountability and an opportunity for continuous organisational learning.
Key Responsibilities
Monitor programme implementation.
Evaluate outcomes.
Assess institutional capability growth.
Capture implementation learning.
Produce evaluation reports.
Inform continuous improvement.
Key Result Areas
Outcome measurement.
Learning integration.
Programme improvement.
Evidence-based decision making.
5. Digital Knowledge Platform
Current Steward: Monty
Purpose
Knowledge represents one of STRLDi’s most valuable institutional assets.
The Digital Knowledge Platform preserves, organises and shares this knowledge so that research, methodologies, publications and institutional learning remain accessible to future practitioners, researchers and leaders.
Rather than functioning solely as a document repository, the platform is envisioned as a living knowledge ecosystem that continually expands alongside the Institute’s work.
Key Responsibilities
Develop the digital knowledge repository.
Manage research archives.
Curate institutional publications.
Support digital collaboration.
Develop AI-supported knowledge systems.
Preserve organisational memory.
Key Result Areas
Accessible institutional knowledge.
Digital capability.
Organisational memory.
Knowledge sharing.
6. Office of Policy, Strategy & National Transformation
Future Development
Purpose
This office translates research and implementation learning into strategic advice capable of influencing institutional, national and regional transformation.
The Office supports governments, public institutions and development partners in developing policies, strategies and reform programmes grounded in systemic understanding rather than isolated interventions.
Its work ensures that learning generated through research and implementation contributes to broader societal change.
Key Responsibilities
Develop policy briefs.
Facilitate national strategy formulation.
Support institutional reform.
Provide executive advisory services.
Produce transformation frameworks.
Translate research into policy.
Key Result Areas
Policy influence.
Strategic advisory.
Institutional reform.
National transformation.
7. Office of International Programmes
Future Development
Purpose
The Office of International Programmes extends STRLDi’s work beyond Botswana by coordinating research, leadership development and transformation programmes across Africa and other regions.
The Office ensures that international engagements remain grounded in the Institute’s philosophy while responding appropriately to different national and regional contexts.
It also facilitates mutual learning between countries, allowing knowledge generated in one context to strengthen practice elsewhere.
Key Responsibilities
Coordinate international programmes.
Develop regional partnerships.
Support cross-country learning.
Manage international delivery.
Strengthen global collaboration.
Key Result Areas
Regional programme delivery.
International partnerships.
Cross-country knowledge exchange.
Expanded institutional reach.
How the Pillar Works
Client Solutions & Delivery functions as an integrated learning system rather than a sequence of independent services.
Research reveals the deeper structure of persistent issues.
Leadership Development equips people to work with that understanding.
Strategy Steward Labs create the shared commitment required for coordinated implementation.
Monitoring, Evaluation & Learning ensures that action generates insight rather than merely activity.
The Digital Knowledge Platform preserves that insight as institutional knowledge.
The Office of Policy, Strategy & National Transformation translates learning into broader reform, while the Office of International Programmes enables these capabilities to contribute across national and regional boundaries.
Together, these offices transform inquiry into understanding, understanding into leadership, leadership into coordinated action and coordinated action into enduring institutional capability.
Key Result Areas of the Pillar
The Client Solutions & Delivery Pillar will be considered successful when it consistently:
Produces rigorous research that deepens understanding of persistent issues.
Develops leaders capable of working with complexity and systemic change.
Strengthens collaboration through Strategy Steward Labs.
Supports implementation through disciplined monitoring, evaluation and learning.
Builds and preserves an accessible body of institutional knowledge.
Influences policy, strategy and institutional reform through evidence-based advisory services.
Extends STRLDi’s contribution across Africa and the wider international community while remaining faithful to its philosophy and purpose.
This pillar is the transformational engine of STRLDi. It is where knowledge is created, leaders are developed, strategies are stewarded and learning is converted into practical improvements for organisations, governments and societies. Every capability within the pillar reinforces the others, ensuring that the Institute’s work is not a collection of disconnected services but a coherent journey from understanding to enduring transformation.
Building the Relationships Through Which Transformation Becomes Possible
“No institution transforms a nation alone. Lasting transformation emerges when relationships become purposeful, knowledge becomes shared and diverse institutions learn to steward change together.”
Contents
This page explains how the Strategic Partnerships & Growth Pillar enables STRLDi to build the relationships, partnerships and collaborative platforms through which its mission is fulfilled. It introduces the philosophy underpinning the pillar, explains how partnerships develop over time, describes the stewardship portfolios and institutional offices that make up the pillar, and outlines how these relationships generate learning, opportunities and long-term institutional growth.
The page is organised into the following sections:
1. Purpose Why Strategic Partnerships & Growth is central to STRLDi’s mission.
2. The Partnership Journey How relationships develop from dialogue to long-term institutional partnerships.
3. Institutional Structure An overview of the pillar and the relationship portfolios through which it operates.
4. Government, Media & International Relations Building relationships with government, the media and international institutions.
5. Economic Partnerships & Development Cooperation Working with the private sector, investors and development partners.
6. Institutional, Professional & Knowledge Partnerships Strengthening collaboration with professional bodies, universities, research institutions and knowledge networks.
7. Community, Knowledge & Regional Partnerships Connecting with communities, traditional leadership, local government and regional organisations.
8. Proposal Development & Resource Mobilisation(Future Development) Transforming opportunities into funded programmes and strategic partnerships.
9. Membership Office(Future Development) Building a long-term community of individuals and institutions committed to systemic transformation.
10. Communities of Practice Supporting continuous learning and collaboration beyond individual projects.
11. Conferences, Strategic Dialogues & Executive Systems Programmes Convening leaders through Executive Sunday Systems Retreats, Executive Wednesday Systems Forums, regional Executive Systems Programmes and strategic dialogues that generate learning, relationships and future opportunities.
12. Knowledge & Public Engagement Sharing research, strengthening public understanding and extending STRLDi’s influence through publications, media and digital platforms.
13. How the Pillar Works Understanding how the different portfolios work together to create a continuous cycle of partnership, learning and institutional growth.
14. Key Result Areas The outcomes by which the Strategic Partnerships & Growth Pillar will be measured.
15. Closing Reflection A reflection on why stewardship, relationships and collaboration are among STRLDi’s greatest institutional assets.
Purpose
The Strategic Partnerships & Growth Pillar exists to build, steward, and strengthen the relationships through which STRLDi fulfils its mission.
Persistent national and regional issues rarely exist within the boundaries of a single organisation, ministry or profession. They emerge through the interaction of many actors whose decisions, priorities, and actions continually influence one another. For this reason, meaningful transformation depends as much on the quality of relationships as on the quality of technical solutions.
STRLDi therefore views partnership development not as an activity undertaken after research is completed or programmes are designed. Partnership is itself a strategic capability. It enables diverse institutions to discover shared purpose, develop mutual trust and mobilise collective action around issues that no single organisation can address independently.
This pillar cultivates the institutional ecosystem within which STRLDi’s research, leadership development, and strategy stewardship can flourish. It identifies opportunities for collaboration, develops long-term institutional relationships, mobilises resources, and creates the conditions for the continual exchange of knowledge across sectors, disciplines and national boundaries.
In doing so, Strategic Partnerships & Growth strengthens not only the Institute itself but also the broader communities of practice committed to systemic transformation.
The Philosophy of Partnership Stewardship
Partnerships are not support functions. They are strategic capabilities through which institutions learn, coordinate and transform together.
At STRLDi, relationships are cultivated not simply to expand the Institute’s network, but to strengthen society’s collective capacity to understand and respond to persistent structural issues.
Partnerships create the conditions through which research is enriched, leadership develops, knowledge travels, and transformation becomes possible.
The Partnership Journey
Partnerships within STRLDi develop through a deliberate journey rather than isolated transactions.
Relationships begin through dialogue and shared inquiry. As trust develops, opportunities for collaboration emerge naturally. These opportunities are translated into jointly designed programmes, research initiatives and leadership engagements that create value for all participants.
Implementation generates further learning, strengthening both the relationship and the institutional capability of those involved. Over time, individual collaborations evolve into enduring partnerships, professional networks, and communities of practice that continue learning together long after individual projects have concluded.
In this way, partnerships become living systems of learning rather than contractual arrangements.
The Strategic Partnership Ecosystem
Institutional Structure
The Strategic Partnerships & Growth Pillar is organised through specialised relationship portfolios that together ensure every major stakeholder group receives intentional stewardship while remaining connected to STRLDi’s broader mission.
1. Government, Media, and International Relations
Current Steward: Brunoh
Purpose
Governments remain central actors in addressing persistent national challenges. This office cultivates trusted relationships with ministries, departments, public service leadership and national planning institutions, creating opportunities for collaborative inquiry, leadership development and institutional transformation.
It also serves as the principal channel through which STRLDi communicates its work to the wider public, ensuring that research findings and institutional learning contribute meaningfully to national discourse.
Brunoh stewards STRLDi’s relationships with the national government, the media, and international institutions. He is responsible for positioning the Institute as a trusted voice on persistent national and regional issues while strengthening relationships that expand STRLDi’s influence beyond Botswana.
Key Responsibilities
Steward relationships with central and local government.
Engage ministries, departments, and agencies.
Coordinate executive briefings and government dialogues.
Support public-sector leadership engagement.
Develop strategic communication initiatives.
Strengthen public understanding of systemic issues.
Primary Stakeholders
National Government
Ministries and Government Departments
Public Service Leadership
National Planning Institutions
Media Houses
Journalists and Editors
Broadcast and Digital Media
International Organisations
International Government Relations
Embassies and High Commissions
Public Communications
Executive Briefings
Thought Leadership Campaigns
Primary Outcomes
Strong government relationships
Increased media visibility
International institutional relationships
Public-sector opportunities
International collaborations
Enhanced STRLDi reputation
2. Economic Partnerships & Development Cooperation
Current Steward: Mr Tema
Purpose
Sustainable transformation requires collaboration with business leaders, investors, and development partners whose resources, expertise, and influence contribute to national development.
This office develops relationships with the private sector, international development agencies, philanthropic organisations and multilateral institutions, aligning shared interests around long-term systemic transformation.
Key Responsibilities
Build private-sector partnerships.
Develop relationships with development partners.
Facilitate donor engagement.
Identify investment opportunities.
Support resource mobilisation.
Coordinate international cooperation.
Key Result Areas
Development partnerships.
Private-sector collaboration.
Resource mobilisation.
International cooperation.
3. Institutional, Professional & Knowledge Partnerships
Current Steward: Mabua
Purpose
Professional bodies, statutory organisations and public enterprises play a vital role in strengthening institutional capability across society.
This office builds enduring relationships with these organisations, encouraging collaborative learning, joint research and professional development while creating opportunities for broader institutional transformation.
Key Responsibilities
Steward relationships with parastatals.
Engage professional associations.
Build institutional networks.
Coordinate sector-specific collaboration.
Support professional learning initiatives.
Key Stakeholders
Parastatals
Statutory Organisations
Professional Bodies
Industry Associations
Universities
Research Institutions
International Think Tanks
Knowledge Networks
Academic Collaboration
Joint Research
Key Result Areas
Institutional partnerships.
Professional collaboration.
Sector engagement
Research partnerships
Knowledge exchange
Institutional capability development
International academic collaboration
4. Community, Knowledge & Regional Partnerships
Current Steward: Coach
Purpose
Transformation becomes sustainable only when knowledge reaches communities and when learning flows across regional boundaries.
This office strengthens relationships with local government, traditional leadership, universities, research institutions, civil society organisations and regional bodies, particularly within the Southern African Development Community.
Its work ensures that STRLDi remains connected to the lived realities of communities while contributing to regional learning and cooperation.
Key Responsibilities
Engage local authorities.
Build relationships with Bogosi.
Develop university partnerships.
Coordinate regional collaboration.
Support academic cooperation.
Strengthen community engagement.
Key Result Areas
Community partnerships.
Academic collaboration.
Regional cooperation.
Knowledge exchange.
5. Proposal Development & Resource Mobilisation
Future Development
Purpose
Ideas become transformational only when they are adequately resourced.
This office converts emerging partnership opportunities into funded programmes, consultancy assignments, research initiatives and long-term institutional collaborations.
Its work enables STRLDi to sustain and expand its mission while ensuring that proposals remain grounded in the Institute’s philosophy and standards of professional practice.
Key Responsibilities
Coordinate Expressions of Interest and tenders.
Develop grant proposals.
Prepare consultancy submissions.
Negotiate partnership agreements.
Support contract development.
Maintain proposal quality.
Key Result Areas
Successful proposals.
Contract awards.
Programme funding.
Strategic investments.
6. Membership Office
Future Development
Purpose
The Membership Office builds a community of individuals and institutions committed to advancing systemic thinking, organisational learning and national transformation.
Membership extends the Institute’s reach beyond individual projects by creating a network of practitioners, researchers, leaders, and supporters who continue learning together over time.
The Office will also steward Fellows, Associates, Alumni, and Institutional Members, strengthening long-term relationships while generating recurring support for the Institute’s work.
Key Responsibilities
Manage membership programmes.
Coordinate Fellows and Associates.
Develop institutional membership.
Maintain alumni engagement.
Support member services.
Grow the learning community.
Key Result Areas
Membership growth.
Member engagement.
Institutional loyalty.
Community development.
7. Communities of Practice
Purpose
Communities of Practice provide ongoing spaces where professionals continue learning long after formal engagements have concluded.
Rather than functioning as networking groups alone, these communities become living laboratories through which knowledge is shared, practice evolves, and collaborative innovation emerges across sectors and disciplines.
Key Responsibilities
Establish thematic Communities of Practice.
Facilitate professional dialogue.
Encourage peer learning.
Share emerging research.
Strengthen collaborative problem-solving.
Key Result Areas
Active communities.
Professional learning.
Cross-sector collaboration.
Knowledge exchange.
8. Executive Programmes
Purpose
National and regional transformation requires spaces where diverse perspectives can meet in disciplined conversation.
This office designs and coordinates conferences, executive forums, public lectures, and strategic dialogues that bring together leaders from government, business, academia, development agencies, and civil society to explore emerging issues and strengthen collective understanding.
These gatherings also provide opportunities for disseminating research, showcasing innovation, and cultivating new partnerships.
Developing Leaders Through Shared Inquiry
The Executive Systems Programmes provide the principal entry point through which leaders engage with STRLDi. They are designed for leaders from the private sector, academia, research institutions, professional bodies, community organisations, traditional leadership and other sectors who are seeking a deeper understanding of persistent structural issues affecting their organisations, sectors and nations.
Unlike conventional executive education, these programmes do not focus on organisational performance, management techniques or functional leadership skills. Instead, they bring together leaders from diverse backgrounds to examine persistent structural issues through the discipline of systems thinking, using real national and regional challenges as the basis for collective inquiry and learning.
Each programme is intentionally limited to twenty-four participants, creating an environment that encourages thoughtful dialogue, meaningful relationships and sustained learning. Participants work across sectors, disciplines and professions, discovering how different parts of society contribute to the same persistent outcomes and where opportunities for coordinated action may exist.
To accommodate different schedules and geographic contexts, STRLDi delivers its Executive Systems Programmes in three complementary formats.
Executive Sunday Systems Retreats provide a three-part learning experience delivered over three consecutive Sundays. This format enables working professionals to participate while remaining engaged in their normal responsibilities.
Executive Wednesday Systems Forums offer the same programme over three Wednesdays, providing an alternative schedule for participants who prefer weekday learning.
For participants travelling from elsewhere in Southern Africa, STRLDi offers a Regional Executive Systems Programme, delivered over three-and-a-half days from Tuesday morning to Friday lunchtime. This format maximises learning while reducing travel demands.
The Executive Systems Programmes are not an end in themselves. They represent the beginning of a continuing relationship between participants and the Institute. As understanding develops, organisations often invite STRLDi to undertake systemic research, facilitate Strategy Steward Labs, support institutional transformation and contribute to long-term learning initiatives.
Convening Leaders Around Persistent Structural Issues
Many of the challenges confronting nations cannot be addressed by individual organisations acting independently. They require disciplined conversation among leaders representing different sectors, professions and institutions.
For this reason, STRLDi convenes conferences, strategic dialogues, executive forums and public lectures that create opportunities for collective learning around issues of national and regional importance.
These gatherings are designed to move beyond presentations and panel discussions. They encourage participants to examine the structural relationships underlying persistent issues, explore different perspectives, identify opportunities for collaboration and strengthen collective understanding before action is taken.
Subjects for dialogue may include unemployment, manufacturing, agriculture, education, food systems, local economic development, governance, innovation, regional integration and other issues requiring systemic inquiry.
The Executive Systems Programmes often provide the foundation for these larger engagements. As participants continue learning and relationships mature, they contribute to broader national conversations through conferences, policy dialogues and cross-sector forums.
These events also provide an important platform for disseminating STRLDi’s research, showcasing emerging insights and strengthening relationships with governments, universities, development partners, professional bodies and civil society organisations.
Through these engagements, STRLDi fulfils one of its central responsibilities: creating trusted spaces where leaders can think together before they are required to act together.
10. Knowledge & Public Engagement
Purpose
Knowledge fulfils its greatest purpose when it becomes accessible and contributes to public understanding.
This office ensures that STRLDi’s research, publications, digital platforms and media engagement reach diverse audiences in ways that encourage informed dialogue, thoughtful reflection and broader societal learning.
It also strengthens the Institute’s reputation as a trusted source of insight into persistent national and regional issues.
Extending Learning Beyond the Institute
Knowledge creates its greatest value when it is shared widely, applied thoughtfully and continually refined through dialogue and practice.
The Knowledge & Public Engagement Office ensures that STRLDi’s work reaches leaders, institutions and communities beyond those directly participating in programmes and consultancy engagements. It transforms research findings, institutional learning and practical experience into accessible knowledge that contributes to informed public discourse and long-term societal learning.
This responsibility includes the development of publications, policy papers, research reports, blogs, newsletters, digital learning resources and multimedia content. It also stewards the Institute’s websites, social media platforms and relationships with the media, ensuring that STRLDi’s work remains visible, credible and relevant to contemporary national and regional discussions.
Public engagement is not viewed simply as communication. It is an extension of the Institute’s learning mission. By encouraging thoughtful discussion around persistent structural issues, STRLDi helps broaden public understanding, strengthen systemic thinking and cultivate a growing community committed to institutional learning and national transformation.
Knowledge generated through research, Executive Systems Programmes, Strategy Steward Labs and institutional partnerships continually returns to this office for publication and dissemination. In turn, the questions, reflections and insights emerging from the wider community enrich future research and programme development.
Knowledge therefore moves in two directions. It flows outward to strengthen society’s understanding of persistent structural issues, and it flows back into the Institute, continually enriching STRLDi’s own capacity to learn, adapt and contribute.
Building a Sustainable Institute Through Service, Learning and Partnership
STRLDi is committed to building an institution that is both intellectually independent and financially sustainable. Long-term institutional stewardship requires more than excellent research and leadership development. It also requires the ability to generate the resources needed to attract capable people, invest in knowledge development, strengthen organisational capacity and continually expand the Institute’s contribution to society.
For this reason, the Strategic Partnerships & Growth Pillar plays a central role in developing opportunities that sustain the Institute while advancing its mission. Revenue generation is not pursued as an end in itself. Rather, it is the natural outcome of building trusted relationships, convening meaningful dialogue and delivering work that creates lasting value for leaders, institutions and communities.
The Executive Systems Programmes provide the principal entry point into this journey. Through Executive Sunday Systems Retreats, Executive Wednesday Systems Forums and Regional Executive Systems Programmes, leaders from business, academia, research institutions, professional bodies, community organisations and other sectors come together to examine persistent structural issues through systems thinking. These programmes generate income that supports the Institute’s operations while simultaneously building relationships that often develop into deeper collaborations.
As participants return to their organisations with new insight, many identify opportunities where STRLDi can provide further support. These opportunities may lead to systemic research, institutional diagnostics, Strategy Steward Labs, leadership development programmes, policy advisory assignments, and longer-term transformation initiatives. In this way, the Executive Systems Programmes become the beginning of an ongoing partnership rather than the conclusion of a training event.
Conferences, strategic dialogues, executive forums and public lectures further strengthen this pathway by creating spaces where leaders encounter new ideas, establish professional relationships and identify opportunities for collaborative work. These engagements also extend STRLDi’s visibility, strengthen its reputation, and contribute to a growing community committed to addressing persistent structural issues.
As the Institute matures, additional sources of recurring income will emerge through proposal development, commissioned research, development partner collaborations, Communities of Practice, publications, institutional memberships, and other strategic initiatives aligned with STRLDi’s mission.
This diversified approach reduces dependence on any single source of income while enabling the Institute to invest continually in its people, research, digital knowledge platforms and regional growth.
The objective is therefore not simply to generate revenue. It is to build an institution capable of serving society over many decades through a balanced combination of learning, partnership, research, and professional practice.
13. Institutional Revenue Pathway
The Strategic Partnerships & Growth Pillar develops opportunities through a deliberate progression:
Strategic Partnerships & Growth serves as the outward-facing relationship system of STRLDi.
Each office stewards a distinct community of relationships while remaining connected through a shared institutional purpose. Government engagement informs research priorities. Development partners enable programme implementation. Professional bodies strengthen learning communities. Universities enrich research. Communities contribute lived experience. Conferences stimulate dialogue. Membership sustains long-term engagement. Public communication extends learning beyond institutional boundaries.
Together, these relationships generate opportunities that flow naturally into the Client Solutions & Delivery Pillar, where they become research assignments, leadership programmes, Strategy Steward Labs and policy advisory engagements. As these engagements conclude, the knowledge and relationships they produce return to strengthen the partnership ecosystem, creating a continuous cycle of learning, collaboration and institutional growth.
15. Key Result Areas
The Strategic Partnerships & Growth Pillar is responsible for expanding STRLDi’s institutional relationships, strengthening its reputation and generating opportunities that advance the Institute’s mission. Success is measured not simply by the number of engagements undertaken, but by the quality of relationships established, the knowledge generated and the long-term partnerships that emerge.
The Pillar is guided by the following Key Result Areas.
1. Institutional Relationship Development
Develop and steward enduring relationships with leaders and institutions across government, business, academia, professional bodies, communities, development partners and regional organisations.
Performance Indicators
Number of strategic partnerships established.
Number of active institutional relationships.
Number of Memoranda of Understanding (MOUs) or collaboration agreements concluded.
Number of repeat engagements with existing partners.
Partner satisfaction and relationship quality.
2. Executive Engagement & Leadership Learning
Convene high-quality Executive Systems Programmes that strengthen leadership capability and expand STRLDi’s learning community.
Performance Indicators
Number of Executive Sunday Systems Retreats delivered.
Number of Executive Wednesday Systems Forums delivered.
Number of Regional Executive Systems Programmes conducted.
Total participant enrolment.
Participant satisfaction and programme evaluation.
Create trusted spaces where leaders collectively examine persistent structural issues and identify opportunities for collaborative action.
Performance Indicators
Number of conferences convened.
Number of executive dialogues facilitated.
Number of sector forums conducted.
Number of participating organisations.
Number of cross-sector collaborations initiated.
4. Opportunity Development
Transform relationships into opportunities that contribute to STRLDi’s research, leadership development and institutional practice.
Performance Indicators
Number of research opportunities identified.
Number of consultancy enquiries generated.
Number of proposals submitted.
Proposal success rate.
Value of consultancy opportunities secured.
5. Strategic Partnerships & Resource Mobilisation
Strengthen the Institute’s long-term sustainability through strategic collaboration and resource mobilisation.
Performance Indicators
Number of development partner engagements.
Number of collaborative research initiatives.
Number of jointly funded projects.
Value of external funding secured.
Number of regional and international partnerships established.
6. Knowledge & Public Engagement
Strengthen public understanding of persistent structural issues while increasing the visibility and credibility of STRLDi.
Performance Indicators
Number of publications produced.
Research papers and policy briefs released.
Public lectures and webinars conducted.
Media engagements.
Growth in website and digital platform reach.
Growth in professional networks and online engagement.
7. Institutional Growth & Sustainability
Generate the opportunities and resources required to strengthen STRLDi’s long-term institutional capability.
Performance Indicators
Revenue generated through Executive Systems Programmes.
Revenue generated through conferences and executive dialogues.
Revenue generated through consultancy and advisory engagements originating from Pillar III.
Percentage of recurring institutional partnerships.
Contribution of Pillar III to STRLDi’s annual operating budget.
8. Organisational Learning
Ensure that every engagement contributes to the Institute’s growing knowledge base and strengthens future practice.
Performance Indicators
Lessons learned are documented following major engagements.
Partnership reflections completed.
New methodologies developed.
Case studies published.
Improvements incorporated into future programmes.
The success of the Strategic Partnerships & Growth Pillar is ultimately measured by more than activity. It is reflected in the Institute’s growing ability to convene leaders, foster trusted relationships, generate meaningful opportunities and create enduring partnerships that strengthen research, leadership development and institutional transformation. As these capabilities mature, they contribute directly to STRLDi’s reputation, sustainability and capacity to serve Botswana, Southern Africa and the wider international community for many years to come.
16. Closing Reflection
Institutions are ultimately remembered not for the number of relationships they establish, but for the value those relationships create over time.
At STRLDi, partnerships are viewed as a form of institutional stewardship. Every conversation is an opportunity to learn. Every relationship is an opportunity to deepen understanding. Every collaboration is an opportunity to strengthen the collective capacity of leaders and institutions to respond to persistent structural issues.
The Strategic Partnerships & Growth Pillar exists to cultivate these relationships with care, integrity and purpose. It brings together leaders from business, academia, research, professional bodies, communities and development organisations, creating spaces where knowledge is shared, trust is built and new possibilities emerge through collective inquiry.
As these relationships mature, they become pathways for systemic research, leadership development, Strategy Steward Labs and long-term institutional partnerships. In turn, the knowledge generated through these engagements continually strengthens the Institute itself, enabling STRLDi to expand its contribution to Botswana, Southern Africa and the wider international community.
In this way, partnership becomes more than collaboration. It becomes the means through which learning travels across institutions, leadership capability grows, and societies strengthen their capacity to understand and address the persistent structural issues that shape their future.
Relationships create understanding. Understanding enables coordinated action. Coordinated action creates lasting transformation. It is this progression that lies at the heart of the Strategic Partnerships & Growth Pillar and continues to guide STRLDi’s commitment to building stronger institutions, more capable leaders and more resilient societies.
This page outlines STRLDi’s professional programmes, consultancy services and engagement framework, including Executive Systems Programmes, systemic research, leadership development, Strategy Steward Labs and long-term institutional partnerships, together with the Institute’s professional fee structure.
The work of STRLDi is organised through three institutional pillars, each carrying a distinct responsibility while contributing to one integrated learning institution. Together they ensure that STRLDi continually strengthens its capacity to understand persistent issues, develop leaders, build partnerships and steward long-term transformation.
At this stage of the Institute’s development, several leaders carry responsibilities across more than one pillar. This reflects STRLDi’s deliberate approach to institution building, where leadership grows alongside organisational capability. As the Institute expands, these responsibilities will progressively mature into dedicated offices and specialist appointments.
PILLAR I
Leadership & Institutional Stewardship
Purpose
To provide strategic direction, institutional governance, organisational learning and operational stewardship, ensuring that STRLDi remains a disciplined learning institution capable of sustaining its mission over generations.
Executive Director
Current Steward:Ms Sheila Damodaran
Provides overall leadership of the Institute and stewards its vision, philosophy, research agenda, strategic direction and institutional development. The Executive Director ensures coherence across all three institutional pillars and represents STRLDi nationally, regionally and internationally.
Advisory Council
Status: To be constituted
Provides independent strategic advice and institutional guidance to the Executive Director. The Council strengthens long-term thinking, institutional integrity and strategic positioning while preserving STRLDi’s purpose and values.
Office of Institutional Learning & Reflection
Current Steward:Rea
Serves as the organisational learning engine of STRLDi. The Office observes, documents and reflects upon the Institute’s work, ensuring that every engagement contributes to institutional knowledge and continuous improvement.
The Office also stewards the Five Institutional Stewardship Platforms:
Knowledge Stewardship
Learning Stewardship
Partnership Stewardship
Innovation Stewardship
Systems Stewardship
Executive Secretariat
Current Steward:Rea
Coordinates executive governance by preparing agendas, recording decisions, monitoring implementation of action items and maintaining institutional records.
The Secretariat ensures that organisational commitments are translated into disciplined action while preserving continuity across the Institute.
Corporate Operations & Services
Future Office
Responsible for:
Human Resources
Finance
Administration
Procurement
Information Technology
Legal & Institutional Protection
Governance Support
This office provides the operational foundation upon which every other pillar depends.
PILLAR II
Client Solutions & Delivery
Purpose
To help governments, organisations and communities understand persistent issues, strengthen leadership capability, co-create transformation strategies and build lasting institutional capacity.
Research & Systems Diagnostics
Current Steward:Nancy
Leads the Institute’s research agenda through systemic inquiry, behavioural analysis, policy research and organisational diagnostics.
Responsible for:
National and regional research
Systems diagnostics
Publications
Behaviour Over Time analysis
System archetype development
Research partnerships
Leadership Development
Current Steward:Bernice
Designs and delivers learning programmes that strengthen leaders’ capacity to understand complexity, facilitate collaboration and steward long-term transformation.
Responsible for:
Executive programmes
Learning Organisation programmes
Facilitator development
Curriculum design
Leadership capability
Strategy Steward Labs
Current Steward:Ms Sheila Damodaran
Facilitates collaborative laboratories where governments, institutions and communities jointly translate systemic understanding into coordinated implementation strategies.
Responsible for:
Strategy Labs
Cross-sector facilitation
Executive dialogue
Shared vision development
Strategy stewardship
Monitoring, Evaluation & Learning (MEL)
Future Office
Ensures that implementation generates measurable learning and continual improvement.
Responsible for:
Monitoring
Evaluation
Learning reviews
Impact assessment
Continuous improvement
Digital Knowledge Platform
Current Steward:Monty
Develops and manages STRLDi’s digital knowledge infrastructure.
Responsible for:
Knowledge repositories
Digital publications
AI-enabled knowledge systems
Research archives
Institutional memory
Website development
Monty also supports Nancy in strengthening the Institute’s long-term research capability.
Office of Policy, Strategy & National Transformation
Future Office
Transforms research findings into practical policy advice, institutional reform programmes and national transformation strategies.
Responsible for:
Policy advisory
Strategy development
National planning support
Institutional reform
Executive advisory
Office of International Programmes
Future Office
Coordinates STRLDi’s work across Africa and internationally.
Responsible for:
Regional programmes
International partnerships
Cross-country learning
Programme coordination
Global institutional collaboration
PILLAR III
Strategic Partnerships & Growth
Purpose
To build trusted relationships, mobilise resources and cultivate the institutional ecosystem through which STRLDi’s work grows in reach, relevance and long-term impact.
Government Relations & Strategic Communications
Current Steward:Brunoh
Leads engagement with:
National Government
Ministries
Public Service Leadership
Government Agencies
National Planning Institutions
Diplomatic Missions
Media Organisations
Also coordinates public communications, media engagement and strategic messaging.
Economic Partnerships & Development Cooperation
Current Steward:Mr Tema
Develops strategic relationships with:
Private Sector
Development Partners
International Agencies
International Development Organisations
Investors
Philanthropic Organisations
Also leads proposal development and resource mobilisation.
Institutional & Professional Partnerships
Current Steward:Mabua
Builds relationships with:
Parastatals
Professional Bodies
Industry Associations
Statutory Organisations
Strengthens professional collaboration and institutional learning.
Community, Knowledge & Regional Partnerships
Current Steward:Coach
Leads engagement with:
Local Government
Parliament
Political Party Leadership
Dikgosi and Traditional Leadership
University Institutions
Research Institutions
Civil Society Organisations
SADC and Regional Organisations
Coach also oversees the development of regional Communities of Practice and cross-border learning initiatives.
Proposal Development & Resource Mobilisation
Current Steward:Mr Tema(until a dedicated office is established)
Coordinates:
Expressions of Interest
Grant proposals
Consultancy submissions
Funding applications
Strategic investment opportunities
Membership Office
Future Office
Develops and stewards the STRLDi learning community through:
Individual Members
Institutional Members
Fellows
Associates
Alumni
Friends of STRLDi
The Membership Office will become a significant contributor to the Institute’s long-term sustainability and recurring revenue.
Communities of Practice (CoPs)
Current Coordination:Coach
Supports the development of thematic learning communities where practitioners continue collaborating beyond individual projects.
Communities of Practice strengthen peer learning, innovation and professional exchange across sectors.
Led collaboratively across the partnership team, these platforms bring together leaders from government, business, academia and civil society to explore persistent issues and co-create new possibilities for transformation.
Knowledge & Public Engagement
Current Coordination:Brunoh, with support from Monty
Responsible for ensuring that STRLDi’s knowledge reaches wider audiences through:
Publications
Media engagement
Website
Podcasts
Blogs
Social media
Public lectures
Executive briefings
Leadership Development Pathway
STRLDi is intentionally developing future institutional leaders.
Current stewardship arrangements reflect both present responsibilities and future organisational growth.
Current Steward
Current Role
Long-Term Development Pathway
Ms Sheila Damodaran
Executive Director
Institutional Steward and Founder
Rea
Office of Institutional Learning & Reflection & Executive Secretariat
Transition to Leadership Development, supporting Bernice while continuing to steward institutional learning
Nancy
Research & Systems Diagnostics
Director of Research
Bernice
Leadership Development
Director of Leadership Development
Monty
Digital Knowledge Platform
Director of Digital Knowledge & Research Systems, supporting Nancy and leading the Digital Knowledge Platform
Brunoh
Government Relations & Strategic Communications
Director of Government Relations & Public Engagement
Mr Tema
Economic Partnerships & Development Cooperation
Director of Strategic Partnerships & Resource Mobilisation
Mabua
Institutional & Professional Partnerships
Director of Institutional Partnerships
Coach
Community, Knowledge & Regional Partnerships
Director of Regional Partnerships, Communities of Practice and SADC Engagement
Building an Institution Through Stewardship
The roles presented above represent more than a distribution of responsibilities. They reflect STRLDi’s philosophy that institutions are built through stewardship, disciplined learning and shared purpose. As the Institute grows, today’s stewards will mentor future leaders, new offices will emerge and additional expertise will be incorporated. The architecture is therefore designed not merely to support the work of today, but to enable STRLDi to remain a resilient learning institution serving Botswana, Southern Africa and the wider international community for generations to come.
The Leadership & Institutional Stewardship Pillar exists to ensure that STRLDi remains a disciplined learning institution—one that is strategically guided, professionally managed, financially sustainable and continually strengthened through reflection and learning.
Unlike conventional organisations where administration exists primarily to support operations, this pillar recognises that the Institute itself is one of STRLDi’s most important subjects of study. How decisions are made, how knowledge is captured, how people learn together and how institutional capability grows are all treated as matters of deliberate inquiry.
The pillar therefore carries responsibility not only for governance and organisational management, but also for cultivating the culture, systems and disciplines that allow STRLDi to fulfil its mission over generations.
Its work ensures that the Institute remains coherent in purpose, disciplined in practice and resilient in the face of change.
Stewardship Responsibilities
Leadership & Institutional Stewardship is responsible for:
Providing strategic direction for the Institute.
Safeguarding the institutional vision, values and purpose.
Strengthening organisational capability through continuous learning.
Ensuring sound governance and accountability.
Building organisational systems and operational excellence.
Stewarding financial sustainability and institutional resources.
Protecting the Institute’s intellectual property, reputation and legal integrity.
Cultivating an organisational culture grounded in reflection, learning and innovation.
Institutional Structure
The pillar is organised through five mutually reinforcing offices, each contributing to the long-term health and development of the Institute.
1. Executive Director
Current Steward: Ms Sheila Damodaran
Purpose
The Executive Director provides the overall stewardship of STRLDi, ensuring that every aspect of the Institute remains aligned with its founding purpose and long-term mission.
The role extends beyond executive management. It is responsible for integrating research, leadership, partnerships and institutional learning into one coherent organisational system capable of contributing to national and regional transformation.
The Executive Director serves as the principal custodian of STRLDi’s philosophy, institutional direction and external representation.
Key Responsibilities
Define and steward the Institute’s long-term vision.
Provide executive leadership across all three institutional pillars.
Direct research priorities and strategic initiatives.
Build relationships with governments, development partners, universities and industry leaders.
Lead institutional innovation and organisational development.
Approve major programmes, partnerships and investments.
Represent STRLDi nationally, regionally and internationally.
Ensure the Institute remains faithful to its mission and values.
Key Result Areas
Strategic leadership.
Institutional growth.
Research excellence.
Partnership development.
Organisational sustainability.
National and international reputation.
2. Advisory Council
Status: To be constituted.
Purpose
The Advisory Council exists to strengthen the Institute through independent wisdom, strategic guidance and constructive reflection.
It does not manage STRLDi. Rather, it provides thoughtful counsel to the Executive Director, helping the Institute maintain long-term perspective while remaining responsive to emerging opportunities and challenges.
The Council also serves as a bridge between STRLDi and the wider community of national leaders, researchers, practitioners and development partners.
Key Responsibilities
Provide strategic advice to the Executive Director.
Review institutional priorities and progress.
Offer independent perspectives on emerging issues.
Strengthen organisational credibility.
Introduce strategic opportunities and partnerships.
Encourage long-term institutional thinking.
Key Result Areas
Strategic guidance.
Institutional integrity.
Leadership support.
External credibility.
Long-term organisational resilience.
3. Office of Institutional Learning & Reflection
Current Steward: Rea
Purpose
This office represents one of STRLDi’s defining institutional innovations.
Its responsibility is to ensure that learning is never left to chance.
Every project, meeting, workshop, partnership and research assignment generates experience. Unless that experience is intentionally examined, documented and shared, valuable insight is easily lost.
The Office of Institutional Learning & Reflection ensures that individual experiences become collective knowledge and that collective knowledge becomes enduring institutional capability.
It also serves as the steward of the Institute’s Five Institutional Stewardship Platforms, embedding the disciplines of knowledge, learning, partnership, innovation and systems thinking across all areas of STRLDi.
Key Responsibilities
Facilitate organisational reflection.
Capture institutional learning.
Identify recurring organisational patterns.
Produce learning reviews and institutional insights.
Steward the Five Institutional Stewardship Platforms.
Promote continuous organisational improvement.
Build institutional memory.
Support knowledge sharing across all pillars.
Key Result Areas
Organisational learning.
Institutional memory.
Continuous improvement.
Knowledge integration.
Strengthened organisational capability.
4. Executive Secretariat
Current Steward: Rea
Purpose
The Executive Secretariat provides the coordination discipline that enables effective institutional leadership.
By ensuring that meetings are purposeful, decisions are documented and commitments are followed through, the Secretariat creates the organisational coherence required for a learning institution to function effectively.
Its work extends beyond administration. It enables organisational rhythm, accountability and continuity.
Key Responsibilities
Coordinate executive meetings.
Prepare agendas and documentation.
Record decisions and institutional commitments.
Monitor action plans.
Coordinate Executive Director correspondence.
Support Advisory Council operations.
Maintain institutional records.
Key Result Areas
Governance effectiveness.
Executive coordination.
Decision tracking.
Organisational discipline.
Institutional continuity.
5. Corporate Operations & Services
Future Appointment
Purpose
Corporate Operations & Services provides the operational foundation upon which STRLDi’s mission is sustained.
Its role is to ensure that organisational systems, financial resources, people, technology and administrative processes function efficiently, ethically and professionally.
Rather than being viewed as a support function alone, Corporate Operations is recognised as an essential contributor to institutional resilience and long-term sustainability.
Core Functions
Human Resources
Building organisational capability through recruitment, performance development, wellbeing and professional growth.
Finance & Financial Stewardship
Managing budgeting, financial reporting, revenue, investments and long-term financial sustainability.
Administration
Providing administrative systems, facilities management and operational coordination.
Procurement
Ensuring transparent, efficient and accountable acquisition of goods and services.
Information & Digital Services
Supporting information technology, cybersecurity, digital platforms and organisational systems.
Leadership & Institutional Stewardship is not separate from the Institute’s work; it is the mechanism through which that work remains coherent and sustainable.
The Executive Director provides strategic direction.
The Advisory Council strengthens long-term institutional thinking.
The Office of Institutional Learning & Reflection ensures that knowledge generated through every engagement contributes to organisational capability.
The Executive Secretariat translates decisions into coordinated action.
Corporate Operations & Services provides the systems, resources and governance that enable the Institute to function effectively.
Together, these offices create the conditions under which STRLDi can continually increase its capacity to understand persistent issues, develop leaders, build partnerships and contribute meaningfully to national and regional transformation.
Key Result Areas of the Pillar
The Leadership & Institutional Stewardship Pillar will be considered successful when it consistently:
Stewards STRLDi’s vision, values and institutional purpose.
Builds a financially sustainable and professionally managed Institute.
Strengthens organisational capability through disciplined learning and reflection.
Maintains effective governance, accountability and ethical practice.
Protects the Institute’s knowledge, reputation and intellectual assets.
Develops organisational systems that enable excellence across all three pillars.
Ensures that STRLDi remains an enduring learning institution capable of serving future generations.
Building a Learning Institution for National and Regional Transformation
Introduction
The Systems Thinking Research & Leadership Development Institute (STRLDi) was established from a simple but profound observation: persistent issues do not disappear simply because more effort is applied to them.
Around the world, governments, businesses and communities continue to invest significant resources in addressing unemployment, food insecurity, institutional underperformance, environmental degradation and other complex challenges. Yet many of these issues continue to reappear, often in different forms, despite successive policy reforms, organisational restructuring and increased investment.
The question, therefore, is not whether people care enough or work hard enough.
The question is whether we are working with an adequate understanding of the systems producing these outcomes.
STRLDi exists to help leaders and institutions answer that question.
Unlike conventional consulting firms that begin with recommendations, or academic institutions that often conclude with research, STRLDi was established to accompany institutions throughout the complete journey of systemic transformation—from understanding persistent issues, to building leadership capability, to coordinating collective action, and ultimately to strengthening the capacity of societies to learn and renew themselves.
This philosophy demanded a different kind of institution.
Rather than organising itself around traditional departments, STRLDi has been intentionally designed as a learning institution, where research, leadership development, partnerships and institutional learning continually reinforce one another. Every engagement contributes not only to the work of a client, but also to the continuing growth of the Institute itself.
The architecture presented here describes how STRLDi fulfils that purpose.
An Institution Designed to Learn
Many organisations are designed primarily to deliver services.
Others are designed to administer programmes.
STRLDi has been designed to continuously increase its capacity to understand, learn, and contribute to systemic transformation.
Research informs leadership development.
Leadership development strengthens Strategy Steward Labs.
Knowledge is continuously captured, reflected upon, and shared.
This creates reinforcing cycles through which the Institute becomes progressively more capable of serving governments, organisations and communities over time.
The architecture therefore reflects not merely an organisational structure, but a philosophy of institutional learning.
The Three Institutional Pillars
The work of STRLDi is organised through three mutually reinforcing institutional pillars.
Each pillar fulfils a distinct responsibility while remaining deeply interconnected with the others.
Together they enable the Institute to generate knowledge, develop leadership capability, build strategic relationships and sustain its long-term contribution to society.
Pillar I
Leadership & Institutional Stewardship
Every enduring institution requires stewardship.
Leadership & Institutional Stewardship exists to safeguard the Institute’s purpose, strengthen its organisational capability and ensure that STRLDi remains a disciplined learning institution throughout its development.
This pillar provides executive leadership, institutional governance, organisational development, financial stewardship and operational excellence. More importantly, it cultivates the culture through which reflection, learning and continuous improvement become everyday organisational practice.
Working alongside executive leadership is the Advisory Council, whose role is not to manage the Institute but to provide wisdom, independent perspective and constructive challenge as STRLDi continues to evolve.
Within this pillar also sits the Office of Institutional Learning & Reflection, a distinctive feature of STRLDi’s architecture. Rather than limiting organisational learning to project evaluations or annual reviews, this office continually observes the Institute itself—capturing lessons, identifying emerging patterns and ensuring that experience becomes institutional capability rather than remaining individual knowledge.
Supporting these functions is the Executive Secretariat, responsible for coordinating executive governance, preparing meetings, recording decisions and ensuring that organisational commitments are translated into disciplined action.
The operational foundation of the Institute is provided through Corporate Operations & Services, integrating finance, human resources, administration, information technology, procurement and organisational support into one coherent service that enables every other part of the Institute to function effectively.
Leadership & Institutional Stewardship ensures that STRLDi not only delivers quality work, but continually develops the organisational capability required to sustain that work for generations to come.
Pillar II
Client Solutions & Delivery
Client Solutions & Delivery represents the point at which STRLDi’s purpose becomes tangible.
It is through this pillar that governments, institutions and organisations engage the Institute to better understand persistent issues, strengthen leadership capability and develop coordinated responses to systemic challenges.
Every engagement begins with Research & Systems Diagnostics, where issues are explored through Behaviour Over Time analysis, systems thinking, systemic archetypes and STRLDi’s evolving methodologies for understanding persistence.
Research provides the foundation upon which meaningful intervention becomes possible.
Research is followed by Leadership Development, where leaders develop the disciplines required to think systemically, challenge assumptions, build shared understanding and cultivate learning within their own institutions.
Understanding alone, however, is insufficient.
The third component, Strategy Steward Labs, brings together leaders from across sectors to jointly translate systemic understanding into coordinated implementation. Rather than facilitating isolated workshops, these laboratories enable diverse actors to work together on the systems they collectively influence.
The Institute’s work is continually strengthened through Monitoring, Evaluation & Learning, ensuring that implementation generates new insight and that future engagements benefit from the lessons of previous work.
Supporting all of these activities is the Digital Knowledge Platform, which preserves research, methodologies, publications and institutional learning as a living repository available to future generations of practitioners and researchers.
As STRLDi continues to mature, this pillar will expand through the establishment of the Office of Policy, Strategy & National Transformation, translating research and implementation learning into national policy frameworks, strategic advisory services and long-term institutional transformation programmes.
Future international delivery will be coordinated through the Office of International Programmes, enabling the Institute to serve governments and institutions across Africa and beyond while remaining grounded in the same disciplined approach to systemic inquiry and learning.
Together, these capabilities transform understanding into leadership, leadership into coordinated action, and coordinated action into enduring institutional learning.
Pillar III
Strategic Partnerships & Growth
Persistent issues do not exist within organisational boundaries.
Neither should the relationships required to address them.
Strategic Partnerships & Growth exists to cultivate the institutional ecosystem through which STRLDi’s mission can flourish.
Its work extends far beyond conventional marketing or business development. It builds trusted relationships with governments, private sector leaders, development partners, public enterprises, universities, professional bodies, traditional leadership and regional institutions. These relationships become the foundation upon which research, leadership development and Strategy Steward Labs are commissioned and sustained.
Within this pillar, specialised partnership portfolios ensure that every major constituency receives dedicated stewardship while remaining connected to the broader mission of the Institute.
The pillar also coordinates proposal development and resource mobilisation, ensuring that opportunities are translated into funded programmes and long-term institutional partnerships.
Through Communities of Practice, professionals working across similar fields continue learning together beyond individual projects, creating enduring networks of inquiry and practice.
The Membership Office, to be established as the Institute grows, will cultivate long-term relationships with practitioners, institutions, fellows and supporters who wish to contribute to STRLDi’s ongoing development and learning community.
National, regional and international conferences, seminars and strategic dialogues provide opportunities for collective reflection, cross-sector learning and the emergence of new partnerships.
Knowledge generated by the Institute is shared through Knowledge & Public Engagement, ensuring that research, publications and institutional learning contribute to wider public understanding of persistent issues and systemic transformation.
Strategic Partnerships & Growth therefore builds more than relationships.
It builds the trust, reputation and institutional capital through which STRLDi’s work continually expands in influence, relevance and impact.
The Five Institutional Stewardship Platforms
Running across all three pillars are five enduring institutional disciplines.
These are not departments.
They are the principles through which every part of STRLDi operates and learns.
Knowledge Stewardship ensures that every project, publication, dialogue and experience contributes to the Institute’s growing body of knowledge.
Learning Stewardship embeds disciplined reflection into everyday practice, encouraging individuals and teams to continually strengthen their understanding and capability.
Partnership Stewardship recognises that relationships are among the Institute’s most valuable assets and that every member of STRLDi contributes to building trust and collaboration.
Innovation Stewardship encourages thoughtful experimentation, methodological development and continuous improvement while remaining grounded in disciplined inquiry.
Systems Stewardship maintains the Institute’s unwavering attention on the larger systems within which organisations, communities and nations operate, ensuring that immediate activities remain aligned with long-term transformation.
These five stewardship platforms are coordinated through the Office of Institutional Learning & Reflection, helping the Institute continually strengthen its practice while remaining faithful to its founding purpose.
The STRLDi Commitment
Institutions shape societies.
The quality of those institutions depends not only on the knowledge they possess, but on their willingness to continue learning.
STRLDi has therefore been designed not simply to conduct research, deliver training or facilitate strategic dialogue.
It has been designed to become an institution that continually increases its own capacity to understand persistent issues, develop leaders, strengthen partnerships and contribute meaningfully to the transformation of nations and communities.
Its architecture reflects this commitment.
Its people give life to it.
Its work continually refines it.
And its purpose remains unchanged:
To help leaders, institutions and nations learn to see the systems they are part of—so that together they may build societies that are more resilient, more productive, more just and more capable of renewing themselves for generations to come.
Related Links:
Pillar I: The Leadership & Institutional Stewardship Pillar of STRLDi focuses on ensuring the Institute’s long-term sustainability and growth through strategic direction, effective governance, and continuous learning. It emphasizes stewardship alongside leadership, fostering an organizational culture that enhances capability and resilience to adapt to change, ultimately aiming for national and regional transformation. https://sheilasingapore.blog/2026/07/06/pillar-i/
Pillar 2: The purpose of Client Solutions & Delivery is to help governments, organisations, development partners and communities understand and respond effectively to persistent issues that continue to resist conventional approaches.
Many institutions invest significant financial, human and political resources in addressing national and organisational challenges. Yet despite these investments, many issues continue to recur, often becoming more deeply embedded over time. This persistence suggests that the difficulty lies not only in implementation, but in the way the problem itself is understood.
Pillar 3: The Strategic Partnerships & Growth Pillar exists to build, steward, and strengthen the relationships through which STRLDi fulfils its mission.
Persistent national and regional issues rarely exist within the boundaries of a single organisation, ministry or profession. They emerge through the interaction of many actors whose decisions, priorities, and actions continually influence one another. For this reason, meaningful transformation depends as much on the quality of relationships as on the quality of technical solutions.
STRLDi therefore views partnership development not as an activity undertaken after research is completed or programmes are designed. Partnership is itself a strategic capability. It enables diverse institutions to discover shared purpose, develop mutual trust and mobilise collective action around issues that no single organisation can address independently.
This pillar cultivates the institutional ecosystem within which STRLDi’s research, leadership development, and strategy stewardship can flourish. It identifies opportunities for collaboration, develops long-term institutional relationships, mobilises resources, and creates the conditions for the continual exchange of knowledge across sectors, disciplines and national boundaries. https://sheilasingapore.blog/2026/07/07/pillar-iii/
Institutional Roles: The work of STRLDi is organised through three institutional pillars, each carrying a distinct responsibility while contributing to one integrated learning institution. Together they ensure that STRLDi continually strengthens its capacity to understand persistent issues, develop leaders, build partnerships and steward long-term transformation.
At this stage of the Institute’s development, several leaders carry responsibilities across more than one pillar. This reflects STRLDi’s deliberate approach to institution building, where leadership grows alongside organisational capability. As the Institute expands, these responsibilities will progressively mature into dedicated offices and specialist appointments. https://sheilasingapore.blog/2026/07/07/the-strldi-institutional-roles/
Based on the provided sources, the table for the geography of Southern Africa is detailed below, followed by an analysis of the region’s production relative to its land share.
Indicator
Southern Africa (SADC)
Africa
World
Share of Africa
Share of World
Countries
16
54
195
29.6%
8.2%
Land Area (km²)
9.87 million
30.37 million
148.94 million
32.5%
6.6%
Coastline (km)
Stretches thousands of km
—
—
—
—
Arable Land
~76.9 million ha (Potential)*
—
—
—
—
Irrigated Land
3.4 million hectares
—
—
—
—
*Calculated based on projections that increasing irrigation to 10 million hectares would reach 13% of the region’s potential. Currently, less than 5% of cultivated land in the SADC region is equipped for irrigation.
Immediately this raises a structural question:
One-third of Africa’s land sits in Southern Africa. Is one-third of Africa’s production located here?
The sources indicate a complex and paradoxical economic landscape that suggests the region’s share of production does not currently match its massive land share:
Under-indexing in Growth: Southern Africa is currently recorded as the slowest-growing region on the continent. While the continent’s average real GDP growth was estimated at 4.2% in 2025, Southern Africa’s growth was estimated at only 2.0%.
Concentration of GDP: Africa’s GDP is heavily concentrated in four major economies—Egypt, Kenya, Nigeria, and South Africa—which together account for 52% of the continent’s total production. Because three of these four “giants” (Nigeria, Egypt, and Kenya) are located outside of Southern Africa, the SADC region likely contributes less than one-third of the total continental production despite its land area.
Poverty and Imbalance: The region is characterized by significant economic imbalances and high poverty levels, with nearly 45% of the total population living on less than one US dollar per day. Many economies in the region remain small, little-diversified, and hindered by structural constraints like electricity shortages and logistics bottlenecks.
Resource Wealth vs. Realized Output: Despite the slow growth, the region holds immense unrealized potential. It is described as one of the wealthiest regions of Africa in terms of minerals, holding significant portions of the world’s platinum, cobalt, and chromium. Furthermore, South Africa alone produces 17% of all maize in Africa and the region contains four of the five most-forested countries on the continent (DRC, Angola, Zambia, and Mozambique).
Summary: While Southern Africa possesses a vast portion of the continent’s natural capital and more developed infrastructure than other sub-regions, its actual economic output is currently held back by slow growth rates and structural dependencies, leaving it short of a one-third share of Africa’s total production.
B. Population
The following table has been constructed using statistics found within the sources where available (primarily for 2010–2020) and supplemented by standard historical estimates for earlier periods.
Year
Southern Africa (SADC)
Africa
World
% Africa
% World
1900*
~33 million
~100 million
~1.6 billion
~33%
~2.1%
1910*
~38 million
~110 million
~1.75 billion
~34%
~2.2%
1920*
~43 million
~120 million
~1.86 billion
~36%
~2.3%
1930*
~51 million
~140 million
~2.0 billion
~36%
~2.5%
1940*
~61 million
~165 million
~2.3 billion
~37%
~2.6%
1950*
~75 million
~227 million
~2.5 billion
~33%
~3.0%
1960*
~94 million
~285 million
~3.0 billion
~33%
~3.1%
1970*
~120 million
~365 million
~3.7 billion
~33%
~3.2%
1980*
~158 million
~480 million
~4.4 billion
~33%
~3.6%
1990*
~208 million
~630 million
~5.3 billion
~33%
~3.9%
2000*
~267 million
~810 million
~6.1 billion
~33%
~4.4%
2010
≈277 million
≈1.05 billion
≈6.9 billion
≈26.4%
≈4.0%
2020
≈420 million
≈1.55 billion
≈8.2 billion
≈27%
≈5.1%
*Data for 1900–2000 and certain global/continental totals are not explicitly provided in the source material and are based on standard historical demographic records; you may want to independently verify these specific historical figures.
Questions:
Is the population growing faster than productive capacity?Yes. The sources indicate a significant gap between demographic growth and the expansion of productive capacity:
Capital-Shallowing: While public and private investments have increased, they have lagged behind the rapid expansion of the labor force. This has led to “capital-shallowing”—a decline in capital per worker—meaning economic activities have become less capital-intensive over time.
Productivity Gap: Africa’s productive capacity index (31.7) remains well below the world average (47.3), and labor productivity has diverged sharply from regions like East Asia.
Food Security Constraints: The region must increase food production by 1–2% annually just to keep pace with population growth, yet it currently fails to produce enough to feed its current 277 million inhabitants.
Is labour absorption keeping pace?No. The structural transformation of regional economies has not matched the pace of population growth and urbanization:
Urbanization Without Development: Urban populations have surged (from 15% in 1960 to 40% in 2010), but this growth occurred with little change in economic structure, a process the United Nations describes as “urbanisation without development”.
High Unemployment: Youth unemployment and informal employment have become “everyday features” of the region’s cities. In South Africa, unemployment reached a staggering 34.9% in late 2021.
Growth of Slums: Because formal employment creation is insufficient, rapid urban growth has been absorbed by unplanned informal settlements and urban slums. In some SADC nations like Madagascar and Malawi, nearly 70% or more of urban dwellers live in slums.
C. Natural Resource Base
The following table details the Natural Resource Base of Southern Africa (SADC) based on the sources. This is followed by an analysis of the region’s resource wealth compared to its current economic outcomes.
Resource
Southern Africa (SADC) Share / Status
Platinum
Holds the world’s largest resources of platinum and platinum group elements.
Diamonds
Extensive deposits; major production hubs in Botswana and Namibia.
Gold
Widespread deposits; a key driver of current growth in Zimbabwe and commissioning of new mines in the region.
Copper
Home to the “Copper Belt” in Zambia and the Democratic Republic of Congo (DRC).
Coal
Major deposits in South Africa, Zimbabwe, and Mozambique; coal accounts for 59% of the region’s electricity generation.
Uranium
Extensive resources; Namibia has significant uranium processing potential.
Rare Earths
High global demand for regional “critical minerals” (e.g., lithium, cobalt) central to battery and EV production.
Agricultural land
Occupies ~32.5% of Africa’s land area, though 75% is classified as arid or semi-arid.
Freshwater
The region retains only 14% of its available renewable water resources; 86% flows to the sea.
Question:
How resource-rich is Southern Africa compared with its economic outcomes?
The sources reveal a stark contrast between the region’s immense natural capital and its actual economic performance, often referred to as a “resource paradox”:
Extreme Wealth, Slowest Growth: Southern Africa is described as one of the wealthiest regions of Africa with the “greatest potential for economic growth” due to its minerals. However, it currently records the slowest real GDP growth on the continent (estimated at only 2.0% in 2025 compared to the 4.2% continental average).
Persistent Poverty: Despite being the source of a significant portion of the world’s platinum, cobalt, and chromium, the region is among the poorest globally. Nearly 45% of the total population lives on less than one US dollar per day.
Highest Global Inequality: While resource exports generate significant revenue, the benefits are not broadly shared. Southern Africa contains the most unequal countries in the world, with South Africa ranking first globally in income inequality (Gini index of 67).
Infrastructure and Energy Gaps: Although the region is rich in energy-producing resources (coal, hydro, and gas), it suffers from massive electricity shortages and logistics bottlenecks. Less than 45% of the population in most SADC countries has access to electricity.
The Beneficiation Gap: The region has historically acted as a supplier of raw materials rather than a manufacturing hub. Leaders at the SACU summit recently noted that industrialization and beneficiation (processing minerals locally) is the only “durable path” to move away from commodity dependence and sustain growing populations.
Summary: Southern Africa possesses the natural capital to be a global economic powerhouse, yet its current outcomes are defined by stagnant growth, high unemployment, and the world’s highest levels of inequality, largely due to structural constraints and a historical lack of local value addition.
D. GDP
Based on the provided source material, the aggregate nominal GDP in US$ billions for the entire Southern African (SADC) region for the historical years (1960–2010) is not explicitly provided in a single summary table. However, the sources provide detailed growth performance, per capita income ranges for specific member states, and continental economic context that allow for the following construction of the table and related analysis.
Year
GDP (SADC) (US$ bn)
GDP per Capita (SADC Avg / Representative)
1960
To compile
Range: ~$394 (Lesotho) to ~$531 (Botswana)*
1970
To compile
Range: ~$991 (Lesotho) to ~$1,521 (Botswana)*
1980
To compile
Average per capita income for high-growth periods cited
1990
To compile
Range: ~$2,950 (Botswana) for 1981–90 period
2000
To compile
Range: ~$6,937 (Botswana) for 1991–2000 period
2010
To compile
SADC growth rate was approximately 6%
2020
~$700–800bn (Est.)**
Sub-Saharan Africa per capita growth was 1.1% in 2024
2025
~$850bn+ (Est.)***
Real GDP Growth Estimated at 2.0%
*Figures represent 10-year average per capita income for those specific decades for representative SADC nations found in the sources.**Calculated based on Africa’s total GDP being approximately $2.4–3.0 trillion (derived from debt/GDP ratios) and the fact that South Africa, the region’s dominant economy, is one of four “giants” that together produce 52% of the continent’s output.***Projected based on the region’s current real GDP growth rate of 2.0% (2025) and projected increases to 2.4% (2026) and 2.6% (2027).
Key Insights on Regional Production:
Growth Paradox: Southern Africa is currently recorded as the slowest-growing region on the continent. While the average growth for Africa in 2025 was estimated at 4.2%, Southern Africa’s growth was only 2.0%, hindered by structural constraints, electricity shortages, and logistics bottlenecks.
The “Giant” Effect: Africa’s GDP is heavily concentrated. Four economies—Egypt, Kenya, Nigeria, and South Africa—account for 52% of the continent’s total production. Because South Africa is the dominant economy in the SADC region, the regional GDP is highly sensitive to South Africa’s “sluggish” growth, which was estimated at only 1.0% in 2025.
Sectoral Drivers: On the supply side, the service sector is the primary driver of regional growth, accounting for more than half of recent GDP expansion (2.4% of the 4.2% total for the continent). Agriculture and industry have improved slightly but remain vulnerable to climate-induced shocks and low productive capacity.
Wealth Disparity: While some SADC nations like Botswana and Seychelles have reached upper-middle or high-income status, others like Malawi and Mozambique remain in the low-income group with high poverty levels. Nearly 45% of the total SADC population currently lives on less than one US dollar per day.
Transformation Requirements: The sources note that Africa (including the SADC region) needs sustained annual growth of at least 7% for a decade to achieve true structural transformation and significant poverty reduction. Currently, the region is far below this threshold.
E. GDP by Sector
Based on the provided sources, the table for GDP by Sector in Southern Africa (SADC) has been constructed to reflect the “Behaviour Over Time” as described in the regional economic assessments.
While specific US$ billion figures for every sector in every historical year are not aggregated into a single source table, the material provides percentage shares, growth drivers, and structural shifts that define the region’s economic evolution from 1960 to 2025.
Year
Agriculture
Mining
Manufacturing
Construction
Utilities
Transport
Finance
Government
Other Services
1960
~25-30%
High
Emerging
To compile
To compile
To compile
To compile
To compile
To compile
1970
Major Driver
Peak
Growth phase
To compile
To compile
To compile
To compile
To compile
To compile
1980
~15-20%
Major
Mature (SA)
To compile
~10% (Est.)
To compile
To compile
To compile
To compile
1990
Volatile*
Major
Struggling
Growth (SA)
To compile
To compile
Emerging
To compile
To compile
2000
~10-15%
Robust
Decline**
To compile
To compile
To compile
Flourishing
To compile
To compile
2010
~4-27%***
Robust
Stagnant
High (SA)
To compile
To compile
Dominant
To compile
To compile
2020
~10% (Avg)
~15-20%
~12% (SA)
~4% (SA)
~2% (SA)
~9% (SA)
~20%+
~18% (SA)
~50%+ (Total)
2025
Recov.**
Growth**
Sluggish
Sluggish
Shortage
Bottleneck
Dominant
High
Lead Driver
*Affected by 1991/92 severe regional drought.**Zimbabwe and South Africa began seeing significant deindustrialization in the 1990s due to globalization.***Current SADC sector range: Agriculture contributes between 4% and 27% of regional GDP.****2025 recovery in Zambia and Zimbabwe is specifically underpinned by Mining and Agriculture.
Insights into Behaviour Over Time:
The Service Sector Transition: On the supply side, the service sector has become the dominant driver of regional GDP. In recent years, services accounted for more than half of the continent’s growth (2.4% of the 4.2% total growth in 2025). This is particularly true in South Africa, which has “mature and flourishing” financial and retail sectors.
The “Resource Paradox” in Mining: While mining remains a core pillar—especially in the Copper Belt (Zambia/DRC) and the gold fields of Zimbabwe—the sources note that these resource-rich economies have not consistently achieved sustained income convergence despite commodity booms.
Deindustrialization of Manufacturing: The region developed a robust manufacturing sector in the mid-20th century (centered in South Africa and Zimbabwe), but since the 1990s, these industries have struggled against cheaper imports and global competition. Zimbabwe, in particular, has seen significant deindustrialization.
Infrastructure and Utilities Constraints: Construction and Utilities (specifically energy) are currently seen as bottlenecks rather than drivers. The region faces an “energy crisis” due to limited funding and overreliance on polluting coal, with less than 45% of the population having access to electricity.
Agriculture’s Vulnerability: While more than half of the region’s adult population is employed in agriculture, its contribution to GDP is highly volatile due to its dependence on rain-fed systems and susceptibility to climate-induced shocks. For example, the 1992 drought caused Zimbabwe’s GDP to decline by 11% and manufacturing output to drop by 9%.
Finance as a Modern Anchor: The financial sub-sector is noted as a key reason for the service sector’s dominance in 2025, alongside easing inflationary pressures.
F. Employment
Based on the provided sources, the table for Employment in Southern Africa (SADC) has been constructed to reflect the regional shifts in labor absorption and the growth of informal systems. While specific historical headcounts for every sector across all years are not aggregated into a single table in the sources, the material provides sectoral shares, trends, and specific structural challenges that define the regional employment landscape.
Year
Agriculture
Mining
Manufacturing
Government
Services
Informal
1960
Dominant
High
Growing
Emerging
Emerging
To compile
1970
Major
High
Growth phase
Stable
Growing
To compile
1980
Major
Stable
Peak (SA/Zim)
Expanding
Expanding
To compile
1990
~50%+
Sluggish
Decline*
Expanding
Robust
Surging
2000
~50%+
Limited
Struggling
High
Dominant
High
2010
~50%+ (Avg)
Minimal
Sluggish
High
Lead Driver
High
2020
~50%+**
Limited
Sluggish
High
Lead Driver
Highest*
2025
Vulnerable
Minimal
Sluggish
High
Dominant
Proliferating
*SADC manufacturing (specifically in South Africa and Zimbabwe) began facing significant deindustrialization and job losses in the 1990s due to globalization and cheaper imports.**While more than half of Africa’s adult population remains employed in agriculture, these jobs are highly vulnerable to climate-induced shocks.***Urbanization has largely occurred without a corresponding shift in economic structure, leading to what the UN calls “urbanisation without development,” where rapid urban growth is absorbed primarily by the informal sector and urban slums.
Questions:
Which sectors absorb labour?
Agriculture: This remains the primary employer in the region, with more than half of the adult population depending on it for their primary source of income and subsistence.
Services: This has become the dominant driver of growth (accounting for 2.4% of the estimated 4.2% GDP growth in 2025) and is a major absorber of labor, particularly in South Africa’s mature financial and retail sectors.
Informal Sector: Due to a lack of formal job creation, the informal sector absorbs a massive portion of the regional workforce. Informal employment and youth unemployment are described as “everyday features of African cities“.
Which sectors are shrinking?
Manufacturing: This sector has been in a state of significant deindustrialization since the 1990s. Heavy industry, textiles, and manufacturing hubs in South Africa and Zimbabwe have struggled against cheaper imports from China, leading to substantial job losses.
Traditional Industry: The sources note that industrial productivity is low (Africa’s productive capacity index is only 31.7) and characterized by “minimal job creation” and weak linkages to the rest of the economy.
Which sectors create wealth without creating employment?
Mining and Extractives: While mining makes this one of the wealthiest regions in terms of potential, it often creates wealth that does not translate into broad-based employment. For example, in Angola, oil exports attracted significant foreign capital and created wealth for Luanda, but the impact on employment has been limited.
Commodity Exports: The sources describe a “resource paradox” where resource-rich economies (like Angola, Gabon, and Libya) record high per-capita incomes during booms, yet often fail to achieve sustained income convergence or large-scale job creation due to a lack of local value addition (beneficiation).
G. Trade
Based on the sources provided, the following table for Trade in the Southern African (SADC) region has been constructed. While the source material primarily focuses on recent and projected performance (2020–2027), historical trends have been inferred from the regional economic descriptions and structural assessments.
Year
Imports (SADC) (US$ bn)
Exports (SADC) (US$ bn)
Net Trade (Trade Balance)
1960
To compile
To compile
Surplus (Resource Booms)
1970
To compile
To compile
Peak Surplus
1980
To compile
To compile
Surplus (Mining)
1990
To compile
To compile
Volatile (Drought Impacts)*
2000
~$150bn (Est.)
~$165bn (Est.)
Surplus (~$15bn)
2010
~$210bn (Est.)
~$230bn (Est.)
Surplus (~$20bn)
2020
~$260bn (Est.)
~$240bn (Est.)
Deficit (~$20bn)
2025
~$300bn+ (Est.)**
~$280bn+ (Est.)**
Deficit (~2.5% of GDP)*
*The 1991/92 drought required the importation of 11.4 million tonnes of cereal, significantly impacting trade balances.**Africa’s overall trade deficit was 3.0% of GDP in 2025, and Southern Africa’s current account deficit was estimated at 2.5% of GDP for the same year.
Derived: Trade Per Citizen (2020–2025 Analysis)
Note: Calculations use the regional population estimate of ≈420 million for 2020 and a projected ≈450 million for 2025 [Previous Turn, 114].
Metric
2020 (Est.)
2025 (Proj.)
Imports per citizen
~$619.05
~$666.67
Exports per citizen
~$571.43
~$622.22
Net imports per citizen
$47.62 (Net Importer)
$44.45 (Net Importer)
Insights into Regional Trade Dynamics:
Trade Deficit Drivers: The region’s shift to a net-importing status in recent years is attributed to “subdued external demand” for its primary exports (notably diamonds in Botswana) and persistent “logistics bottlenecks” and “electricity shortages” that hinder production in South Africa.
The Resource Paradox: Southern Africa holds 30% of the world’s mineral reserves, yet its trade performance is vulnerable to global price fluctuations. In 2025, global commodity prices declined by 7.0%, weighing heavily on regional exporters.
Intra-Regional vs. Global Trade: Intra-African trade currently accounts for only 15% of the continent’s total trade. The sources emphasize that implementing the AfCFTA could lift real per capita GDP by more than 10% in the long run by reducing dependencies on extra-continental markets.
The “Nearshoring” Opportunity: While Southern Africa faces slow growth, North African SADC partners and neighbors (like Egypt and Morocco) are seeing export growth through “nearshoring” strategies for European markets, a model SADC aims to emulate through its “Spatial Corridor Development Strategy”.
Exchange Rate Volatility: In 2025, the softening of the US dollar helped mitigate the impact of external shocks, improving the import bill for several nations, though countries like Zimbabwe and Angola continued to face high currency depreciation.
H. Food
Based on the provided sources, the table for Food in Southern Africa (SADC) has been constructed to reflect the region’s transition from agricultural self-sufficiency to a state of net food dependency, particularly during climate-induced shocks.
While precise regional US$ billion aggregates for every decade are not provided in a single source table, the material details cereal tonnages, trade balance trends, and deficit drivers that define the regional food economy.
Year
Food Imports (SADC)
Food Exports (SADC)
Net Food Imports (Balance)
1960
To compile
Significant
Surplus (Regional “Breadbasket”)
1970
To compile
Robust
Surplus
1980
To compile
Stable
Surplus / Balance
1990
High (11.4m tonnes cereal)*
Reduced
Large Deficit (~$200m+ in aid)*
2000
Increasing
South Africa Dominant
Negative Trade Contribution
2010
High (~3.9m tonnes cereal)
South Africa Dominant
Net Importer
2020
Surging (~7.9m tonnes cereal)**
Vulnerable
Structural Deficit
2025
Estimated Recovery*
Growth Projected
Narrowing Deficit (Proj.)
*The 1992 regional drought forced the importation of 11.4 million tonnes of cereal; WFP provided $200 million in aid for Mozambique alone.**The 2015/16 drought resulted in an overall regional cereal deficit of 7.90 million tonnes.***2025 estimates indicate a rebound in regional cereal production due to favorable weather conditions and a 7.0% decline in the global food price index.
Questions:
How dependent has Southern Africa become on imported food? The region has become structurally dependent on imported food to meet the needs of its growing population:
Production Gap: Southern Africa is currently not producing enough food to provide for its current population (estimated at 277 million in 2010 and projected to exceed 300 million by 2025).
Vulnerability to Shocks: With 97% of total cropland in sub-Saharan Africa being rain-fed, regional food security is highly susceptible to climate variability. During the 1992 drought, 70% of crops failed, necessitating massive emergency imports.
Rising Requirement: To keep pace with population growth, the region must increase overall production by at least 1% to 2% per annum.
Economic Impact: The sources note a consistent trend of “agriculture’s negative contribution to the trade balance,” indicating that food imports frequently outweigh export revenues for most SADC nations, with the notable exception of South Africa.
Which commodities dominate imports? The regional import bill is primarily dominated by staple cereals required to offset domestic production shortfalls:
Maize: As the primary staple food for most of the population, maize is the dominant import, particularly during drought years when yields in countries like Zimbabwe and Zambia collapse.
Wheat: A major cereal that is highly vulnerable to periods of drought; over 53% of regional wheat is produced under dryland conditions, necessitating imports when rains fail.
Sorghum: Along with maize and wheat, sorghum is one of the “most produced cereals” and major staple foods that the region struggles to supply consistently.
Livestock Feed: Major shifts in dietary patterns toward meat and animal products are driving an increased demand for imported feed to support regional livestock production.
I. Productivity
Based on the data derived from the regional economic outlooks and the structural assessments provided in the sources, the following table details the Productivity metrics for Southern Africa (SADC). These values reflect the 2025 projections and representative sectoral shares discussed in our conversation history.
This section reveals the gap between the region’s vast natural potential and its realized economic output per inhabitant.
Indicator
Value (SADC 2025 Proj. / Representative)
GDP per citizen
~$1,888 (Estimated)*
Manufacturing GDP per citizen
~$151 (Based on ~8% regional share)**
Agricultural GDP per citizen
~$189 (Based on ~10% regional share)***
Export value per citizen
~$622.22 [Turn 10]
Import value per citizen
~$666.67 [Turn 10]
Electricity generated per citizen
~132 Watts (Operating Capacity)****
Formal jobs per 1,000 citizens
Struggling (Driven by ~80–90% Informality)*****
*Calculated based on a projected regional GDP of $850bn+ and a population of ~450 million [Turn 5, 114, 266].**Reflects the “significant deindustrialization” noted in the region since the 1990s [Turn 9, 808].***While more than half the adult population is employed in agriculture, its per-citizen value is low due to the prevalence of “subsistence or smallholder” systems.***Derived from the Southern African Power Pool (SAPP) operating capacity of 47.7 GW serving 360 million people.*****Reflects the “urbanisation without development” phenomenon where rapid growth is absorbed primarily by the informal sector and urban slums rather than formal employment.
Revelations on Productivity:
The Global Divergence: The sources reveal a sharp divergence in productivity. While African workers were 40–45% more productive than those in East Asia in the 1960s, East Asian workers are now 3 to 10 times more productive than their African counterparts.
The “Capital-Shallowing” Trap: Despite increased investment, the region faces “capital-shallowing”—a decline in capital per worker—meaning economic activities have become less capital-intensive over time.
The Productive Capacity Deficit: Africa’s overall productive capacity index is estimated at only 31.7 of 100, far below the world average of 47.3. The region performs particularly poorly in ICT (7.3) and Energy (22.1), which are the primary enablers of industrial output.
Unrealized Human Capital: Many children in the region will reach only 40% of their potential productivity as adults due to current gaps in education and healthcare.
Infrastructure Shaving Growth: Poor infrastructure is estimated to shave off at least 2% of potential per-capita growth every year, further depressing the productivity figures shown above.
J. Innovation
Based on the provided sources, the following table for Innovation in Southern Africa (SADC) summarizes the regional performance. While specific numerical headcounts for these indicators are not aggregated for the entire region in the source material, the assessments provide a clear picture of a significant gap between current capacity and global benchmarks.
Indicator
Value / Status in Southern Africa
Engineers per million
Critical Shortage: The region faces a severe “skills and capacity shortage” in technical and engineering fields required for infrastructure development.
Researchers per million
Lagging: The region “largely lags behind their Asian counterparts” in research and development. Agricultural research specifically suffers from “low funding”.
STEM graduates
Under-indexing: Southern Africa lags in “STEM sciences”. High-growth potential is hampered by “high emigration among skilled workers,” leading to a significant regional brain drain.
Patents
Low Output: Innovation is cited as a major area where the region falls behind global competitors. Industrialization is currently defined more by raw material supply than local innovation.
Scientific publications
Below Global Average: Using climatic reporting as a proxy, the region produces significantly fewer scientific reports than the global average (e.g., 19 climatology reports per year in SADC vs. 73 globally).
Insights into the Innovation Landscape:
The Global Divergence: The sources indicate that Southern Africa is not yet a global innovation hub. While moderately successful by African standards, it lacks the “STEM sciences and research and development” momentum seen in Asian tiger economies.
Human Capital Deficit: The World Bank’s Human Capital Index (HCI) reveals that children born in many parts of the region will reach only 40% to 43% of their potential productivity as adults due to prevailing gaps in education and healthcare.
Brain Drain Pressures: Nations like South Africa and Zimbabwe face “human capital flight,” losing billions as skilled workers emigrate to Western economies.
The “Suppliers vs. Architects” Question: Regional leaders have noted that the fundamental challenge for the 21st century is whether Southern Africans will be the “architects of development” or remain merely “suppliers of raw materials“.
Productive Capacity Gap: Africa’s overall productive capacity index is only 31.7 of 100, trailing the world average of 47.3. The region performs particularly poorly in ICT (7.3), which is a primary enabler of modern innovation.
Targeted Investment: Recent efforts include SADC awarding scholarships for PhD and MSc students in climate modeling and related sciences to strengthen the institutional capacity of National Meteorological Services (NMS).
K. Regional Integration
Based on the provided sources and conversation history, the following table for Regional Integration in Southern Africa (SADC) outlines the current status of economic cohesion and cross-border development.
Indicator
Value / Status in Southern Africa
Intra-SADC trade (%)
~15–20%: Reflects the continental average for intra-African trade (15%), which remains far below levels seen in Asia (51.1%).
Trade with rest of Africa
Emerging Priority: Deepening integration under the AfCFTA is projected to lift intra-African goods trade by more than 50% and increase regional incomes by 7%.
Trade outside Africa
Dominant (80%+): The region remains a primary supplier of raw materials to global markets, leaving it highly vulnerable to global price shocks and “subdued external demand”.
Regional value chains
Underdeveloped: Current efforts focus on mineral beneficiation, a regional battery value chain, and cross-border component manufacturing for the automotive and mining sectors.
Cross-border infrastructure
Stagnant: Only 5% of planned regional infrastructure projects were completed by 2019. Vital progress is anchored by Spatial Corridors (North-South, Maputo, Beira, Lobito, and Trans-Kalahari) [403, 449, 827–834].
Key Insights on Regional Integration:
The “Re-imagined” Agenda: Leaders have called for a shift from a “traditional customs arrangement” to a platform for economic self-reliance. This involves harnessing Eswatini’s manufacturing, Lesotho’s textiles, Namibia’s green hydrogen, Botswana’s diamond beneficiation, and South Africa’s steel capacity into a unified industrial ecosystem.
Infrastructure as the Bedrock: Regional integration is currently hindered by an infrastructure deficit. Reliable cross-border transport and energy grids (like the Southern African Power Pool) are described as the only path to achieving the 7% annual growth required for structural transformation.
Corridor Consolidation: SADC’s Spatial Corridor Development Strategy focuses on routes that connect industrial hubs with trade gateways. For example, the North-South Corridor serves as the “backbone of regional trade,” connecting the Copper Belt to the port of Durban.
The Energy Integration Leap: While general infrastructure stagnates, energy trade has seen significant growth, rising from 1% of regional operating capacity in 2012 to 24% by 2018 through the SAPP.
Non-Tariff Barriers: Lack of adequate infrastructure is cited as a major non-tariff barrier to trade. Poor quality infrastructure services can increase the input costs of consumer goods by up to 200% in certain regional nations.
Institutional Misalignment: A critical challenge to integration is the misalignment between national and regional priorities. Member States often prioritize domestic projects over cross-border initiatives, and there is an “unclear delineation of roles” regarding who should act as project sponsors.
L. Regional Container and Port Throughput (Per Annum)
Based on the provided sources, there is no single table that aggregates the total number of containers shipped in and out for the entire Southern African region per annum. However, the sources provide specific port throughput capacities and individual port statuses that define the region’s containerized trade volume.
The following table summarizes the available annual container and port throughput data for major regional gateways mentioned in the sources:
Port / Gateway
Annual Throughput Capacity / Status
Key Trade Function
Port of Durban (South Africa)
Highest-volume freight route on the continent.
Primary gateway for the North-South and Gauteng Corridors; serves the region’s industrial heartland.
Chinese-funded Port Throughput (Africa Total)
85 million tonnes per year (Capacity built/upgraded by Chinese enterprises).
Represents a significant portion of the continent’s expanding shipping infrastructure.
Port of Walvis Bay (Namibia)
New Container Terminal is at an advanced stage.
Serves as an efficient western outlet for Botswana, South Africa, and Zimbabwe via the Trans-Kalahari Corridor.
Port of Beira (Mozambique)
Handles a significant share of regional general cargo and agricultural commodities.
Provides the shortest sea access for landlocked Zimbabwe, Zambia, and the DRC.
Port of Nacala (Mozambique)
Deep-water port suited for larger vessels.
Strategically important emerging route for bulk commodity exports from Malawi and Zambia.
Port of Lobito (Angola)
Key Atlantic outlet for critical minerals.
Anchored by the Benguela Railway to move copper and cobalt from the DRC and Zambia.
Insights into Southern African Container Trade:
The Landlocked Challenge: For several of the region’s largest economies—Zambia, Zimbabwe, Botswana, and the DRC—every container imported or exported must travel overland through a neighboring country to reach these seaports.
Infrastructure Deficits: The region suffers from a “huge infrastructure deficit,” including unreliable transport networks. In some countries, supply chain barriers and freight costs can account for as much as 4% of total revenues for producers, eroding export competitiveness.
Expansion Efforts: SADC’s Short-Term Action Plan (STAP) included major projects to address these bottlenecks, such as the Durban Dig-out Port (expansion) and the construction of dry ports in Tanzania (Kwala-Ruvu, Ihumwa-Dodoma, etc.) to handle inland cargo more efficiently.
Trade Imbalance: While specific container counts are not listed, the region’s overall trade status is currently that of a net importer [Turn 10]. In 2025, Africa’s trade deficit was expected to widen to 3.4% of GDP due to subdued commodity prices and slowing global demand.
Efficiency Gains: The implementation of One-Stop Border Posts (OSBPs), such as those at Beitbridge and Nakonde, is intended to reduce the delays that “often outweigh the transit time” between ports and inland markets.
Organising Management Knowledge by Purpose and Depth of Seeing
Ms Sheila Damodaran
Management literature contains thousands of tools, frameworks, methodologies, standards, and practices designed to help organisations perform, improve, govern, adapt, and grow. These tools are typically organised by professional discipline—finance, operations, strategy, quality, human resources, information technology, or project management. While useful for specialists, such classifications often make it difficult for leaders to understand how these tools contribute to the broader task of organisational learning and transformation.
At the same time, many organisations possess an impressive collection of management tools and yet continue to struggle with persistent issues that repeatedly return in different forms. They measure performance, monitor risk, improve quality, manage projects, control costs, and coordinate operations with increasing sophistication. The challenge is rarely a lack of tools. More often, it is a lack of clarity about what those tools help us see.
This framework takes a different approach. Instead of organising tools by profession, it organises them first by purpose and then by the depth of seeing they enable. The purpose categories reflect the primary work of organisations. Together, they describe the full journey of organisational life—from understanding reality, through action and adaptation, toward long-term renewal.
The Nine Purposes of Management
Level 1 – See
Every organisation must first develop the capacity to observe reality. Seeing includes monitoring performance, understanding conditions, recognising trends, identifying risks, and developing situational awareness. Without seeing, all other activities are based on assumption rather than evidence.
The central question is:
What is happening?
Level 2 – Develop People
Organisations achieve results through people. This level focuses on building capability, leadership, competence, judgement, and learning capacity. It includes recruitment, training, coaching, mentoring, and the cultivation of personal mastery.
The central question is:
Who are we becoming?
Level 3 – Align
Individual effort becomes organisational capability only when people move in a common direction. Alignment creates coherence between purpose, strategy, teams, and stakeholders. It transforms separate activities into collective action.
The central question is:
How do we move together?
Level 4 – Decide
Every organisation faces choices about priorities, investments, risks, trade-offs, and future direction. Decision-making determines where attention, resources, and energy will be focused.
The central question is:
What should we do?
Level 5 – Execute
Execution converts intentions into action. This includes project delivery, operational management, process execution, scheduling, coordination, and the day-to-day work of producing results.
The central question is:
How do we get things done?
Level 6 – Govern & Measure
Organisations must maintain accountability, stewardship, transparency, and control. Governance ensures that actions remain aligned with obligations, standards, responsibilities, and performance expectations.
The central question is:
Are we doing what we said we would do?
Level 7 – Improve
Improvement focuses on increasing effectiveness, efficiency, quality, reliability, and performance. It seeks to reduce waste, strengthen capability, and enhance outcomes through disciplined learning from experience.
The central question is:
How can we do this better?
Level 8 – Adapt
Conditions change. Markets shift. Technologies evolve. Societies transform. Adaptation enables organisations to respond to emerging realities while maintaining relevance and resilience.
The central question is:
What must change?
Level 9 – Renew
Renewal focuses on long-term viability. It concerns the organisation’s ability to regenerate leadership, knowledge, purpose, capability, and direction across time. Renewal ensures that today’s success does not become tomorrow’s limitation.
The central question is:
How do we remain capable of creating value into the future?
Depth of Learning
While the nine levels describe why a tool exists, a second dimension describes how deeply that tool helps us understand reality.
Drawing on the learning disciplines of The Fifth Discipline, tools can contribute to one or more of five levels of seeing:
Level
Question
Event
What happened?
Pattern
What keeps happening?
Structure
What archetypal causal structure is producing the pattern?
Mental Models
What assumptions and beliefs sustain the structure?
Vision
What future are we collectively trying to create?
Most management tools help organisations observe and manage events. Some help leaders recognise patterns over time. A much smaller number help reveal the archetypal structures that generate those patterns. Fewer still help surface mental models or cultivate shared vision.
The tables that follow organise management tools according to both dimensions: their organisational purpose and their depth of seeing.
Reading the Tables
The ticks indicate the primary depth of seeing naturally enabled by a tool. They do not imply that a tool cannot be used more deeply by a skilled practitioner. Rather, they indicate where the tool most naturally contributes to learning and action.
In this framework, Structure refers exclusively to archetypal causal structure—the reinforcing and balancing processes, delays, accumulations, and systemic dynamics that generate behaviour over time. It does not refer to organisational structures, reporting relationships, governance arrangements, methodologies, frameworks, or management systems.
This distinction is important because the framework is grounded in the learning disciplines of The Fifth Discipline. Its purpose is not merely to organise management knowledge, but to help leaders understand how different tools contribute to increasingly deeper levels of seeing, learning, and transformation.
Depth of Learning
because what distinguishes The Fifth Discipline is not seeing alone.
It is the organisation’s capacity to learn from what it sees. That subtle shift brings the framework even closer to Senge’s original intent.
LEVEL 1 — SEE
Domain
Tool
Event
Pattern
Structure
Mental Models
Vision
Finance
Balance Sheet
✓
Finance
Income Statement
✓
Finance
Cash Flow Trend
✓
Operations
KPI Dashboard
✓
Operations
Trend Analysis
✓
Quality
Control Charts
✓
Strategy
SWOT
✓
Strategy
PESTLE
✓
Systems Thinking
BOT Graphs
✓
✓
LEVEL 2 — DEVELOP PEOPLE
Domain
Tool
Event
Pattern
Structure
Mental Models
Vision
HR
Training Programmes
✓
HR
Competency Frameworks
✓
✓
Leadership
Coaching
✓
Leadership
Mentoring
✓
Learning
Reflective Practice
✓
Learning
Personal Mastery
✓
✓
Learning
Dialogue
✓
✓
LEVEL 3 — ALIGN
Domain
Tool
Event
Pattern
Structure
Mental Models
Vision
Strategy
Balanced Scorecard
✓
✓
Strategy
Strategy Maps
✓
✓
Leadership
Shared Vision
✓
✓
Leadership
Vision Deployment
✓
Learning
Team Learning
✓
✓
Stakeholder
Stakeholder Mapping
✓
✓
LEVEL 4 — DECIDE
Domain
Tool
Event
Pattern
Structure
Mental Models
Vision
Strategy
Scenario Planning
✓
✓
✓
Finance
Cost-Benefit Analysis
✓
Risk
Risk Assessment
✓
✓
Systems Thinking
System Archetypes
✓
Systems Thinking
Onion Model
✓
✓
✓
Systems Thinking
CLDs
✓
LEVEL 5 — EXECUTE
Domain
Tool
Event
Pattern
Structure
Mental Models
Vision
Projects
PMBOK
✓
Projects
Gantt Charts
✓
Projects
RAID Logs
✓
Operations
SOPs
✓
Operations
Kanban
✓
✓
Projects
Agile
✓
✓
Operations
Scheduling Systems
✓
LEVEL 6 — GOVERN & MEASURE
Domain
Tool
Event
Pattern
Structure
Mental Models
Vision
Finance
Budgeting
✓
✓
Finance
Forecasting
✓
Risk
Risk Register
✓
Risk
Audit
✓
Governance
Compliance Systems
✓
Governance
Internal Controls
✓
Governance
Board Reporting
✓
✓
LEVEL 7 — IMPROVE
Domain
Tool
Event
Pattern
Structure
Mental Models
Vision
Quality
Six Sigma
✓
✓
Quality
DMAIC
✓
✓
Operations
Lean
✓
✓
Operations
Kaizen
✓
✓
✓
Learning
After Action Reviews
✓
✓
✓
Quality
Root Cause Analysis
✓
✓
LEVEL 8 — ADAPT
Domain
Tool
Event
Pattern
Structure
Mental Models
Vision
Change
ADKAR
✓
✓
✓
Change
Kotter
✓
✓
✓
Strategy
Strategic Foresight
✓
✓
Systems Thinking
Leverage Point Analysis
✓
✓
Leadership
Adaptive Leadership
✓
✓
✓
✓
LEVEL 9 — RENEW
Domain
Tool
Event
Pattern
Structure
Mental Models
Vision
Learning
Learning Organisation
✓
✓
✓
✓
HR
Succession Planning
✓
✓
✓
Knowledge
Communities of Practice
✓
✓
✓
Knowledge
Knowledge Management
✓
✓
✓
Leadership
Stewardship
✓
✓
Systems Thinking
Fifth Discipline
✓
✓
✓
✓
Immediate observation
When classified this way:
Most traditional management tools cluster in Event.
A smaller number reach Pattern.
Very few genuinely reach Structure.
Mental Models is dominated by Fifth Discipline disciplines rather than conventional management tools.
Vision is populated mostly by leadership and strategy tools.
This is probably the first clue that the table is not merely cataloguing management methods. It is revealing where management as a field has historically invested its attention.
And that, in turn, may explain why organisations become highly capable of managing events while remaining relatively weak at understanding the archetypal structures that generate them.
The Structures Beneath the Surface: Why Persistent Problems Don’t Stay in Their Lane
When a country’s unemployment rises, the response is usually a labour policy. When food imports climb, agricultural reform gets discussed. When corruption surfaces, governance fixes are proposed. When mental health deteriorates, healthcare budgets get adjusted. Each problem gets its own lane, its own ministry, its own set of experts.
The trouble is that the problems don’t stay in their lanes.
This piece is drawn from a study that began with unemployment and gradually widened — because it had to. The more the data was examined, the more the pressures refused to stay separate. Labour oversupply showed up alongside weakened productive absorption. Educational expansion appeared alongside declining technical capability. Agricultural decline appeared alongside migration pressures and weakening generational continuity. The harder you looked at any one pressure, the more the others were already there beneath it.
What emerged from that widening is a framework for understanding how persistent issues actually move through society — not as isolated events requiring targeted fixes, but as interacting structural movements that propagate across generations, often long before anyone measures them.
The Gap Between Where Problems Appear and Where They Begin
The most important distinction in this entire framework is deceptively simple: the visible location of a problem and the generative location of a problem are not the same thing.
Take corruption. It becomes visible institutionally — in tender processes, in allocation decisions, in procurement scandals. But its behavioural roots often emerge much earlier: in weakened long-horizon thinking, in survival pressures normalised during upbringing, in the gradual acceptance of shortcuts within wider society. By the time it registers as a governance problem, the conditions producing it may have been quietly accumulating for a generation.
Or take institutional fragmentation. It appears within governance systems. But its deeper roots frequently emerge upstream in weakening continuity structures within human formation — in how people are raised, what values are transmitted across generations, how long-term thinking is cultivated or eroded.
Societies often intervene where pressures become visible rather than where they are structurally generated. This is not a failure of intelligence. It is a predictable consequence of how institutions are organised: by sector, by ministry, by profession. The problem is that persistent issues rarely respect those boundaries.
A Framework for Seeing Across Sectors
To organise the growing number of interacting variables without fragmenting their relationships, the study developed a four-quadrant framework. The quadrants are not rigid categories — they are lenses, each revealing where pressures are primarily generated, where they tend to become visible, and how they flow.
H-H — Human Formation The formation of capability, behaviour, discipline structures, educational orientation, labour identity, and long-horizon thinking.
H-E — Productive Economic Capacity Agriculture, manufacturing, productive enterprise formation, labour absorption, value creation systems, and infrastructure.
H-G — Institutional Allocation & Execution Governance systems, policy allocation, land administration, institutional coordination, investment priorities, and societal response mechanisms.
These four quadrants interact continuously. A pressure emerging in human formation may eventually surface economically through weakened productivity. Ecological pressures may become visible institutionally through fiscal strain or migration surges. The framework doesn’t try to eliminate that complexity — it tries to make it navigable.
The Onion: A Sequence of Systemic Behaviours
As the study widened, recurring structural behaviours kept surfacing — not randomly, but in recognisable patterns that systems thinkers call archetypes. What became increasingly clear was that these archetypes were not independent of one another. The pressures generated within one archetype appeared capable of tipping variables into the conditions required for the next one to emerge.
This gave rise to what the study calls the Onion framework: a causally linked sequence of system archetypes that describes how unresolved pressures tend to propagate through society over time.
The sequence is:
Accidental Adversaries (AA) → Escalation (Esc) → Growth & Underinvestment (G&U) → Success to the Successful (StS) → Shifting the Burden (StB) → Fixes that Fail (FtF) → Drifting Goals (DG) → Limits to Growth (LtG) → Tragedy of the Commons (ToC) → back to Accidental Adversaries (AA)
This is not a deterministic cycle. Human societies are adaptive, relational, and capable of renewal at any point. The Onion is better understood as a propagation-awareness framework — a way of seeing how pressures tend to move if underlying structures go unaddressed for long enough.
The sections that follow walk through each quadrant, showing the variables at play, which archetypes dominate, and where the pressures flow.
H-H — Human Formation
Dominant archetypes: Drifting Goals → Fixes That Fail (with Shifting the Burden emerging later)
Many pressures that later become visible economically or institutionally have earlier formative roots in how people are raised, educated, and shaped. The weakening of long-horizon thinking, practical capability formation, productive identity, and disciplined stewardship often appears upstream of much that later shows up in labour systems, governance, and enterprise.
The study also found that some adaptive behaviours emerging under difficult conditions temporarily relieve immediate pressure while simultaneously weakening long-term regenerative capability. Survival-oriented economic behaviour, opportunistic adaptation, weakened delayed gratification — these emerge gradually under sustained systemic stress. Short-term adaptation and long-term continuity do not always move in the same direction.
Variable
Generated In
Dominant Archetype
Detected In
Consequence Flows Into
Births outside stable marriages
H-H
DG
H-H
H-H → H-E → H-G
Male absence in households
H-H
FtF
H-H
H-H → H-G
Weak masculine continuity
H-H
FtF
H-H
H-E → H-G
Weak intergenerational transfer
H-H
FtF
H-H
H-E
Weak long-horizon thinking
H-H
DG
H-H
All quadrants
Emotionally unstable environments
H-H
FtF
H-H
H-N → H-E
Survival-oriented upbringing
H-H
StB
H-H
H-E
Crime
H-E / H-H
StB
H-H
H-N → H-E
STEM avoidance
H-H
DG
H-H / H-E
H-E → H-G
Fear of mathematically intensive disciplines
H-H
DG
H-H
H-E
Office-job orientation
H-H
StB
H-E
H-E → H-G
Credential accumulation mentality
H-H
FtF
H-E
H-E
Theory-heavy education
H-H
FtF
H-H / H-E
H-E
Weak apprenticeship systems
H-H
FtF
H-E
H-E
Weak practical application
H-H
FtF
H-E
H-E
Weak technical competency
H-H
DG
H-E
H-E → H-G
Reduced deep work capability
H-H
DG
H-H
H-E
Labour oversupply
H-E
LtG
H-E
H-G
Graduate oversupply
H-H
FtF
H-E
H-E → H-G
Education–Employment Mismatch
H-E
DG
H-E
H-E → H-G→ H-H
Underemployment
H-E
LtG
H-E
H-G
Survival psychology
H-H
StB
H-H
H-E → H-G
Status signalling
H-H
Esc
H-H
H-E
Visibility competition
H-H
Esc
H-H
H-G
Side-hustle normalization
H-H / H-E
StB
H-E
H-G
Opportunistic adaptation
H-H
StB
H-G
H-G
Rule-bending normalization
H-H
DG
H-G
H-G
Penal-code proximity
H-H / H-E
ToC
H-G
H-G
Drift toward organized crime
H-H / H-E
ToC
H-G
H-G
What the table reveals is that pressures appearing later in labour, governance, and productive systems often have earlier roots in formation structures. Human formation pressures rarely remain confined to the quadrant in which they originate.
H-N — Ecological & Biological Resilience
Dominant archetypes: Limits to Growth → Tragedy of the Commons (with Accidental Adversaries and Shifting the Burden transitional)
Human societies don’t operate independently from the biological and ecological conditions that sustain them. Productive systems, migration patterns, food systems, labour systems, and institutional pressures are all shaped by ecological carrying capacity over long periods.
A critical distinction surfaced here: survival adaptation and regenerative reversal are not the same process. Drought-resistant crops, low-water agricultural systems, and survival-oriented production methods may help populations endure worsening conditions. But enduring deterioration and reversing the underlying trajectory that produces it are fundamentally different things. Some systems successfully help societies survive decline while simultaneously failing to address what is causing it.
Variable
Generated In
Dominant Archetype
Detected In
Consequence Flows Into
Declining rainfall systems
H-N
LtG
H-N
H-E
Increasing drought frequency
H-N
LtG
H-N
H-E
Extreme weather intensification
H-N
LtG
H-N
All quadrants
Reduced carrying capacity
H-N
LtG
H-N
H-E → H-G
Soil degradation
H-N
ToC
H-N
H-E
Water stress
H-N
LtG
H-N / H-G
H-E → H-G
Indigenous drought-resistant systems
H-N
AA
H-N
H-E
Low-water survival agriculture
H-N
StB
H-N
H-E
Weak ecological reversal systems
H-N
ToC
H-N
H-E
Weak evapotranspiration restoration
H-N
ToC
H-N
H-N
Weak biodiversity regeneration
H-N
ToC
H-N
H-E
Weak landscape restoration
H-N
ToC
H-N
H-E
Declining agricultural profitability
H-E / H-N
LtG
H-E
H-G
Aging farmers
H-H / H-N
LtG
H-E
H-E
Weak generational farming continuity
H-H
FtF
H-E
H-E
Youth agricultural disengagement
H-H
DG
H-E
H-E
Male migration into mining systems
H-N / H-E
Esc
H-E
H-H
Rising food imports
H-E
StB
H-G
H-G
Reduced food sovereignty
H-N / H-E
ToC
H-G
H-G
Climate vulnerability
H-N
LtG
H-G
All quadrants
Health / Disease Outcomes
H-E
FtB
H-N
All quadrants
Childhood nutrition weaknesses
H-N
LtG
H-N
H-H
Processed food dependency
H-N
StB
H-N
H-H
Micronutrient deficiencies
H-N
LtG
H-N
H-H
Reduced cognitive resilience
H-N
LtG
H-H
H-H
Emotional regulation instability
H-N
LtG
H-H
H-H
Chronic disease rise
H-N
ToC
H-N
H-E
Diabetes
H-N
ToC
H-N
H-E
Hypertension
H-N
ToC
H-N
H-E
Fatigue economies
H-N
LtG
H-E
H-E
Mental health deterioration
H-N
LtG
H-H
H-E
Reduced productive lifespan
H-N
LtG
H-E
H-G
Ecological commons depletion
H-N
ToC
H-G
H-G
Notice how biological resilience flows into educational performance, labour productivity, and institutional behaviour. Nutrition quality, cognitive resilience, emotional regulation stability — these are not soft concerns. They shape the productive and institutional capacity of entire societies over time.
Economic weakness, as the study increasingly revealed, is rarely a standalone financial event. It tends to emerge as the interacting outcome of human formation pressures, ecological pressures, institutional allocation patterns, and productive underinvestment accumulating simultaneously over long periods. Productive systems inherit conditions from multiple upstream structures at once.
The study drew a sharpening distinction between productive enterprise formation and survival circulation systems. Some economic activity creates productive depth, technical capability, value addition, and long-term labour absorption. Other activity primarily circulates limited value within already constrained systems. Over time, the expansion of survival-oriented circulation — retail growth, import dependency, multi-income hustle strategies — can help societies adapt temporarily while steadily weakening their capacity to generate new productive depth.
Variable
Generated In
Dominant Archetype
Detected In
Consequence Flows Into
Weak agricultural reinvestment
H-E
G&U
H-E
H-G
Weak manufacturing ecosystems
H-E
G&U
H-E
H-G
Weak industrial deepening
H-E
G&U
H-E
H-G
Weak engineering ecosystems
H-H / H-E
G&U
H-E
H-G
Weak research ecosystems
H-H / H-E
G&U
H-E
H-G
Weak agricultural financing
H-G / H-E
G&U
H-E
H-G
High capital barriers
H-G
G&U
H-E
H-H
Weak agricultural banking
H-G
G&U
H-E
H-E
Weak enterprise incubation
H-G
G&U
H-E
H-E
Retail profitability dominance
H-E
Esc
H-E
H-G
Import-based circulation economy
H-E
StB
H-E / H-G
H-G
Government-employment prestige
H-H / H-G
StS
H-E
H-H
Tenderpreneurship expansion
H-G
StS
H-E
H-G
Investments shifting to circulation
H-E
Esc
H-E
H-G
Productive labour shifting to retail
H-E
Esc
H-E
H-H
Administrative expansion without production
H-G
FtF
H-E
H-G
Reduced productive entrepreneurship
H-H / H-E
G&U
H-E
H-G
Small-scale survival businesses
H-E
StB
H-E
H-G
Weak scaling capability
H-E
G&U
H-E
H-G
Weak value-chain integration
H-E
AA
H-E
H-G
Import dependency
H-E
StB
H-G
H-G
Weak local value addition
H-E
G&U
H-E
H-G
Weak industrial competitiveness
H-E
LtG
H-E
H-G
Reduced labour absorption
H-E
LtG
H-E
H-H
Informal circulation systems
H-E
StB
H-E
H-G
Multi-income survival systems
H-H / H-E
StB
H-E
H-G
Short-horizon enterprise behaviour
H-H
DG
H-E
H-G
Declining productivity per worker
H-E
LtG
H-E
H-G
Labour dilution into low-value sectors
H-E
Esc
H-E
H-G
External energy dependency
H-E
LtG
H-G
H-G
Weak industrial infrastructure
H-G
G&U
H-E
H-G
Electricity fragility
H-G / H-N
LtG
H-E
H-G
Rising production costs
H-E / H-N
LtG
H-E
H-G
What the productive quadrant reveals most clearly is that economic outcomes are downstream of structural conditions across multiple layers simultaneously. You don’t fix a hollow productive economy by targeting the economy alone.
H-G — Institutional Allocation & Execution
Dominant archetypes: Escalation → Success to the Successful → Shifting the Burden (with Tragedy of the Commons emerging later)
Governance systems sit in a uniquely difficult position. They are both detectors and responders to pressures generated across the entire civilisational structure. They are asked to stabilise labour pressures, ecological pressures, productive weakness, social fragmentation, and rising instability — often simultaneously — using policy allocation, resource distribution, welfare mechanisms, and political coordination.
The problem is that institutions themselves begin adapting under sustained pressure. Short political cycles, fragmented coordination, symptomatic policy responses, and expanding administrative management systems emerge progressively. Institutions start adapting to the pressure rather than resolving the structures generating it. Some governance responses — welfare expansion, import dependency management, reactive policy cycles — temporarily relieve immediate instability while reinforcing deeper structural dependencies. Short-term stabilisation and long-term regeneration are not the same thing institutionally.
Variable
Generated In
Dominant Archetype
Detected In
Consequence Flows Into
Short political cycles
H-H
StS
H-G
H-G
Weak long-term planning
H-H
StS
H-G
All quadrants
Weak civilizational horizon thinking
H-H
StS
H-G
All quadrants
Political responsiveness over structural investment
H-G
StS
H-G
H-E
Fragmented ministries
H-H
StS
H-G
H-G
Weak systems integration
H-H
StS
H-G
All quadrants
Weak policy continuity
H-H
StB
H-G
H-G
Repeated policy resets
H-G
StB
H-G
H-G
Public-Service Performance / Frustration
H-H
DG
H-G
H-E
Resource leakage
H-H
StB
H-G
H-G
Corruption
H-H
StB
H-G
H-G
Patronage systems
H-G
StS
H-G
H-G
Tenderpreneurial incentives
H-G
StS
H-G
H-E
Land Conflict / Land-Use Conflict
H-N
Esc
H-G
H-E
Land banking
H-H / H-E
StS
H-G
H-E
Housing Challenges
H-G
G&U
H-H
H-E
Elite accumulation
H-E
StS
H-G
H-G
Weak youth access
H-G
StS
H-G
H-H / H-E
Delayed productive deployment
H-G
StB
H-G
H-E
Corruption
H-H
StB
H-E
H-G
Corrupt allocation systems
H-H
StB
H-G
H-G
Underinvestment in STEM
H-H
StS
H-G
H-H / H-E
Underinvestment in regenerative agriculture
H-N
StS
H-G
H-N
Underinvestment in water systems
H-N
StS
H-G
H-N
Underinvestment in manufacturing ecosystems
H-E
StS
H-G
H-E
Underinvestment in apprenticeship systems
H-H
StS
H-G
H-H
Welfare dependence
H-H / H-E
StB
H-G
H-H
Youth grants without ecosystems
H-G
StB
H-G
H-H / H-E
Import dependency management
H-E
StB
H-G
H-E
Administrative expansion
H-G
StB
H-G
H-G
Retail licensing expansion
H-E
StB
H-G
H-E
Distrust in productive effort
H-H
StB
H-G
H-H
Rule-bending normalization
H-H
StB
H-G
H-H
Reduced civic cohesion
H-H
StS
H-G
H-H
Institutional fatigue
H-H / H-G
StB
H-G
H-G
Ecological depletion
H-N
ToC
H-G
H-N
Fiscal depletion
H-E
ToC
H-G
H-G
Institutional depletion
H-G
ToC
H-G
H-G
Governance legitimacy stress
All quadrants
ToC
H-G
All quadrants
Reduced long-horizon coordination capacity
H-H
ToC
H-G
All quadrants
Reduced regenerative capability
H-N / H-E
ToC
H-G
All quadrants
Increased systemic fragility
All quadrants
ToC
H-G
AA restart
The governance quadrant is where the accumulated pressures of human formation, ecological resilience, and productive capacity all converge and become measurable. It is, in a sense, the final detection layer — but rarely the origin of what it’s detecting.
The Quadrants in Motion
The four quadrants don’t operate in sequence. They interact continuously. Human formation shapes ecological stewardship. Ecological conditions reshape productive systems. Productive systems influence governance behaviour. Governance responses influence educational orientation, economic adaptation, and long-term societal behaviour in return.
This continuous interaction means pressures rarely stay contained where they first emerge. Declining ecological resilience propagates later into labour migration, food imports, fiscal strain, and institutional fatigue. Weak productive absorption propagates later into household stability, psychological adaptation, educational orientation, and governance pressure.
This is also why some interventions produce only temporary relief. If societies continuously intervene where pressures become visible while neglecting where they are structurally generated, many conditions gradually re-emerge elsewhere. The structure keeps producing what it was always structured to produce.
Interconnected Pressures, Interconnected Leverage
One of the most important observations to emerge from this study is that interconnected systems carry both interconnected pressures and interconnected possibilities for renewal.
Strengthening long-horizon human capability formation may later influence productive behaviour, institutional resilience, educational orientation, labour absorption, and governance quality simultaneously. Strengthening regenerative ecological systems may later influence food resilience, migration pressure, biological resilience, productive continuity, and fiscal stability. Strengthening productive capacity may later influence family stability, psychological adaptation, institutional pressure, and long-term societal confidence.
This doesn’t mean persistent issues yield to simple single-point interventions — human societies are too complex and historically layered for that. But it does suggest that long-term regenerative movement becomes more possible when societies start seeing the interacting structures beneath visible realities rather than treating each pressure as a standalone problem. The ability to perceive interrelationships may itself be part of the intervention.
Closing: What Persistent Unemployment Actually Reflects
Persistent unemployment may represent more than the absence of jobs. It may reflect simultaneous movements in human formation, ecological systems, productive systems, and institutional structures over long periods of time — educational orientation, ecological resilience, labour absorption, governance adaptation, social continuity, and psychological adaptation all interacting more closely than they appear when examined separately.
Organisations will continue managing themselves through sectors, departments, and ministries — that operational logic has its own validity. But persistent issues don’t respect those boundaries. They move across them, reinforce themselves through them, and reveal the same underlying structures expressing themselves differently in different parts of society.
The challenge isn’t only to solve isolated problems more efficiently. It’s to develop the capacity to see the interacting structures beneath them — patiently, coherently, and across generations. That capacity for systemic perception may be one of the most important things a society can cultivate.
A Reflection to Presidents, Ministers, Mayors and National Leaders on the Structural Nature of Persistent Unemployment
The World Does Not Lack Unemployment Studies
There are thousands of unemployment studies across the world. Governments commission them. Universities publish them. International agencies such as the International Labour Organization, the World Bank, the Organisation for Economic Co-operation and Development, and the International Monetary Fund track unemployment continuously through labour-force surveys, economic outlooks, productivity reports, and policy frameworks. Economists forecast unemployment cycles while labour ministries attempt interventions through stimulus programmes, entrepreneurship funds, skills initiatives, and public employment schemes.
Yet despite decades of analysis, intervention, and reform, unemployment continues to persist across countries with vastly different political systems, resource bases, educational levels, and economic structures. This alone should force leaders to pause and ask a deeper question: what if unemployment is not merely an economic statistic to be managed, but a systemic condition continuously reproduced by the structure of society itself? What if the issue is not only the absence of jobs, but the interaction between governance systems, aspiration systems, productive capacity, labour allocation, education pathways, and national identity over time?
The reflections in this article emerge from the broader STRLDi systems-thinking study on persistent unemployment in Botswana, which examines unemployment not as an isolated labour-market issue, but as a structural output arising from governance systems, productive-capacity design, labour allocation patterns, aspiration systems, and institutional fragmentation.
Most Studies Measure Unemployment. STRLDi Examines What Produces It
The STRLDi unemployment study begins from a fundamentally different place. It does not begin by asking how many people are unemployed. It begins by asking: what structural conditions continuously regenerate unemployment, labour drift, productive-capacity erosion, and social fragmentation even while economies remain active and populations remain busy? This distinction is critical because it shifts the discussion away from unemployment as an isolated labour-market problem and toward unemployment as an emergent systems outcome.
Most global unemployment studies are designed for measurement. The International Labour Organization tracks labour participation rates, youth unemployment, informal labour trends, and sectoral employment shifts. National statistics offices produce quarterly unemployment figures while economic institutes generate labour dashboards and productivity indicators. These studies are essential because they help governments see visible symptoms of labour stress. But measurement studies often stop at description. They can tell a ministry how many people are unemployed, but they rarely explain why the same outcomes continue repeating decade after decade despite continuous intervention.
Table 1: Major Categories of Global Unemployment Studies and Their Primary Purposes
To understand where the STRLDi study differs, it is useful first to understand how unemployment is commonly studied globally. Most existing unemployment research falls into several broad categories, each designed for different policy and analytical purposes.
Category of Unemployment Study
Primary Purpose
Typical Questions Asked
Underlying Assumption
Typical Outputs
Key Limitations
How the STRLDi Study Differs
1. Measurement-Based Studies
To quantify unemployment levels and labour-force trends
• What is the unemployment rate?• Which age groups are affected?• Which regions/sectors are losing jobs?
If unemployment is measured accurately, policy responses can be designed effectively
Often fragmented by ministry or sector; rarely integrates aspiration and behavioural systems
STRLDi connects governance structures with labour allocation, identity systems, and productive-capacity formation
8. STRLDi Structural-Systemic Unemployment Study
To reveal the interconnected structural architecture continuously reproducing unemployment
• What systemic structures regenerate unemployment?• How do narratives, aspiration systems, governance, labour allocation, and productive-capacity systems interact?• Why does unemployment persist despite interventions?
Unemployment is an emergent systemic output arising from interacting structures, behaviours, narratives, and institutional fragmentation
Requires deeper interdisciplinary analysis and long-term systems thinking
STRLDi treats unemployment not as a standalone labour-market issue, but as a civilisational systems problem linked to governance, productive capacity, aspiration, emotional systems, and national resilience
Macroeconomic Studies Explain Cycles, But Not Structural Drift
Another major category of unemployment research comes from macroeconomic institutions. The International Monetary Fund, central banks, treasury departments, and development economists typically connect unemployment to GDP growth, inflation, fiscal policy, interest rates, exchange-rate movements, and business cycles. Their assumption is that unemployment rises and falls primarily through economic management and market adjustment.
Yet many countries continue experiencing persistent unemployment even during periods of economic growth. Some economies expand while productive labour absorption weakens underneath them. This reveals an uncomfortable but necessary reality for presidents, ministers, and mayors: economic activity alone does not guarantee productive employment systems. Economies can grow numerically while labour structures fragment socially, emotionally, and institutionally.
Skills-Mismatch Studies Assume the Economy Can Already Absorb Labour
There is also a large body of work focused on labour-market mismatch. The Organisation for Economic Co-operation and Development, universities, TVET commissions, and workforce development agencies often examine whether graduates possess the right skills for industry. These studies ask whether STEM participation is sufficient, whether technical education aligns with employer needs, and whether educational systems are preparing people adequately for the future of work.
These studies are valuable, but they often carry an unspoken assumption: that the economy already possesses sufficient structural capacity to absorb labour if only skills are corrected. The STRLDi study steps further back. It asks whether the productive sectors themselves are coordinated, attractive, visible, and structurally capable of absorbing growing populations in the first place. Skills alone cannot solve unemployment if productive systems are weak, fragmented, or socially abandoned.
The Attention Economy Has Changed the Labour Conversation Entirely
The emergence of the global attention economy has intensified this structural problem dramatically. Across the world, millions of young people are moving into digital creator pathways, gig visibility work, livestreaming, short-form content production, online influencing, and algorithm-driven labour systems. Technology platforms such as TikTok, YouTube, Instagram, Spotify, and Meta Platforms have democratised visibility at unprecedented scale.
Traditional unemployment studies frequently classify these individuals as self-employed, economically active, or entrepreneurial. But the deeper systems question is whether societies are quietly losing labour from productive sectors into structurally unstable visibility economies that cannot sustainably absorb populations over time. The issue is no longer simply unemployment. The issue is labour misallocation. A nation may appear economically busy while simultaneously weakening its agricultural base, manufacturing systems, engineering pipeline, construction capacity, and technical workforce.
STRLDi Integrates Systems That Are Normally Studied Separately
This is where the STRLDi study diverges most sharply from conventional labour analysis. The study integrates governance systems, productive-capacity structures, labour allocation patterns, aspiration systems, emotional systems, education pathways, institutional fragmentation, and national narratives into one analytical frame. Most unemployment studies isolate these dimensions. STRLDi examines how they interact continuously over time.
This systems orientation draws deeply from the work of Peter Senge and The Fifth Discipline, while also resonating with broader systems-thinking traditions associated with Jay Forrester and Donella Meadows. The central insight is simple but powerful: behaviour over time emerges from structure. If societies continuously reward visibility over productive capability, weaken technical aspiration, disconnect governance from production systems, and fragment labour pathways, then unemployment will persist regardless of how many interventions are introduced.
Table 2: Global Studies That Partially Overlap with the STRLDi Unemployment Framework
While several global studies partially overlap with elements of the STRLDi framework, few integrate governance systems, labour allocation, productive-capacity structures, aspiration systems, emotional systems, and national resilience into one systemic unemployment model.
Uses systems thinking for workforce development and employment pathways
Recognises unemployment as a systems issue involving multiple stakeholders
STRLDi expands beyond workforce placement into governance, aspiration systems, productive-capacity design, labour drift, emotional systems, and national economic architecture
Studies governance quality and unemployment causality
Recognises governance as central to labour outcomes
STRLDi goes beyond governance indicators into systemic feedback loops, national narratives, labour aspiration shifts, and productive-capacity circulation
Explores long-term unemployment through social and identity systems
Recognises identity, governance, and self-governing narratives
STRLDi extends this into national labour allocation, productive-sector withdrawal, creator-economy drift, and structural economic redesign
STRLDi Unemployment Study
Systems-thinking diagnosis of persistent unemployment as a structural output emerging from governance, labour allocation, productive capacity, aspiration systems, emotional systems, and sectoral misalignment
Integrates systems thinking, governance, labour absorption, identity, national narratives, productive sectors, emotional systems, and attention-economy drift into one coherent national-development framework
Represents one of the first known national-scale applications of The Fifth Discipline to unemployment, labour allocation, productive-capacity design, and systemic economic restructuring
Why This Matters to Presidents, Ministers and Mayors
For national and local leaders, this distinction matters profoundly. A mayor can build roads, markets, industrial parks, and innovation hubs, yet still struggle with youth unemployment if the local aspiration system no longer values production-oriented work. A president can expand university enrolment while simultaneously weakening national productive capacity if educational pathways drift away from engineering, agriculture, manufacturing, logistics, and technical coordination.
Without alignment between aspiration systems and productive systems, nations begin hollowing out from within while appearing modern on the surface. This is one of the most dangerous structural illusions facing governments today. The rise of visibility economies can create the appearance of activity while quietly weakening the foundations required for long-term resilience.
The STRLDi Study Is Not Merely About Jobs
The STRLDi unemployment study, therefore, moves beyond policy commentary into structural interpretation. It asks leaders to see unemployment not only through economics, but through governance coordination, emotional systems, labour narratives, social identity, productive-capacity design, and long-term national resilience. In this sense, the study belongs less to the category of conventional labour-market research and more to what may be called a structural-systemic national capacity study.
The deeper warning within the study is that nations may mistakenly interpret labour drift into digital and informal sectors as relief for unemployment systems. Yet if large portions of the working-age population withdraw from productive sectors without equivalent replacement, the long-term consequence is not resilience but fragility. Food systems weaken. Manufacturing dependence rises. Technical shortages expand. Mental-health pressures intensify. Youth become visible but structurally disconnected from stable pathways of mastery, contribution, and coordinated production.
The Real Question the World Must Now Ask
The purpose of the STRLDi study is therefore not merely to reduce unemployment statistics. Its purpose is to help societies understand the structural conditions required to absorb populations meaningfully into productive life over generations. This requires governments to think differently about labour, education, identity, aspiration, governance coordination, and national development itself.
Most unemployment studies ask: How do we reduce unemployment? The STRLDi study asks: What structural conditions continuously produce unemployment, labour drift, and productive-capacity erosion even while societies appear economically active?
That is a fundamentally different level of inquiry. Increasingly, it is also the level of inquiry the world now requires.
INTRODUCTION: WHEN EFFORT DOES NOT CHANGE THE PATTERN
Many persistent societal conditions remain difficult not because people are unintelligent, under-qualified, or unwilling to act, but because the underlying system is being approached primarily through detail complexity rather than dynamic complexity. Policies are revised, investment strategies refreshed, institutional structures reorganised, and implementation teams expanded, yet the overall Behaviour Over Time often remains materially unchanged across administrations and decades. When this happens repeatedly, the question gradually shifts from “What intervention is missing?” to “What structure continues reproducing the persistence beneath these interventions?”
This distinction matters because the two forms of complexity do not ask the same questions, nor do they produce the same kind of seeing. Detail complexity focuses on the number of variables, actors, projects, moving parts, and implementation requirements involved in a situation. Dynamic complexity, however, concerns how cause and effect unfold with delay across time, often across institutions, sectors, and generations, such that actions that appear reasonable in isolation unintentionally strengthen the very conditions they seek to change.
It is within this second territory that much of STRLDi’s work operates.
As Peter Senge explains in The Fifth Discipline, Systems Thinking is:
“to discipline us in seeing and understanding patterns — looking beyond events — to deeper structures that control events, and discovering the leverage that lies hidden in these structures.”
The emphasis here is important. Systems Thinking is not merely the study of complexity. It is a discipline of seeing.
DETAIL COMPLEXITY: WHEN THE SYSTEM IS APPROACHED THROUGH PARTS
Detail complexity is often the dominant language of institutions because it aligns naturally with administration, planning, budgeting, implementation, and measurement. Organisations identify variables, assign responsibilities, monitor indicators, establish targets, and attempt to optimise interactions between different operational components. This work is necessary. Large systems cannot function without it.
Within organisational settings, detail complexity may include:
The challenge within detail complexity is usually one of coordination, sequencing, execution, or technical integration. The system is assumed to be broadly understood, and the work therefore concentrates on improving performance within that frame.
This becomes particularly visible in conventional change-management processes where organisations:
These approaches are useful, particularly where the system boundary is reasonably visible and the relationships between actions and outcomes are relatively immediate.
But many persistent societal conditions do not behave this way.
DYNAMIC COMPLEXITY: WHEN CAUSE AND EFFECT ARE SEPARATED ACROSS TIME
Dynamic complexity emerges when the relationship between cause and effect becomes difficult to see because it unfolds across long horizons, across sectors, and through interacting layers of reinforcement. The difficulty no longer lies primarily in the number of variables, but in the fact that actions taken in one part of the system may only reveal their consequences years or decades later in another part of the system.
The visible events change. The deeper Behaviour Over Time does not.
In dynamic complexity, the system cannot be understood adequately through isolated snapshots because the structure expresses itself longitudinally. What appears disconnected at the level of events may reveal itself as tightly related when viewed over twenty, thirty, or forty years.
…and yet still remain structurally weak in the sectors required to absorb labour at scale. The issue here is not implementation failure alone. It is that the underlying relationships organising the system may remain materially unchanged.
This is why STRLDi’s work begins not with interventions, but with Behaviour Over Time.
BEHAVIOUR OVER TIME: THE ENTRY POINT INTO STRUCTURE
At STRLDi, the first question is often not:
“What should we do?”
The first question is:
“What pattern refuses to move?”
This distinction is fundamental.
Persistent conditions leave behind behavioural signatures. When plotted longitudinally, these signatures reveal relationships that are often invisible at the level of events. Rising demographic inflow alongside persistently weak labour absorption, repeated downstream healthcare expenditure without corresponding upstream prevention improvement, or agricultural expansion without proportional manufacturing depth may all appear unrelated when viewed episodically. Over time, however, they may reveal the same underlying structural imbalance.
Behaviour Over Time therefore becomes more than a graphing exercise. It becomes a diagnostic doorway into dynamic complexity.
The emphasis shifts:
DETAIL COMPLEXITY
DYNAMIC COMPLEXITY
Events
Behaviour Over Time
Variables
Relationships
Interventions
Structural persistence
Immediate outcomes
Delayed consequences
Organisational optimisation
Longitudinal diagnosis
Isolated sectors
Cross-domain interaction
Technical coordination
Behavioural reproduction
This does not make detail complexity unimportant. It simply means that detail complexity alone cannot adequately explain why certain conditions remain materially unchanged despite sustained intervention.
SYSTEM ARCHETYPES: RECURRING STRUCTURES OF PERSISTENCE
Once Behaviour Over Time becomes visible, another question emerges:
What kind of structure produces this pattern repeatedly?
This is where system archetypes become important.
At STRLDi, archetypes are not treated primarily as facilitation tools or conceptual diagrams. They are approached as recurring structural patterns that leave identifiable behavioural traces across time. A persistent widening gap between labour inflow and absorption, for example, may reveal the behavioural characteristics of Success to the Successful, where sectors already structurally advantaged continue deepening while weaker sectors struggle to accumulate capability proportionately.
Similarly:
▪️ Repeated symptomatic interventions may reveal Shifting the Burden ▪️ Resource strain from expanding participation without proportional capacity deepening may reflect Limits to Growth ▪️ Competitive extraction between sectors may reveal Tragedy of the Commons
The archetype is therefore not imposed onto the system. It is surfaced through the Behaviour Over Time the system leaves behind.
This distinction matters greatly.
The work is not asking:
“Which archetype should we use?”
The work is asking:
“What archetypal behaviour is already expressing itself?”
THE ONION: WHY PERSISTENCE REPRODUCES ITSELF
Persistent systems rarely sustain themselves through one variable alone. They reproduce themselves through layers.
This is where the Onion Model becomes important within STRLDi’s work. The Onion is not merely a conceptual illustration; it is a layered diagnostic architecture involving system archetypes that helps explain how persistent conditions continue reproducing themselves across sectors and generations.
Beneath these sit institutional responses, sectoral relationships, reinforcing interactions, mental models, historical assumptions, and societal beliefs as system archetypes, that quietly shape how decisions continue being made.
This layered reproduction matters because interventions often concentrate on the visible layer while leaving the deeper organising relationships materially unchanged.
The result is familiar: movement without transformation.
STRLDi’s work does not oppose simulation, facilitation, organisational learning, or implementation design. These become critically important once the dominant structure has already become sufficiently visible.
But the work enters earlier.
It enters at the point where societies, institutions, or sectors are still mistaking persistent structural behaviour for isolated events, leadership failure, funding shortages, or implementation weakness alone. The role of the facilitator, therefore, is not primarily to optimise execution pathways. It is to help bring the underlying structure into view.
This requires:
▪️ Longitudinal observation ▪️ Behaviour Over Time analysis ▪️ Archetypal diagnosis ▪️ Cross-sector comparison ▪️ Shared structural seeing ▪️ Generative conversation across custodians
Because when persistent conditions survive administrations, reforms, investments, and institutional redesigns, the question is no longer whether effort was sincere.
The question becomes:
What structure has remained materially unchanged beneath them?
CONCLUSION: FROM EVENTS TO STRUCTURE
Many systems remain difficult not because nobody cares, but because the structure producing the persistence remains insufficiently visible across roles. Institutions continue responding to symptoms while the underlying relationships quietly deepen beneath them. Over time, the pattern begins to appear inevitable, even though it is structurally produced.
This is why Systems Thinking, as Senge framed it, remains so important. It disciplines us to move beyond events into patterns, beyond patterns into structures, and beyond structures into the relationships that quietly organise Behaviour Over Time.
The work, then, is not merely to solve problems faster.
It is to see clearly enough that the system can no longer hide inside the events it produces.
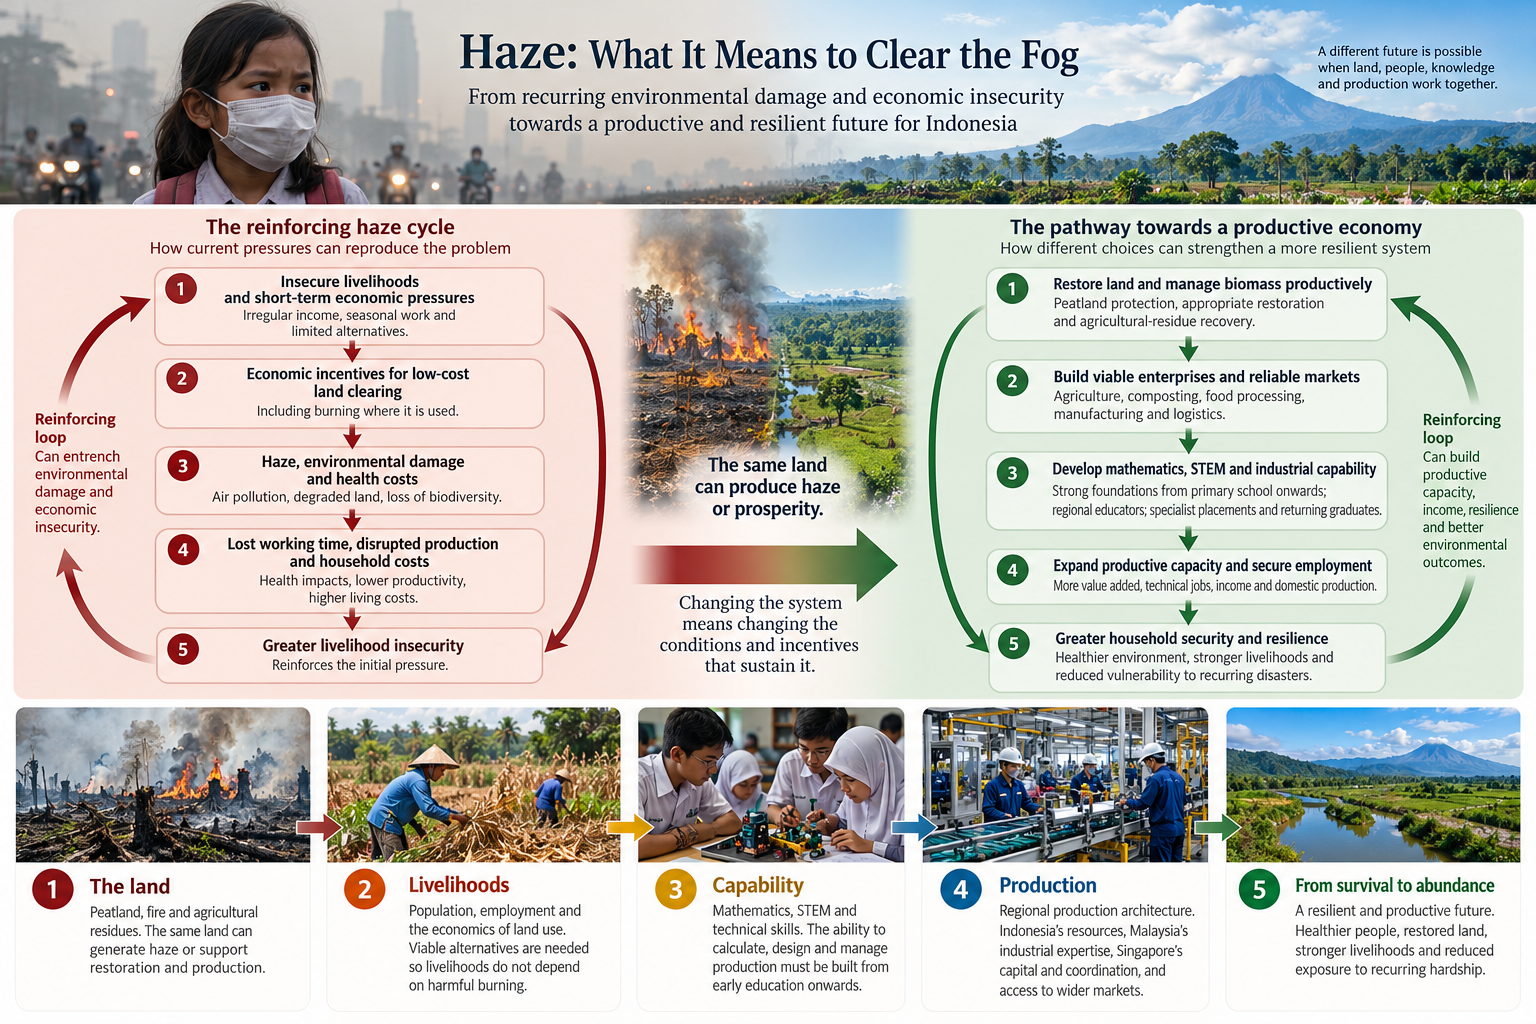
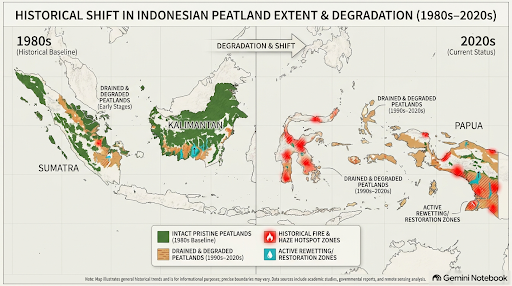
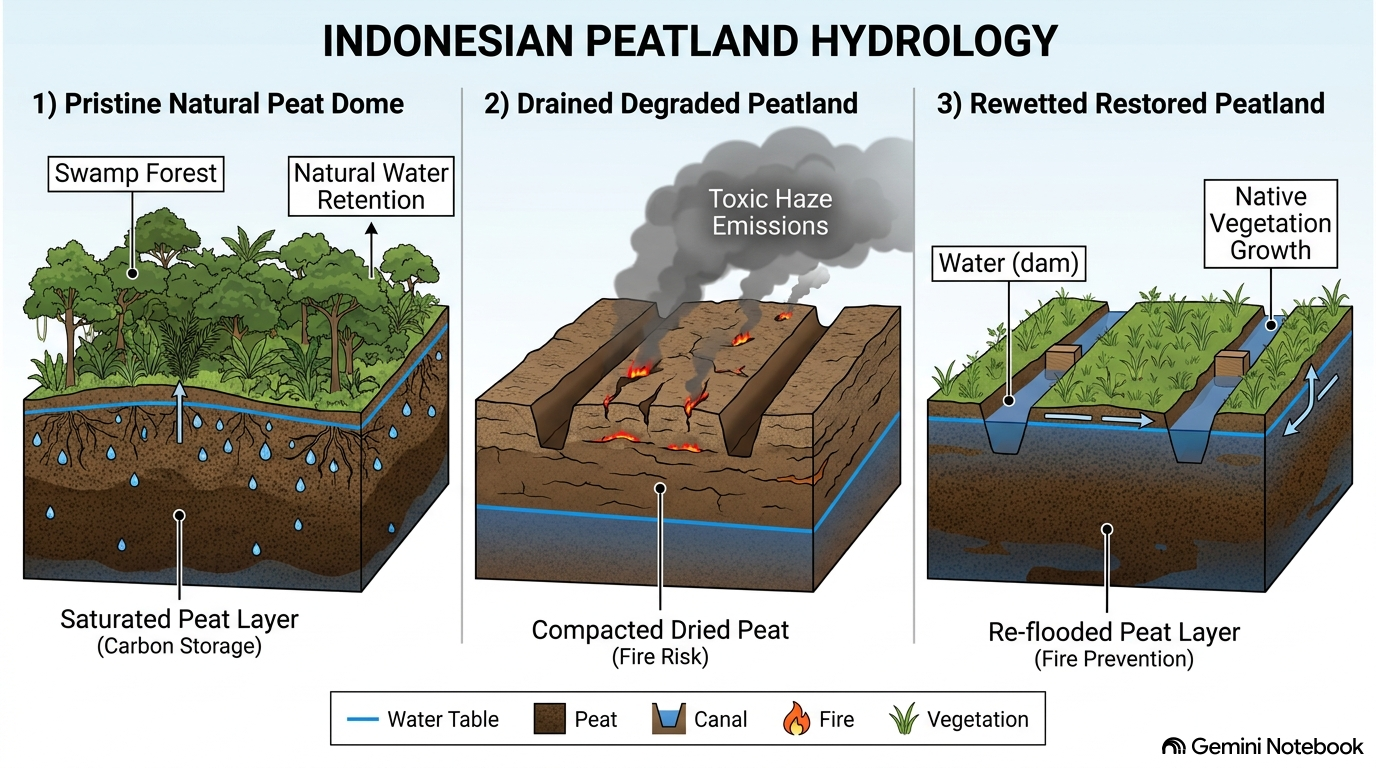
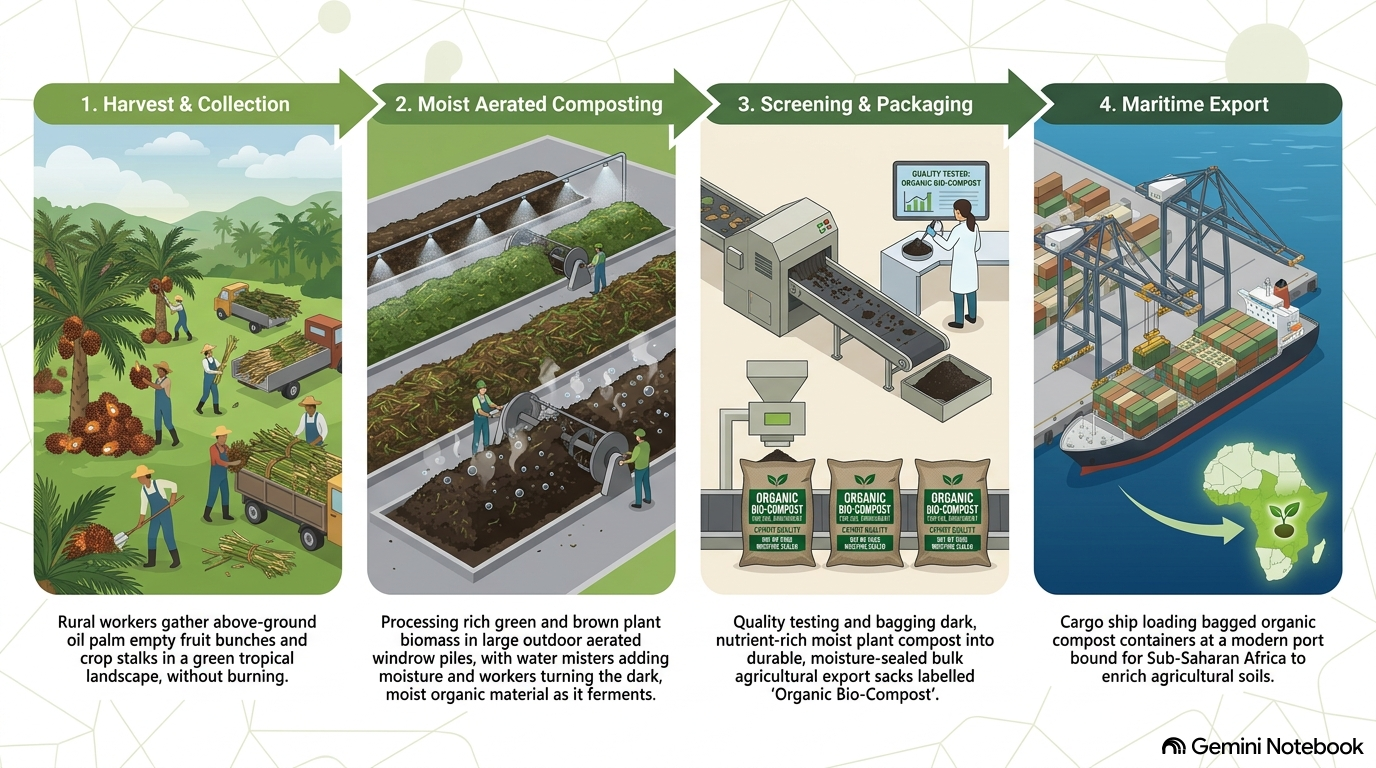
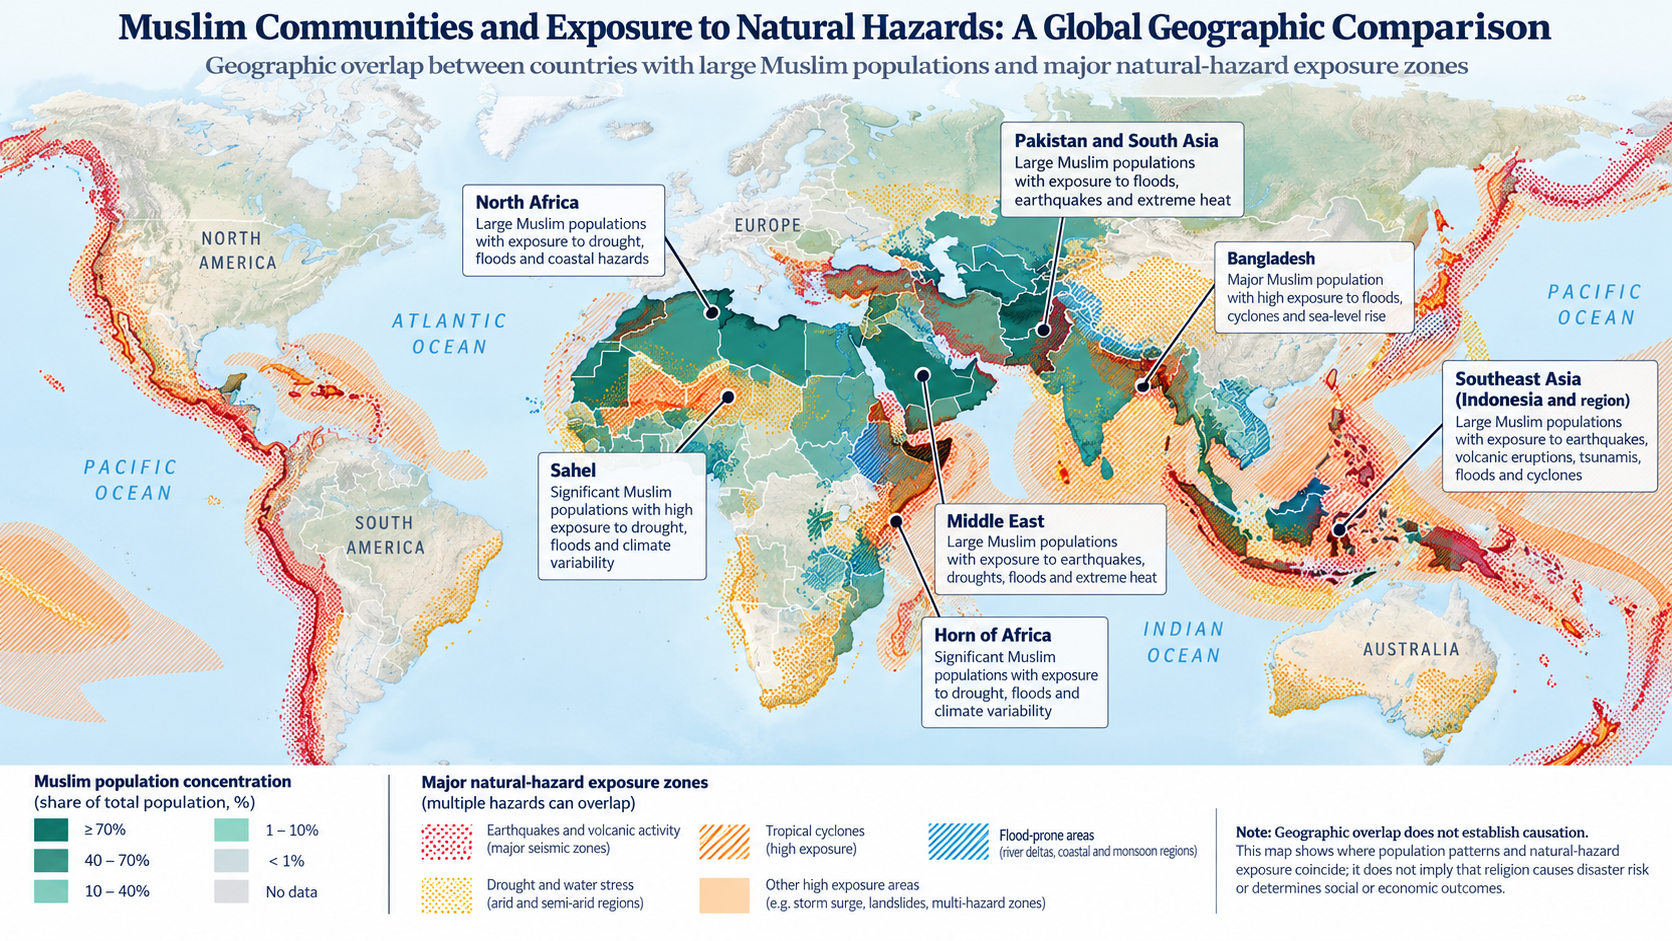
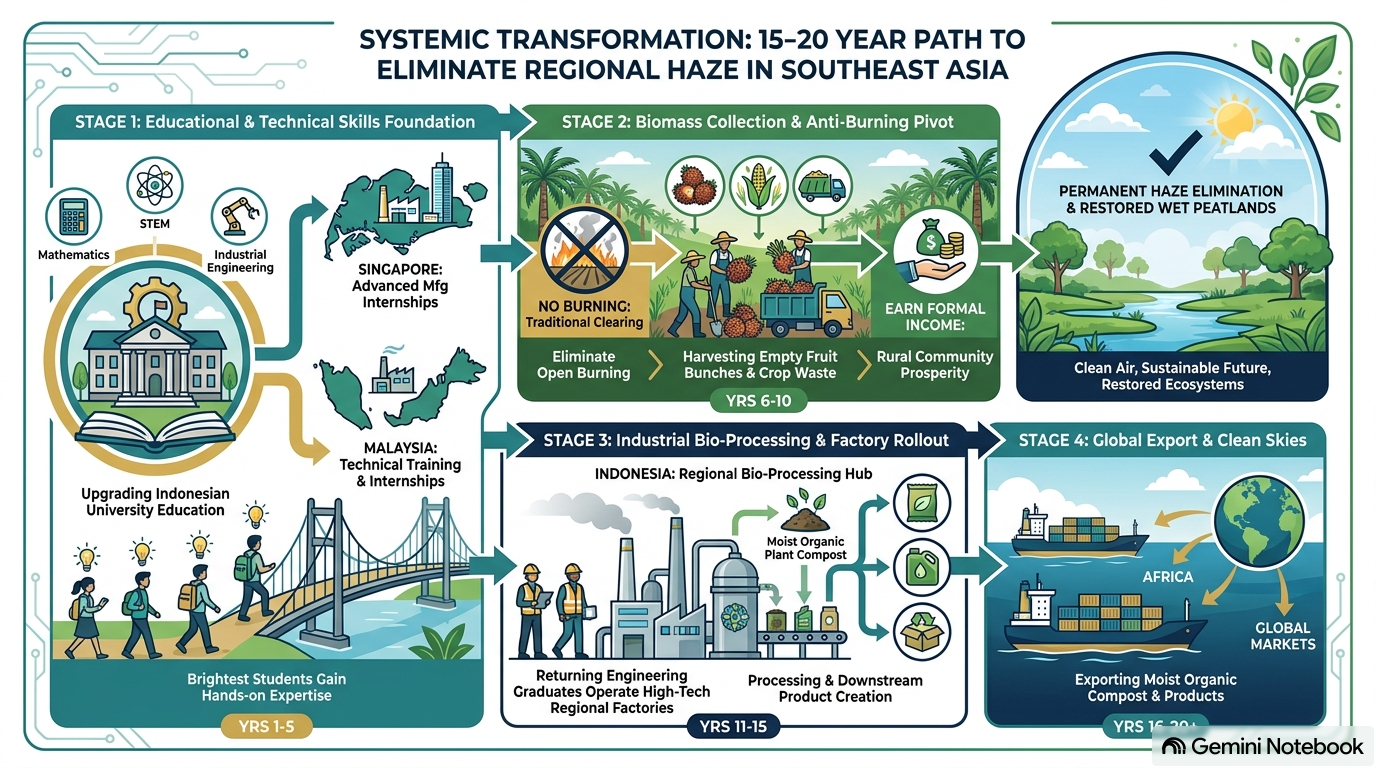

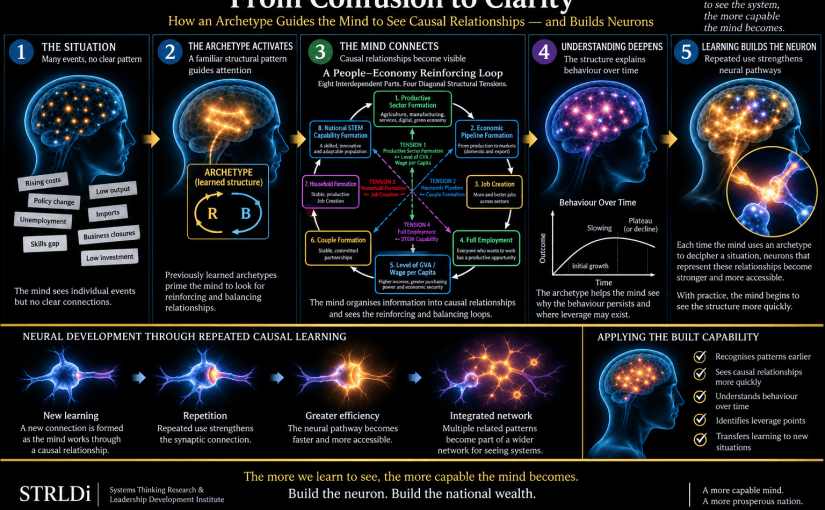
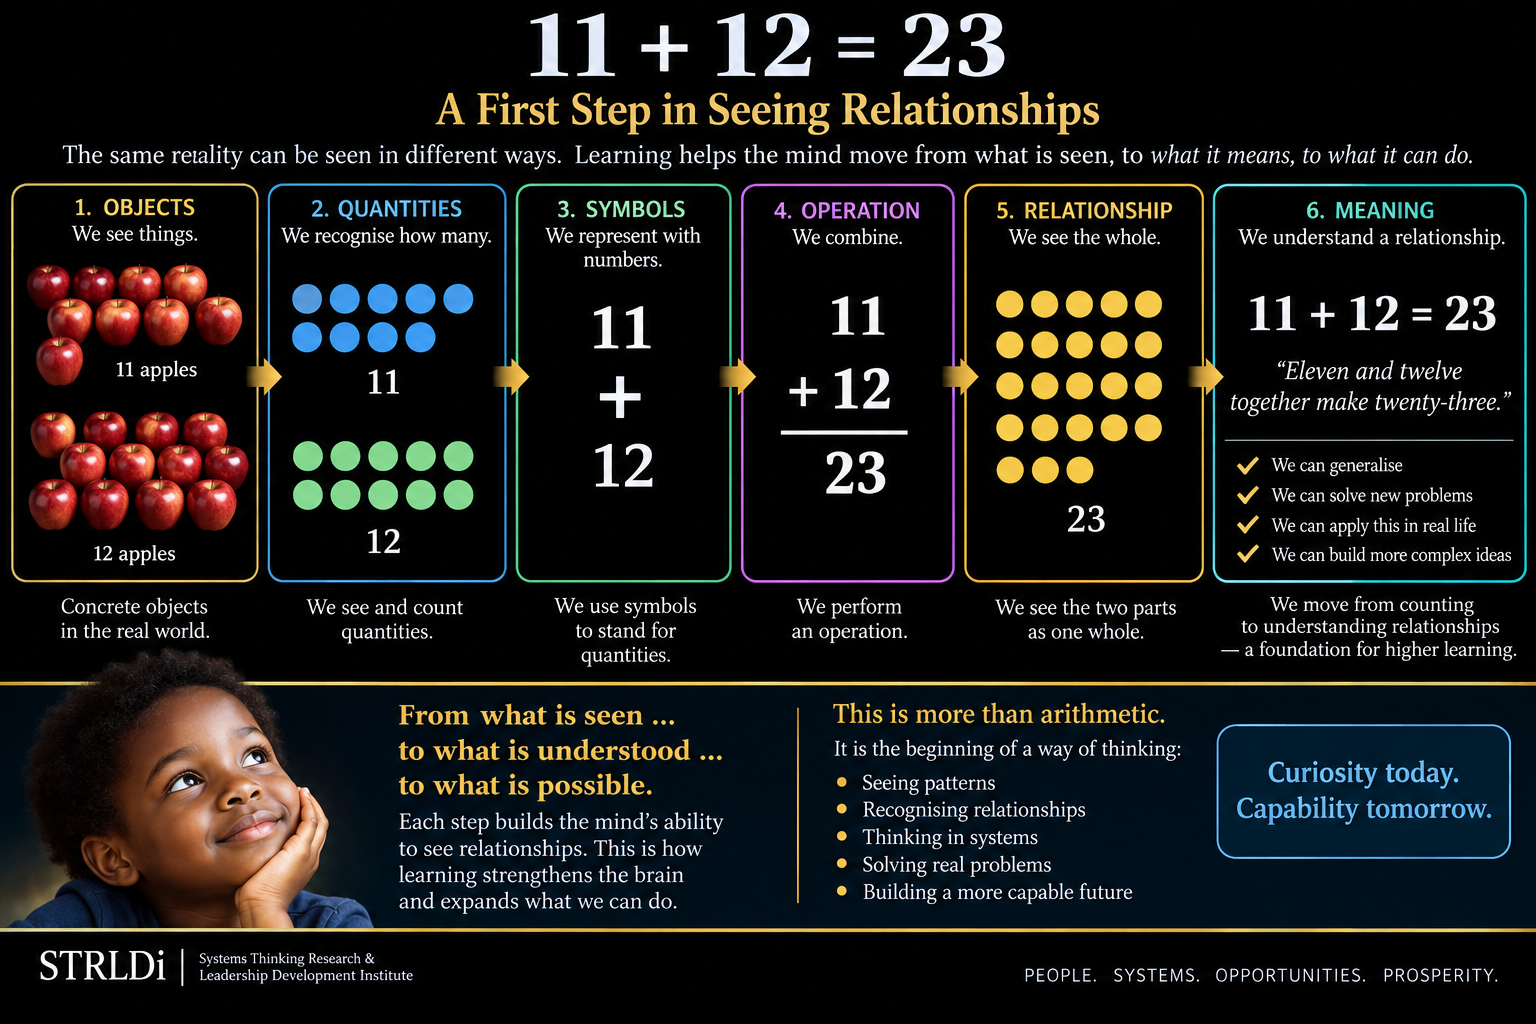
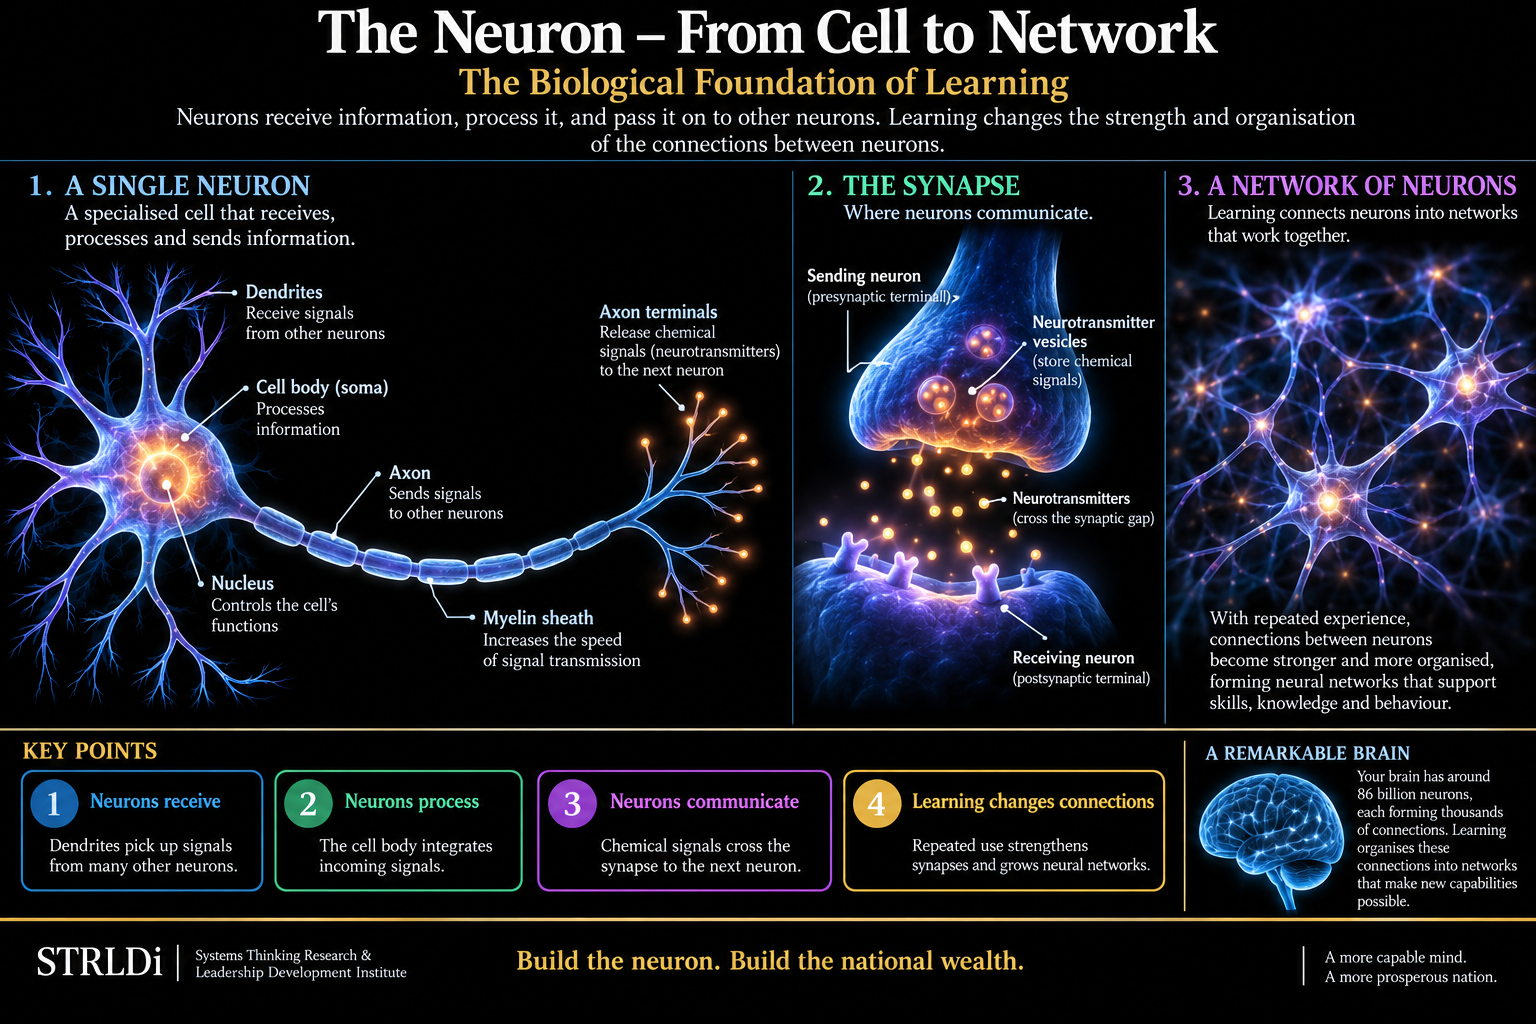
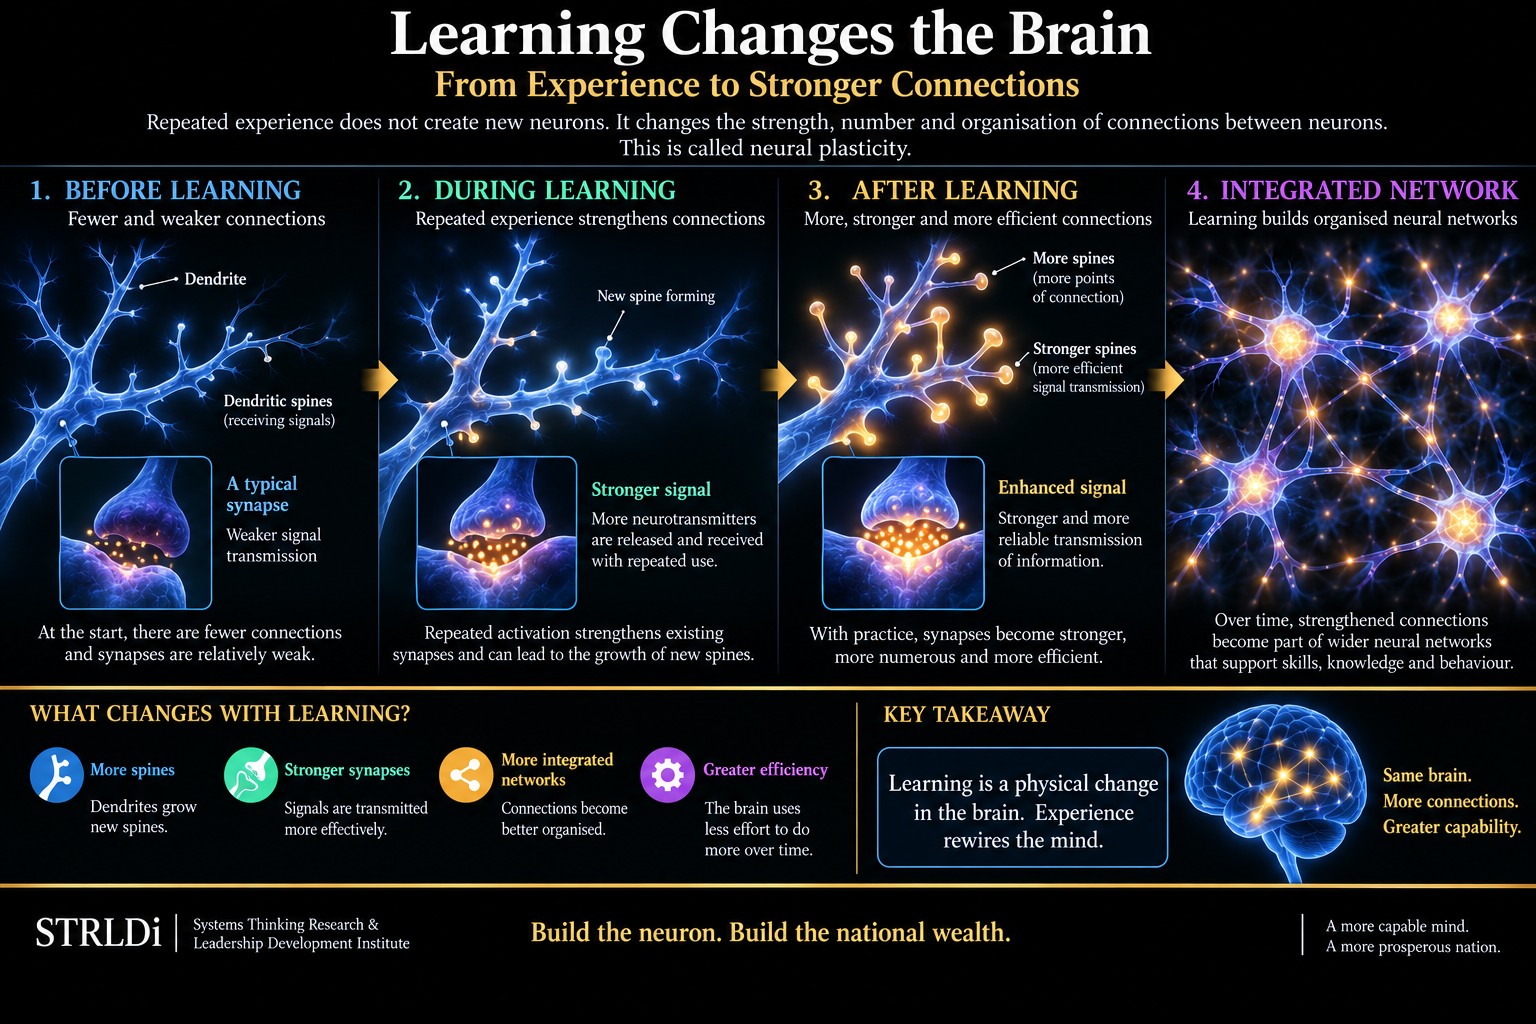
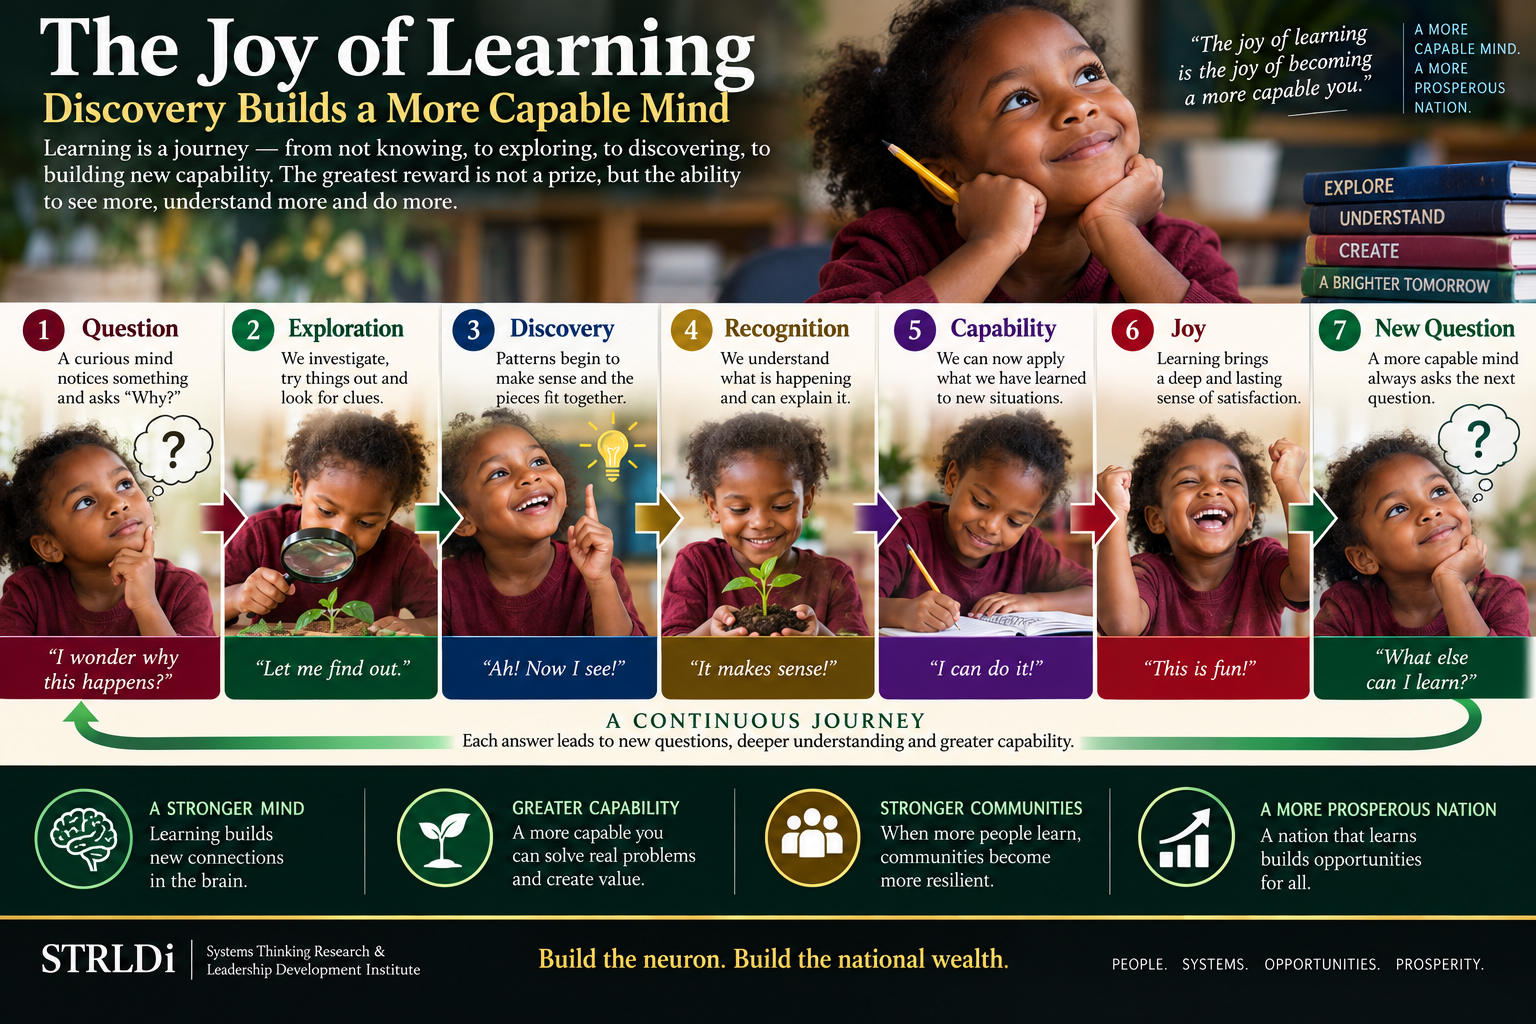
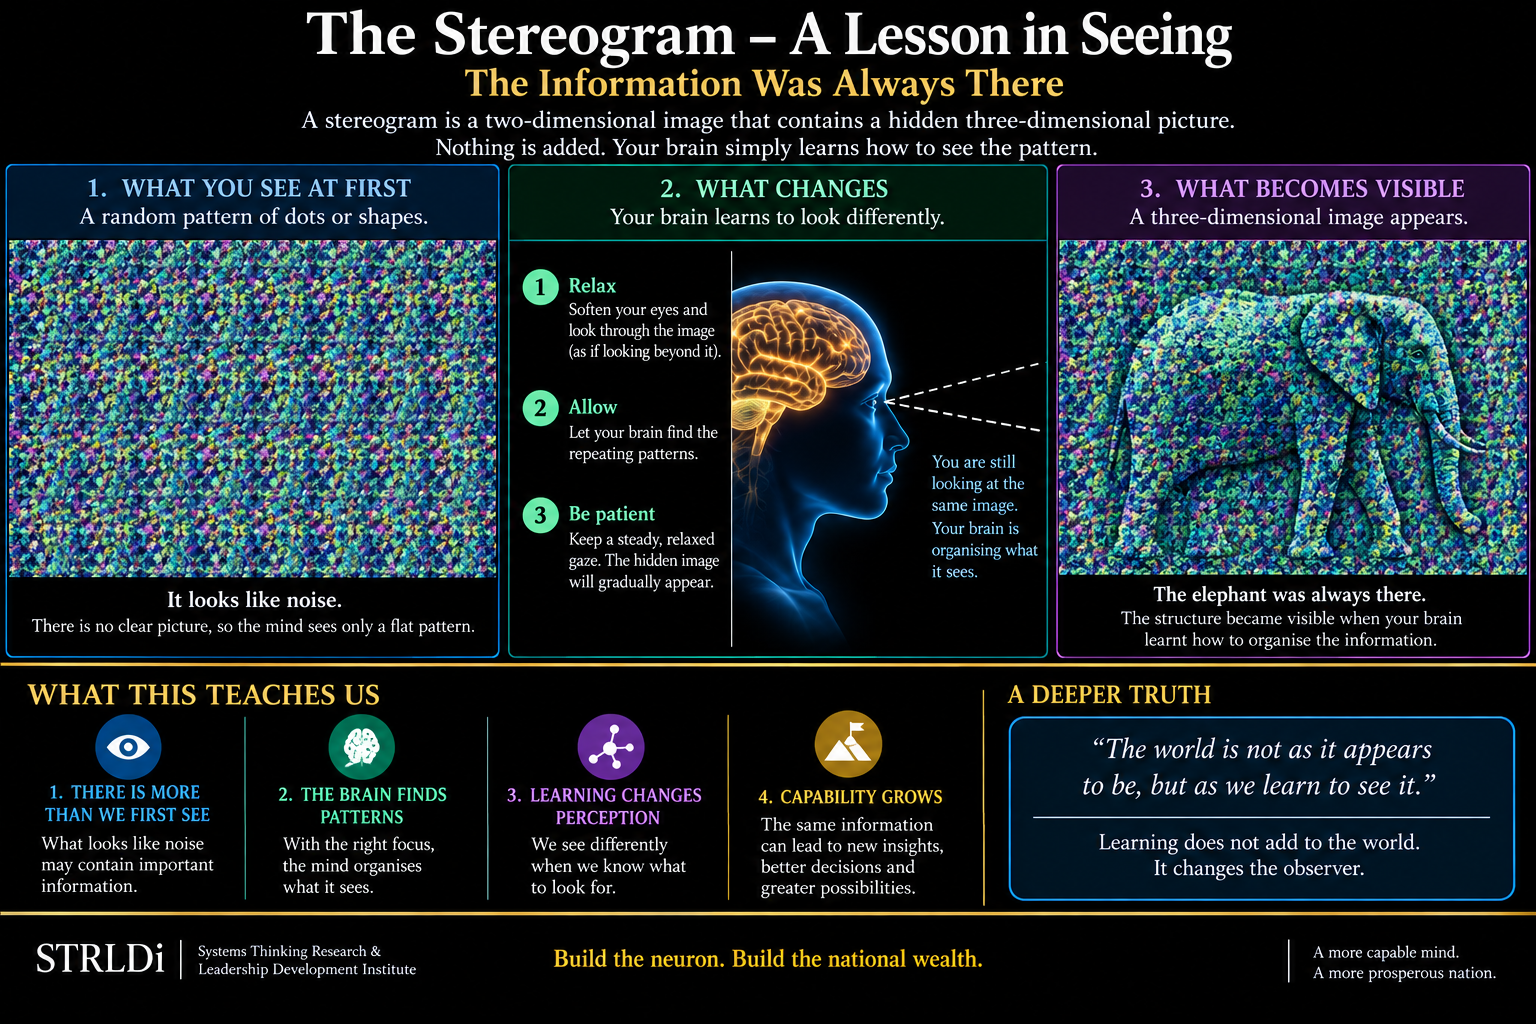
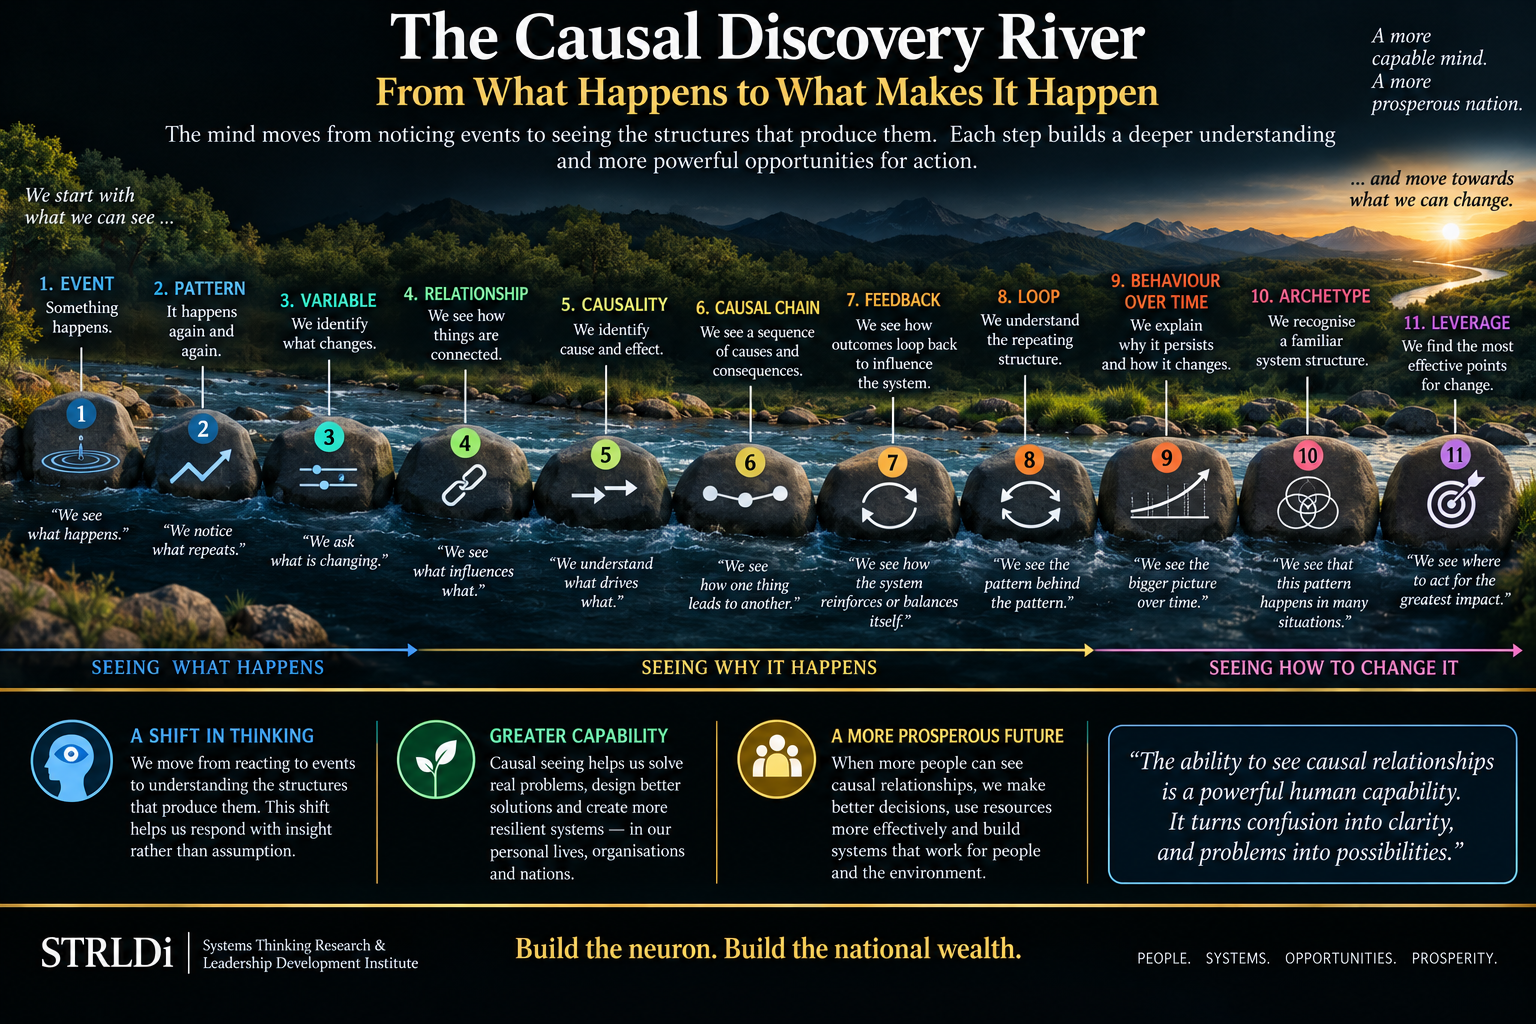
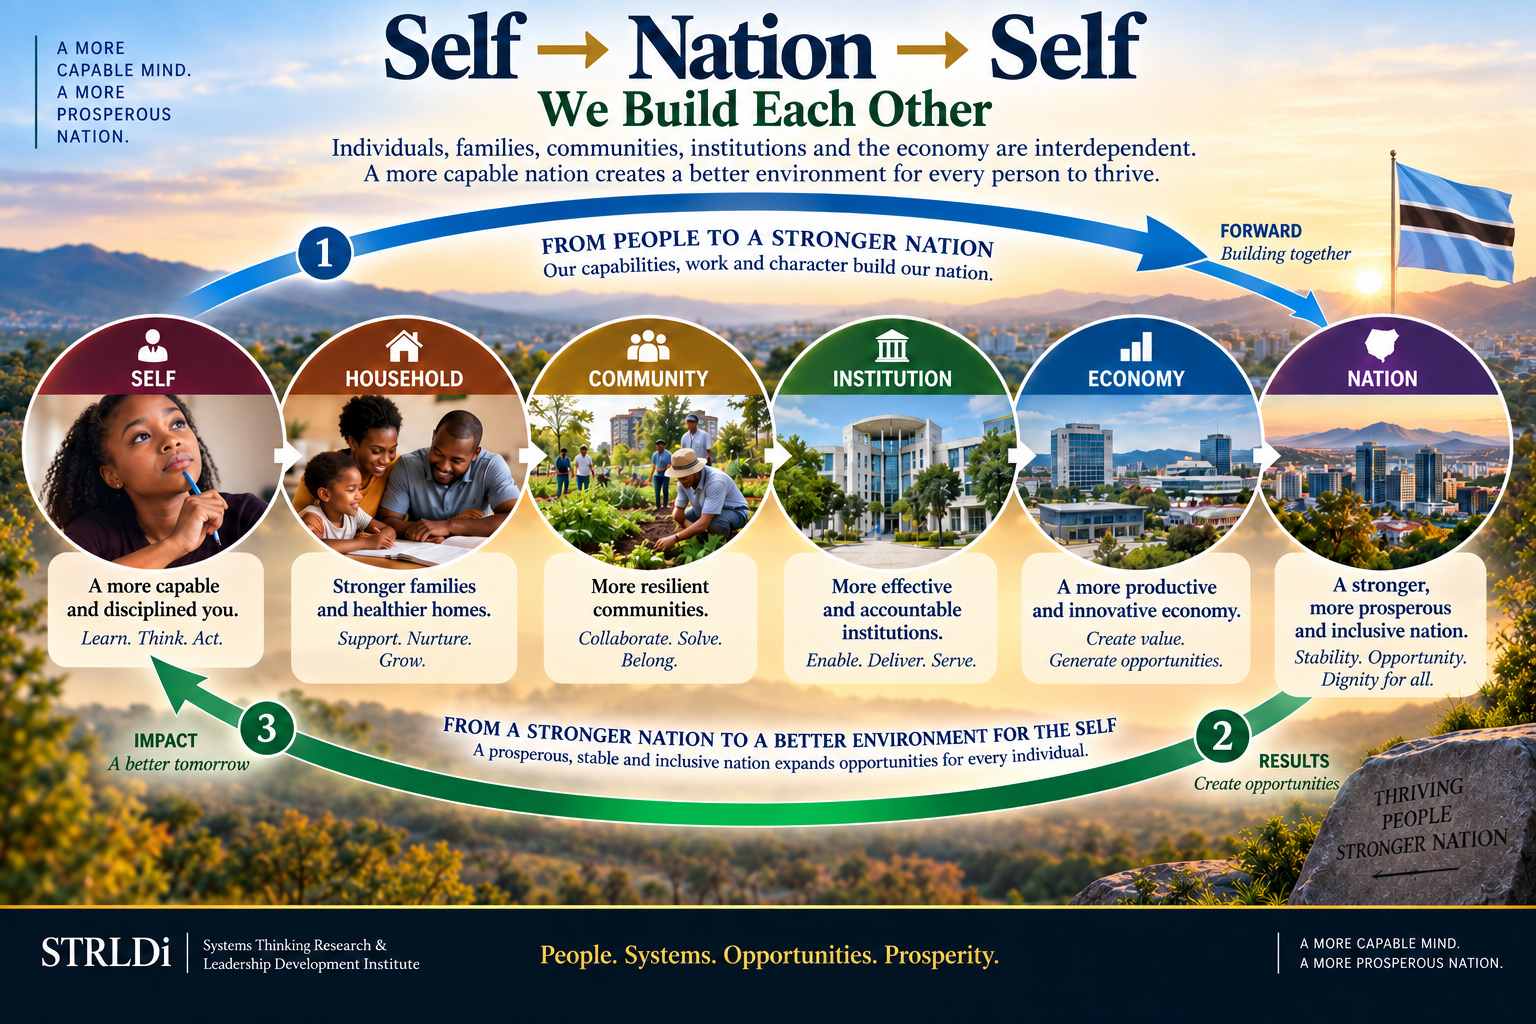
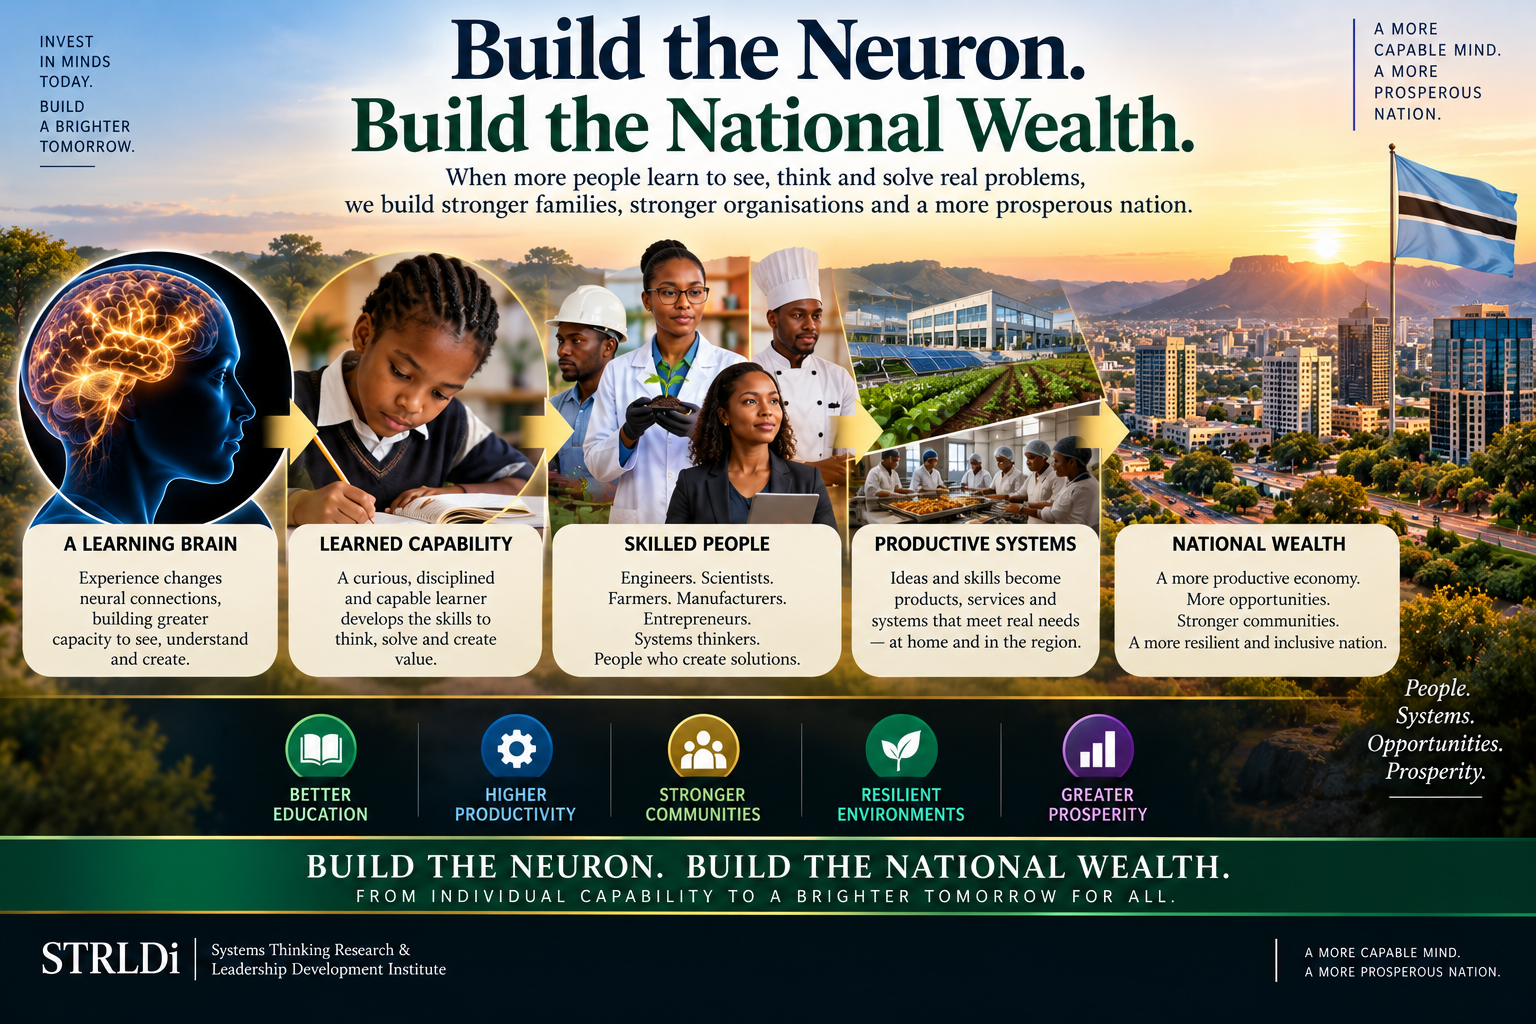

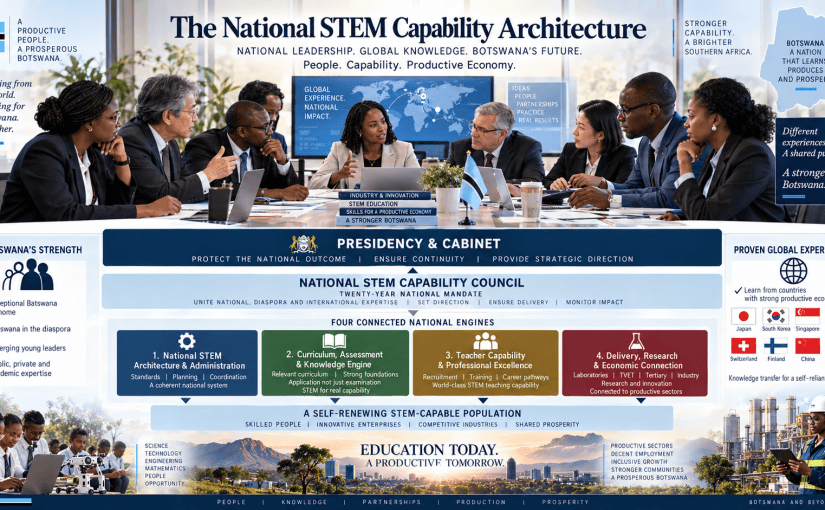
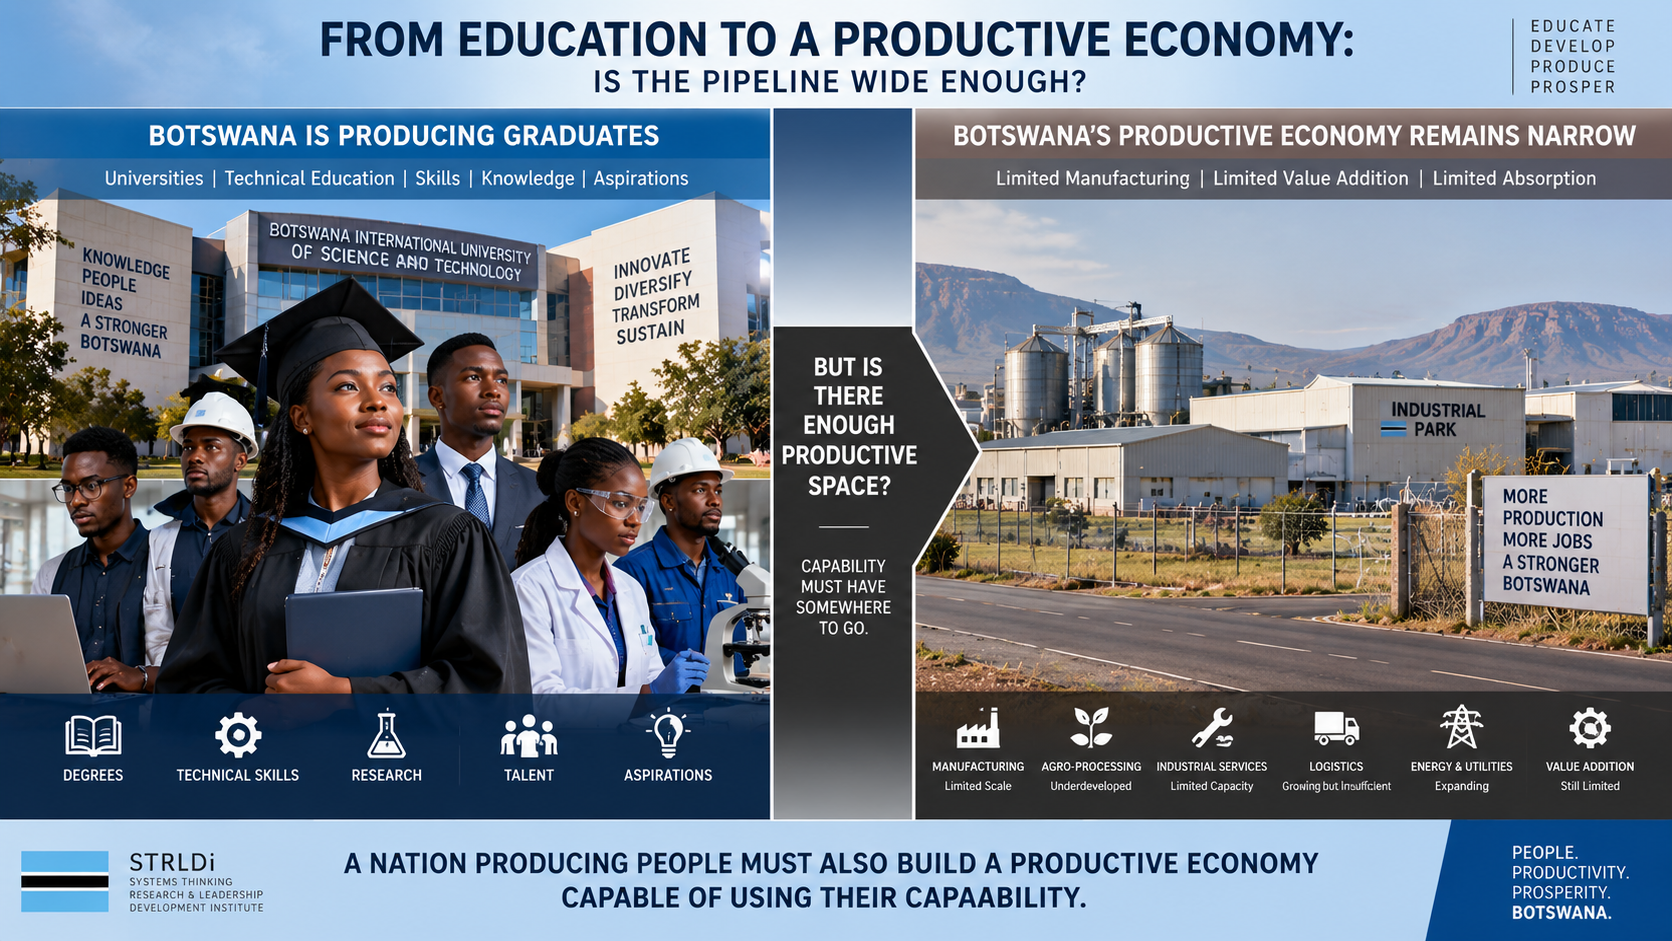
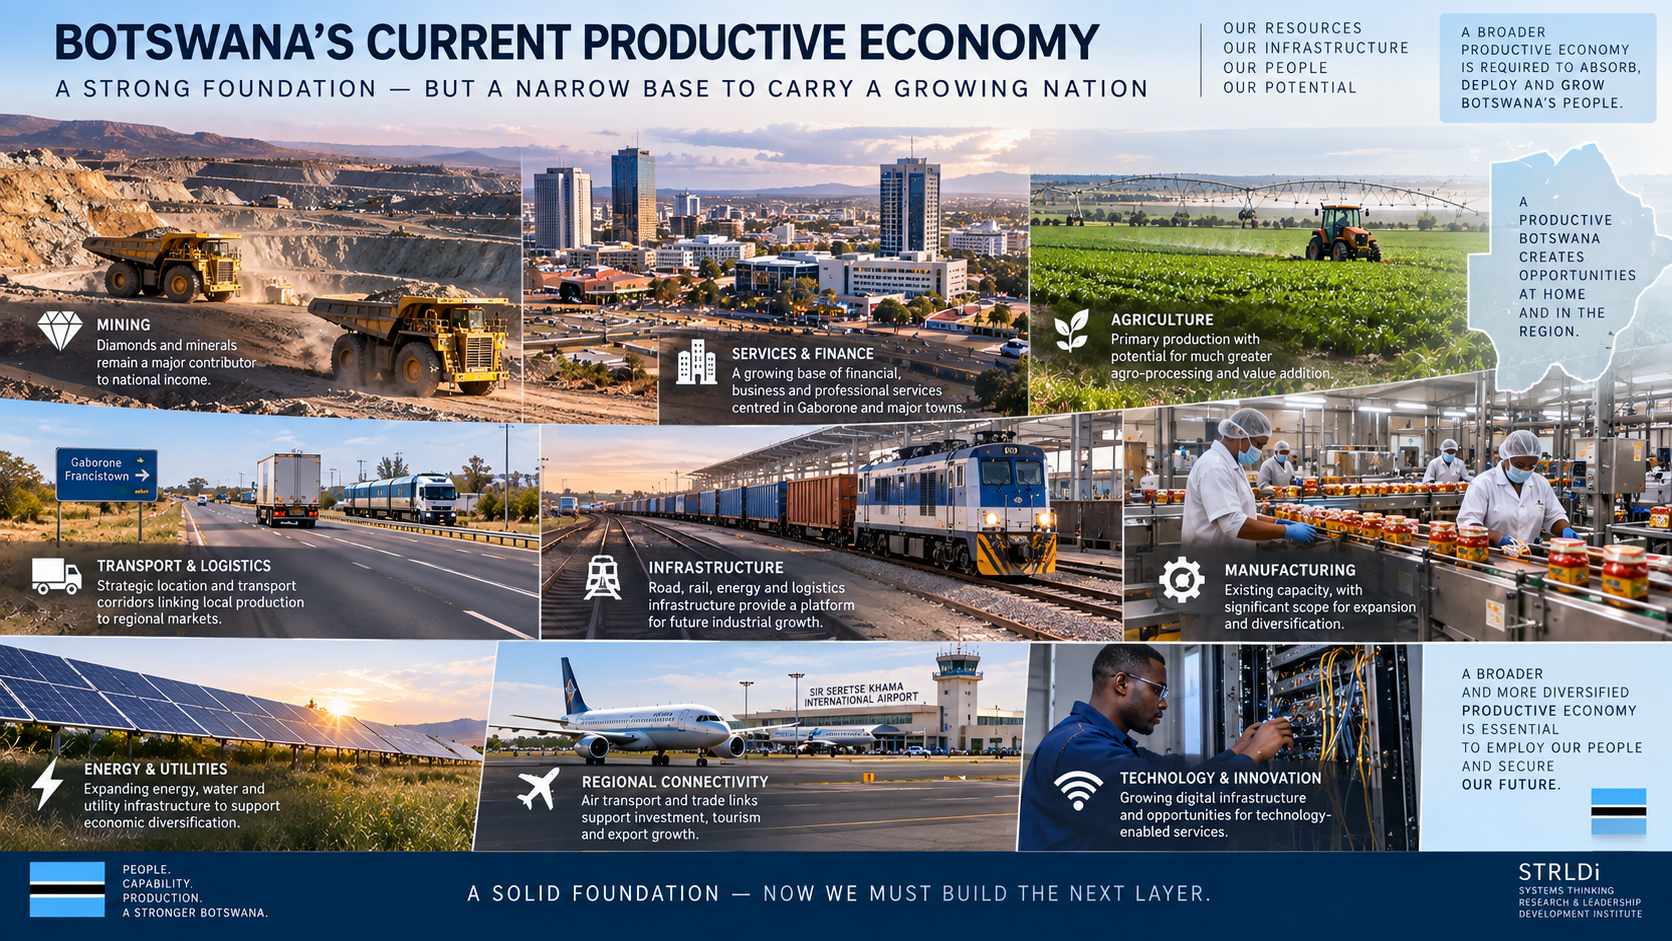
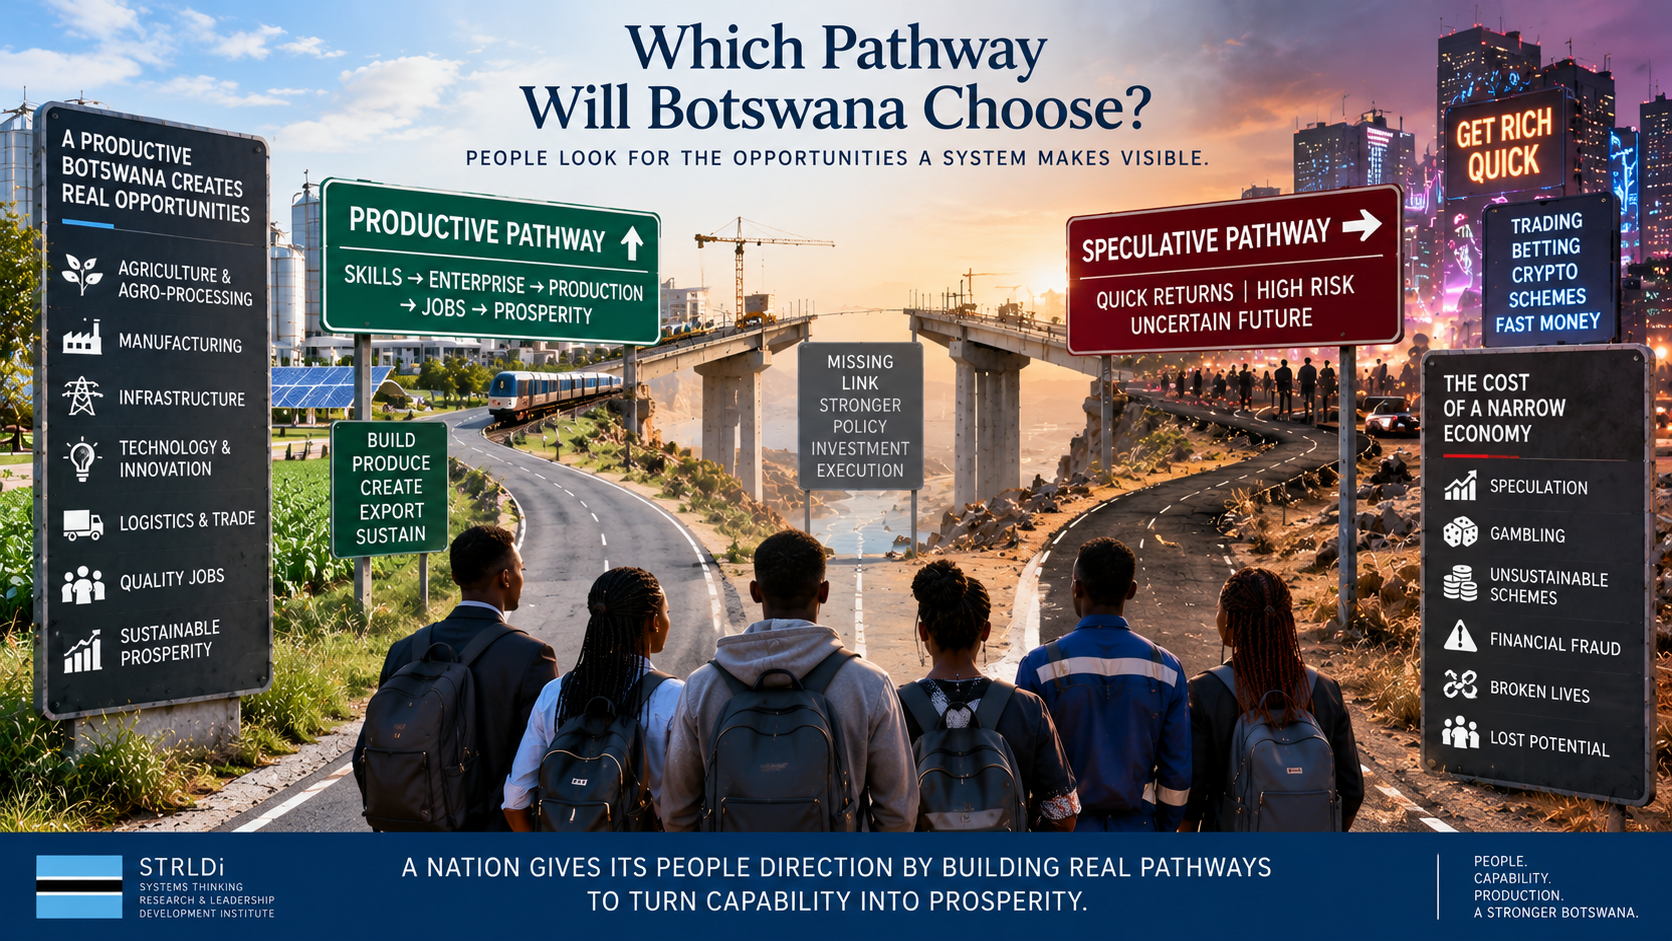


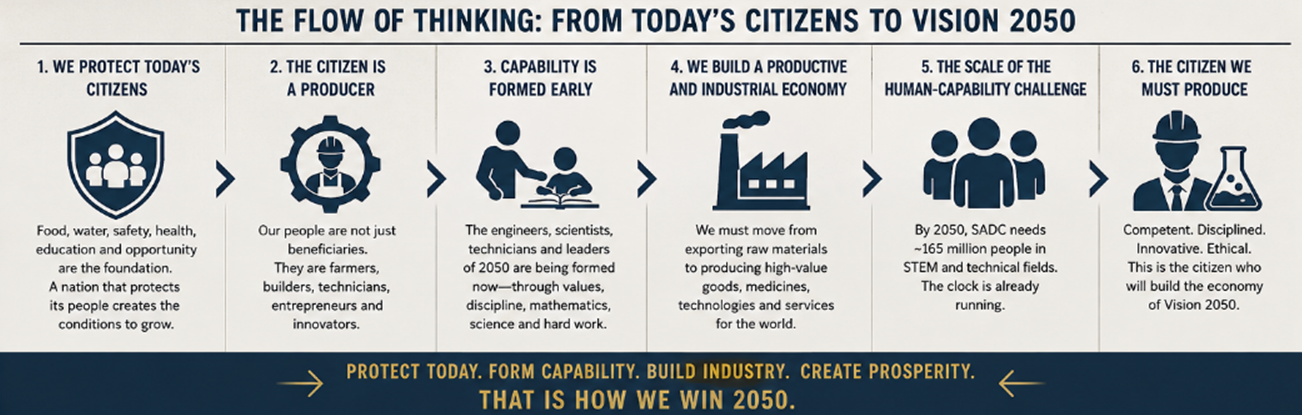
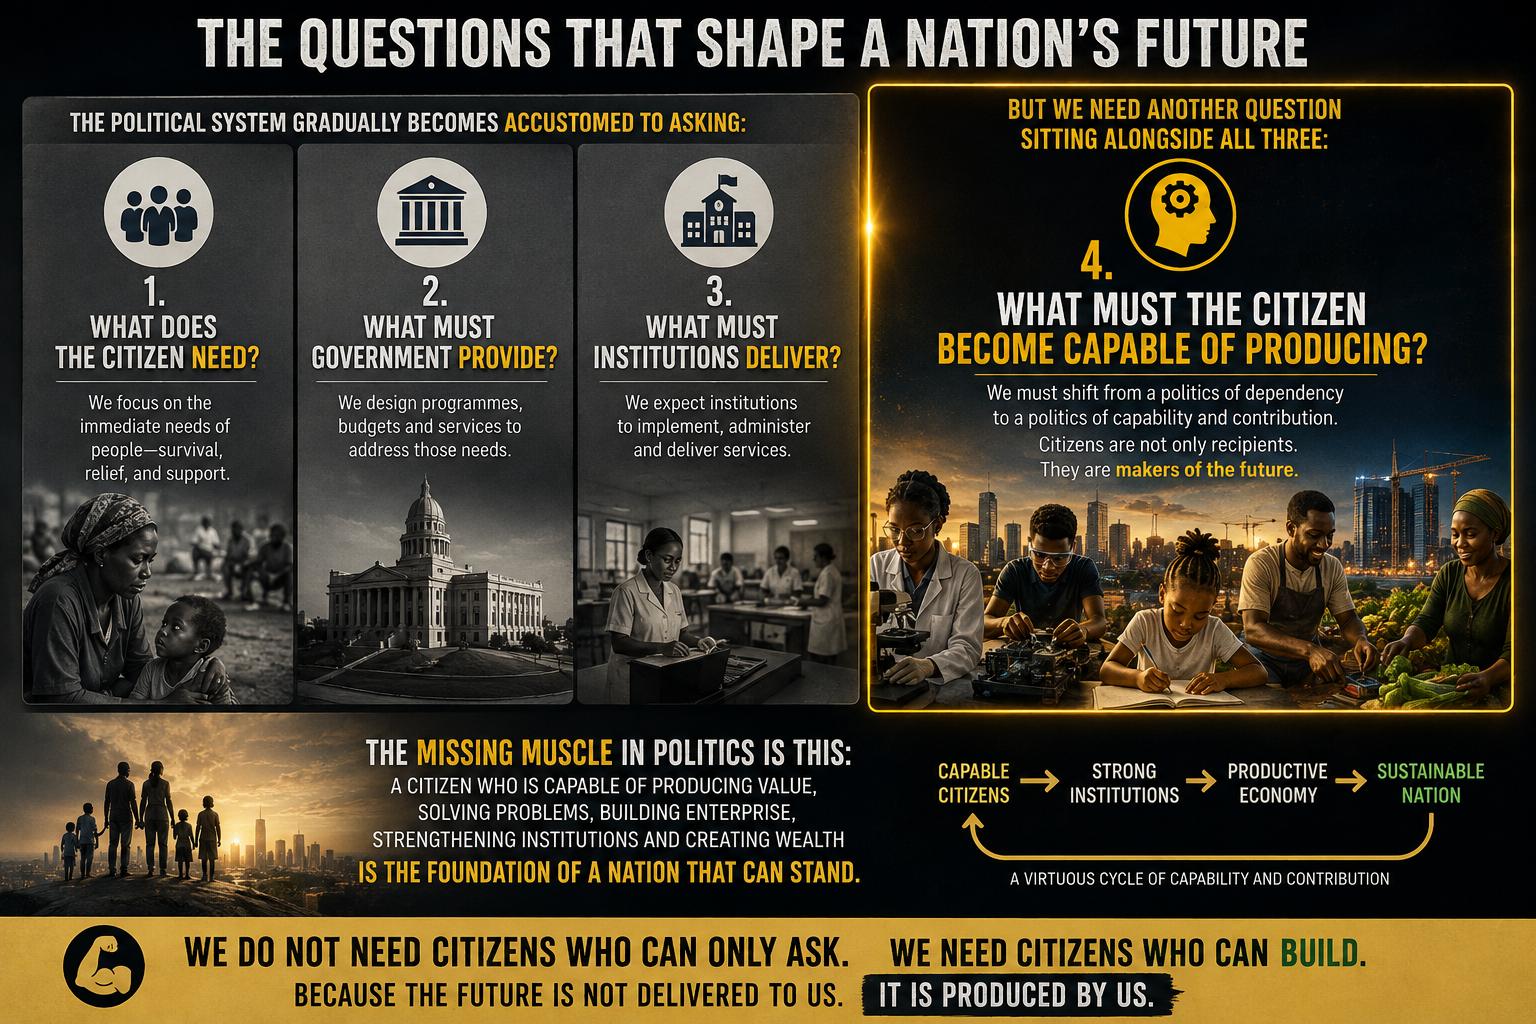
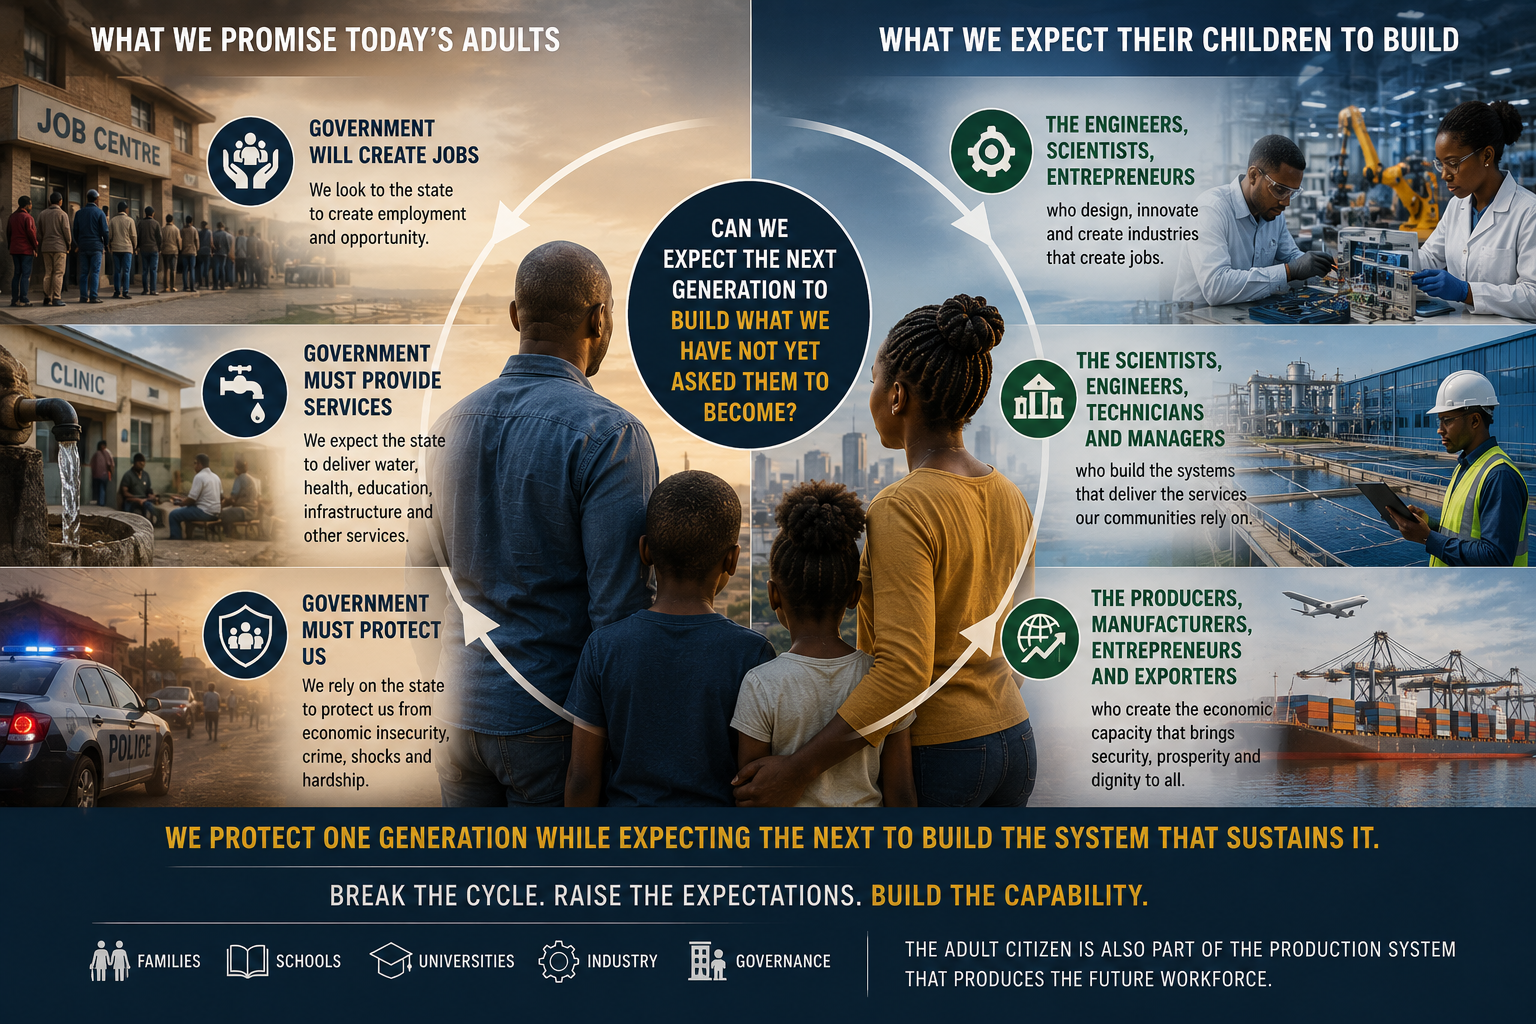
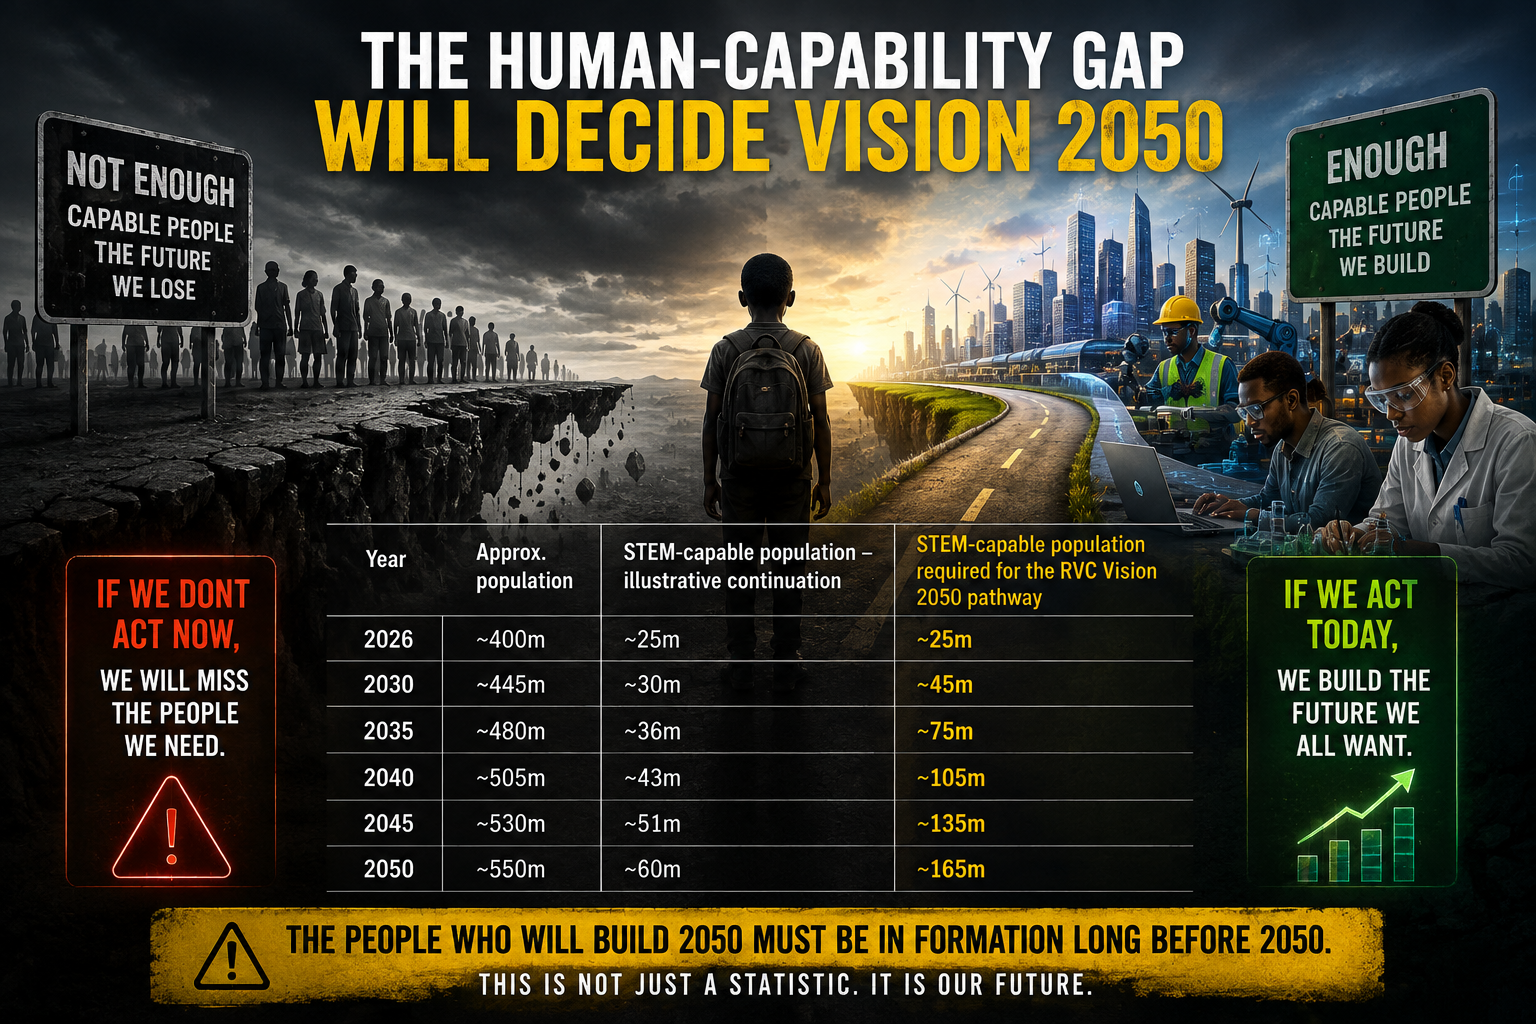


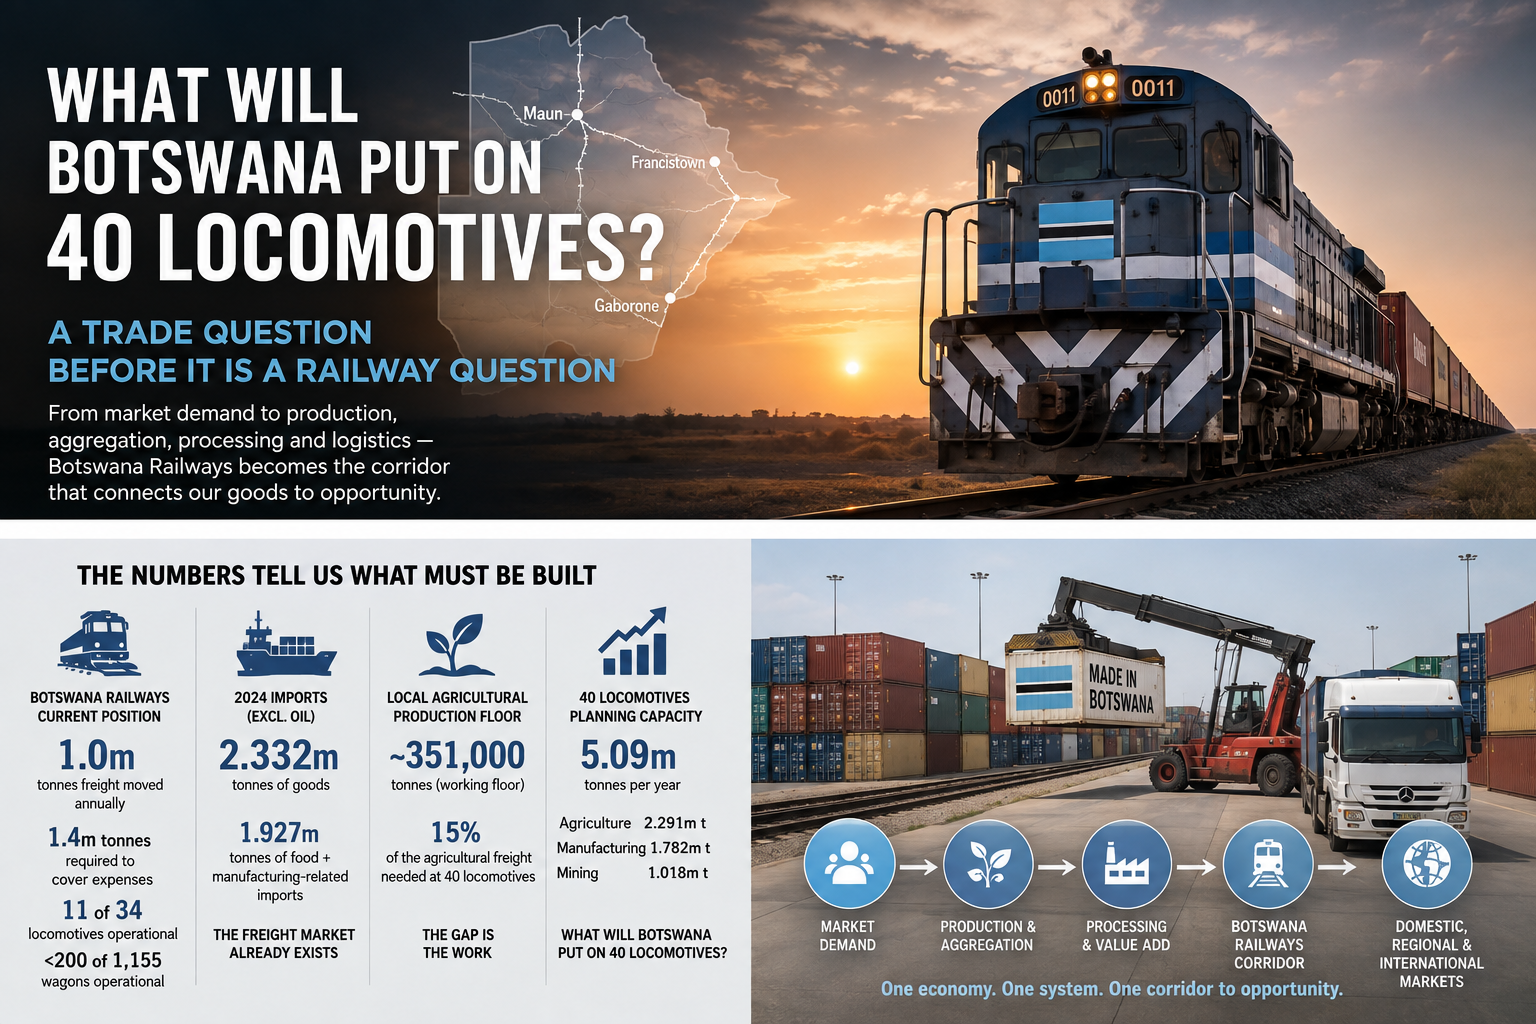


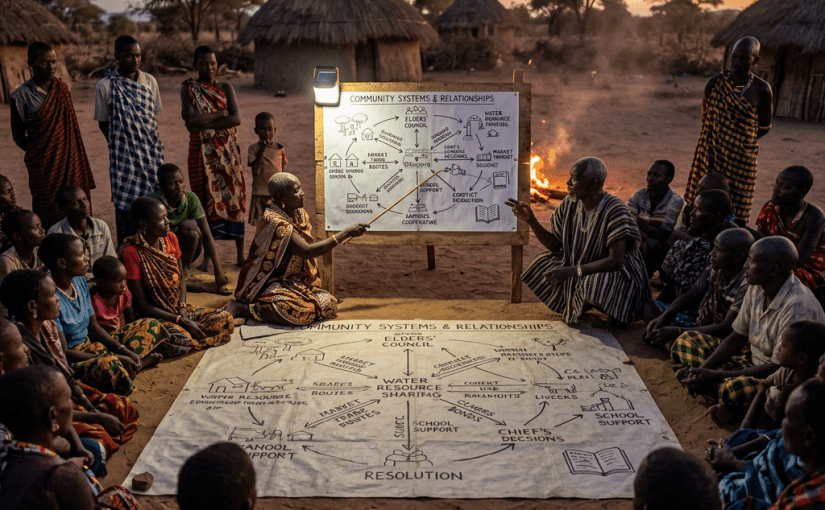
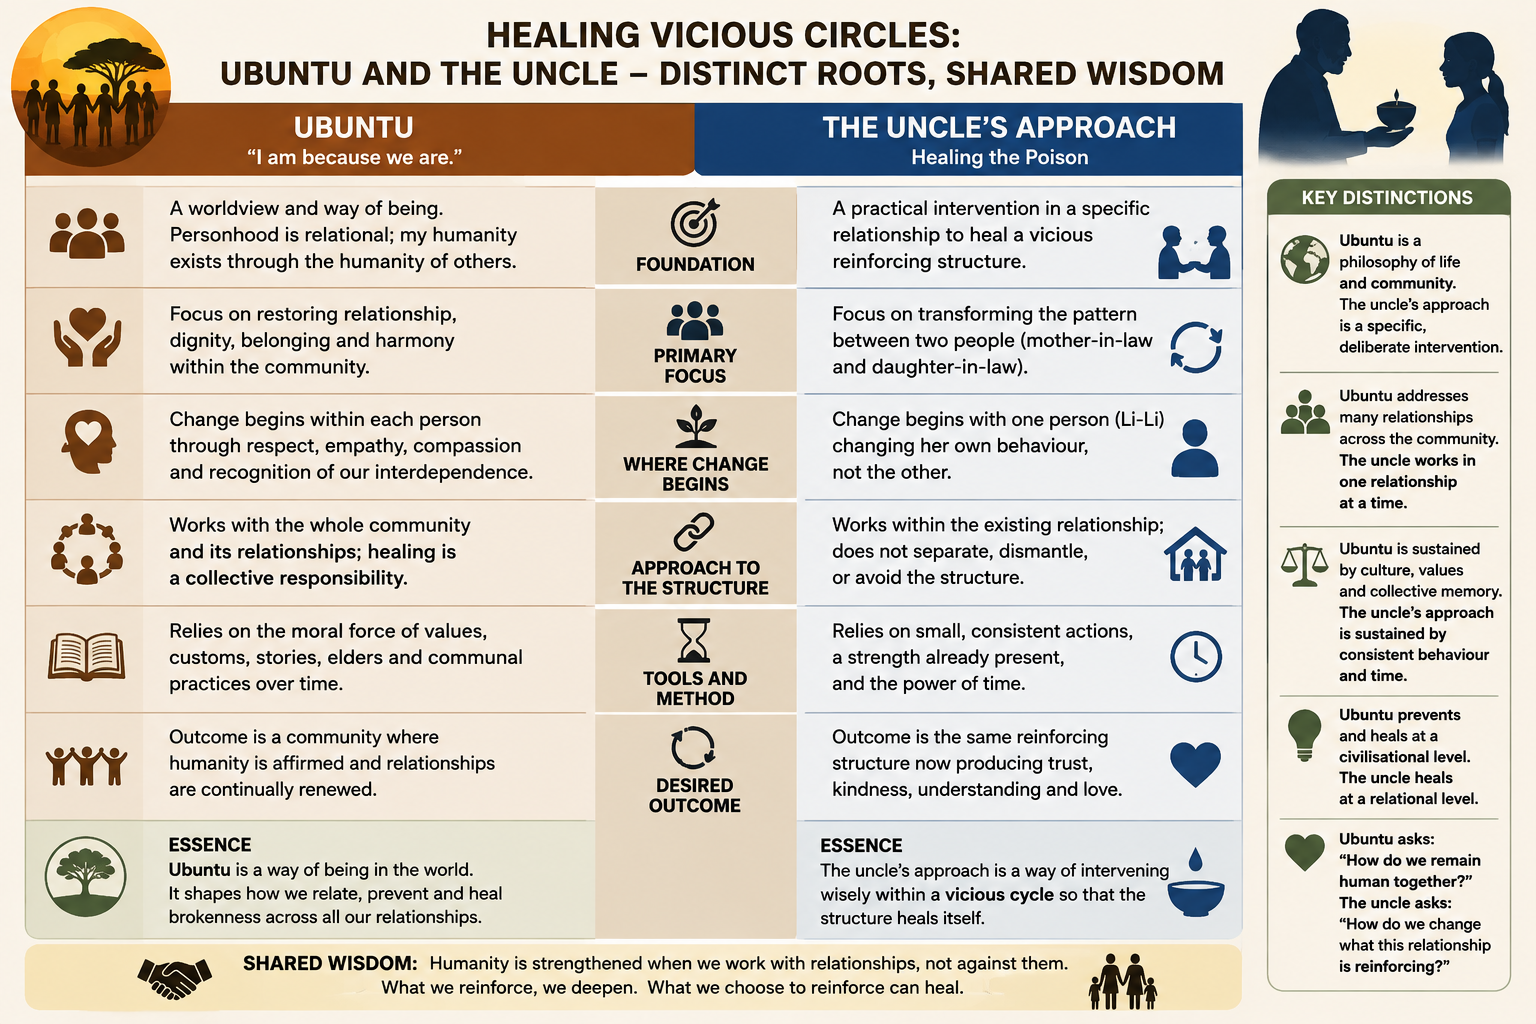




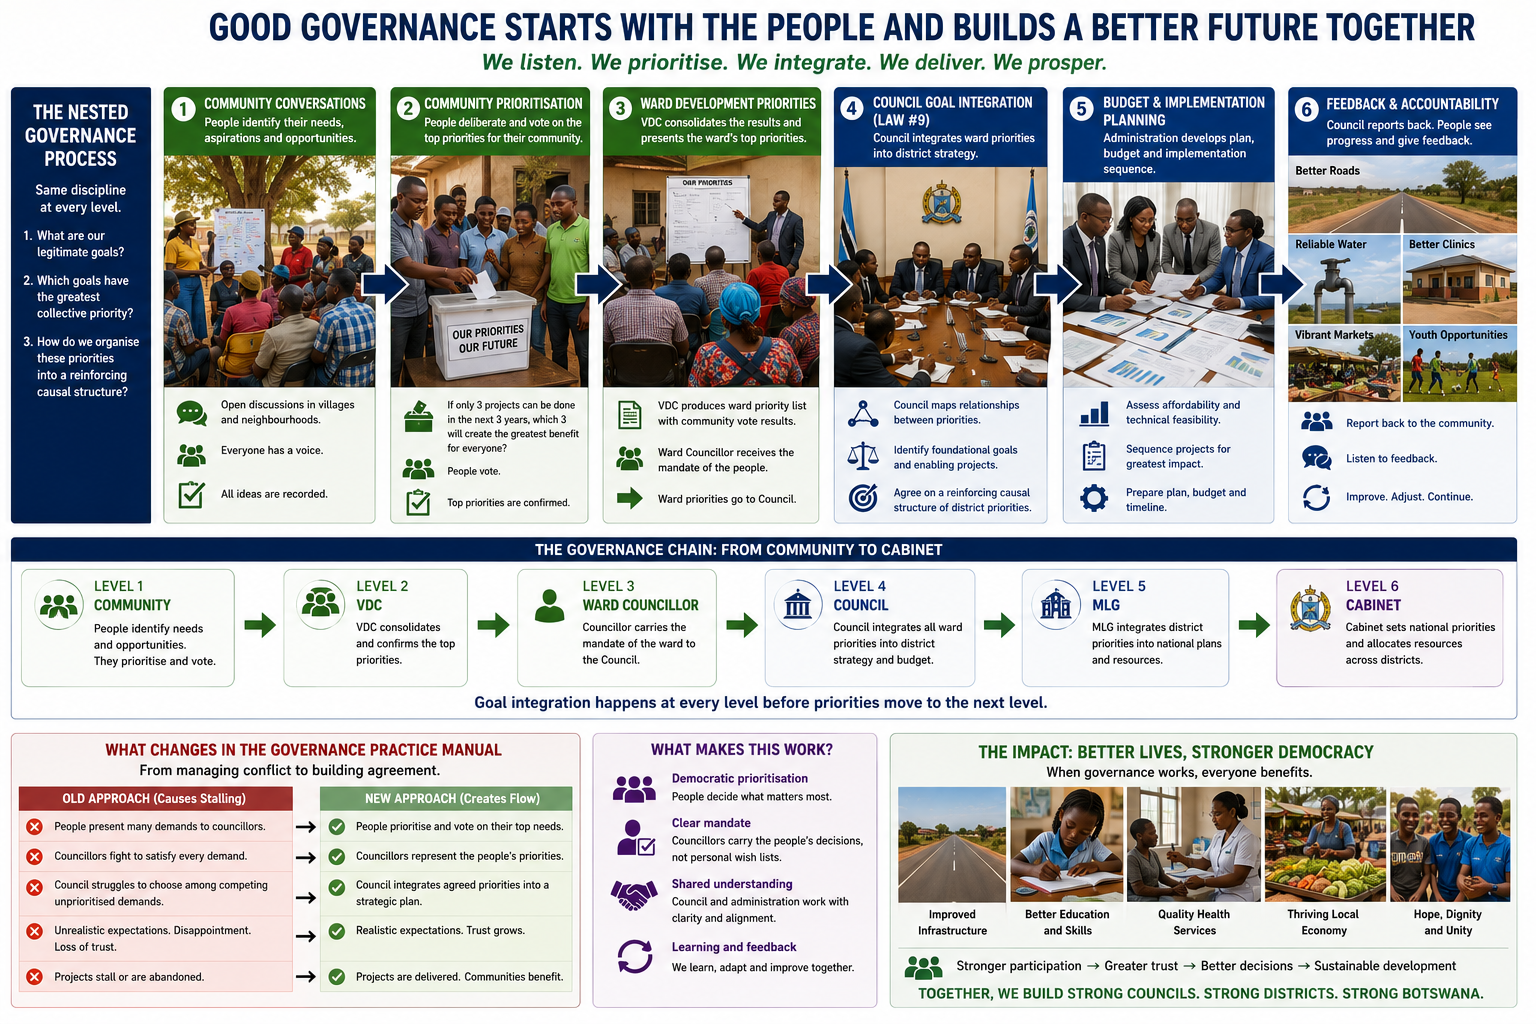


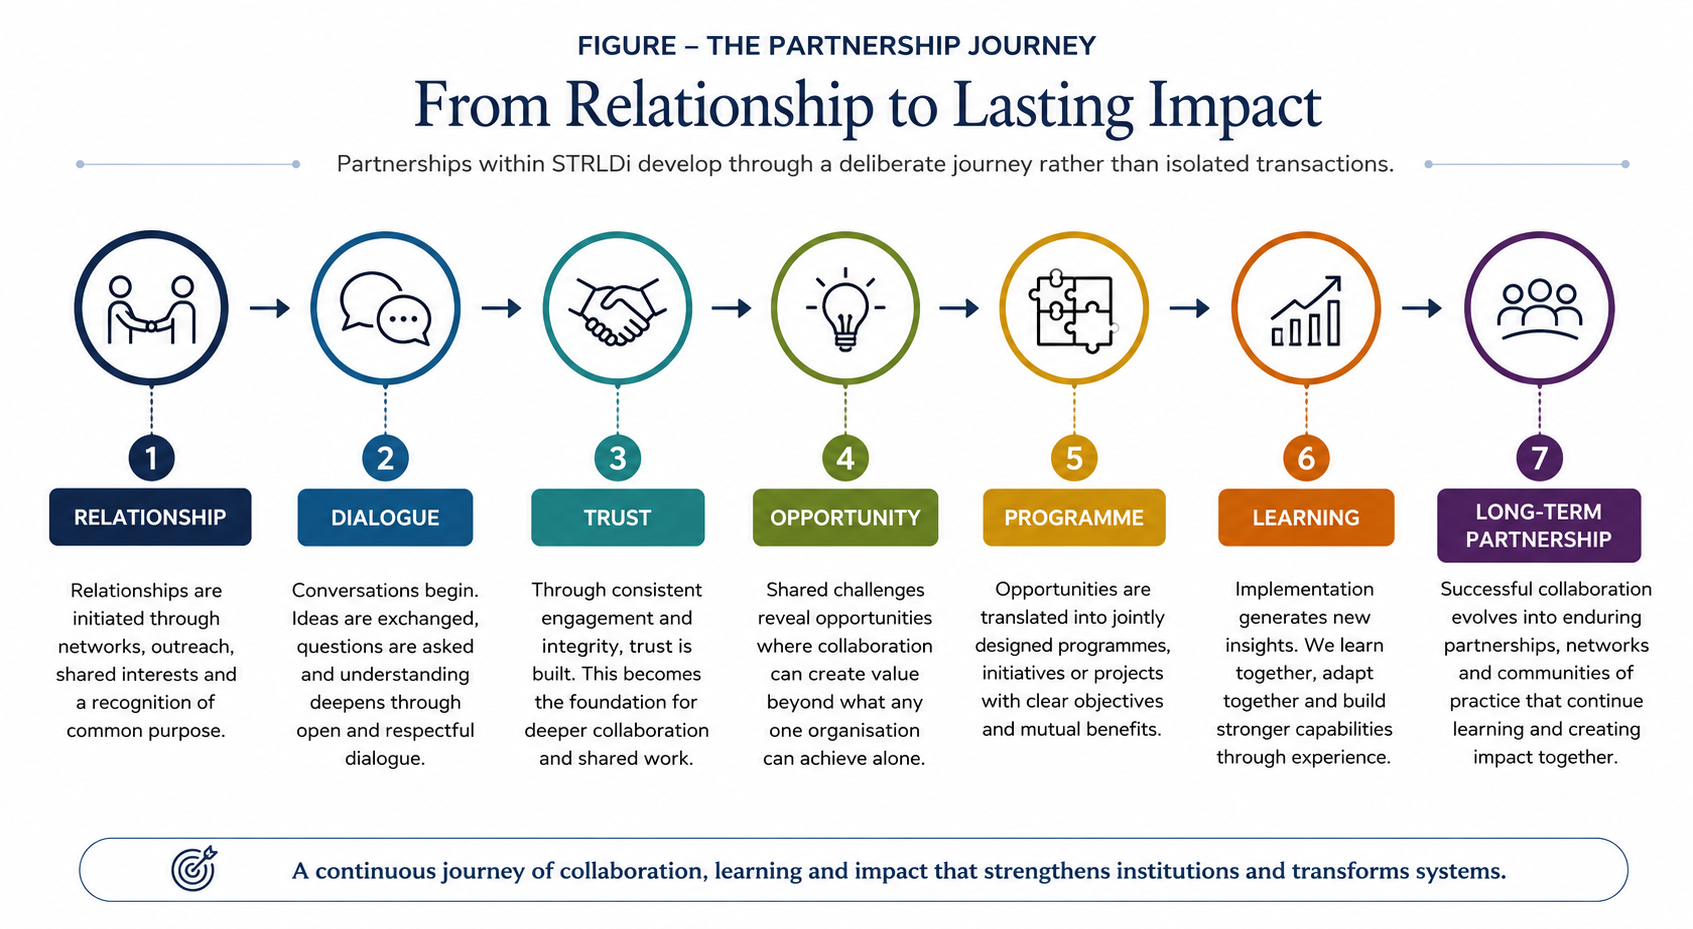
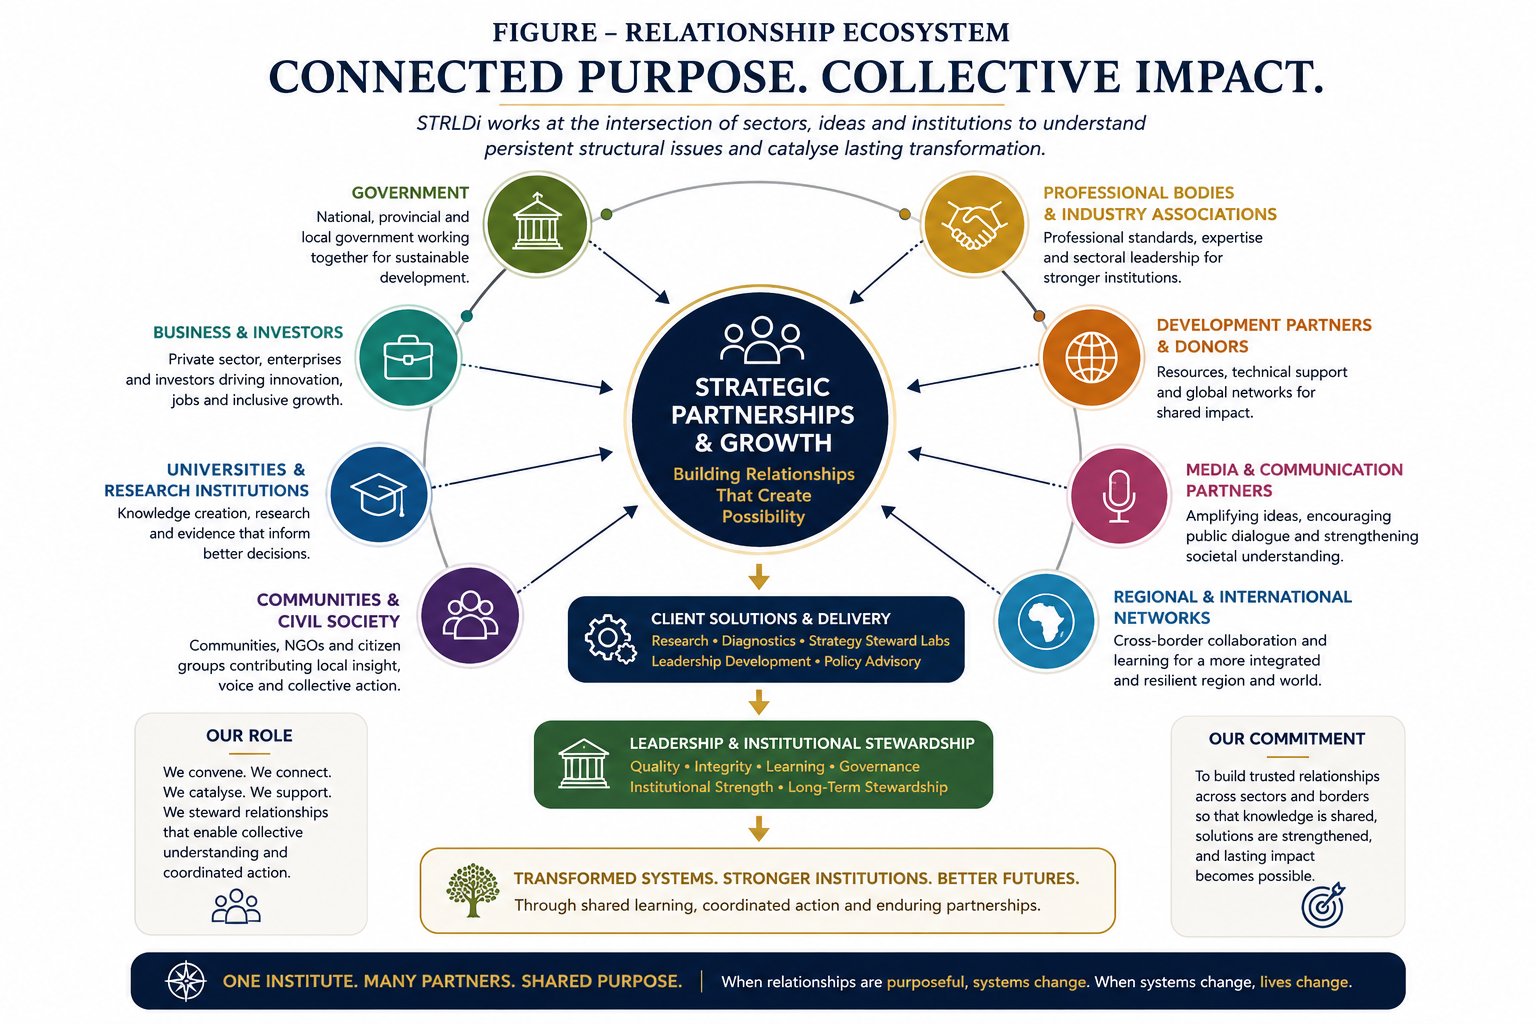
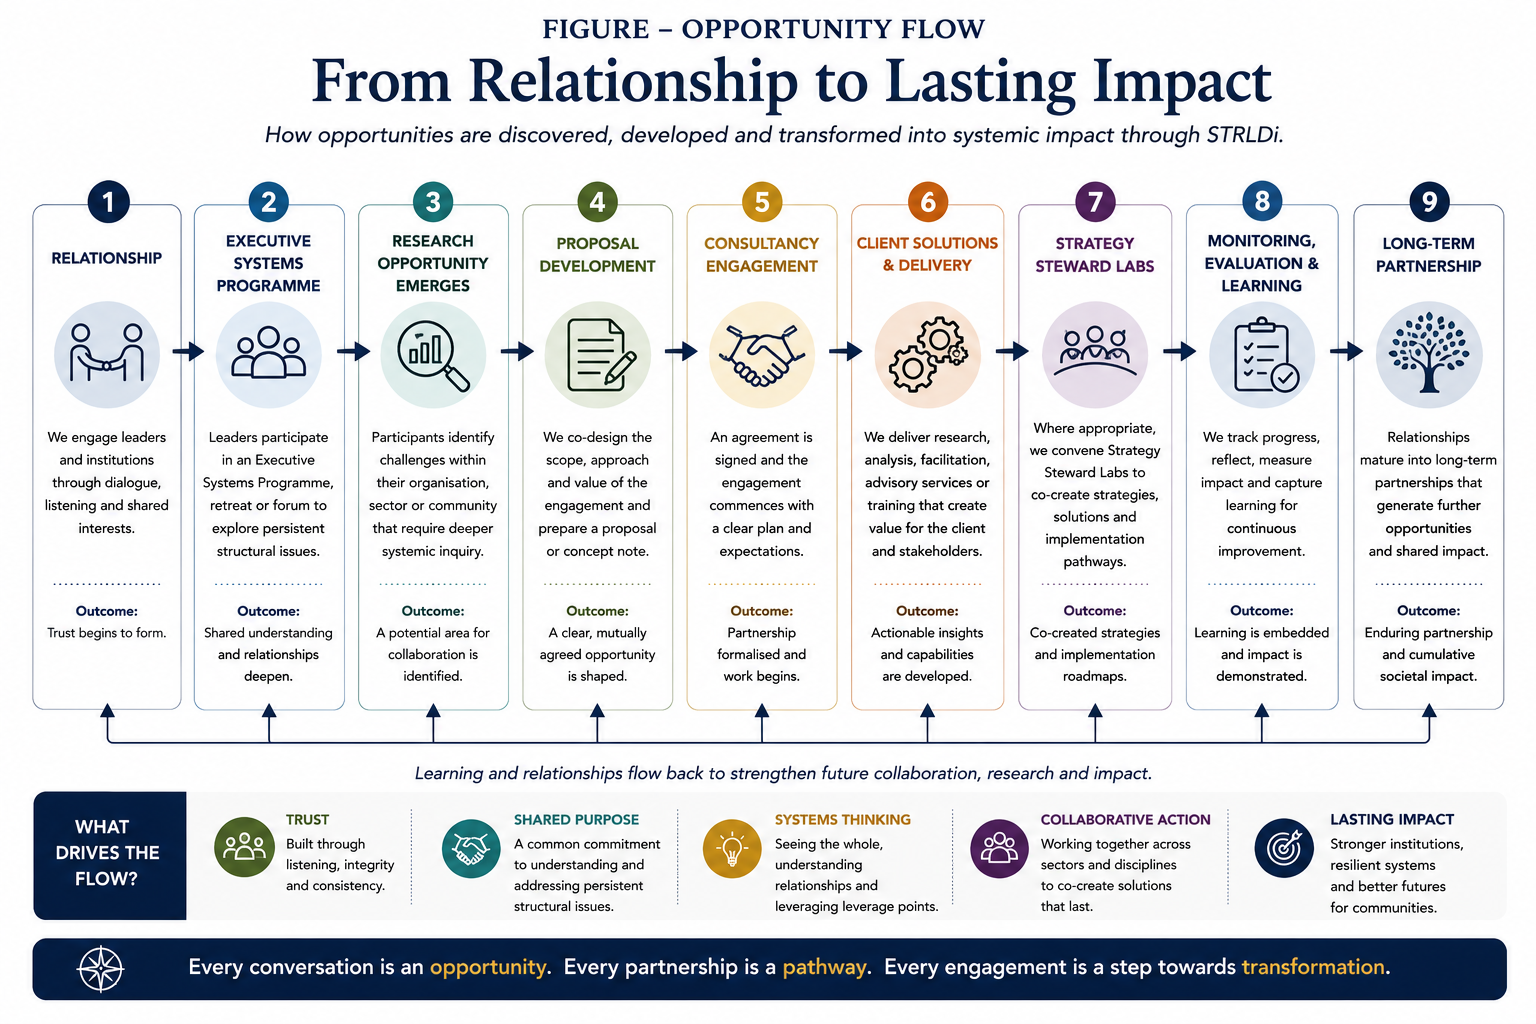

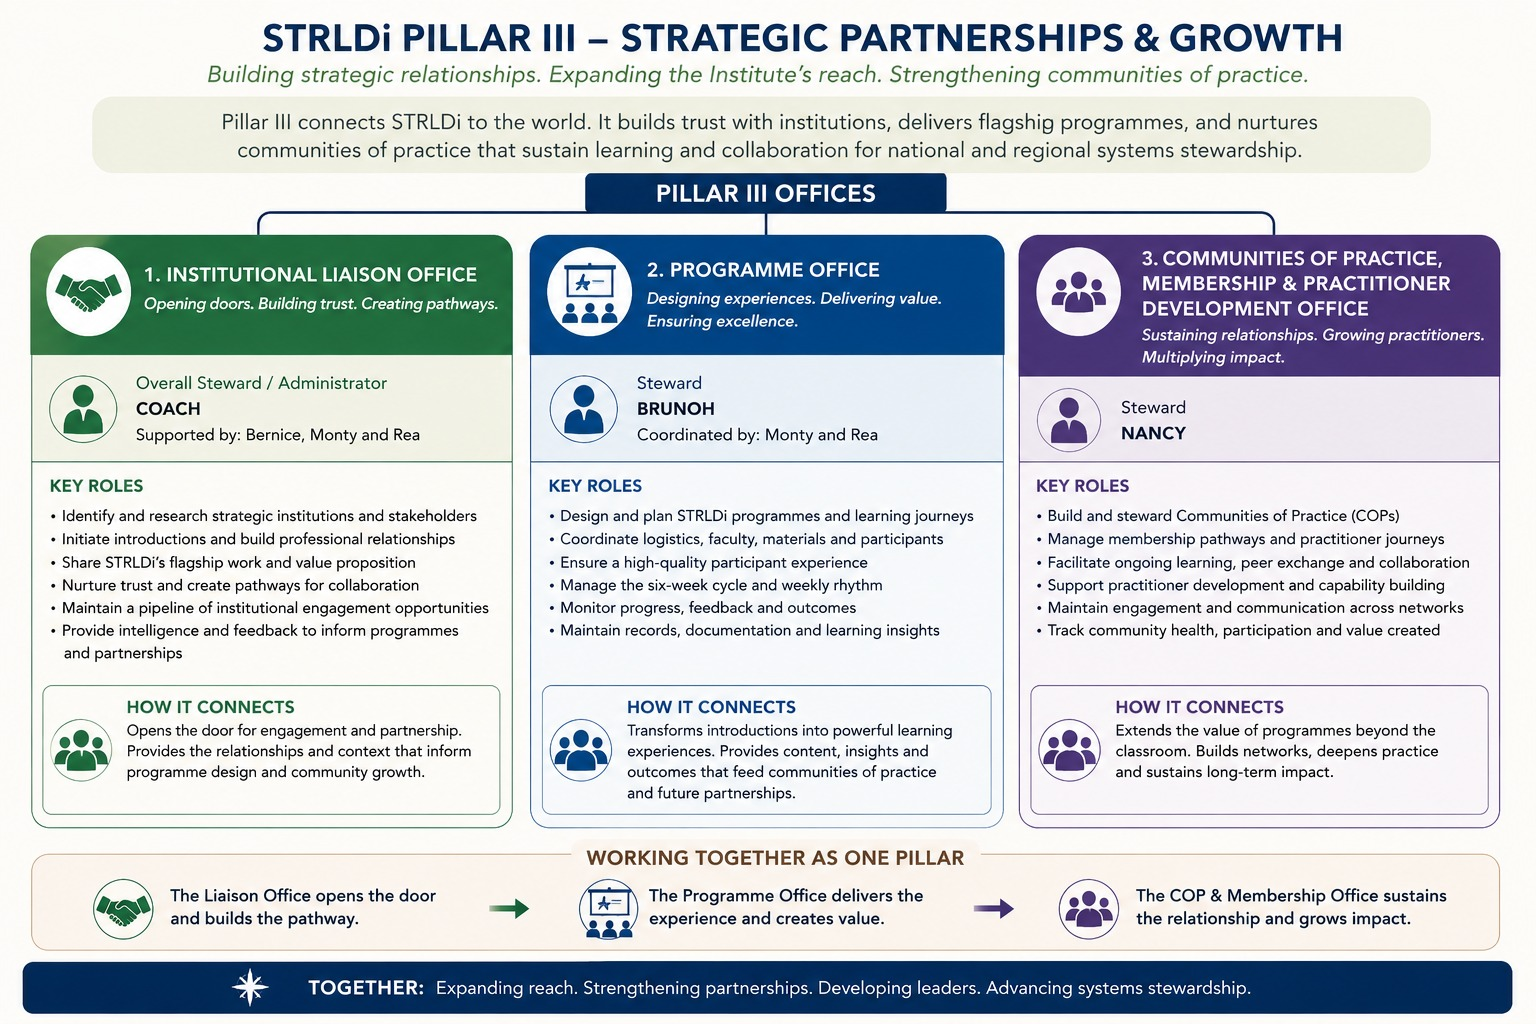


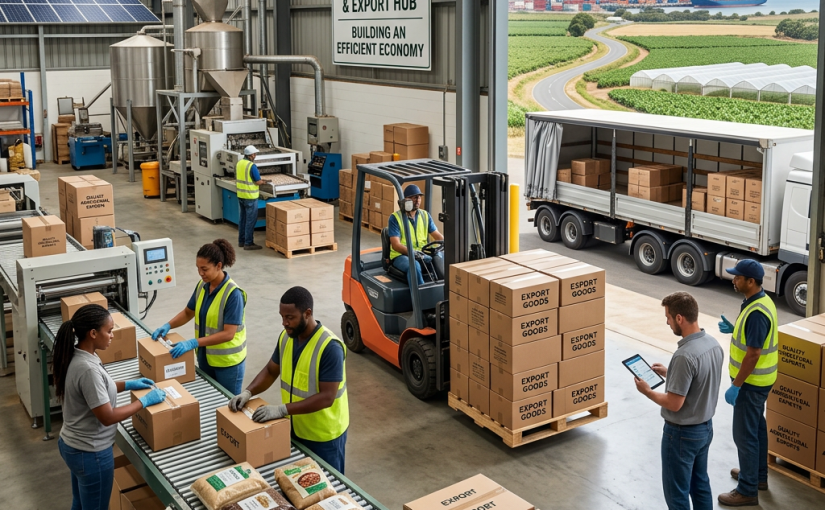




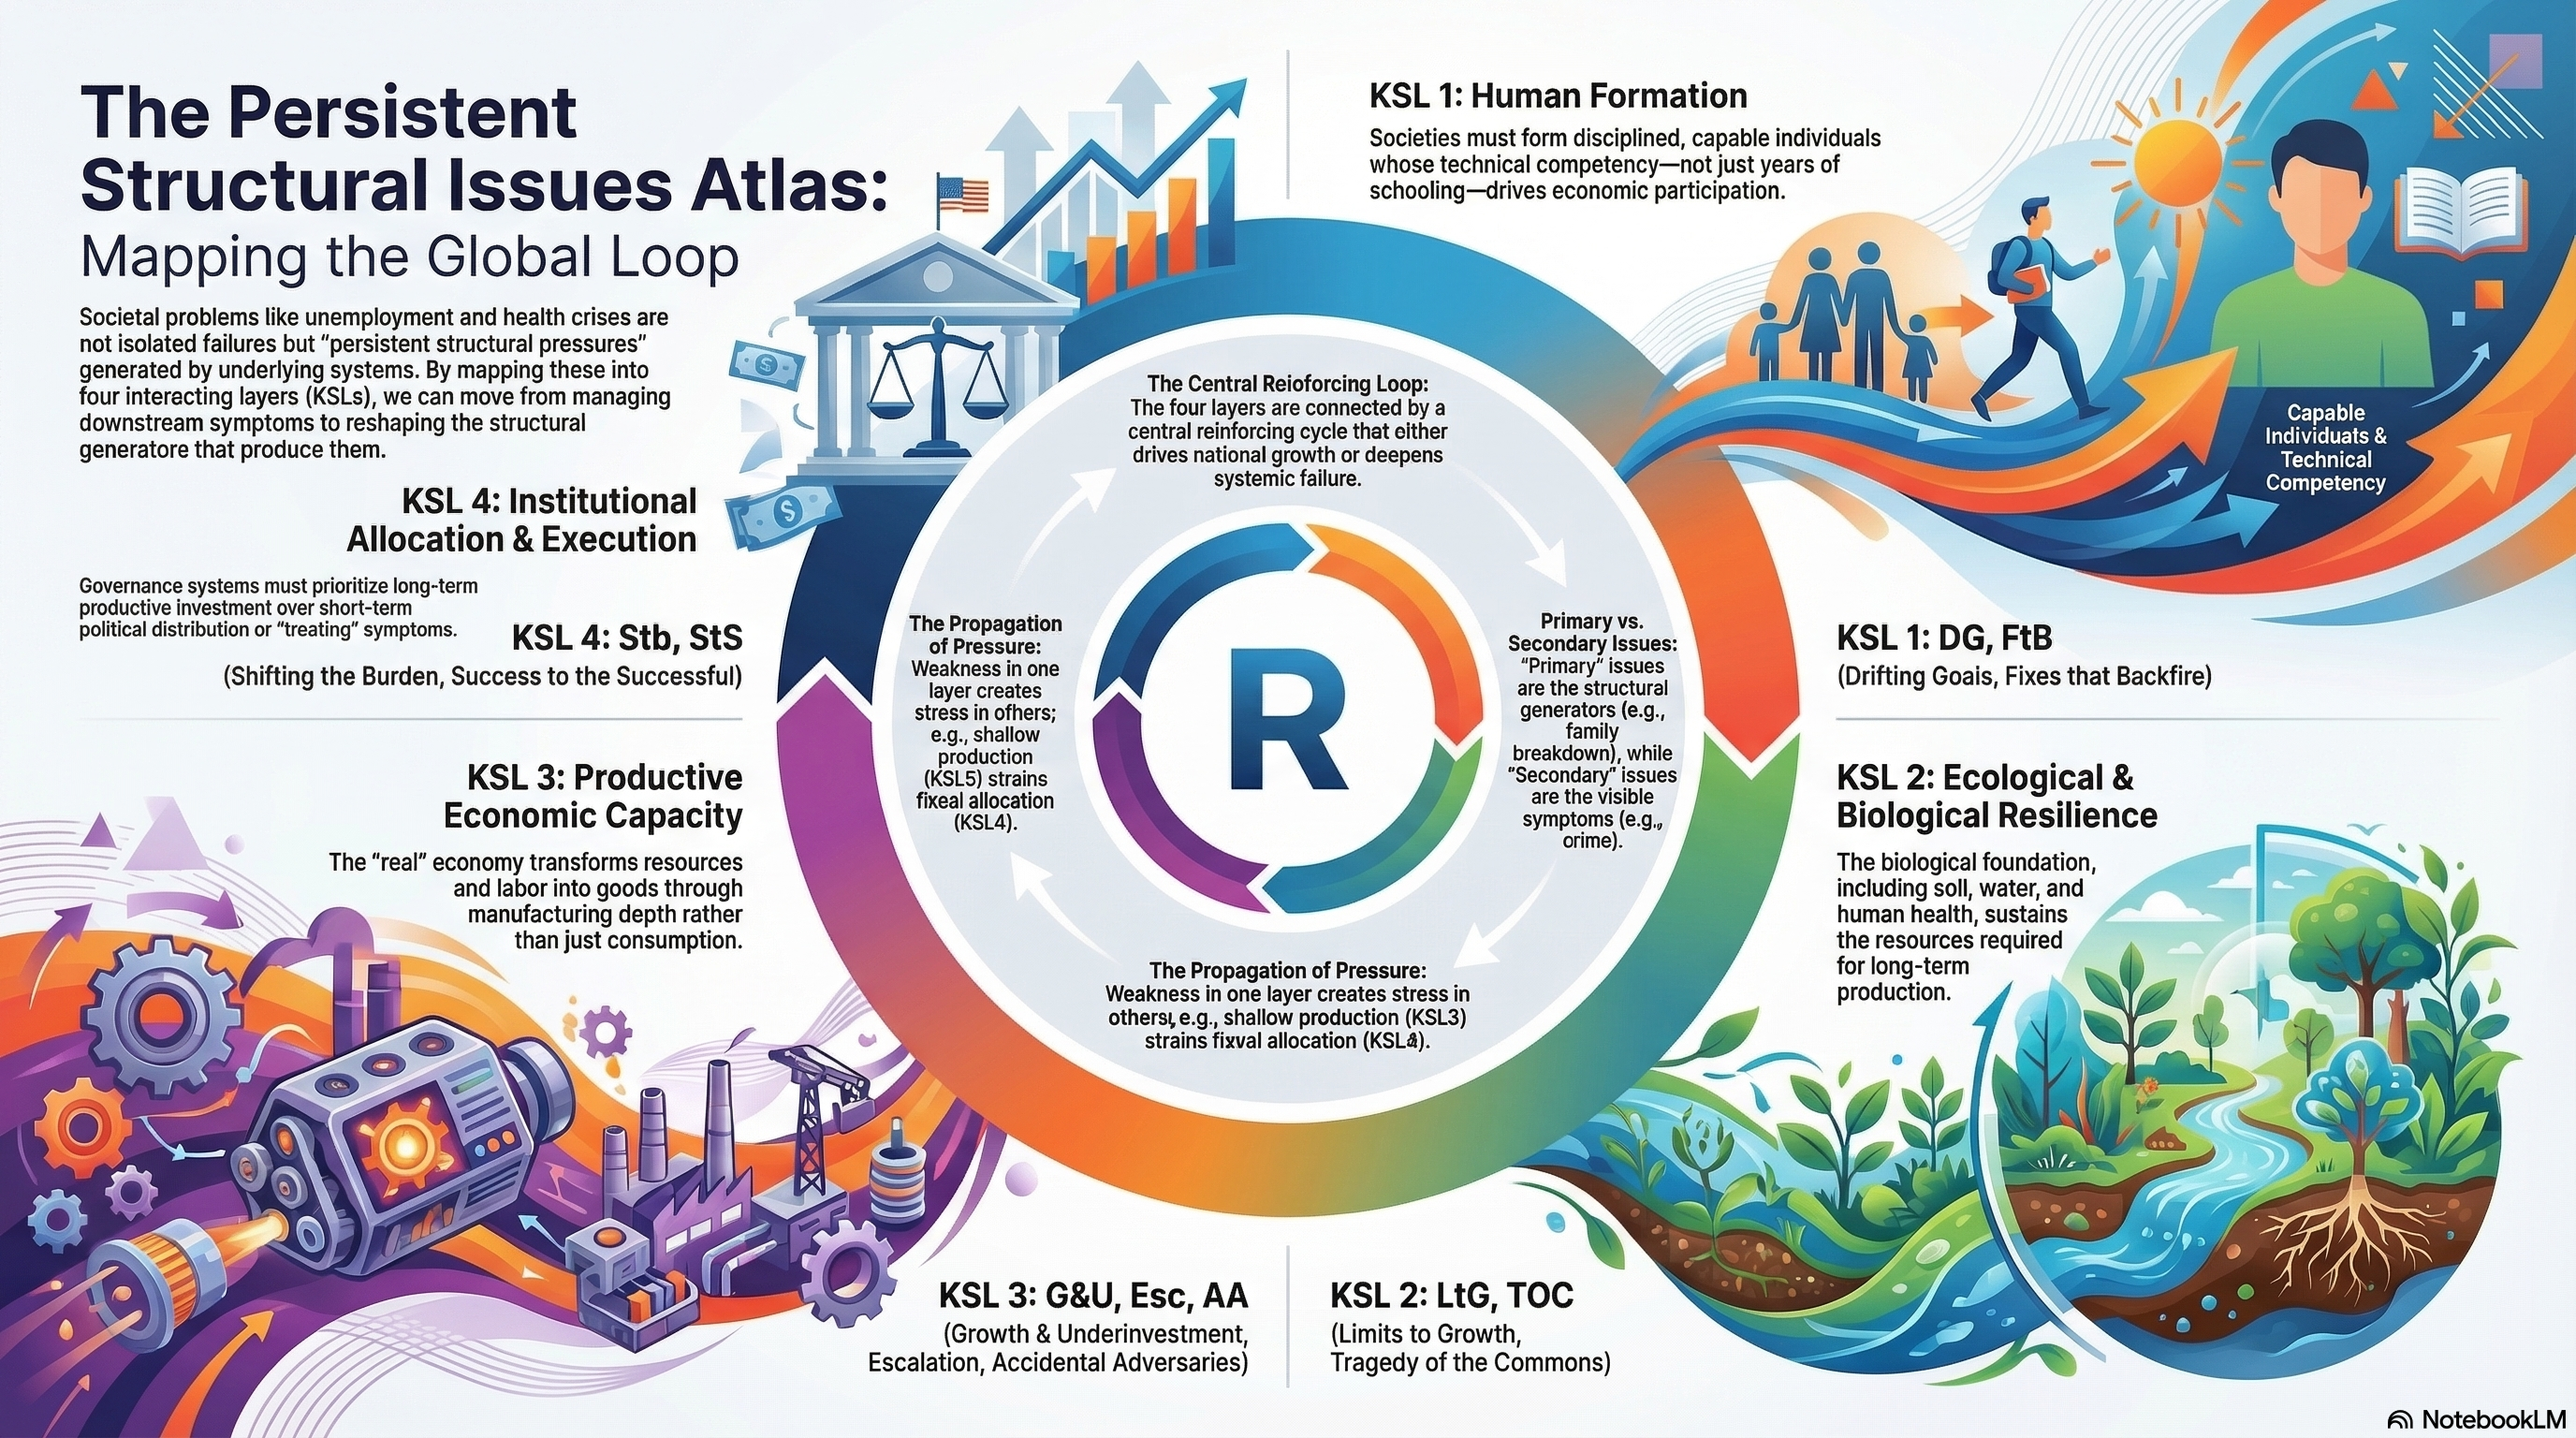
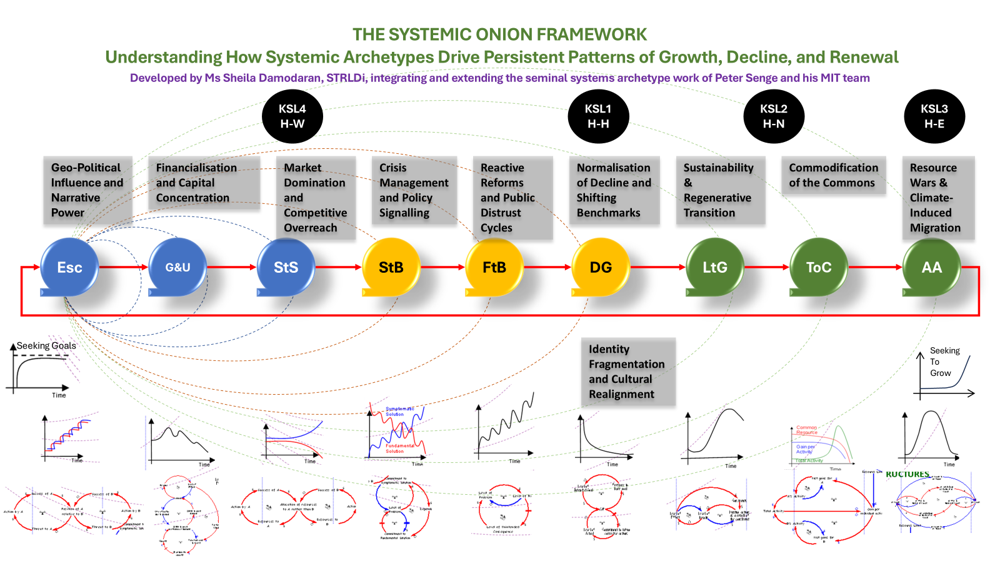

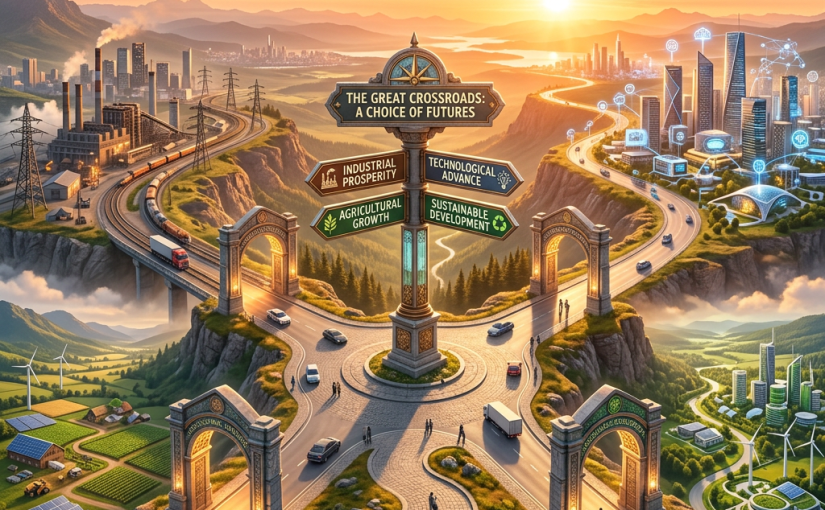


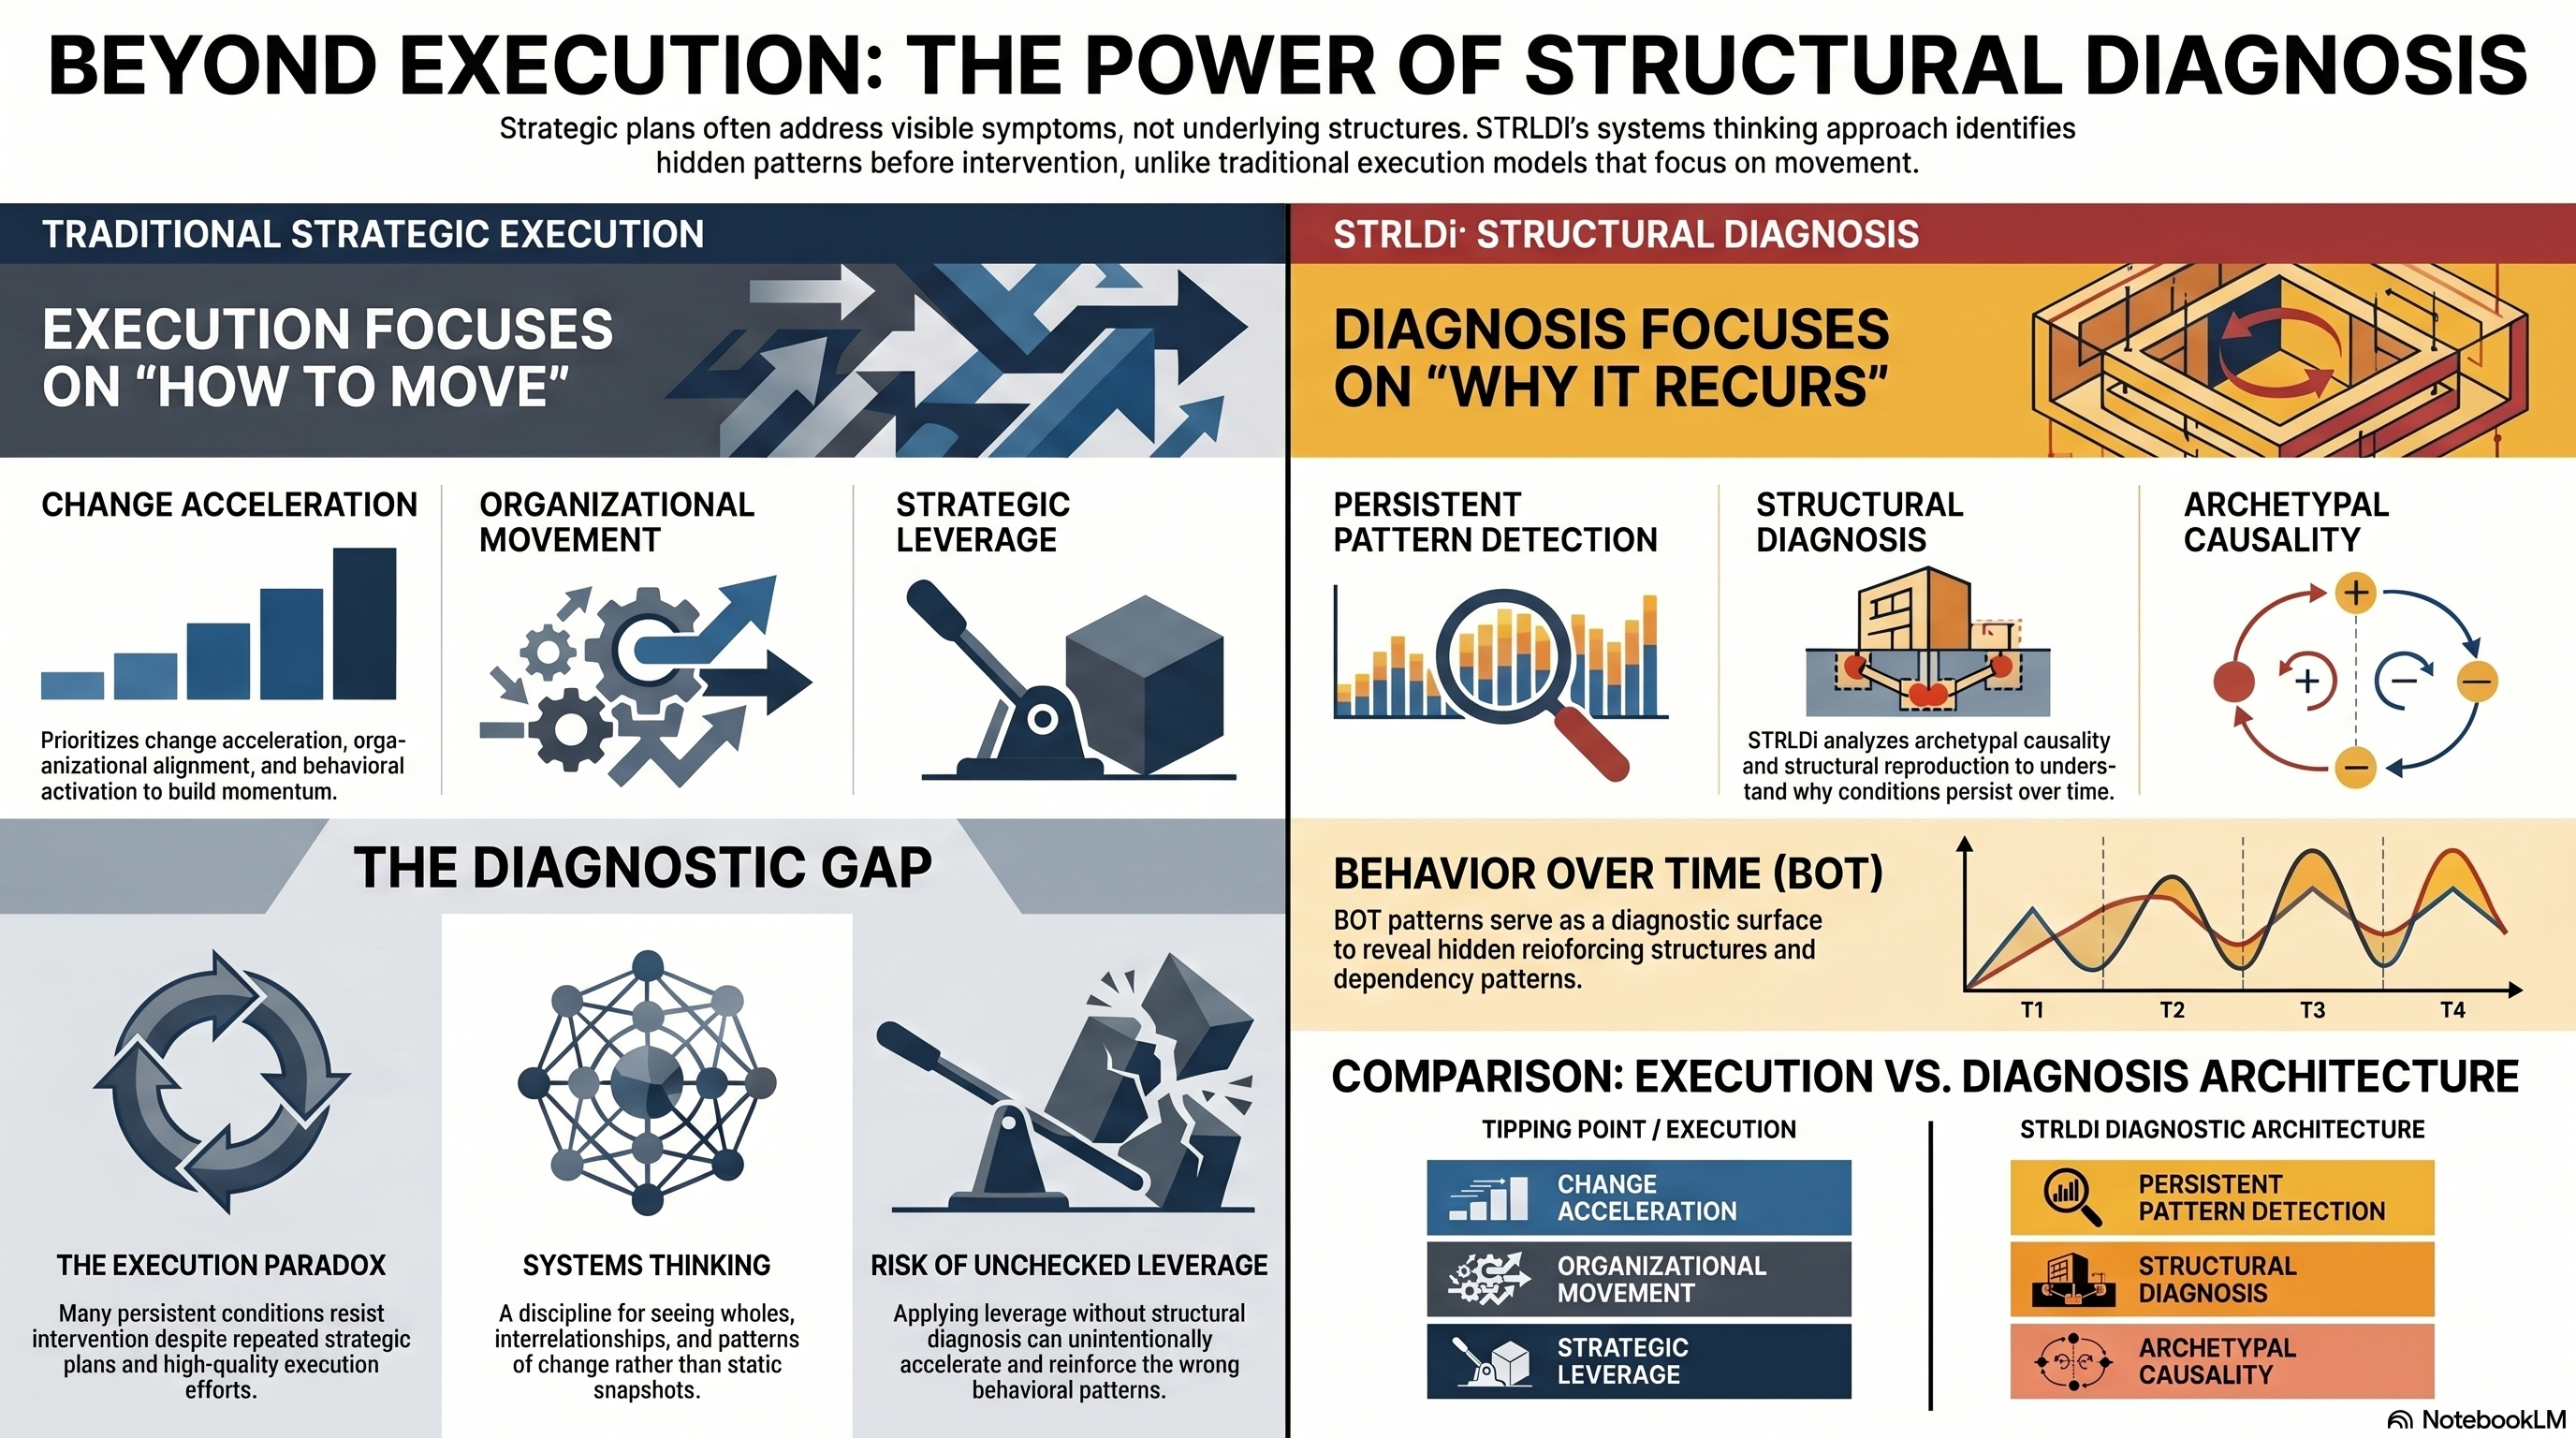


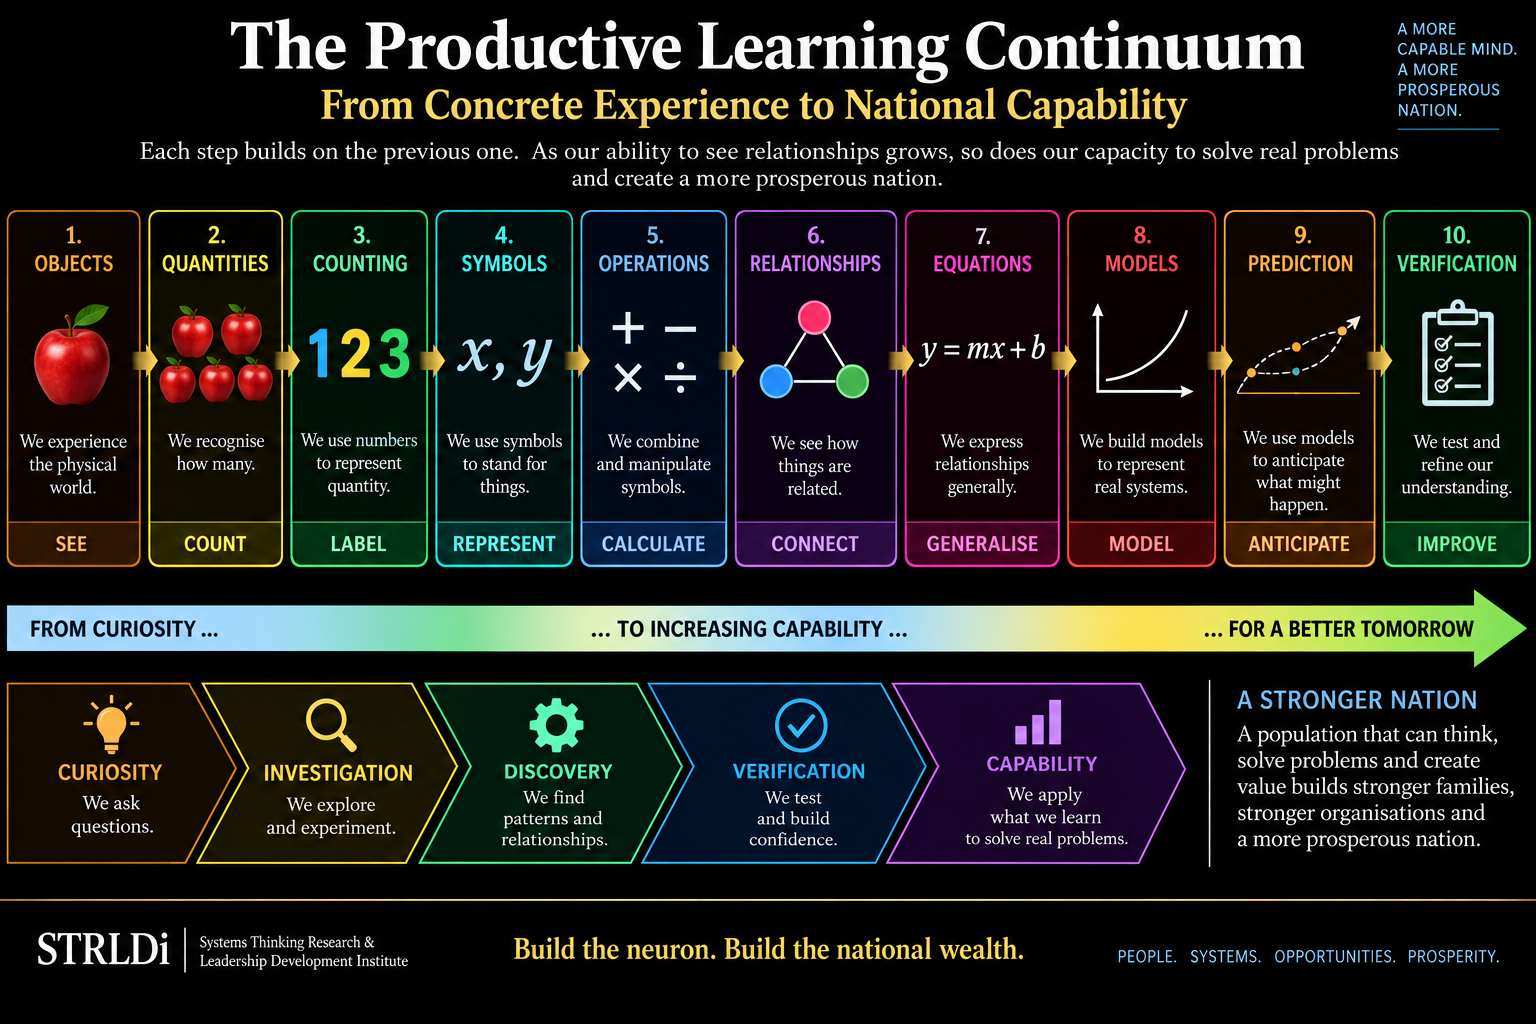
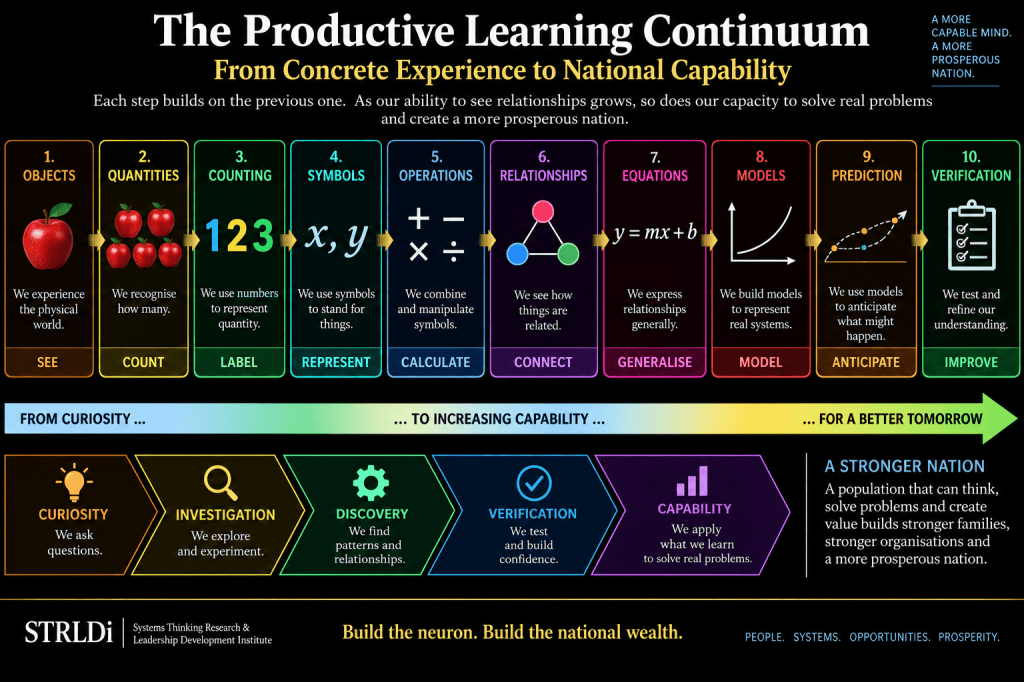
You must be logged in to post a comment.