
-24.654110
25.908739
Author: sheilasingapore
I am a Strategy Development Consultant working with sectoral, national and regional leaders develop the confidence and habits they need with The Fifth Discipline tools and practices to make a systemic impact on growing their nation and economies. My practice spans 25 years. For more information about the works, click here: https://sheilasingapore.wordpress.com/introduction/about/ and here: https://strldi.weebly.com/sheiladamodaran.html

Sectoral Article 21: If it keeps coming back, did we really think it was urgent?
Share this:

Regional Article 20: Why do disputes by labor (with unions) and employers go up?
- Despite our efforts to set up judiciary courts to preside over cases involving employers and employees embroiled in disputes with each other as well as educate ‘people’ on ways to avoid disputes with each other, why do relations between employers and employees continue to sour and such disputes tend to soar year after year? Surely, it should have made a dent to the trend by now. If not, why so? As this forces us to allocate even further public resources to it the following year!
- Think how much money we have poured (country after country) to ‘douse the flames and put out the smoke’ after thirty, forty, fifty years of working at our industrial relation efforts. Has that been little amount of money?
- So why do things not change?
- Will it get better? Or can it get worse?
Why do things happen that way? Why are such trends resisting our efforts to control it (for the sake of up-liftment of our economies, we would argue)?
Share this:

National Article 19: What causes fidelity?
We know what causes infidelity?
But what causes fidelity? Whatever that causes fidelity, when it is not there, causes infidelity!
So, what causes fidelity?
A couple goes through different stages or types of intimacy during their times together and experience one or more stages in their lifetime. To the extent the couple moves through the different stages would depend on the time and attention they place on their relationship. These include with no specific order or preference i.e. being:
- Sexually intimate with each other (be it where the couple experiences sexual intimacy either regularly, or on an ad-hoc basis)
- Physically intimate (where the couple moves to live in the same space together)
- Emotionally intimate (where the couple enjoys a relationship where each helps the other meet their needs emotionally; here the couple has learned to understand each others’ pasts as well as learnt to share and value unique moments together such as dinners, holidays, family events, and so on.)
- Mentally intimate (where the couple has learned to see the view of the partner not from one’s own perspective but that of the partner’s and in doing so learns to bring their minds together so that they may plan their lives together from the past, present and into the future and not meet their future as contingent (“let’s cross the bridge when we get there”. i.e, there is child born to them and so they need to meet its living and educational expenses, and so on)
- Spiritually intimate (where each regard the other as their soul-mate and enjoy a celestial or soul mate experience together)
Where do you think sexual fidelity begins to happen for the couple? Would it be at sexual intimacy or at physical intimacy or when the couple has learned to experience emotional intimacy?
What does sexual fidelity look like? It includes among other things, a willingness by each person in the relationship to regard his or her partner as:
- The only sexual partner for life;
- Where the relationship is not given (as in blood relations), but the couple has chosen to learn to want to be together;
- The relationship has grown beyond physical intimacy to include (or aspires to include) all or other forms of intimacy between the two and not limited to one or two out of the five;
- The couple is in the relationship because they ‘want to’ and not because they ‘had to’ (it is an obligation or transaction or choices made by parents or forced to) be in it;
- The couple regards each’s relationship with the other emotionally (as opposed to physically, materially, mentally) as equals and not assumes either as superior (head of the household) or inferior (submissive) to the other.
Did you say, the above (particularly sexual fidelity) happens when the couple learns to build emotional intimacy? Yes, you are right! We know couple who have reached the first two stages in the relationship and have even chosen to marry each other, yet, do not necessarily enjoy sexual fidelity with each other.
So how does emotional intimacy happen? Does it happen magically or it requires hard work on both sides? How would they need to work with each other so that they meet the other’s needs emotionally?
The following is something I have found useful as a I work with Dr Gray’s work. It helps appreciate the level of intimacy that may happen for a couple.
- What do you notice happening between the two (notice the threads in red)?
- Does it happen one way or would it need to happen two-ways?
- Are the needs of the two genders the same?
- So who starts first?
- Do these steps happen overnight or do they take time?
- Do they happen by accident or it helps that both sides of the couple first really appreciate what really ticks the other in (or off)?
- How would such learning happen? It is easier if one sees one’s parents do it? However, should that not be the case, what are the implications for society, the couple and the future? What could happen differently?
NEEDS OF THE TWO GENDERS AND THE ORDER THESE NEEDS GROW / REINFORCE OVER TIME TO CREATE SUSTAINABLE RELATIONSHIPS IN A COUPLE: BY DR JOHN GRAY, AUTHOR OF “MEN ARE FROM MARS, WOMEN ARE FROM VENUS”
|
Related articles
- Case Study 18: What would it take to ‘cure’ HIV? (sheilasingapore.wordpress.com)
- Best-selling Author of “Men Are from Mars, Women Are from Venus” – Dr. John Gray – to join Deepak Chopra at the “Journey into Healing” Workshop this September in San Diego (prweb.com)
Share this:

National Article 18: What would it take to ‘cure’ HIV?
Should we pay attention to:
- Curing the disease when it is already transmitted (attack the problem that we can see)? or
- Preventing the disease from being transmitted (defend ourselves from the problem?) or
- ‘Cure’ ‘the reason that causes the disease to be transmitted (what causes the problem)?
Let’s take this situation. Suppose there is a couple, both of whom are HIV positive and both are sexually fidel to each other. Given so, would the two increase the prevalence of the disease ‘out there’ in society? No, you say? You are right!
So when does the disease increase its prevalence?
It (only) happens when one or both partners choose the act of infidelity with each other. Should partners choose fidelity with each other, transmission of the disease is likely to plunge immediately across society. And plunge faster than any interventions by government or organizations will make it possible.
And it is (way) cheaper. There is the price we pay for not dealing with the causality. And the price tag is US$27 billion! and that is just by one country – USA. That is money that could have been somebody’s salary increase. However, I suppose when we do not figure these out, we probably do not deserve those salary increases! Otherwise, it can easily be there for our takings.
Now, this was interesting for the Department of HIV/AIDs because a big part of its efforts and budgets placed to curb the epidemic was to ‘prevent the disease being transmitted between mother to child’. However when they recognized that 80% or so transmissions are because of indiscretions by couples in their sexual behaviour (and the primary causality of the disease), they began to realize that whilst they worked hard to stop the disease being transmitted from mother to child and hospitals therefore saved the child from its mother but when the child grows up, and becomes an adult, it is possible that the child may not be able to save from itself should it engage in sexually indiscriminate practices itself! The money it had used to save the child, ‘literally was now become money that it had poured down the drain’!
But it is harder to ‘work on the fidelity between the couple’ in the bedroom. It is easier to manage the transmission at the hospital between the mother and the child. So we ignore it, choosing easier ways out such as resorting to dispensing condoms, or encouraging practices of circumcision among men or extolling the vices of maintaining sexual networks or encourage total abstinence. They work somewhat, but not realistically enough to make sure the country will meet its target of zero infection rates. Yet, we are not talking as yet for us to learn what it takes for couples to learn to want to be together and afterwards it learns to also exercise sexual fidelity between each other. Till we get there, can we expect to solve this problem? No. You can deal a blow, but not solve it.
So, what causes sexual fidelity? Or have you too given up that the idea is possible?
Notice most sexual indiscretions happen away from the glare of the ‘day’ and under the cover of the night and in spots that are deliberately designed to keep ‘the authorities out’ (see pages 3-5) and apparent ‘disorder in’? What are we hiding from? Who are we running from and then afterwards who are we running into? There lies the answer to our questions on fidelity!
So what would lead a couple to become fidel with each other?


Related articles
- Fact and Fiction About HIV Transmission (everydayhealth.com)
- Shocking HIV Rates Among Black Women – ABC News (abcnews.go.com)
- Impact of Male Circumcision on HIV Doubted (circumcisionwisdom.wordpress.com)
- How HIV Changed One Life Forever (everydayhealth.com)
- Sexual Intimacy With an HIV-Positive Person (everydayhealth.com)
- Early HIV Treatment With Antiretrovirals Unlikely to Impair Cognitive Development in Children, Study Finds (inquisitr.com)
- People Care More About The President Cheating Than Their Significant Other Cheating (thejanedough.com)
- The Allure Of The Coy Man (heartiste.wordpress.com)
- a little fatherly advice (briancoatney.com)
- Strategies for HIV/AIDS (jacobam.wordpress.com)
- Possible Key To Ridding HIV Infection From Immune System – Vaccination Strategy (medicalnewstoday.com)
- HIV vaccine on horizon as scientists develop jab that gives 70% protection to monkeys repeatedly exposed to virus (dailymail.co.uk)
- Dr. Martha Buchanan: Knowing HIV/AIDS facts combats dangerous misinformation (knoxnews.com)
- How HIV Spreads (everydayhealth.com)
- The Conscious Mom’s Guide Links Kids’ Behavior, Emotions and Health to The Stars; Innovative KidScopes Help Moms Understand, Assist Their Children (prweb.com)
- Secrets of Fascinating Womanhood.. (marcusstephen.wordpress.com)
- How to Save a Marriage – Free Book (solaceandjoy.wordpress.com)
- Oh my goodness Dr.Gray! (3bean.wordpress.com)
Share this:

Regional Article 17: Is unemployment real?
UNEMPLOYMENT = SUPPLY OF LABOUR > DEMAND FOR LABOUR
In a country, where levels of unemployment stay persistent over time, then it is a sign that the rates of growth of the supply of labour (population numbers -” child creation”) each year is growing at rates faster than the rate of growth of the demand for labor (job creation). And we as a nation are not noticing these two trends. Period.
When the supply consistently outstrips demand over time, we have persistent unemployment. It is an unhealthy situation (as we would have with when supply of manufactured goods exceeds their demand we would have a drop in prices, when supply of rainfall exceeds demand for water, we have rising water levels, when supply of migrant influx exceeds rate of city planning we have slums, and so on). Unemployment is a function of how these two variables are behaving relative to each other. Period.
And should the problem be led by the supply of labour, we need to be realistic to expect that the demand for labour (be they by job vacancies by the private (employment) or the government sectors (education, employment) will grow fast enough to overtake and get rid of the state unemployment in the country. Seeing scenes of citizens walking the streets looking for jobs is here to stay. Period. Again.
What influences the supply of labor?
The rate of supply of labour is influenced by the rate of the population’s growth (i.e. procreation). The only issue is the supply we see today of twenty and thirty-year olds in the labour market, was set into motion twenty or thirty years ago. By the population. The children born then have today become the youth and labour of today …. and therefore today’s unemployment.
In most cases, the populace do not see the relationship of the birth-rates of yesteryears (well pretty much like what happens between the sheets and the timing of births) and much less so their impacts on the labor supply for tomorrow. It is and is likely to stay “unrelated” in our minds for as long as these inter-relationships are not raised and discussed by all. Instead, our mind replaces that (“vacuüm in our) thought by fears of our survival or security for our future should “if “the one, two or three” dies or moves away tomorrow?” (this is the voice of the grandmother in the lesser developed countries). So, we multiply … mindlessly.
But there is a misconception and it is unfortunate!
Supply does not drive the demand for labour. This means, that ‘should there be excess labour’, it is not to say that the demand for labour should go up. It could go up for compassionate reasons but not on economic grounds. We forget that in reality, it is the demand for labour that drives its supply. Period.
What influences the demand for labour?
I sometimes joke, it is often easier to “create children” than it is to “create jobs”. But in both cases, the “jobs” are done by the “same person” – Adults. So well, how is it then that we do not see how we are attempting to solve a problem we have created by our own volition?
Also the mind that ‘looks for a job’ for oneself to feed my children, is not the mind that learns to ‘create jobs’ for others, including for our children.
So it is the fault of the ‘bosses’ for not creating jobs, or the ‘fault of the rest of us’ for not thinking about creating jobs for others (while we are busy trying to find one for ourselves)?
What influences our ability to create jobs?
It is dependent on the propensity by the same adults of the country to grow the economy, i.e. the private sector. It includes us defining the ability of the country (and sector / industries) to see :
- Capital, flow into the economy (and not the family only)
- Increase of the economy’s revenue and
- Reduction in the costs of running the economy
- Diversification of the economy (systemic growth)
As the margin between the two widens, so to does the country’s / industry’s capacity to see:
- Creation of further posts for existing employees to progress into
- With progression of existing employees in moving to higher level jobs, it leaves the posts vacant for younger entrants (youths) to more easily enter the labour market
- More likelihood of higher wages increase across the board for all
This is dependent on the systemic development (what diversification could look like) of the economy, e.g. the story of the dairy milk production.
So, is this just a case of “not enough jobs”? Yes? Given what? We would need to complete the sentence … for everyone!
- What should we be doing today to solve the problem of unemployment? Who is the ‘we’? The government? The private sector? The public sector? The citizens? The male or the man (the demand for labour?)? The female or the woman (the supply of labour?)?
- What, in your view, would citizens need to understand about these realities before they begin ‘discussions about unemployment’ in the country and to figure their own ways to turn the situation around?
- When should we be thinking about the solution to the problem? When we create the problem or when the problem leads us to another problem?
What are the roles of the wife, mother and the man in turning these situations around?
Which role as a woman does she have an impact on the growing the demand for labour?
Which role does she have an impact on growing the supply of labour? What is motivating her?
What roles are the men play in each of their relationships with these women? As the son or the man?
Which role of the man helps grow the demand for labour (job creation) in the economy?
As the son or the man?
But this reasoning almost also begs the question, what were we doing when ‘the spark’ sparked the problem?
Sleeping, you say?
Ahh ….. SURE!


Related articles
- World Population (worldometers, real time world statistics)
- Moral panic about overpopulation: the distracting campaign of Population Matters (radstats.wordpress.com)
- Un; Zero Population Growth = Healthier Planet (disclose.tv)
- Is Population Control Really Necessary for a Greener Planet? (talkingaboutgreen.com)
- Unemployment is a problem created by government (politicsontoast.com)
Share this:

National Article 16: So, who is the (real) criminal?
Stressed so I took my boss hostage (thesun.co.uk)
I found this part interesting:
Thompson then tied his victim to a chair and subjected him to a 20-minute ordeal that left Mr Grady suffering depression and post-traumatic stress. He remains off work five months later.
The court heard the worker (Thomson) told his boss: “This is the only way people will listen to me. I told them I was dangerous.“
It is painful to be the victim. So we go after the criminal.
Yet there is no criminal until there is an act of crime.
But, who or what is the cause of the act of crime?
Do our Penal Codes deal with the reasons for the act or the acts themselves?
But if we wish to bring crime down, would it suffice to focus on the acts?
Do you think ‘crime’ and ‘the quality of our listening to each other’ are inter-related?
So can crime necessarily be linked by race, nationality or tribal or is there something deeper veiled by those words that we are not watching (or listening to)? What is that?
Are the ways we listen to men (or boys), the same as it would be as listening to women (girls)?
By the way, does anyone have data on the overall budget we spend globally to fight crime?
Should we map the budget spent (including for the judicial systems and then incarcerations) against the crime rates over time (see below for a sample), what would the behaviour suggest to us?
Are we winning?
Do you think it is a battle we can win from the police stations? Then if not, where?


Related articles
- Some speculations about the great crime decline in Florida (sentencing.typepad.com)
- Oakland mayor changes approach and finds footing (sfgate.com)
- The Financial Crash of 2007 – 2008 – Its Global Socio Economic Impact (beyondrisk.wordpress.com)
- Stressed so I took my boss hostage (thesun.co.uk)
- Fired employee kill headmistress (cnn u.s.)
Share this:

National Article 15: Is one choosing to work because one needs to eat?
Or does one choose to work because one wants to carve a career (to advance the public or private good) for oneself and for others?
Share this:

National Article 14: What is the right answer?
Focussing on how one teaches or how one learns? Can one exclude the other? Which would lead the other within the school system?
When a student shows he has understood (by his grades) what the teacher has taught him, would that mean he is learning?
Would that mean should the teacher stop teaching (such as when the child leaves school), what would happen to its learning?
Should the student or the child lead the learning instead i.e. when the child seeks it out or is curious to learn (even before the teachers teaches), what would we call that? Do we have a name for that? Often we usually do not even go there, because we say we are straying away from the syllabus (the point, the agenda, the plan, the meeting). Sounds familiar?

It has fascinated me to watch, that should I google for the word “curiosity”, there are two (well three) images that would typically return from the search.
The first is it shows images of cats and their curiosity almost leading the foregone proverb, ‘Curiosity killed the cat’. I am not sure which one we see more of. The image or the proverb in our head.
The other often shows pictures of children looking cheekily up the skirt of a woman. I am not sure whether to frown or to smile with this one.
And the third shows rows of children standing in a straight line within buildings that houses institutions of learning, I mean education.
But I could not easily find any other image to illustrate that word. Try it out yourself. Do let us know what you see.
But images and suggestions aside, what would inspire a child to want to be curious to learn?
Because should the child be curious to learn (anything), is there anything that could stop the education decline?
I say inspires because this is different from feeling desperation, meaning should I not learn, the school and eventually the society would leave me behind. But I do not want to be left behind. So, I’ll do anything to be number one. Even if it means having to study under the lights of the street!
We sometimes carry such thoughts into the workplaces, often leading to corruption, underhanded work tactics becoming a way of life and these in turn create a general sense of lethargy and impasse among workmates (because no one wants to be left behind)! So the consequences of that desperation would often show up as a stalemate.
So what today is killing the willingness of the child to want to be curious to learn? Where did it start? The child or the home?
What would encourage it to turn it around for the child? Is it the child or the adult?
What if what we thought was right is wrong? Then again, learning is not about arriving at the destination (concluding something is right or wrong) but being willing to be part of a journey.
I have found these two resources inspiring in trying to understand the answers to this question.
- One is a quaint little book on Toto Chan. One of the few books in my adult years that I could not put down until I had finished it. It is touted as a must-read for all educators.Totto Chan: The Little Girl At The Window is a memoir by Tetsuko Kuroyanagi about her childhood, mostly about her days as a student at a unique school called Tomoe Gakuen. Tomoe is a school for ‘special children’, and Tomoe was taken there by her mother because she was expelled from her first school in the first grade itself, for being a distraction to the rest of the class. Her mother realizes that what Totto-chan needs is a school where more freedom of expression is permitted. So she takes Totto-chan to meet the headmaster of the new school, Mr. Kobayashi. From that moment a friendship is formed between master and pupil.Totto Chan, the name by which Tetsuko was fondly called, took to Tomoe instantly. Which child would not – when the classrooms are made of old railroad cars that are no longer in use? Tomoe is run by an exceptional headmaster, Mr. Kobayashi, who had extensively studied the imparting of ‘knowledge’ to children, rather than the imparting of ‘education’.The book goes on to describe the times that Totto-chan has, the friends she makes, the lessons she learns, and the vibrant atmosphere that she imbibes. All of these are presented to the reader through the eyes of a child. Thus the reader sees how the normal world is transformed into a beautiful, exciting place full of joy and enthusiasm. The reader also sees in their role as adults, how Mr. Kobayashi introduces new activities to interest the pupils. One sees in Mr. Kobayashi a man who understands children and strives to develop their qualities of mind, body and heart. His concern for the physically handicapped and his emphasis on the equality of all children are remarkable. In the school, the children lead happy lives, unaware of the things going on in the world. World War 2 has started, yet in this school, no signs of it are seen. But one day, the school is bombed, and was never rebuilt, even though the headmaster claimed that he looked forward to building an even better school the next time round. It was never done and this ends Totto-chan’s years as a pupil at Tomoe Gakuen.Tomoe was criticised by many for not being a conventional kind of school. Children were encouraged to study whatever subjects they liked first, they were taken to ‘field kitchens’ and ‘farming lessons’ to learn the practical aspects of cooking food and farming, first hand. The headmaster personally saw to it that the meals of all the kids was nutritious and balanced. The headmaster knew the children in and out, and the children were so comfortable with him that they fought with each other for a chance to get on to his lap and climb on his back! The headmaster personally saw to it that no child developed complexes, and no child felt any different from the rest. This and much more was special at Tomoe. If you are always one for practical education, you would like this book, which is all about ’free teaching” and ‘practical learning’?It was Tomoe that brought out the best in Totto Chan, as it did in a lot of other children. It was Tomoe that made Totto Chan what she bacame – an eminent TV personality in Japan. Tomoe was indeed a special school, and Mr. Kobayashi was indeed a gifted headmaster.
Sounds impossible? It might, but it was not. Such a school actually existed in Japan before it met a rather sad end. The famous TV personality of Japan, Tetsuko Kuroyanagi, actually studied in Tomoe. The epitome of kindnes, love for children – Mr. Kobayashi – was really the headmsater of Tomoe.

- The other must be this. It is a publication by Dr Sandra Seagal called Human Dynamics: A New Framework for Understanding people and Realizing the Potential on Our Organizations presents a new body of work that identifies fundamental distinctions in people’s functioning — including distinctions in how people communicate, learn, problem-solving, exercise leadership, function on teams, become stressed, maintain wellness, and develop, personal, interpersonal and trans-personal. The insights and tools that the book offers for enhancing the quality and efficiency of organizations are equally applicable in the context of family life. The book also indicates the significance of this new body for the fields of education, health care, and cross-cultural bridge-building. The short of it. She basically says that our personality distinctions (and our learning styles) are hard-wired at birth centred as either as physical, emotional or mental functioning. In total there are nine distinct types of which five are dominant across the world. Three in the western hemisphere an up to parts of Central Asia and two in the eastern hemisphere (and including Africa). These distinctions play out differently in the ways we learn from and / or teach to others.

Love to hear your reactions to these publications!
Related articles
- Are Schools Really Seats of Learning? (blogcritics.org)
- Curiosity Kills No Cats – A case for the importance of being curious (stratecutionstories.wordpress.com)
- “Curiosity is how we’ll get to wherever we’ll be tomorrow”: Skillshare’s new Manifesto video (thenextweb.com)
- Embracing Our Inner Child – Author Michael Gelb Encourages Individuals to Awaken Their Curiosity (TrendHunter.com) (trendhunter.com)
- Leadership & Curiosity (theneteconomy.wordpress.com)
- About Toto Chan: http://mahacopia.blogspot.com/2011/04/totto-chanpdf-e-book.html
- About Human Dynamics: http://www.lopn.net/Human_Dynamics.html
Share this:

National Article 13: Once it starts, it does not know how to stop!
Maybe somethings are best if we did not start them at all!
But the ball has been running since there were men (and women) – kind.
http://www.flickr.com/photos/the_missing_graph/4647545119/lightbox/
Hmm ….
Share this:

National Article 12: Maybe the name ‘football’ is misleading

Because one foot really cannot make a difference to the game till the team is willing to work as a team but more importantly works to defend for its nation. Yet we all relish that one foot that kicks “the dream goal” to reality! It is what glues us all to the set and the field, is it not? It is what inspires the “next Pele”. It is because of that special moment that football clubs around the world hope to attract millions of dollar to its doors: http://www.flickr.com/photos/the_missing_graph/4606501458/lightbox/
Heads of States are no exceptions either. They play into the notion too. They load promises of pomp and glory to the boys that bring the cup back home or scores the most hits into the opponent’s net. We even have special awards just for the best player. More often than not, it goes to the striker! For that magic foot – ball.
Yet football cannot be won by strikers alone. This is especially so when the defence is weak. And it is not difficult to see that the quality of the defence can bring the best striker and even the team down.

What makes a team strong in its defence? Is it the promise of rewards of winning? That’s for the striker! It is easy for a striker to connect a reward with a strike into the net. The more strikes that are in the more are the rewards. That’s easy to figure.
But what about the defence? The defence does not strike in. It defends or strikes a ball out! What moves one to fight for that? What do you think?
What stops the defence from leaving the defence wide open? Without a strategy? We can’t use rewards to motivate something we do not want.
So then what else will?
Related articles
- Striker reveals goal joy (setanta.com)
Share this:

National Article 11: A Case of Productivity! Really?
It is classic!
Perhaps we are working longer number of hours but we are also not the most productive.
How is that possible?
| Data extracted on 25 Feb 2012 16:34 UTC (GMT) from OECD.Stat |
| Data from 1979: | http://www.oecd.org/dataoecd/34/42/35205504.pdf | |||||||||||
| Frequency | Annual | |||||||||||
| Time | 2000 | 2001 | 2002 | 2003 | 2004 | 2005 | 2006 | 2007 | 2008 | 2009 | 2010 | |
  |
|
|
|
|
|
|
|
|
|
|
||
| Country | ||||||||||||
Australia |
1 780 | 1 739 | 1 732 | 1 737 | 1 732 | 1 727 | 1 719 | 1 712 | 1 717 | 1 690 | 1 686 | |
| Austria |
1 658 | 1 657 | 1 652 | 1 658 | 1 663 | 1 652 | 1 642 | 1 632 | 1 620 | 1 581 | 1 587 | |
| Belgium |
1 545 | 1 577 | 1 580 | 1 575 | 1 549 | 1 565 | 1 566 | 1 560 | 1 568 | 1 550 | 1 551 | |
| Canada |
1 775 | 1 768 | 1 747 | 1 736 | 1 754 | 1 739 | 1 738 | 1 738 | 1 728 | 1 700 | 1 702 | |
| Chile |
2 263 | 2 242 | 2 250 | 2 235 | 2 232 | 2 157 | 2 165 | 2 128 | 2 095 | 2 074 | 2 068 | |
| Czech Republic |
2 092 |
2 000 | 1 980 | 1 972 | 1 986 | 2 002 | 1 997 | 1 985 | 1 992 | 1 942 | 1 947 | |
| Denmark |
|
1 581 | 1 587 | 1 579 | 1 577 | 1 579 | 1 579 | 1 586 | 1 570 | 1 570 | 1 559 | .. |
| Estonia | 1 987 | 1 978 | 1 983 | 1 985 | 1 996 | 2 010 | 2 001 | 1 999 | 1 969 | 1 831 | 1 879 | |
| Finland |
1 751 |
1 733 | 1 726 | 1 719 | 1 723 | 1 716 | 1 709 | 1 706 | 1 704 | 1 673 | 1 697 | |
| France |
|
1 591 | 1 579 | 1 537 | 1 533 | 1 561 | 1 557 | 1 536 | 1 556 | 1 560 | 1 554 | .. |
| Germany |
1 473 | 1 458 | 1 445 | 1 439 | 1 442 | 1 434 | 1 430 | 1 430 | 1 426 | 1 390 | 1 419 | |
| Greece |
|
2 121 | 2 121 | 2 109 | 2 103 | 2 082 | 2 086 | 2 148 | 2 115 | 2 116 | 2 119 | 2 109 |
| Hungary |
|
2 057 | 2 011 | 2 019 | 1 990 | 1 993 | 1 993 | 1 989 | 1 985 | 1 986 | 1 968 | 1 961 |
| Iceland |
|
1 885 | 1 847 | 1 812 | 1 807 | 1 810 | 1 794 | 1 795 | 1 807 | 1 807 | 1 716 | 1 697 |
| Ireland |
1 719 | 1 713 | 1 698 | 1 671 | 1 668 | 1 654 | 1 645 | 1 634 | 1 601 | 1 549 | 1 664 | |
| Israel |
.. | .. | .. | .. | 1 905 | 1 989 | 1 887 | 1 921 | 1 898 | 1 889 | .. | |
| Italy |
1 861 | 1 843 | 1 831 | 1 826 | 1 826 | 1 819 | 1 815 | 1 816 | 1 803 | 1 772 | 1 778 | |
| Japan |
1 821 | 1 809 | 1 798 | 1 799 | 1 787 | 1 775 | 1 784 | 1 785 | 1 771 | 1 714 | 1 733 | |
| Korea |
2 512 | 2 499 | 2 464 | 2 424 | 2 392 | 2 351 | 2 346 | 2 306 | 2 246 | 2 232 | 2 193 | |
| Luxembourg |
1 662 | 1 646 | 1 635 | 1 630 | 1 586 | 1 570 | 1 580 | 1 515 | 1 555 | 1 601 | 1 616 | |
| Mexico |
1 888 | 1 864 | 1 888 | 1 857 | 1 849 | 1 909 | 1 883 | 1 871 | 1 893 | 1 857 | 1 866 | |
| Netherlands |
1 435 | 1 424 | 1 408 | 1 401 | 1 399 | 1 393 | 1 392 | 1 388 | 1 379 | 1 378 | 1 377 | |
| New Zealand |
1 828 | 1 817 | 1 817 | 1 813 | 1 828 | 1 811 | 1 788 | 1 766 | 1 750 | 1 738 | 1 758 | |
| Norway |
1 455 | 1 429 | 1 414 | 1 399 | 1 417 | 1 420 | 1 414 | 1 419 | 1 423 | 1 407 | 1 414 | |
| Poland |
1 988 | 1 974 | 1 979 | 1 984 | 1 983 | 1 994 | 1 985 | 1 976 | 1 969 | 1 948 | 1 939 | |
| Portugal |
1 765 | 1 769 | 1 767 | 1 742 | 1 763 | 1 752 | 1 757 | 1 727 | 1 745 | 1 719 | 1 714 | |
| Slovak Republic |
1 844 | 1 833 |
1 780 | 1 734 | 1 774 | 1 785 | 1 779 | 1 793 | 1 790 | 1 738 | 1 786 | |
| Spain |
|
1 731 | 1 727 | 1 721 | 1 706 | 1 690 | 1 668 | 1 656 | 1 636 | 1 647 | 1 653 | 1 663 |
| Sweden |
1 642 | 1 618 | 1 595 | 1 582 | 1 605 | 1 605 | 1 599 | 1 618 | 1 617 | 1 602 | 1 624 | |
| Switzerland |
1 688 | 1 650 | 1 630 | 1 643 | 1 673 | 1 667 | 1 652 | 1 643 | 1 640 | .. | .. | |
| Turkey |
1 937 | 1 942 | 1 943 | 1 943 | 1 918 | 1 936 | 1 944 | 1 911 | 1 900 | 1 881 | 1 877 | |
| United Kingdom |
1 700 | 1 705 | 1 684 | 1 674 | 1 674 | 1 673 |
1 668 | 1 670 | 1 665 | 1 643 | 1 647 | |
| West Germany |
1 451 | 1 439 | 1 428 | 1 422 | 1 426 | 1 419 | 1 416 | 1 420 | 1 417 | 1 379 | 1 409 | |
| United States |
1 836 | 1 814 | 1 810 | 1 800 | 1 802 | 1 799 | 1 800 | 1 798 | 1 792 | 1 768 | 1 778 | |
| Russian Federation |
1 982 | 1 980 | 1 982 | 1 994 | 1 994 | 1 990 | 1 999 | 2 000 | 1 997 | 1 973 | 1 976 | |
| OECD countries |
1 818 | 1 802 | 1 794 | 1 785 | 1 783 | 1 782 | 1 779 | 1 773 | 1 767 | 1 741 | 1 749 | |
But wait! Read between the lines. It tells us something more that is not obvious immediately!
Pascal Marianna, who is a labour markets statistician at the OECD says: “The Greek labour market is composed of a large number of people who are self-employed, meaning farmers and shop-keepers who are working long hours.” Self-employed workers tend to work more than those who have specified hours in an employment contract.
The second reason Mr Marianna points to is the different number of part-time workers in each country. “In Germany, the share of employees working part-time is quite high. This represents something like one in four,” he says. As these annual hours figures are for all workers, the large proportion who work part-time in Germany is bringing down the overall average.
In Greece, far fewer people work part-time. If you account for these factors by stripping away part-time and self-employed people and look only at full-time salaried workers, the Greeks are still working almost 10% more hours than the Germans.
What do you notice?
Question:
- Which of the two countries do you notice has people who are willing to work for and with others. Which one is not as willing to do so? Would that be Germany or would it be Greece?
- Which country do you think is more likely to go into debts. Those whose people could work with each other or those who prefer to work alone?
- So, is the story of debts in Greece a surprise or had it all along been ‘a bomb waiting to go off!’? But the world did not know better?
- Which countries in your view would see their revenues far exceeding their costs? Which ones would not?
- What is the price we are paying as a nation? As the world with the Greece bailouts!
26 February 2012 Last updated at 01:05 GMT Are Greeks the hardest workers in Europe?
By Charlotte McDonaldBBC News
Europe’s top 10 and bottom 10 |
||||
|---|---|---|---|---|
| Most hours worked | Most productive | Least hours worked | Least productive | |
| 1 | Greece | Luxembourg | Netherlands | Poland |
| 2 | Hungary | Norway | Germany | Hungary |
| 3 | Poland | Ireland | Norway | Turkey |
| 4 | Estonia | Belgium | France | Estonia |
| 5 | Turkey | Netherlands | Denmark | Czech Rep |
| 6 | Czech Rep | France | Ireland | Portugal |
| 7 | Italy | Germany | Belgium | Slovakia |
| 8 | Slovakia | Denmark | Austria | Greece |
| 9 | Portugal | Sweden | Luxembourg | Slovenia |
| 10 | Iceland | Austria | Sweden | Iceland |
| The UK ranks 14th both in terms of hours worked and in terms of productivity | ||||
| Source: OECD | ||||

Related articles
- VIDEO: Reaction from Greece as bailout agreed (bbc.co.uk)
- VIDEO: Will bailout deal in Greece add up? (bbc.co.uk)
- World Bank chief Robert Zoellick: Greece’s €130bn bailout merely buys it time (telegraph.co.uk)
- Customers shifting money out of banks in southern Europe (americablog.com)
- Greece lightning (propellresearch.wordpress.com)
- Europe Should Learn From Mexico Tequila Crisis, G-20 Host Says (businessweek.com)
Share this:

National Article 10: Do we have “systems” to measure performance because we have lost beliefs in ourselves and others and we cannot talk about the loss?
Without a belief in oneself and others can we really expect to see performance by oneself, the organization and the country (what about the region, the world) improve over time?
Should, let us say for the sake of argument, that we do not believe in ourselves and others, is there a price that we would end up paying? What is that?
Should we first :
- Setup a system to measure performance?
- Wonder what is eroding the beliefs in ourselves and others, what caused it and then work on recovering those beliefs?
Let’s assume we do share those beliefs with each other. Would it then become easier for us to set up performance management systems for ourselves and others? What would they look like then?
Which should come first?

What do you think?
Share this:

Regional Article 9: Systemic Development of Industries in a Nation. What would that look like?
Is there such a thing as systemic development of industries? We can tell what systematic is. Yes?
But what about systemic development of industries?
Let us take a context.
Let us say we wish to see the industry of dairy production grow within the country.
What needs to happen that would enable the sustained development of this industry. Now

notice two things:
The first, notice I did not say a dairy company but rather I referred to the industry. This means it has effects on the nation . That means more dairy companies are likely to succeed better as a result the industry is growing. When we take care of ‘the whole’, ‘the whole’ takes care of the parts.
The second, when we say it is successful, in this work, we would need to define it. We would expect to see the following happen:
- Levels of production rises consistently over time (it rises persistently and resists or buffers itself against significant downfalls) given populations are rising
- As such levels of revenue rises consistently over time
- Levels of costs per unit production declines consistently over time
Yes? Is that how you see it too? These are what I meant by the systemic development of dairy production in the county.
Growth of the Dairy Industry (for the Country)
Therefore, what needs to happen for all the above to happen for dairy production?
Well …..

Dairy or milk comes from cow. So, to see dairy production grow in the country, while anything else may or may not happen, we cannot expect it to grow without first also seeing the growth of the number of dairy cows produced within the country.
On the other hand, should we see a decline of the number of these cows (because we sell the cows so that we may pay school fees), then we can also expect to see a decline in the level of dairy milk produced in the country.
What do you notice by these discussions? Is this line of thinking the same as systematic thinking?
Did you say, no? Well, you are right!
So here’s the next question, what would make sure the systemic development of the dairy cow industry grows within the county?
Growth of the Dairy Cow Industry
You know the drill now!
What do cows (anywhere) need?
Fodder? Meaning, that the level of fodder produced needs to grow so that we are able to produce more dairy cows. Usually we do it the other way around! We say well, there is not enough (supply, given demand for) fodder. The market says that the demand is growing and then, it (the market) tries to scramble to ‘close the gap’.
When demand drives supply, that’s a sign of non-systemic development of the nation. But in a systemic relationship it is the supply that leads demand. Notice it does not drive it. It facilitates. It just makes it easier. It respects the order in which causality happen.

So, therefore before we expect to see the number of dairy cows grow in the country, we should first expect to see the number of companies that produce fodder grow within the country. This needs to happen before anything else does, almost to a fault.
When that industry grows (production levels rise at lower units costs), the amount of fodder available in the country also grows. Therefore, as a result, it will not become difficult for the cows to “eat and go forth and multiply“. And when it does, the dairy production levels in the country would naturally increase. This happens even without needing the government to take actions to intervene. This will also add up to lower costs in running the government.
What’s the next question?
Did you say, what would it take for the fodder industry to grow over time? You are right! Now we can see, you’ve got the drill.
Growth of the Fodder Industry
Where does fodder come from?
You are right. Crops! Fodder is often the by-product or the remnants of crops once humans have used it for their consumption.

So what are we saying here? For dairy production to grow within the county, we need to first see the growth of crops produced in the country, grow as an industry. When that does not happen, and should it instead decline, then the fodder industry declines, which in turn leads to dairy cow production declining which in turn reduces dairy production or makes it difficult to take off for the country.
So what causes crop production to grow in the country?
Which one of the following, in your view, when it is available makes it easier for crop production to grow? Which of the following would we need to see available?:
- Land
- Water
- Seeds
- Fertilizer or
- Is would it be the willingness of people to grow crops for cattle?
Growth of the Crop Industry
However should crop production be the primary domain of the female gender in the country, that is, she decides when, how much and what crops to grow, it is possible she may not be willing to grow crops for cattle. This is because her primary focus and need is to grow crops to put food on her table, for her children! Not for the world! And certainly not for the cattle.
So, therefore which gender do you think should become involved in crop production, so that dairy production would grow in the country?
Should it be led by the mind of man or the mind of a woman who should lead this effort? Does it differ or not at all?
The mind of the man is typically designed to ‘feed the world’. There are exceptions, but always look at the rule. The mind of the woman is there to help nurture (of feed) her child (not the child of another woman!) Do not fight that or we risk not having mothers for our children.
Who therefore do you think cannot absolve himself from crop production for the county?

When the man becomes involved in crop production, we would now be able to feed milk to our children (including the children of the women who did not wish to grow crops for the cattle). Also, men, unlike women, will inherently (even if it is just sheer strength in their muscles) to till, sow for multiple seasons and harvest larger expanses of land. This situation is there in the likes of China, Vietnam, India, Indonesia, South America for generations, where production of crops is the domain of the male gender. This has also has a positive impact on the water cycle . This means that as more amounts of the land is fertile for crops, such lands in turn encourages more frequent levels of rainfall for the country.
Is the amount of land, water, seeds, fertilizer available therefore consequential in the story. It really is not. It becomes consequential when I focus on my company. But not from a systemic development of industries and the nation.
So if I focused on changing things that are happening in my company, would that be enough to turn things around for the nation? The parts separately cannot take care of “the whole”.
Hmm …. what would we have to do differently today so that we as men, women and children can see these together as a nation?
Related articles
- 9,583 exotic dairy cows imported in 2010-11 (nation.com.pk)
- Daniel Kabuthia : Kenya (kiva.org)
- Vermont Dairies Scramble To Find Feed After Hurricane Irene (huffingtonpost.com)
- Juan De Dios : Nicaragua (kiva.org)
- The “Bio” Hazard (placedynamics.wordpress.com)
- Gone with the wind: study finds cows fed wine dregs emit less methane (smh.com.au)
- Turning cows into milking machines takes its toll on their health, and ours (thebovine.wordpress.com)
Share this:

National Article 8: Do we demand pay increments based on what we need to spend on or ….
… what we did to give in generating the revenue or increasing it and more importantly sustaining the increase (so we know we got it right!) so that it would allow the country (or organizations) to pay us increments?
What contributes to the revenue rising?
More sales (not increased prices – that is not real) and reduced costs, you say? Sure.
So, let’s go back again. When should we demand pay increments?
So should the revenue of the country decline, can we prove an increase in pay?
Yet why do such behaviours happen (or why do we let it happen) over and over again?
Share this:

National Article 7: Is Job Descriptions a cover-up for hiding otherwise our fears or our aspirations at the workplace?
And bound by a belief that our views of the world and our aspirations cannot be ‘brought out into the world for others to see’?
Job descriptions, yes they describe the job we do or that someone should do. But it is that ubiquitous clause at the end that always says, ‘To carry and obey all lawful orders of persons who have authority either over or within …. or sometimes put more simply: ‘And any other jobs as delineated by the supervisor’ that really nails the deal.
It defines who is the boss, I mean the real parent / master, and who is the child (might I say ‘slave’).
Yes, on a day-to-day basis it lays out clearly the tasks that the supervisee will carry out for the supervisor and serves as a document that makes it clear why payment should either be or not be made out depending on the services carried out as per the document.
There is no dispute to use of that document and its validity for doing so.
It is the effects they have in placing someone ‘in his place’ that we would need to watch out for in the long-term.
[More …. soon.]
Share this:

National Article 6: When things go wrong, should we “go after” the supply or the demand?
Remember, without demand there will be no supply. At the marketplace it is the demand (overt or otherwise) that drives supply!
Take anything:
- Peddling of fake sex drugs
- Peddling of counterfeit cigarettes
- Peddling by prostitutes
- Addiction to gambling
- Addiction to alcohol consumption
- Addiction to smoking
- Rise of HIV/AIDs epidemic
- Rise of inflation
- Price wars
- Availability of food
- Availability of water
Can you think of more?
Is going after supply ever going to solve the problem, or do we really do it to help boost the country’s government revenue (charge the one who charges!)? Or do we do it because it is just easier than going after demand?
When would we solve (once and for all) the problem?
Chasing the supply? Or the demand?
Share this:

National Article 5: Is life one big party … and then four days of study? When do we learn? Or did the dead cat just killed our curiosity?
“What would it take to see the levels of education in the country rise without having the need to set standards (and the government having to invest in) for it?”
Hmm …. have we thought of this question? As a country?

To appreciate the question, first we will need to find out what is causing the standards of education to go down persistently! Or did we choose not to ask (or think about) the question, because we thought it was a non-starter? Or we just did not go “there” to think?
That is to stand back and wonder that us and perhaps generations before us had worked hard to set up whole institutions (in the adult world) and invested resources just so to remind us and if not, to correct falling standards of education. To do so we would have put in place measurements to make sure standards stay up.
This is different from what we would otherwise like to see happen for our children (in the child world), i.e. to see our child reach out for rising levels of educational standards. Yes?
So we (the adult) work hard to teach, but they (the child) are not learning?
So, what causes standards of education to go down despite having had measures, standards, resources, infrastructure to prop it up for these years? Has anyone counted how much we have already spent? Within the country? As a globe? Since post WWII? That is 50-60 years. How many dropped out of school compared to those who have acquired PhD?
REALITY NO. 1:
How has levels of education compare with the investments placed into it. Did you say, it has gone down not as expected? How does the trend of resources compare? It has gone up? Hmm … that does not make sense, does it?
So what went wrong?
What would instead cause things to turn around to see levels of education go up?
But if we asked that question, then our attention would shift to the teachers (the adults). Yes? It is one adult world (parents) talking to another (the teachers).
Then if so, what is the question we should ask, so that our attention is on where it matters? The learners (or the minds of the learners (the child)).
So what is stopping or preventing the child from wanting to / being willing to learn?
Because once we have figured that out, there would be no stopping in the standards of education reached by the children. They would easily outstrip and standards we set for the teachers. Yes?
Except which is easier to manage? The motivations of the teacher or that of the student?
But taking the easy way out would usually leads us back into the problem.
REALITY NO. 2:
It would be great to transpose the following trends showing revenues and numbers gained at (indicative of where the adults’ attention may have been) over the years:
- Brewery and prescription drug industry (it would have been great to learn also the number of school going persons who consume (regardless that they buy) alcohol)
- Contributions to and attendance at religious groups
- Participation at sports and recreation
- Level of livestock births and consumption (+sales)
- Level of petroleum / gasoline / transport / construction industry growth
- Level of litigation cases filed at courts around the country (divorces, land issues, crime, property, business contracts, corruption, etc.)
- Level of population level changes (by districts) = Births (showers), deaths (funerals), marriages (weddings, engagements, showers)
- teacher number changes (we can see the student number changes are going down – that’s interesting! – where are they going?)
I suspect the trends in these areas will not be heading downwards (like the school grades). Instead it may even show a strong positive trends. What happens or consumes the adult in the adult world and takes him or her away from the child has an impact on the child learning world!
It is almost like saying, Reality No. 2 is growing at the price of Reality No. 1.
Students do however need adults (parents, older brothers and sisters) around them, to help them understand the subjects (of the adult world: Chemistry, Development Studies, Mathematics, Accounts, etc. ) they are learning (including the teachers but not limited to them) and not merely focus on grades. Teacher at times (especially in the developing world) defer her success exclusively to the commitment by student almost to a fault. Yet the child is learning from and about the adult world. A world she did not come from. One cannot say that the student should learn because the course objectives have been laid out for the child. Adults need to also take it as their responsibility to make success happen for their child with the child. Rather than say, if she does not pull up her sock, she will just end up like me. And then leave it.
And if parents are busy dealing with reality 2, it gets in the way of the child’s learning. Learning is systemic. But I am sure we would still hear our (parents) voices in the media and in parliament blaming everyone else for the downfall of our child’s grades.
This interrelationship points to an important element to bring a systemic awareness of what helps a child learn in totality. The child is not here to fend the family only. This is I suspect is perhaps the reason where most male students may end up in when they drop out of school early. In the developing world they would move into to herd livestock or in the developed world, they may succumb to addiction of substances (e.g. alcohol). These boys are now lost to the growth of the nation. We may also see more female students compared to male students graduate the school system, which means more teachers in the teaching system would eventually become women. This can have an effect to crowd out the male students even further.
Well, we can almost “throw in the towel” and say we can’t have everything. But “You can have your cake and eat it too, but not at once”. There is an order in which causality happens. Not all Ministry can vie to be #1 at the same time. The easy way out will then try to prevail. There is an order in which it needs to happen.
A thought going forward
It would be interesting to see if we bring together parents and community across the school grades:
- Take parents of students with Grade A* and have them have conversations side-by-side with typical teachers as well as parents of students with Grade C or D or E. For the latter, take parents who went through their experience a few years back – as their emotions would have flared down and they are better able to see what has been happening for their child.
- Keep these conversations running for several months, if not years. No media. Just understanding. Listening, asking questions and understanding. Keep repeating the exercise. That’s all you’d need to do.
- This is different from meetings at the Community Hall between the Ministry and the community leaving the Ministry or the parent to defend their side. This will otherwise encourage defensiveness on both sides, but no systemic learning by the parents, children and the Ministry. The only result? Just defensiveness and more pushing of the Ministry of Education, school heads, teachers and another round of Performance Management Systems. The former conversation is an opportunity for learning by the country. But keep it quiet. Do not push it. Otherwise, if not done carefully, it can agitate the system. Slower is faster so we can understand how our cures do not make the disease worse.
- Do not link this activity directly with these results. I am sure the Ministry will figure that out. That calls for creativity.
Not the fireman!
How much will this action cost us? I suspect it would cost us almost next to nothing to bring about a systemic change!
How much would it have otherwise cost us? As a nation? As a globe?
I could not, at any age, be content to take my place by the fireside and simply look on. Life was meant to be lived. Curiosity must be kept alive. One must never, for whatever reason, turn his back on life.
Eleanor Roosevelt
Share this:

Regional Article 4: Are hurricanes haphazard or is there a deliberateness in their behaviour?
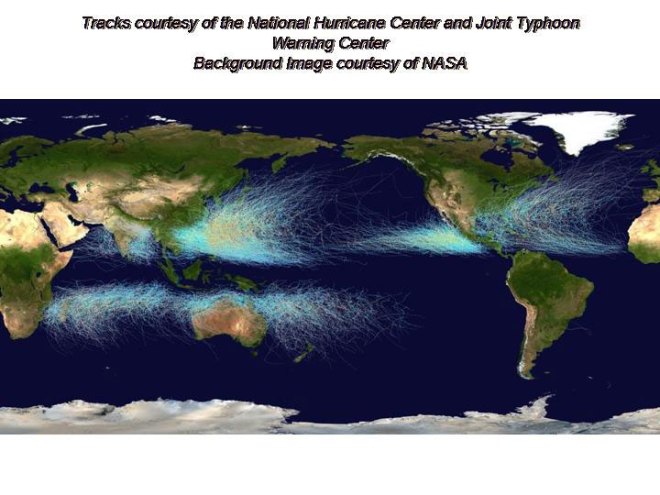
Looking at the picture above, what do you think?
It really is not as haphazard as we think, is it? There is an order.
Clue: Look towards the right where they start.
What do you notice about the land in the areas? Do they tend to be green or brown?
Share this:

National Article 3: Lands of ‘Princesses’ and ‘Prostitutes’!
Are the two worlds really that different or there is merely a thin line separating the two?
Are these two worlds defined by the women or by the men or by both or by persons beyond the couple?
I had a surreal experience yesterday.
I was on my way to an engagement party and I had my usual driver help me get to the venue which was an hour’s drive away. My driver, in his late 30’s or early 40’s, over time has grown accustomed to using the time he has me in his car to share his concerns that he finds in his life and as a sounding board for his thoughts. As the journey continued, the conversation turned to ‘what does a woman want from her man’? He asked, “is it a roof over their heads or a box of chocolates from him?” Well, I said, “while the box of chocolate may not be the same as a roof over their heads, but if she also receives a box of chocolate from him, it helps her see him as more than a provider for the family to also the lover in her life”, I said.
At soon as those words left my mouth, it felt like a cannon had suddenly been let loose within the car! He became rattled and began by saying “such days have long gone”. Well, I added, “you would not want her to see you as her father or brother, would we?” He continued to disagree. He then shares, that had I known better, I would know that “it is not unusual for the women in the country to “keep small houses by their side”. While she may have the ‘main meal’ with her husband, she continues to enjoy ‘side dishes’ with other men”. He adds that having come to know about that part of her life, it is making it difficult for him to relate towards her as her husband and as the only man in her life. He then repeated several times that it is not easy for a man to give flowers and chocolate to “a prostitute”. He for now is choosing to live a life separate from his wife, even choosing not to eat within the same house. Deep in my heart, I knew “he was crying inside” and I ended that part of the conversation with “this may have been a chance for her to learn to turn into a woman, a chance another man may not do it for her, except you”.
Half an hour later, we arrive at the home where my hosts were hosting an engagement party for their twenty-something year old daughter.
And then, almost in an instant, it looked like I had walked from one world into another world – a world ‘fit for a princess”. The place was teeming with men and women working side-by-side, putting together the venue for an evening of merriment and joy in celebration of exchanging and accepting the dowry between the groom and the bride’s family an event which was held earlier in the morning. I sat by the corner, watching and soaking in as much of the buzz of the evening and location. It was all new to me here. The women were washing plates and dishing food and drinks out to the guests who were arriving and laying tablecloths on the tables The men were preparing the firewood that was going to part of the braai stands that would grill enough meat for an anticipated guests of 500 to 600 persons. Perhaps even a 1000. Elders were playing out their traditional roles receiving the bridal parties on both sides and observing the protocols of the day. Meanwhile tiny tots scaled the length and breath of the venue adding colour and vibrancy to the occasion with their spanking new clothes and their chirping voices. Nothing over the top. Only sheer joy meandering all around in the togetherness.
Two hours later and when the venue, food and the guests were set, the bride walks in, in the arms of her fiance. He was beaming from ear to ear eager to show his bride off to the world. Both of them took the main stage and sat on their assigned seats (well, I actually want to mean ‘thrones’). She sat on her side, glancing from the corner of her eyes and chatting at her fiance from time to time, while taking in the whole place and the evening and how it has been laid out in front of her. She did not hold any airs about her but smiled sweetly knowing she was being treated like a princess from her groom to her father.
I sat at my chair within the audience enjoying how much the bride was enjoying the evening.
The next morning, that is today morning, something struck me.
How did I go from, in less than one hour and in a distance of less than 100 km apart, hearing the story of a ‘prostitute’ in the guise of a wife to seeing a princess about to become a wife?
Both assaulting my senses in the same evening.
How did the same land produce both princesses and ‘prostitutes’? Which one is more? Which side is growing? And which side is seeing declining numbers?
Why does this happen?
Share this:

Regional Article 2: What really caused the eurozone crisis? BBC News Dec 22, 2011
As you read the article. notice how many times we broke the laws of dynamic complexity. These laws govern the nature of dynamic (recurrent problems) complexity.
I see three laws here. They are laws 8, 6 and 4. I have listed the laws against the text of the article below and the explanations at the end of the texts.
There are more.
Show us what you see.
“What really caused the euro zone crisis? Dec 22. 2011 BBC News”
World leaders probably spent more time worrying about the euro zone crisis than anything else in 2011.
And that was in the year that featured the Arab Spring, the Japanese tsunami and the death of Osama Bin Laden. What’s more, 2012 looks set to be not much different. But as euro zone governments hammer out new rules to limit their borrowing, are they missing the point of the crisis?
Follow the path to find out.
Continue reading the main story
The euro zone has agreed a new “fiscal compact”
- Euro zone leaders have agreed to a tough set of rules – insisted on by Germany – that will limit their governments’ borrowing each year to just 3% of their economies’ output. This is to stop them accumulating too much debt, and make sure we avoid we another financial crisis.
But didn’t they already agree to this back in the ’90s?
- Hang on a minute. They agreed to exactly the same 3% borrowing limit back in 1997, when the euro was being set up. It was the German finance minister Theo Waigel who insisted on the “stability and growth pact”. What happened?
So who kept to the rules?
- Italy was the worst offender. It regularly broke the 3% annual borrowing limit. But actually Germany – along with Italy – was the first big country to break the 3% rule. After that, France followed. Of the big economies, only Spain kept its nose clear until the 2008 financial crisis; the Madrid government stayed within the 3% limit every year from the euro’s creation in 1999 until 2007. Not only that – of the four, Spain’s government also has the smallest debts to the size of its economy. Greece, by the way, is in a class of its own. It never stuck to the 3% target, but manipulated its borrowing statistics to look good, which allowed it to get into the euro in the first place. Its waywardness was uncovered two years ago.
- 3/9 Italy
Worst offender - 5/9 Germany
First to break rules - 6/9 France
Offender - 9/9 Spain
Top of the Class
But the markets have other ideas
- So surely Germany, France and Italy should be in trouble with all that reckless borrowing, while Spain should be reaping the rewards of its virtue? Well, no. Actually Germany is the “safe haven” – markets have been willing to lend to it at historically low interest rates since the crisis began. Spain on the other hand is seen by markets as almost as risky as Italy.
- So what gives?
So what really caused the crisis?
- There was a big build-up of debts in Spain and Italy before 2008, but it had nothing to do with governments. Instead it was the private sector – companies and mortgage borrowers [@1 LAW #8] – who were taking out loans [@2 LAW #4] . Interest rates had fallen to unprecedented lows in southern European countries when they joined the euro. And that encouraged a debt-fuelled boom.
- Good news for Germany…
- All that debt helped finance more and more imports by Spain, Italy and even France. Meanwhile, Germany became an export power-house after the euro zone was set up in 1999, selling far more to the rest of the world (including southern Europeans) than it was buying as imports. That meant Germany was earning a lot of surplus cash on its exports. And guess what – most of that cash ended up being lent to southern Europe.
- …bad news for southern Europe
- But debts are only part of the problem in Italy and Spain. During the boom years, wages rose and rose in the south (and in France). But German unions agreed to hold their wages (and their personal spending) steady. So Italian and Spanish workers now face a huge competitive price disadvantage. Indeed, this loss of competitiveness [@3 LAW #3] is the main reason southern Europeans have found it so much harder to export than Germany.
- …and a nasty dilemma
- So to recap, government borrowing – which has ballooned since the 2008 global financial crisis – had very little to do with creating the current euro zone crisis in the first place, especially in Spain (Greece’s government is the big exception here). So even if governments don’t break the borrowing rules this time, that won’t necessarily stop a similar crisis from happening all over again.
- Spain and Italy are now facing nasty recessions, because no-one wants to spend. Companies and mortgage borrowers are too busy repaying their debts to spend more. Exports are uncompetitive. And now governments – whose borrowing has exploded since the 2008 financial crisis savaged their economies – have agreed to drastically cut their spending back as well [@4 What Law is that?]. But…
Cut spending…
- …and you are pretty sure to deepen the recession. That probably means even more unemployment (already over 20% in Spain), which may push wages down to more competitive levels – though history suggests this is very hard to do. Even so, lower wages will just make people’s debts even harder to repay, meaning they are likely to cut their own spending even more, or stop repaying their debts. And lower wages may not even lead to a quick rise in exports, if all of your European export markets are in recession too. In any case, you can probably expect more strikes and protests, and more nervousness in financial markets about whether you really will stay in the euro.
Don’t cut spending…
- …and you risk a financial collapse. The amount you borrow each year has exploded since 2008 due to economic stagnation and high unemployment. But your economy looks to be chronically uncompetitive within the euro. So markets are liable to lose confidence in you – they may fear your economy is simply too weak to support your ballooning debt load. Meanwhile, other European governments may not have enough money to bail you out, and the European Central Bank says its mandate doesn’t allow it to. And if they won’t lend to you, why would anyone else?
http://www.bbc.co.uk/news/business-16301630
@1 When we state country, the one that comes to mind (obviously), it is the government (and therefore) the public servants are spending (the Ministers must be corrupt , etc.). But the areas of the highest leverage, the citizen, the family, the industries stayed hidden behind the ‘name of the country’. Law #8 says, the areas of the highest leverage are often the least obvious. We need to be understanding this about ourselves and use it to turn the situation around.
@2 Taking loans out, which is borrowing money and spending money we do not have, is easier than freezing wages (and choosing not to spend the money). Notice what we are avoiding. We usually do not watch what we are avoiding. We need to be watching both should we expect to turn a situation around.
@3 Loss of competitiveness shows how things have got worse after some time of seeing things become easier or better. This indicates that the two (when things got worse and the things that got better) are interconnected. As we appreciate the interrelatedness of these issues, we now begin to have a handle on the situation.
@4 What law is broken here? Why do you say that? Do explore the reasonings with each other.
Share this:

Regional Article 1: The Vegetation We Choose to Plant Can Cause Droughts. Are we our own worst enemies?
The Ministry of Agriculture is noticing the following situation (Case 1, Case 2, Case 3).
We pray for the rains to come. And they do, eventually. Often when we are at our most desperate. Sometimes they do not. It is possible someone out there is praying for rains not to come. There are inconveniences the weather brings with it. The floods, waters enter homes, the mud, the humidity, the sheer wetness, the leaking roofs, laundrys do not dry up, the house feels musty, lost businesses on the street, and so on. Of course, those who plant crops want to see rains.
What if it drizzled everyday? What would we say?
The nature of water cycles is such that the less we rains we receive over time, the less the rains that come back to us with time and space.
We learned in school about the water cycle. What we did not realize is, these cycles have a tendency to grow either positively or negatively with each iteration. They do not remain the same over time. This point was not made clear to us in our science and geography classrooms.
History and the reality today:
For the past forty years, the country finds it is not easy to meet its food production targets much less shake off its dependency on importing food from our neighbors. This is particularly so in areas where raw materials produced in the country (e.g. milk, vegetables, grains, potatoes) for the processing of foods (e.g. for tomato sauce, cheese, pesto) continues to face production shortages.
Current Strategy:
Each year, the government assists the population gear up to produce so that farmers may place food on their tables (food security which included having enough food for guests at funerals and weddings when the village descended on the events) as well as cash money from the sales of their produce in their pockets. Despite these efforts, we are not able to produce enough to meet the national consumption needs. Consumption (the hands that eat) has been and continues to exceed the level of the country’s ability to produce (the hands that produce). This story resonates for production of most raw materials across the country.
Seeing Complexity:
In my effort to understand the behaviour of agricultural production in the country, we examined historical annualized data that would allow us to see the behavior of production patterns of crops across the country. To do so, the Ministry, collected a twelve-year data of typical variety of crops produced within the country.
When the data came through, we noticed a rather unusual behavior over time of the graphs. This was something most people had not noticed previously.
There was a tendency for one type of crop to show a distinct increase in production levels over the years. The graph showed the crop resisted droughts better and was increasingly successful over time at doing so. Over time the peaks peaked higher.
This suggested that today compared to ten or thirty years ago, the levels of the crop produced had risen, sometimes by as much as six to ten folds high even if that included farmers finding alternative lands to produce the corps. This meant the crop had found new lands and hands even as old lands and hands had become barren; often at commercial levels and driven and supported by research efforts to use seeds that had even higher levels of resistance to droughts.
Conversely, we noticed another type of crop produced in the country showed a steady decline. It required more water for its survival. It was becoming less successful over time. The troughs in the pattern digged deeper troughs each time.
So which one in your view was rising and which one was declining?
The one that was rising was sorghum and the one that was declining was maize.
I was concurrently observing data on rainfall levels recorded for the past fifty years for the country. In general, rainfall levels declined steadily across many parts of the country, particularly in the western, central, northern and southern parts of the country. Where the pattern showed a distinct difference was in the extreme eastern parts of the country.
Do the results surprise you? We say in this work, statistics may lie. But trends do not know how to lie.
Which archetype do you think created the pattern that we saw above: http://www.lopn.net/System_Archetypes.html?
Understanding Complexity: What is causing it?
As these trends were unfolding, the Ministry was also resorting to choosing variants of maize that were hardier and more resistant to survive bouts of lower rainfall. This would mean, the seeds were able to grow into plants in the likes of sorghum, wheat, oats, barley and hybrid versions of maize without requiring a lot of water for its survival and at a shorter maturing period.
Are these patterns and outcomes a coincident? Is there a reason behind the behaviour of these graphs?
Think cactus. Cactus is the ultimate form of a drought-resistant plant. Yet, when we crack open a cactus what do you see? Water. Right? The nature of water is to flow rather than stagnate.
The more there are deserts, the more there are cacti. This is what strikes us when we first drive past a desert. Seeing cactus survive in a desert is a part of the story. They are sometimes held up as stories of our triumphs against odds. The reverse is also true. The more the cacti survive (just like when we as humans believe that we can beat the odds and overcome the challenges of desert living and that gives us a sense of achievement in) the deserts, the more the deserts are likely to also grow further.
Eventually the cacti (and us) may not survive the desert. At first the deserts would look like they are semi-arid. Over time, they become a true desert. And then ravines and canyons. How did that change happen?
So what could happen next should we continue to increase sorghum production?
What’s leading that thinking?
Think the word ‘food security’. Is the thought based on a sense of belief in oneself (as a farmer) and the land or is a thought or belief based on our fears of failure and survival of the self? Can a farmer who fears his hands may not grow enough food for all, be able to grow them in abundance? Or is he likely to produce just enough for himself?
What should the nation do?
Which nations in the world share a similar story to this? Where are they located? What percentage of the world do they make up across the globe? In what ways, do you think they may have an impact on the behavior of the weather over time? So are our efforts at agriculture production really thwarted by global warming or is it the making of our own actions in our own backyards?

Harsh Landscape

Lush landscape
Do these patterns occur by accident or could they be systemic? Given they have remained persistent for the past thirty years over wide spans of land, they assume a systemic nature!
Question:
- What do these patterns mean? What is causing such patterns to behave the way they do? The peaks to peak higher and the troughs to dig deeper?
- What are the implications should these patterns continue the way they do ten, twenty, thirty years into the future?
- What would need to happen to reverse the situation? The choice depends on you!
Course Work:
- If we could use the above to understand the story of poverty, what would we see?
- How would one draw that systemic archetype?
- What continues to happen or build for the long-term should the archetype not be healed and continued to persist?
- What would need to happen to reverse the situation?
More notes here: http://www.lopn.net/ST_Casestudy_Growing_A_Nation3_Loop2_EnvironmentSystem.html
Leave your reactions and comments here. Will be greatly appreciated.
Related articles
- Global water scarcity: Can we solve it? (energybulletin.net)
- Europe’s water resources under pressure (BBC News)
- Niger: Drought does not mean the end of pastoralism (All Africa)
- Monsanto tests drought-tolerant biotech corn (seattletimes.nwsource.com)
- Praying for rain in Paraguay (bbc.co.uk)
- Drought could lead to a surge in food price as farmers warn they are already being ¿seriously affected¿ (dailymail.co.uk)
- Cover Cropping (agriculturesavvy.wordpress.com)
- Mexican Drought Wreaking Havoc on Farmers (locavoredelmundo.wordpress.com)
Share this:

Hello World! The grass can be greener on your side.

One day my neighbor as he passed by my garden, noticed how the grass in my garden appeared greener than the ones in his garden. The next day he approaches his gardener and asks, “Tell me my man, why is the grass in Sheila’s garden greener than the one in mine?”
In all humility, the gardener turned and faced his boss, and said, “That’s because, Sir, Sheila feeds her grass with fertilizers (food) that then waters (water) them to allow them to turn greener (health)”.
The boss, my neighbour, realized at once what he had to do.
He turns to his gardener, “Come on my man, let’s go to the nursery. We need to get those fertilizers to feed the garden so that the grass on this side too will be green!”


You must be logged in to post a comment.