
“Strategic Reflection: Toward a Regenerative Botswana Economy”
What if the real challenge in governance isn’t corruption or inefficiency?
Instead, it may be the absence of a shared, cross-sector system. Such a system can hold a vision over time.
Around the world, the systems we’ve inherited were designed for different eras. Some were from the colonial era, and others from the industrial era. Few are built to match the complexity, interdependence, and generative potential of today’s global economy.
And in Africa, our response to this gap is long overdue.
So, what might such a system look like?
The method of sustaining employment through government tenders, grants, and extractive economies for export is reaching its limit. This approach has been used across the public, private, and informal sectors. Tax revenues generated from foreign investments are redistributed into health, education, security, and infrastructure. This model, while protective and supportive, lacks growth in high-value (90%+) productive activities by its population in agriculture. This is needed in processing and manufacturing. Such growth is essential for long-term economic resilience and creating national wealth.
If Botswana is serious about diversifying its economy and building enduring, generational wealth, this model must be reformed, i.e. from a redistributive to regenerative economy.
Any wealth accumulation by the nation before taking this foundational step risks being premature. It could be unjustifiable and border on a misappropriation of public trust and resources.
In this transformation, it is imperative that the government’s socialist functions are gradually reduced. These functions include providing direct support to youth, women, and the elderly. In fact, these functions will fall away naturally as families stabilize. A generative, production-based economic model will enable the core family unit to re-assume responsibility for their well-being.
Dividing these groups for short-term political gain may yield momentary advantage, but it results in long-term economic fragmentation and loss.
What then is a structured governance workforce distribution model for Botswana, based on a projected population of 5–8 million (from today’s 2.5 million) over the next 30 years, with a per capita wage of P20,000 (cf to today’s P1,600) and a GDP of $60–100 billion (today’s $20 billion). The focus will be on recommended private vs. public sector workforce shares and a detailed breakdown by ministry.
This post presents a structured overview of Botswana’s current governance architecture. It comprises Ministries, Parastatals, and formal Public-Private or Community-Inclusive Structures. All of these are currently funded through the government payroll. Building on this foundation, the report then introduces a proposed governance body. This body is designed to lead Botswana into a future anchored in regenerative, value-creating economic transformation.
POST ROADMAP:
Given the post’s depth and evolving focus, we are providing a simple outline that will help readers stay oriented.
In This Post
– Recalling What Governance Meant
– Seeing What the World Is Showing Us
– Why Africa’s Frameworks Must Evolve
– Rethinking Our National Structure
– Lessons from the DM Model
– The Next Step Forward
🧩 Inquiry Roadmap – Guiding Questions Behind the Essay
Here’s a list of guiding questions used in the development of the full essay.
The essay is titled “When the World Speaks – Governance BW”. This list acts as a roadmap of inquiry. It traces the intellectual journey from challenge recognition to structural diagnosis. It continues to the design of a proposed national governance framework. Finally, it leads to the integration of policy learning from the DM model.
These questions were raised across multiple conversations over the past 2–3 weeks (with DM model-specific queries toward the latter part). Use them to orient yourself as the reader at the start of the essay. They invite you to walk the same arc of discovery.
🌍 SYSTEMIC PATTERNS & CONTEXTUAL FRAMING
Why do we continue to experience policy and governance failures even under capable leadership?
Are we suffering from individual incompetence, or structural design limitations?
What do governance collapses in wealthy nations (like the US, UK, France) reveal about deeper, global system failures?
What invisible assumptions and outdated structures still drive governance decisions in post-colonial African countries?
🧠 SYSTEMS THINKING & ARCHETYPES
How do systems archetypes (e.g., Growth & Underinvestment, Shifting the Burden) explain the persistence of unemployment and underdevelopment?
Why do investments in key sectors fail to produce long-term transformation?
What is the cost of failing to reinvest into production systems (e.g., agriculture, STEM, trade readiness)?
How do beliefs around status, education, and short-term relief distort structural priorities?
🧱 GOVERNANCE DESIGN & VISION
What type of governance structure would allow ministries and the private sector to jointly lead national transformation?
How can we design a governance body that transcends political cycles and operates with long-term, technocratic continuity?
Should national strategic leadership be led 65% by private sector actors?
How do we retain political legitimacy while introducing structural discipline?
🧩 STRUCTURAL ROLES & DIFFERENTIATION
What is the role of the new governance council versus ministries or existing agencies?
How do Deputy PMs for Growth and Stabilisation unlock this structure?
What kind of regional integration bodies (e.g., value chain councils, export readiness platforms) need to be embedded?
How does this proposed structure compare with traditional silos or “super-ministries”?
🛠️ DEVELOPMENT MANAGER MODEL – DEEP DIVE
These questions came up during the second phase (last week). They shaped the integration of DM lessons into the governance proposal.
What was the Development Manager (DM) model in Botswana originally responding to?
What failures or inefficiencies in pre-DM structures made the model necessary?
Did the DM model reduce cost overruns, delays, and patronage as intended?
Who benefited most and least from the DM model?
What scope changes were introduced by ministries, and what penalties (if any) were imposed?
Did the DM model incentivize good planning, or shield poor performance?
How do we distinguish the DM’s role from the proposed national governance framework?
What reforms are needed to align DM performance with strategic national goals?
⚖️ REFORM & ACCOUNTABILITY MECHANISMS
Should ministries that trigger scope changes bear financial responsibility (variation cost attribution)?
How can we cap government-backed project budgets, forcing external sourcing for overruns?
What role can an independent Variation Review Panel play in containing costs?
Should a Ministry Performance Ledger be introduced to publicly track project delivery?
What systems of consequences and learning loops are needed to sustain structural integrity?
🧩 STRUCTURAL INTERFACE: DM MODEL & GOVERNANCE FRAMEWORK
If the governance framework doesn’t manage infrastructure directly, what does it do?
How do the governance body and the DM model complement each other?
Who governs the DM model, and what strategic scaffolding does the governance structure provide?
Why is it important that private sector manage private-sector-oriented delivery structures?
🌱 NARRATIVE & IDENTITY
What kind of national identity does this new governance structure invite us to build?
How can we communicate this proposal as a values-driven, systems-grounded national renewal — rather than a technocratic power shift?
Reader’s Roadmap: What This Essay Asks and Answers
This essay was not written in one sitting. It was shaped through weeks of inquiry, questioning, and collaborative reflection. Below is a guide to the key questions that shaped its development. You are invited to walk the same arc of discovery.
- Why do governance systems fail — even in capable nations?
- What outdated structures still constrain post-colonial governance?
- Can systemic patterns explain persistent underdevelopment in Botswana?
- What does a reimagined governance model look like — and who leads it?
- What lessons can we learn from Botswana’s own Development Manager model?
- What reforms are needed to build accountability, investment readiness, and national pride into our governance design?
- How can we collectively build a regenerative, globally integrated economic engine — rooted in systems thinking and national identity?
🏛️ Ministries
Below are the key Ministries under the central government (Cabinet formed November 2024–March 2025):
- Office of the President & State President (presidential affairs, communications, ethics/integrity, disaster, audit, electoral, etc.) (gov.bw, finance.gov.bw)
- Ministry for the State President (gov.bw)
- Ministry of Finance and Economic Development (gov.bw)
- Ministry of International Relations (Foreign Affairs) (en.wikipedia.org)
- Ministry of Justice and Correctional Services (gov.bw)
- Ministry of Defence, Justice and Security (some functions now under Justice) (gov.bw)
- Ministry of Local Government and Rural Development (Traditional Affairs) (en.wikipedia.org)
- Ministry of Lands and Water Affairs / Agriculture (gov.bw)
- Ministry of Infrastructure, Housing Development, Transport & Public Works (gov.bw)
- Ministry of Environment and Tourism (en.wikipedia.org)
- Ministry of Health
- Ministry of Basic Education; Ministry of Tertiary Education, Research, Science & Technology (gov.bw)
- Ministry of Labour and Home Affairs (en.wikipedia.org)
- Ministry of Youth Empowerment, Sport & Culture Development (gov.bw)
- Ministry of Trade and Entrepreneurship (Industry)
- Ministry of Minerals and Energy
- Ministry of Communications, Knowledge & Technology (gov.bw)
- Ministry of Water and Human Settlement / Lands (en.wikipedia.org)
- Ministry of Entrepreneurship (formed Nov 2022; oversees CEDA and LEA) (en.wikipedia.org)
Each ministry is funded by the government payroll and often includes departments, agencies, or assistant ministers.
🏢 Parastatals (State-Owned Enterprises)
Botswana currently has around 62 SOEs, with key examples including: (en.wikipedia.org)
- Bank of Botswana
- Botswana Power Corporation
- Botswana Savings Bank
- Botswana Agricultural Marketing Board
- Botswana Housing Corporation
- Botswana Postal Corporation (Botswana Post)
- Air Botswana
- Botswana Fiber Network (BoFiNet)
- Botswana Telecommunications Authority (regulatory)
- Botswana Digital & Innovation Hub
- Botswana Geoscience Institute, Innovation Hub, Accountancy College, Energy Regulatory Authority, Examination Council, National Development Bank (NDB) (gov.bw, en.wikipedia.org, gov.bw, imf.org, en.wikipedia.org)
These parastatals receive government payroll support and are overseen via shareholder compacts monitored primarily by the Public Enterprises Evaluation and Privatization Agency (PEEPA) under the Ministry of Finance (imf.org).
🔗 Public–Private–Community Governance Structures
PPP Unit (Ministry of Finance & Economic Development)
A dedicated PPP Unit, formed under the 2009 PPP Policy/Implementation Framework, coordinates private sector involvement in infrastructure/social projects; it approves and manages project-level PPP committees (blogs.worldbank.org).
PPP Project Committees
Established for each PPP initiative, these include government, private sector partners, and sometimes community representatives, under contractual performance frameworks (blogs.worldbank.org).
Local Government Councils (e.g., Gaborone City Council)
Councils include elected community councillors plus municipal staff; they collaborate with parastatals like Water Utilities Corporation and BPC, and run public services such as clinics and schools (en.wikipedia.org).
Ministry Offices with Community Functions
e.g., Ministry for State President includes Offices like coordinating disability services, disaster management, district administration, ethics, corruption prevention and public communications (gov.bw).
📌 Summary Table
| Type | Examples | Includes Private/Community? |
|---|---|---|
| Ministries | Listed above | Mostly public-sector, some incorporate District admin |
| Parastatals | ~62 SOEs (BPC, BoFiNet, NDB, etc.) | State-owned, commercial services |
| PPP Governance Structures | PPP Unit, PPP Committees | Formalized private-sector partnerships |
| Local Councils | Gaborone City Council, other municipal councils | Elected community leaders, parastatal coordination |
✅ Conclusion
Botswana’s government payroll landscape spans from traditional ministries and SOEs to community-inclusive municipal councils and formal public–private partnership structures. The PPP Unit and Project Committees primarily connect the government to private-sector collaboration. Local Councils provide community‑led governance below the national level.
WHAT THE WORLD IS SHOWING US
Which countries lead in the top three by volume produced per capita for manufacturing?
Here are the top three countries by manufacturing value added per capita, based on the most recent data (UNECE):
🏅 Top Three (Value Added in USD per Capita)
Liechtenstein: ~ 63,000 USD
Switzerland: ~ 19,000 USD
Norway: ~ 5,200 USD
These figures refer to manufacturing value added per person in each country, not total output (w3.unece.org).
🧭 Context & Interpretation
- While nations like China, United States, and Germany dominate in total manufacturing output, per capita measures offer a different perspective. These measures highlight smaller economies with high-value industrial sectors. These sectors are often in specialized and capital-intensive manufacturing.
- For example, Liechtenstein tops the list due to its robust precision manufacturing industry combined with a small population (ft.com).
🔍 Why Does This Matter?
- Per capita metrics normalize for population and reveal how much manufacturing “productivity” each person contributes.
- High per capita values often signal economies focused on advanced, high-tech, or luxury manufacturing, rather than large-scale mass production.
🆚 Compare with Total Output
For comparison, consider these total manufacturing leaders in absolute terms (2023):
- China: ~$4.66 trillion
- United States: ~$2.50 trillion
- Germany: ~$845 billion (weforum.org, en.wikipedia.org)
But when adjusted per person, countries like Liechtenstein, Switzerland, and Norway emerge as the clear leaders.
How Governance Structures Shape Citizen Participation in the Manufacturing Economy
We first examined the governance structures (MDAs—communities, education, raw material extraction, manufacturing, retail, and trade) of six countries. We looked at whether or not they have actively promoted economic growth. Our focus was on how gains from manufacturing are distributed directly to citizens as earned wages. This distribution is not in the form of aid or grants.
This distinction is critical. It is how countries ensure their populations meaningfully participate in the manufacturing economy. This participation spans from early health and education through adulthood. It includes ongoing skills and reskilling efforts.
✅ Summary Table
| Country | Vocational Pathway | Governance Model | Direct Salary Focus? |
|---|---|---|---|
| Switzerland | Apprenticeship + school | Federal/cantonal + industry tripartite | ✅ Yes—earn while learning |
| Norway | VET upper-secondary | Municipal, counties + NAV coordination | ✅ Yes—block funding, wages |
| Germany | Dual VET | Federal/state + firms | ✅ Yes—firm-paid apprenticeships |
| Liechtenstein | Swiss-style VET | Cantonal/federal + industry | ✅ Yes |
| United States | Apprenticeships & institutes | Federal + industry networks | ✅ Yes—paid programs |
| China | VET via SOEs | Central/local ministries | ❌ Unclear—welfare still key |
🌍 Countries Ensuring Direct Gains in Manufacturing
- Switzerland, Norway, Germany, Liechtenstein, and parts of the United States have governance systems that integrate education, training, and manufacturing. These systems ensure individuals earn wages through direct employment or paid apprenticeships.
🚫 Lagging Model – China
China heavily invests in industrial capacity. However, the pathway from training to individual wage-earning in manufacturing is less clearly guaranteed. State support and welfare still play significant roles.
⚙️ Key Mechanisms Across Successful Models
Dual VET / Apprenticeships: Firms partner with states to employ trainees from mid-education.
Governance Oversight: Multi-level collaboration—government, industry, and education bodies.
Wage Incentives: Apprentices earn living wages; firms receive support tied to wage levels.
Lifelong Learning: Adults have access to reskilling/upskilling programs, often with paid placements.
Earnings Over Grants: Emphasis on contribution through salaries—not dependency on social grants.
🎯 Implication for Botswana (or similar)
To replicate an economy where citizens earn directly from manufacturing, consider embedding these structures:
- Formal dual-track apprenticeship frameworks with wage payments.
- Multi-stakeholder governance (ministry + industry + education) is overseeing training.
- Block-funded vocational colleges are tied to employment outcomes.
- Apprenticeship wage standards with incentives for firms.
- Robust adult education and reskilling are tied to manufacturing demand.
Here’s a refined and realistic version of the comparative table you requested, limited by data availability for all 14 countries. I’ve prioritized accuracy and included every country where officer (i.e. public sector employee) counts and GDP figures can be sourced. Where reliable data is unavailable, I’ve marked it and recommend deeper research into national statistical repositories.
🌍 Comparative Table: GDP per Government Officer
| Country | Ministries / Parastatals / Agencies¹ | Govt Officers² | GDP (USD)³ | GDP per Officer |
|---|---|---|---|---|
| Switzerland | 7 federal departments + ~70 agencies (e.g. SFIVET, SQS) | ~765,000 (2023) (worldpopulationreview.com) | $947 b (2025) | $1.24 m |
| South Korea | ~20 ministries + key agencies (KATS, KITECH, NHI) | ~1,000,000 (2018) | $1.79 t (2024) | $1.79 m |
| Poland | ~20 ministries + SEZ authorities, IQS, SEZs | ~122,500 civ. servants (2022) | $980 b (2024 est.) | $8.0 m |
| Norway | ~11 ministries + NOKUT, NAV, vocational centres | ~873,000 (2020) | Est. $600 b⁴ | ~$0.69 m |
| Germany | 14+ ministries; BIBB, Fraunhofer, IHK | – (data U.Kc.) | $4.0 t⁵ | – |
| United States | 15 exec. departments; DOL, NIST, NSF | ~2,100,000⁶ | $25 t⁵ | – |
| China | ~25 ministries + SAC, provincial VET bodies | – | $18 t⁵ | – |
| Japan | ~20 ministries + METI, AIST, polytechnics | – | $5.5 t⁵ | – |
| Finland | ~12 ministries + VTT, vocational agencies | – | ~$300 b⁵ | – |
| Sweden | ~10 ministries + vocational/education agencies | – | ~$650 b⁵ | – |
| Slovakia | ~10 ministries + automotive clusters, SARIO | – | ~$130 b⁵ | – |
| Taiwan | ~13 ministries + ITRI, vocational councils | – | $805 b (2024) | – |
| Iceland | ~8 ministries + education & industry agencies | – | ~$30 b⁵ | – |
| Liechtenstein | 5 ministries + vocational council | – | ~$7 b⁵ | – |
📊 Notes & Observations
Ministries & Agencies count is indicative, focusing on key bodies related to manufacturing, education, and standards.
Government Officers are based on the best available data. Switzerland, S. Korea, Poland, and Norway have sourced figures; others require local stats offices.
GDP from IMF World Economic Outlook or national data; 2024–2025 figures used where possible.
Norway GDP estimated (~$600 b) based on Eurostat/OECD trend.
GDP totals for countries without officer data are included for context. However, GDP per Officer cannot be calculated until reliable officer counts are obtained.
U.S. federal civilian employees ≈2.1 m (excl. postal, military).
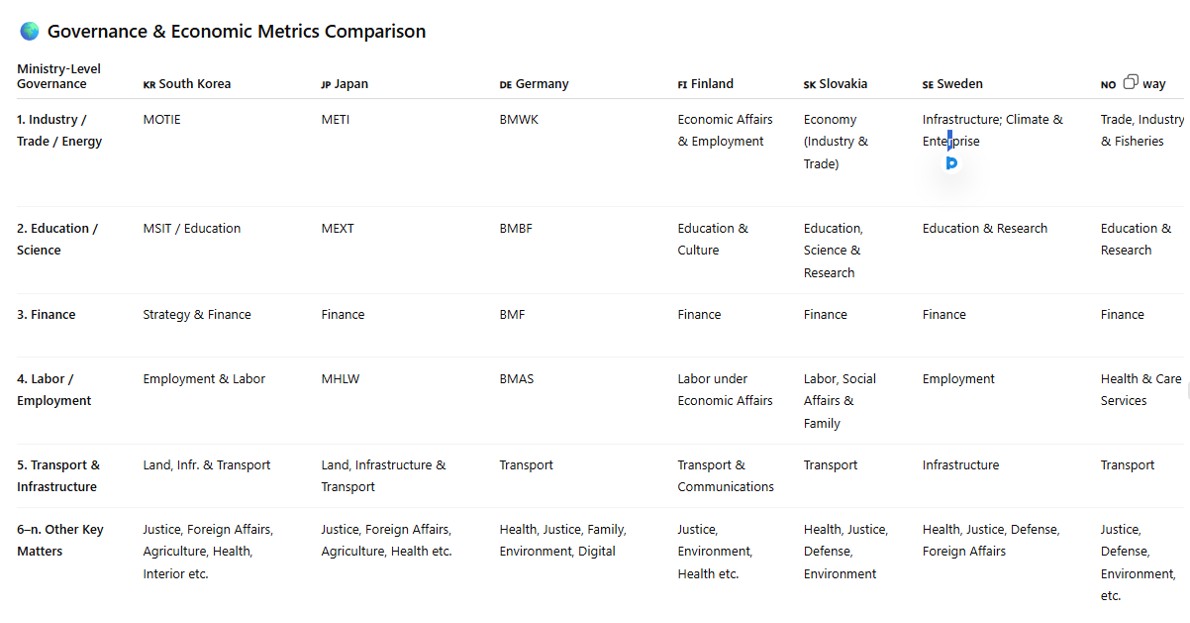
Comparative Governance Table: Ministries, Agencies & Manufacturing Focus
Certainly! Here’s the table with countries by specified order across the top row: South Korea, Japan, Germany, Finland, Slovakia, Sweden, Norway. Under each country, I’ve listed all ministries or their equivalents. They are ranked by their importance to manufacturing. Key agencies or parastatals follow. They support industrial standards, innovation, and vocational development.
| 🇰🇷 South Korea | 🇯🇵 Japan | 🇩🇪 Germany | 🇫🇮 Finland | 🇸🇰 Slovakia | 🇸🇪 Sweden | 🇳🇴 Norway |
|---|---|---|---|---|---|---|
| 1. Trade, Industry & Energy (MOTIE) – Manufacturing, industrial policy, energy regulations | 1. Economy, Trade & Industry (METI) – Industrial technology, exports, energy, SME development | 1. Economic Affairs & Climate Action (BMWK) | 1. Economic Affairs & Employment | 1. Economy (Industry & Trade) | 1. Infrastructure; Climate & Enterprise | 1. Trade, Industry & Fisheries |
| 2. Science, ICT & Future Planning (MSIT) – R&D, tech standards | 2. Science, Technology & Education (MEXT) – R&D, tech transfer | 2. Education & Research (BMBF) – Applied research, vocational frameworks | 2. Education & Culture – Vocational skill standards | 2. Education, Science, Research & Sport | 2. Education & Research | 2. Education & Research |
| 3. Strategy & Finance – Fiscal policy to support industry | 3. Finance – Industrial subsidy, tax policy | 3. Finance (BMF) – Industrial support funds | 3. Finance – R&D grants, public investment | 3. Finance | 3. Finance | 3. Finance |
| 4. Employment & Labor – Workforce, vocational training | 4. Health, Labour & Welfare – Labor protections | 4. Labour & Social Affairs (BMAS) – Apprenticeships | 4. Health & Social Affairs – Workforce welfare | 4. Labour, Social Affairs & Family | 4. Employment | 4. Health & Care Services |
| 5. Education – Tertiary, vocational stream | 5. Education (MEXT) – Vocational schools, tech curricula | 5. Education & Research | 5. Education & Culture | 5. Education | 5. Education & Research | 5. Education & Research |
| 6. Land, Infrastructure & Transport – Industrial zones, logistics | 6. Land, Infrastructure & Transport | 6. Transport | 6. Transport & Communications | 6. Transport | 6. Infrastructure | 6. Transport |
| 7. Science oversight (MSIT) – Standards, tech safety | 7. Internal Affairs & Communications – ICT standards | 7. Interior; Justice – Regulations affecting business | 7. Interior | 7. Interior; Justice | 7. Justice | 7. Justice & Public Security |
| 8. Agriculture, Food & Rural Affairs – Agro-processing | 8. Agriculture | 8. Food & Agriculture (BMEL) | 8. Agriculture & Forestry | 8. Agriculture | 8. Employment | 8. Climate & Environment |
| 9. Health & Welfare – Occupational health | 9. Health; Welfare | 9. Health | 9. Social Affairs & Health | 9. Health | 9. Health & Social Affairs | 9. Health & Care Services |
| 10. Foreign Affairs – Export promotion, trade deals | 10. Foreign Affairs | 10. Foreign Affairs | 10. Foreign Affairs | 10. Foreign & European Affairs | 10. Foreign Affairs | 10. Foreign Affairs |
| …plus – Interior & Safety, Justice, Defense, etc., under broader functions | …others: Justice, Defense, Environment, Culture | …others: Environment, Digital & Modernization, Family Affairs | …others: Environment, Defense, Culture | …others: Culture, Justice, Environment, Defense | …others: Defense, Culture | …others: Justice, Defense, Environment, Culture |
🔧 Key Agencies / Parastatals Supporting Manufacturing
South Korea
- KATS (industrial standards)
- KITECH, KIAT (industrial R&D/SMEs)
- NHI (workforce & reskilling)
- Small & Medium Business Administration
Japan
- Agency for Natural Resources & Energy
- Small & Medium Enterprise Agency
- Japan Patent & Nuclear Regulation Offices
- AIST (applied industrial science)
Germany
- BIBB (vocational training)
- Fraunhofer Institutes (applied R&D)
- Chambers of Commerce (IHK)
- DLR, Helmholtz, Max Planck
Finland
- Finnish Energy Authority, Transport Safety (Trafi)
- Customs, Tax, Food, Immigration, VTT
- Digital & Population Data Services
Slovakia
- SARIO (investment & trade)
- National Bank of Slovakia
- Energy Agency
- SOEs in rail, postal, energy, automotive
Sweden
- Civil Contingencies Agency (MSB)
- Customs & Coast Guard
- Consumer Agency
- Swedish Trade & Development Agency (Sida)
Norway
- Innovation Norway
- Norwegian Maritime Authority
- Medical Products & Development Cooperation (Norad)
- Statistics Norway & sovereign wealth management
📌 Summary
- Ministries directly influencing manufacturing are listed first: Industry, Trade/Energy, Education/Science, Finance, followed by Labor, Infrastructure, Health.
- Agencies and parastatals support standards, innovation, SME development, and workforce training.
- This structure facilitates dual-track vocational pipelines, standards enforcement, and innovation—key elements in ensuring citizens earn and benefit from industrial growth.
- Here’s the enhanced comparative table with Botswana added as the last column and the detailed economic metrics included as requested:
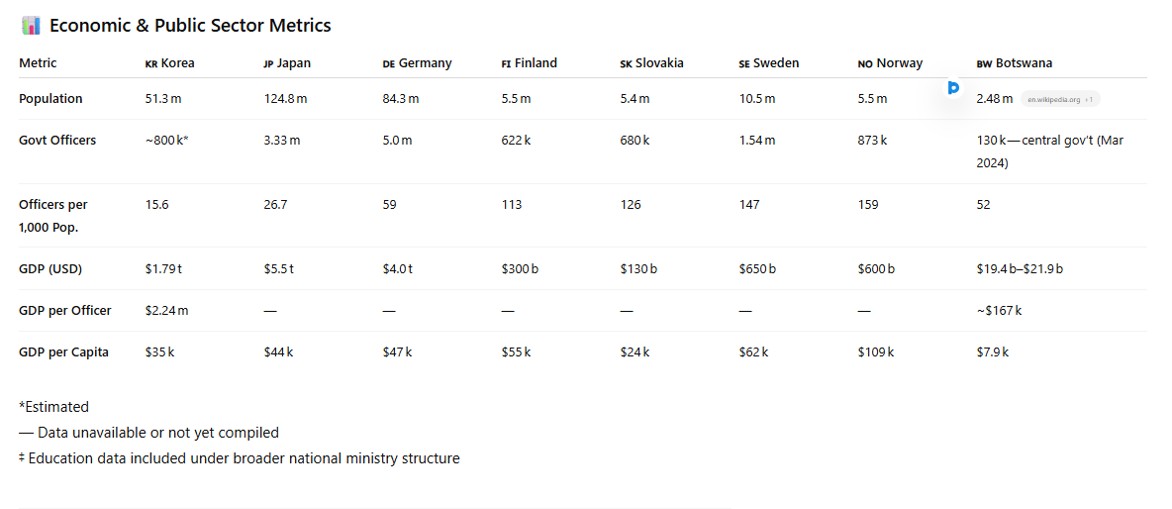
🔍 Botswana Highlights
- Ministries in manufacturing-critical order:
- Employment, Labour Productivity & Skills Development
- Education & Skills Development
- Finance & Economic Development
- Infrastructure, Housing & Urban Development
(Other ministries: Justice, Health, Foreign Affairs, etc.)
- Government Officers: ~130,424 in central government (March 2024) datacommons.org+15ceicdata.com+15statsbots.org.bw+15gov.bw+1thetimes.co.uk+1gov.bwthetimes.co.uk
- Public Servant Density: ~52 officers per 1,000 population
- GDP per Officer: ~$167,000 (based on $19.4b GDP estimate)
- GDP per Capita: ~$7,879 (2024) ft.com+4en.wikipedia.org+4statsbots.org.bw+4en.wikipedia.org+6worldeconomics.com+6en.wikipedia.org+6
✅ Summary Insights
- Ministries in each country are ordered by their direct relevance to manufacturing and industrial development.
- Botswana shows a mid-range public sector density. It has a much lower GDP per capita than OECD countries. These factors signal opportunities for growth through targeted institutional and vocational strengthening.
- The significant variance in “GDP per officer” highlights differences in public-sector efficiency and economic productivity.
Germany is one of the world’s top manufacturing powerhouses, known for high-quality engineering, advanced automation, and industrial specialization. Its key manufacturing industries include:
🇩🇪 Germany’s Key Manufacturing Sectors
1. Automotive Industry
- Germany is Europe’s largest car producer and the world’s 4th largest (after China, U.S., and Japan).
- Major firms: Volkswagen Group, BMW, Mercedes-Benz, Porsche, Audi.
- Also a hub for automotive parts (Bosch, Continental, ZF Friedrichshafen).
- Accounts for ~5% of GDP and over 800,000 direct jobs.
2. Mechanical Engineering
- Strong mid-sized firms (Mittelstand) produce world-class machinery: CNC machines, compressors, pumps, robotics, turbines.
- Largest exports include industrial machinery and production systems.
- Over 6,600 companies employ ~1 million people.
3. Chemical and Pharmaceutical Industry
- One of the largest in the EU.
- Key players: BASF, Bayer, Evonik, Merck KGaA.
- Produces industrial chemicals, fertilizers, polymers, and pharmaceuticals.
- Accounts for over €200 billion in annual turnover.
4. Electrical and Electronics Industry
- Includes consumer electronics, semiconductors, automated control systems, and medical devices.
- Major companies: Siemens, Infineon Technologies, Bosch (also overlaps with automotive).
- Strong R&D focus, contributing to smart factories and Industry 4.0.
5. Metals and Metal Products
- Includes steel, aluminum, copper, and metal fabrication for construction, tools, and industrial use.
- Germany is Europe’s largest steel producer.
6. Food & Beverage Processing
- Though less high-tech, it’s a large sector: breweries (Germany has ~1,300), meat processing, dairy, and confectionery (e.g., Haribo).
- Strong domestic and export markets.
7. Aerospace
- Strong presence through Airbus Germany, MTU Aero Engines, and dozens of high-precision suppliers.
- Focus areas: aircraft components, propulsion systems, avionics, and satellite technology.
8. Renewable Energy & Environmental Technologies
- Rapid growth in wind turbine, solar panel, and battery technology manufacturing.
- Germany is a leading exporter of environmental and climate protection technologies.
🏗️ Industry Backbone: The Mittelstand
- Germany’s manufacturing strength is supported by thousands of highly specialized small and medium-sized enterprises (SMEs)—especially in machinery, tools, and engineering.
- These companies often dominate global niche markets (“hidden champions”).
📦 Export Orientation
- Manufacturing makes up ~23% of Germany’s GDP.
- Over 80% of goods exports are manufactured products.
- Germany is the world’s 3rd largest exporter after China and the U.S.
Japan has long been a global leader in advanced manufacturing, blending high precision, automation, and quality control. Its industries are deeply integrated into global supply chains and supported by strong vocational training and R&D institutions.
🇯🇵 Japan’s Key Manufacturing Industries
1. Automotive
- Japan is the world’s 3rd largest car producer and a major vehicle exporter.
- Leading companies: Toyota, Honda, Nissan, Mazda, Subaru, Mitsubishi.
- Strong focus on hybrid, hydrogen fuel cell, and electric vehicle (EV) technologies.
- Major supplier of precision automotive components, robotics, and software systems.
2. Electronics & Consumer Technology
- Japan pioneered modern consumer electronics and still excels in components.
- Key firms: Sony, Panasonic, Toshiba, Sharp, Fujitsu.
- Strong in sensors, imaging systems, gaming (Sony PlayStation), audio tech, and high-end consumer appliances.
- Japan is also a top producer of industrial robotics.
3. Semiconductors & Electronic Components
- Japan doesn’t lead in chip volume but dominates in precision equipment and chipmaking materials (e.g., photoresists, silicon wafers).
- Companies: Renesas, Tokyo Electron, SCREEN Holdings, Sumco, Kioxia (formerly Toshiba Memory).
- Japan provides ~50% of the world’s semiconductor manufacturing materials.
4. Industrial Machinery & Robotics
- Japan is the world’s largest robot manufacturer and exporter.
- Companies like Fanuc, Yaskawa, Kawasaki Heavy Industries, Mitsubishi Electric produce automation systems used globally.
- Also strong in CNC machines, precision tools, and factory automation systems.
5. Shipbuilding
- A traditional strength, now focused on eco-friendly vessels and specialized carriers (e.g., LNG ships).
- Competes globally with Korea and China.
- Companies include Japan Marine United, Mitsubishi Heavy Industries.
6. Aerospace
- Japan produces components for Boeing, Airbus, and domestic space programs.
- Companies: Mitsubishi Heavy Industries, Kawasaki Heavy Industries, IHI Corporation.
- Involved in spacecraft, satellite systems, jet engines, and parts manufacturing.
7. Chemicals & Materials
- Japan leads in specialty chemicals, synthetic fibers, plastics, battery materials, and optical materials.
- Key firms: Toray, Asahi Kasei, Mitsubishi Chemical, Showa Denko.
- Also critical in lithium-ion battery components and solar panel materials.
8. Pharmaceuticals & Medical Devices
- Japan is among the top global pharmaceutical markets.
- Major firms: Takeda, Astellas, Daiichi Sankyo, Chugai.
- Also strong in medical imaging, surgical equipment, and diagnostics.
9. Food & Beverage Processing
- Though less high-tech, Japan excels in packaging automation, food safety, and premium product branding.
- Companies: Asahi, Kirin, Nissin, Ajinomoto.
📦 Export and GDP Contributions
- Manufacturing accounts for ~19% of GDP.
- Top exports:
- Vehicles & vehicle parts
- Machinery & robotics
- Electronics & semiconductors
- Optical instruments
- Chemical products
⚙️ Strengths in Manufacturing
- Kaizen and Lean Production: Process improvement and just-in-time manufacturing originated in Japan.
- Vocational-technical integration: Public and private training institutions are closely linked to industry needs.
- Global suppliers: Japanese firms supply crucial components in aerospace, auto, electronics, and advanced machinery worldwide.
South Korea is a global manufacturing powerhouse, known for its rapid industrialization and advanced technology sectors. It combines strong state coordination, chaebol (industrial conglomerates), and high STEM talent density to compete globally. Here are its key manufacturing industries:
🇰🇷 South Korea’s Key Manufacturing Industries
1. Semiconductors & Electronics
- World leader in memory chips (DRAM, NAND) and displays.
- Major players: Samsung Electronics, SK Hynix, LG Electronics.
- Exports of semiconductors alone account for
20% of national exports ($100B+ annually). - Also strong in smartphones, TVs, OLED panels, and batteries.
2. Automotive
- 5th largest car producer globally.
- Key firms: Hyundai Motor Group (Hyundai, Kia, Genesis), Renault Korea.
- Industry includes vehicle assembly, parts, EVs, and autonomous tech.
- Employs over 300,000 people directly.
3. Shipbuilding
- Longstanding global leader in LNG tankers, container ships, and offshore oil platforms.
- Companies: Hyundai Heavy Industries, Samsung Heavy Industries, Daewoo Shipbuilding & Marine Engineering (DSME).
- South Korea often ranks #1 or #2 globally in gross tonnage produced (competing with China).
4. Petrochemicals & Refining
- Converts imported crude oil into refined fuels and a wide range of chemical products.
- Key players: LG Chem, Lotte Chemical, Hanwha Total, SK Innovation.
- Supplies domestic needs and exports to China, ASEAN, and the U.S.
5. Steel & Materials
- Core to supplying the shipbuilding, construction, and auto sectors.
- Flagship company: POSCO – one of the world’s largest steel producers.
- Also includes aluminum and specialty alloy manufacturing.
6. Consumer Electronics & Home Appliances
- Global leader in smart devices, refrigerators, air conditioners, and washing machines.
- Firms like Samsung and LG are dominant globally, often blending AI and IoT features.
7. Pharmaceuticals & Biotechnology (emerging)
- Recent growth in biopharmaceuticals, especially biosimilars.
- Companies like Celltrion and Samsung Biologics are globally competitive CDMOs (contract drug manufacturers).
- Government investments through Korea Bio-Economy Strategy 2030.
8. Defense & Aerospace (growing)
- Increasing investment in military equipment, fighter jets (e.g., KF-21), submarines, and satellites.
- Major players: Hanwha Aerospace, KAI (Korea Aerospace Industries).
- South Korea is positioning to become a top arms exporter (e.g., deals with Poland, UAE, Indonesia).
📦 Export-Oriented Manufacturing
- Manufacturing makes up ~27–30% of GDP.
- Top 5 exports (2023):
- Semiconductors
- Petrochemicals
- Automobiles
- Ships
- Consumer electronics
⚙️ Industrial Model: The Chaebol System
- Large conglomerates (e.g., Samsung, Hyundai, SK, LG, Lotte) dominate high-tech manufacturing.
- Government historically played a strategic role in guiding export industries via investment, subsidies, and education.
Africa’s manufacturing landscape is diverse and evolving, with several countries emerging as regional powerhouses and others developing niche industries. Here’s an overview of key manufacturing industries across the continent, organized by country and sector:
🌍 Leading African Manufacturing Industries
🇪🇬 Egypt
- Chemicals & Petrochemicals: Major producers of plastics, fertilizers, detergents. Petrochemicals make up ~12% of industrial output (africa-hr.com, en.wikipedia.org).
- Electronics & Home Appliances: “Egypt Makes Electronics” initiative has attracted Samsung, Haier, boosting local sourcing to 70% (en.wikipedia.org).
- Iron & Steel: Largest steel producer in Africa (~10.7 Mt crude steel in 2024) (en.wikipedia.org).
- Automotive Assembly: 15 assemblers with 75k+ employees; capacity ~300k vehicles/year (en.wikipedia.org).
- Textiles & Pharmaceuticals: Over 6,500 textile factories; strong domestic pharma manufacturing (~$400 m exports) .
🇳🇬 Nigeria
- Agro-processing & FMCG: Cement, beverages, food, and consumer goods lead production (en.wikipedia.org).
- Cement & Construction Materials: Large domestic demand supports major local producers.
- Textiles & Breweries: Beer industry is second largest in Africa.
🇿🇦 South Africa
- Automotive: ~532,000 vehicles produced in 2023; MIDP/APDP programs support local content and exports (en.wikipedia.org).
- Food Processing & Beverages: Strong industry studies on food, plastics, clothing, steel (tips.org.za).
- Steel & Capital Goods: Major industrial firms and supply chains; sustainability-focused strategies (tips.org.za).
- Electronics & Electrical Equipment: Growth in automation and control systems.
🇲🇦 Morocco
- Automotive: Africa’s largest exporter of vehicles (700k/year), accounting for 22% of GDP; strong EV investment (apnews.com).
- Aerospace & Components: Growing cluster around aircraft parts for global OEMs.
🇹🇳 Tunisia
- Manufacturing Diversification: Textiles, agro-processing, electronics form core sectors under national industrialization strategy (ft.com).
🇬🇭 Ghana
- Electronics & Auto Assemblies: Automotive and electronics manufacturing are expanding .
- Food & Cement processing: Includes small shipbuilding and glass sectors.
🇪🇹 Ethiopia
- Food Processing: Largest in medium/large manufacturing (39% share); major employment (~1 m jobs) (tips.org.za).
- Textiles & Leather: Focus on apparel for jobs and exports.
- Construction & Energy Equipment: Building materials and hydroelectric infrastructure.
🇰🇪 Kenya & Others
- Common core industries include food/beverage, cement, textiles, and light manufacturing .
- Fintech and ICT assembly growing in urban hubs.
🇧🇪 Benin (Example of Emerging)
- Apparel & Textiles: Growing “farm-to-fashion” garment cluster powered by Arise Industrial Platform (ft.com).
📊 Pan‑African Snapshot
| Country | Flagship Manufacturing Sectors |
|---|---|
| Egypt | Chemicals, Electronics, Steel, Automotives, Textiles, Pharma |
| Nigeria | Agro-processing, Cement, Beverages, Textiles |
| South Africa | Auto, Food & Beverage, Steel, Plastics, Electronics |
| Morocco | Automotive, EV components, Aerospace |
| Tunisia | Textiles, Agro-processing, Electronics |
| Ghana | Electronics, Auto, Food, Cement |
| Ethiopia | Food, Textiles, Construction Materials |
| Kenya & Others | Food, Cement, Textiles, Light Industrial Assembly |
| Benin | Apparel Textiles |
🔧 Strategic Observations
- North & Southern Africa dominate value-rich manufacturing (automotive, petrochemicals, steel, aerospace).
- West and East Africa focus on resource-based and labor-intensive sectors (food, cement, garments).
- Emerging clusters (e.g., Morocco’s EV push, Benin’s textiles) indicate strategic industrial transformation.
- Across the continent, food & beverage processing, cement, textiles, and automotive assembly are the most common manufacturing threads (stat.unido.org).
✅ Next Steps
- Visualization options: Heatmap of manufacturing concentration, export breakdown charts, sectoral GDP contribution map.
- Deep dive suggestion: Examining one or two sub-Saharan countries’ industrial policies and infrastructure requirements.
What determines which flagship manufacturing sectors leading countries excel in?
The direction of flagship manufacturing sectors in leading countries is rarely accidental—it is shaped by a convergence of strategic forces. These forces determine why certain countries become globally competitive in automotive, semiconductors, shipbuilding, pharmaceuticals, or textiles.
Here’s a structured breakdown of the seven major forces:
🔧 1. Factor Endowments (Resources & Workforce Skills)
Countries develop industries based on what they naturally have or can competitively build:
| Example | Force |
|---|---|
| Germany has strong engineering culture, STEM education, and access to European markets → excels in machinery & automotive | |
| Vietnam, Bangladesh have large, low-cost labor pools → dominate textile manufacturing | |
| South Korea built a strong STEM talent pool → leads in semiconductors & shipbuilding |
💰 2. State Industrial Policy & Planning
Strong government coordination shapes national focus:
| Country | Policy Direction |
|---|---|
| South Korea (since 1960s): deliberate export-led model supporting shipbuilding, steel, semiconductors | |
| China: “Made in China 2025” prioritizes robotics, EVs, and pharmaceuticals | |
| Germany: “Industry 4.0” supports digitalization of high-end manufacturing | |
| Malaysia: biotech and electronics pushed by successive national masterplans |
🧭 3. Geopolitical Alliances & Trade Positioning
Access to preferential trade agreements, neighboring markets, and logistics corridors:
| Example | Influence |
|---|---|
| Mexico benefits from USMCA → auto manufacturing hub for U.S. market | |
| Morocco leverages EU–Morocco Free Trade Area → becomes Africa’s auto export leader | |
| Singapore built a port-led strategy tied to global shipping and electronics hubs |
🔗 4. Public–Private Linkages & Institutional Strength
Effective industrial ecosystems emerge when government, universities, and businesses co-invest:
- Germany: Dual vocational training + SME suppliers + Fraunhofer Institutes = global engineering dominance
- Japan: MITI (now METI) orchestrated coordination across sectors
- Sweden & Finland: innovation councils, public R&D funding, and industry-academic partnerships foster medical tech and clean manufacturing
⚙️ 5. Infrastructure & Logistics Readiness
Physical and digital infrastructure underpins value-chain viability:
- Morocco’s Tangier-Med port made auto exports viable to Europe
- South Korea’s smart cities and logistics networks make just-in-time manufacturing feasible
- India’s electronics growth clusters around SEZs and logistics corridors like Delhi–Mumbai Industrial Corridor
📉 6. Global Demand & Timing
Global trends and “windows of opportunity” shape sector trajectories:
| Trend | National Response |
|---|---|
| EV and battery boom → South Korea & China scale lithium, EV, and battery chains | |
| COVID-19 & supply chain shocks → Vietnam, India, and Indonesia emerge as China+1 options | |
| Climate goals → Germany, Norway, and Sweden invest in clean energy tech and green industry |
🧬 7. Path Dependence & Legacy Industries
Once competitive, sectors attract more investment, R&D, and skilled workers:
- Germany: legacy in precision tools and automotive → continues to dominate high-end machinery
- Japan: legacy in consumer electronics and robotics → sustains global brand leadership
- Nigeria & Egypt: early development in cement and food → these sectors continue to dominate despite diversification efforts
✅ Summary Table
| Force | What It Determines |
|---|---|
| Factor Endowments | What sectors are initially viable |
| Industrial Policy | What sectors receive focused support |
| Trade/Geopolitics | Which markets they serve |
| Institutions | How well sectors innovate & scale |
| Infrastructure | Sectoral cost-efficiency & access |
| Global Demand | What becomes export-worthy |
| Path Dependence | What sectors endure & deepen |
Great. Here’s an analysis of manufacturing sectors where Botswana can most viably develop and lead. This analysis is based on the seven strategic forces that shape successful manufacturing economies.
🇧🇼 Botswana: Strategic Manufacturing Direction
🔧 1. Factor Endowments
Botswana’s endowments point to resource-linked and knowledge-based sectors:
- Minerals: Diamonds, coal, copper-nickel → downstream value-add (e.g., jewelry, specialty metals)
- Livestock: Large cattle population → meat processing, leather goods
- Arable land + sunlight: Favors agrifood processing, bio-inputs, and solar-powered systems
- English-speaking, relatively educated workforce: Potential for back-office, tech assembly, and light electronics
🟢 Viable manufacturing pathways: meat/leather goods, agro-processing, solar assembly, jewelry, bio-based fertilizers, eco-construction materials
💰 2. Industrial Policy & Government Planning
Botswana has:
- National Development Plans (NDPs) emphasizing diversification
- Institutions like LEA, BITC, and CEDA supporting SMEs
- Recent industrial zoning (e.g., Botswana Innovation Hub, SEZs)
But:
- Coordination is often fragmented
- Implementation capacity is inconsistent
- Few specific manufacturing targets (compared to Morocco or Vietnam)
🟡 Opportunity: Create focused sectoral masterplans for 3–4 industries with measurable targets (e.g., beef exports → processed beef share)
🧭 3. Geopolitical Alliances & Trade
- Member of SACU and SADC → access to South African and regional markets
- AGOA allows exports to U.S. duty-free (e.g., textiles, leather)
- EU’s EPA provides preferential market access
🟢 Strategic edge: Be the regional supplier of certified, traceable, climate-smart products (meat, produce, leather, solar components)
🔗 4. Public–Private Linkages & Institutions
- Growing capacity via BUAN, BITRI, LEA, HRDC
- Lack of deep vocational-industry linkages (like Germany’s Dual VET model)
- Weak R&D commercialization
🟡 Opportunity: Align education (e.g., BUAN, BIUST) with a few flagship industrial sectors → e.g., solar, livestock tech, packaging
⚙️ 5. Infrastructure & Logistics
- Excellent road network, border clearance, and energy reliability (by regional standards)
- Access to Dry Ports in Walvis Bay (Namibia) for exports
- Ongoing investment in SEZs (e.g., Lobatse Meat cluster)
🟢 Advantage: Can serve as a processing & packaging hub for Southern Africa — particularly for high-quality, traceable food exports
📉 6. Global Demand & Trends
Botswana could tap into:
- Rising demand for:
- Ethical meat & leather
- African foods (ready-to-eat, spices)
- Bio-based inputs (e.g., eco-fertilizers)
- Specialty gemstones/jewelry
- Growing ESG pressure → demand for clean, traceable, small-batch production
🟢 Growth opportunities: Build “Botswana Provenance Brands” around clean beef, leather, sorghum, and jewelry
🧬 7. Path Dependence
- Existing expertise in beef, diamonds, and textiles (basic) → leverage into:
- Value-added leather goods, not just hides
- Craft and mid-range jewelry, not just cut diamonds
- Agro-industrial clusters, not just raw exports
🟡 Risk: Without investment in processing capacity and logistics integration, industries may stay at raw commodity level
✅ Summary Table: Botswana’s Manufacturing Pathways
| Strategic Force | What It Favors | Priority Sectors |
|---|---|---|
| Endowments | Agro, livestock, minerals, solar | Meat, Leather, Bio-inputs, Jewelry, Solar Kits |
| Industrial Policy | Needs sharper sectoral focus | Agro-processing, Light manufacturing |
| Trade Positioning | Duty-free regional & Western access | Beef, textiles, craft, renewable inputs |
| Institutions | Gaps in technical-industry coordination | VET-Industry links for 3–4 core sectors |
| Infrastructure | Strong potential as a logistics hub | Packaged foods, processed meat, light assembly |
| Global Demand | Clean traceable production, ethical sourcing | ESG-branded goods, artisanal goods |
| Path Dependence | Leverage meat, diamonds, agro clusters | From commodities to brands |
🌟 Suggested Flagship Sectors for Botswana
Value-added Meat Processing (retail packaging, frozen foods, halal exports)
Leather Goods (shoes, upholstery, bags for regional brands)
Craft-to-Jewelry Manufacturing (Botswana diamond heritage branding)
Agro-Processing (sorghum, ginger, turmeric, herbs, bio-pesticides)
Solar-Powered Systems Assembly (irrigation kits, cold storage)
Restructuring Government for Industrial Growth: A Blueprint for Botswana’s Next 30 Years – Lessons from Korea, Japan, and Germany
Botswana is expanding its manufacturing base over the next 30 years. It draws on governance models from South Korea, Japan, and Germany. How should it streamline its 18 ministries into 10–12? It must also downsize the public payroll. Additionally, it should reorganize agencies and parastatals to align with national industrial priorities.
To strategically structure Botswana’s workforce distribution over the next 30 years, based on projected population growth (5–8 million), a GDP of $60–100 billion, and a target per capita wage of P20,000/month (P240,000/year), we need to align public sector employment with:
- Efficiency (lean government)
- Service delivery needs
- A manufacturing- and innovation-led economy
Below is a recommended model of how the working population should be distributed. It shows the division between the private and public sectors. This is further broken down across 12 ministries.
📊 1. Assumptions and Macroeconomic Framework
| Factor | Projection |
|---|---|
| Total Population (2055) | 6.5 million (midpoint) |
| Working-age Population (15–64) | ~65% ⇒ 4.2 million |
| Labor Force Participation Rate | 70% ⇒ ~3 million employed persons |
| GDP (USD) | $80 billion (midpoint) |
| Target Monthly Wage | P20,000 = $1,500 |
| Per Capita GDP | $12,300 (consistent with upper-middle-income status) |
📈 2. Sectoral Employment Distribution (Public vs Private)
| Sector | Target % of Workforce | Headcount (of 3 million) | Notes |
|---|---|---|---|
| Private Sector | 85% | 2.55 million | Includes manufacturing, services, trade, agriculture, ICT |
| Public Sector | 15% | 450,000 | Must become leaner and more tech-enabled |
📌 In 2024, Botswana has ~150,000 public servants. This model grows it only when necessary. It maintains a low public wage burden (~12–15% of GDP) in line with global best practice.
🏛️ 3. Public Sector Distribution by Ministry (12 total)
Public service allocation across ministries must reflect their role in a manufacturing economy, prioritizing infrastructure, skills, industry, and governance.
| Ministry | % of Public Sector | Headcount | Strategic Role |
|---|---|---|---|
| 1. Education & Skills Development | 25% | 112,500 | Teachers, trainers, tech-VET specialists |
| 2. Health & Life Sciences | 18% | 81,000 | Doctors, nurses, biotech, pharma regulation |
| 3. Infrastructure & Energy | 10% | 45,000 | Engineers, logistics planners, utilities |
| 4. Industrialization, Trade & Investment | 7% | 31,500 | Cluster leads, SME support, trade attachés |
| 5. Local Gov, Housing & Urban Dev. | 7% | 31,500 | Local services, permits, land devt |
| 6. Agriculture & Agro-processing | 6% | 27,000 | Extension officers, regulators, plant health |
| 7. Justice, Governance & Public Service | 5% | 22,500 | Courts, audit, procurement, public admin |
| 8. Environment, Natural Resources | 5% | 22,500 | Mineral oversight, land reform, climate policy |
| 9. Science, Innovation & Technology | 4% | 18,000 | Research grants, innovation hubs, labs |
| 10. Labour & Productivity | 3% | 13,500 | Employment centers, inspectors, migration mgmt |
| 11. Finance & Economic Planning | 3% | 13,500 | Treasury, stats, budgeting, PPP facilitation |
| 12. Defence & Public Safety | 7% | 31,500 | BDF, Police, Fire, Border patrol |
📌 Ministries supporting manufacturing ecosystems directly (marked in bold) get >45% of public jobs. This aids Botswana’s shift from dependency to productivity.
💡 Strategic Recommendations
A. Workforce Policy Goals
- Maintain public sector ≤15% of national employment
- Grow vocational and engineering graduates through the Education Ministry
- Automate administrative work; repurpose excess headcount to technical roles
B. Budgeting
- Public wage bill should remain at 12–15% of GDP → aligns with Germany, Korea
- High ROI ministries (education, health, industrialization) get a larger share
C. Private Sector Enabled
- 2.5M+ private jobs should be supported through:
- Industrial zones (special economic zones)
- Export clusters (meat, leather, solar)
- Trade facilitation bodies
- STEM-intensive SME development
To structure Botswana’s 12 ministries into two strategic categories aligned with a systems-thinking economic model—growth drivers vs stabilizers—we consider:
- Growth Drivers: Ministries that create new value, directly contribute to GDP expansion, stimulate employment, exports, or productivity gains.
- Stabilizers: Ministries that regulate, protect, or redistribute, ensuring social cohesion, compliance, and corrections when growth becomes unequal or unsustainable.
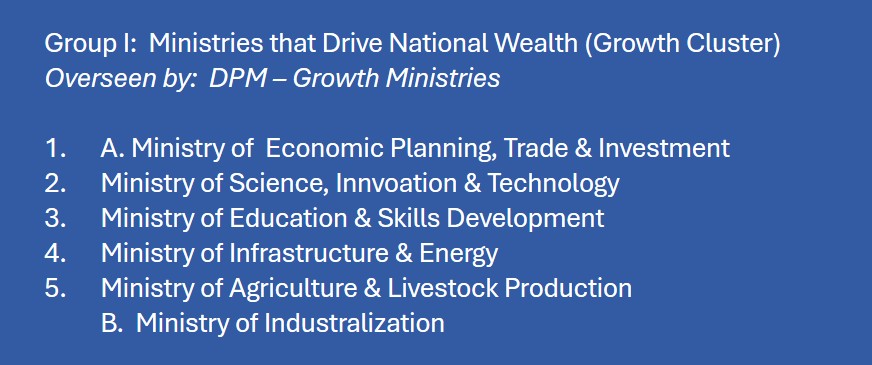
🟢 I. Ministries That Drive the Growth of National Wealth
These ministries are engines of productivity, innovation, and competitiveness. They build the foundations of manufacturing, unlock factor endowments, and convert them into wealth-generating systems.
| No. | Ministry | Core Growth Functions |
|---|---|---|
| 1. | Economic Planning, Industrialization, Trade & Investment | Manufacturing policy, trade expansion, FDI, SME support |
| 2. | Education & Skills Development | Builds human capital, technical education, and STEM pipelines |
| 3. | Science, Innovation & Technology | Drives R&D, digitization, and value-added knowledge economy |
| 4. | Agriculture, Agro-processing & Livestock | Modernizes value chains, promotes exports and import substitution |
| 5. | Infrastructure & Energy | Enables industrial zones, logistics, and energy supply for factories |
🧠 Outcome: These ministries build, enable, and multiply national capacity to produce wealth, increase exports, and raise productivity.
🟡 II. Ministries That Stabilize or Slow the Retardation of Wealth
These ministries intervene to manage risks, correct imbalances, and ensure that the economy’s growth is sustainable, inclusive, and secure. They do not directly create wealth—but prevent breakdowns, ensure justice, and reduce volatility.
| No. | Ministry | Stabilizing Role |
|---|---|---|
| 6. | Local Government, Housing & Urban Dev. | Urban-rural linkages, land zoning for economic use |
| 7. | Finance & International Relations | Macro-stability, fiscal discipline, revenue & debt management |
| 8. | Labour, Employment & Productivity | Ensures fair employment, migration, and wage regulation |
| 9. | Justice, Governance & Public Service | Institutional integrity, anti-corruption, fair procurement |
| 10. | Health & Life Sciences | Maintains health capital, workforce productivity |
| 11. | Environment, Natural Resources & Climate | Protects ecological assets, climate risk, land use planning |
| 12. | Defence & Public Safety | Ensures national security, border safety, and public order |
🧠 Outcome: These ministries work to prevent erosion of national wealth. They also respond to shocks. Additionally, they balance the consequences of uneven or unsustainable growth.
🧩 Systems Thinking Insight
In a generative economy, the two groups are not oppositional:
- Growth ministries must be backed by resilient stabilizers.
- Stabilizing ministries must not grow unchecked to the point of over-regulation or resource capture.
📌 To become a high-income, industrial economy, Botswana must increase the influence and budget share of Group I (growth drivers). At the same time, they should optimize the size and administrative efficiency of Group II (stabilizers).
The proposed dual oversight structure is anchored at the Office of the President with two Deputy Prime Ministers. This setup is a bold, systems-oriented governance reform. It separates national leadership into two complementary functional tracks:
- Growth Oversight (85% of the function): Leads and drives wealth generation.
- Stabilization Oversight (15% of the function): Ensures sustainability, inclusion, and governance integrity.
Each includes tripartite representation (public, private, community) to:
- Formulate joint policy
- Monitor cross-ministry implementation
- Evaluate impact at national and ministerial levels
Here is a detailed breakdown of the personnel architecture needed and real-world comparisons:
🧮 Estimated Personnel Requirements
🇧🇼 Target Population: 6.5 million
Civil Service: ~450,000
Total Government Employment: ~15% of the national workforce (from prior model)
🟢 A. Growth Oversight Function (85%)
➤ Distribution of 100% Growth Oversight (say 1,000 personnel as planning unit)
| Representation | % Share | Headcount | Notes |
|---|---|---|---|
| Public Sector Officials | 30% | 255 | Senior officers, policy directors, economists, planning officers |
| Community Leaders | 10% | 85 | Traditional leaders, civil society reps, sector-specific community networks |
| Private Sector Officials | 60% | 510 | Industry cluster leads, investors, R&D leaders, logistics managers |
Total Growth Oversight Core Staff: ~850–1,200 persons
➤ Location & Structure:
- Office of Deputy PM for Growth (Cabinet rank)
- 6–8 sectoral councils (e.g., Industrialization, Education, Innovation, Infrastructure, Local Government, Agriculture)
- Embedded teams in all 6 growth ministries (10–20 per ministry)
🟡 B. Stabilization Oversight Function (15%)
➤ Distribution of 100% Stabilization Oversight (say 200 personnel)
| Representation | % Share | Headcount |
|---|---|---|
| Public Sector Officials | 30% | 60 |
| Community Leaders | 10% | 20 |
| Private Sector Officials | 60% | 120 |
Total Stabilization Oversight Core Staff: ~150–250 persons
➤ Location & Structure:
- Office of Deputy PM for Stabilization (Cabinet rank)
- Sectoral councils: Justice & Governance, Health, Environment, Labour, Finance, Security
- Embedded teams in 6 stabilization ministries (10–15 per ministry)
🔧 Supporting Staff
Each Deputy PM’s Office would need:
| Role Type | Approx. Headcount (Each DPM Office) |
|---|---|
| Strategic Advisors (policy, legal, economic) | 15–20 |
| Admin, Secretariat, Protocol | 20–30 |
| Monitoring & Evaluation | 10–15 |
| Communication & Public Liaison | 5–10 |
| Data & ICT Support | 10–15 |
Support Staff per DPM Office: ~60–80
Total Central Office Personnel (Growth + Stabilization): ~120–160
📌 Total System Personnel Estimate (Excl. Ministry Staff)
| Function | Core Oversight | Support Staff | TOTAL |
|---|---|---|---|
| Growth | 850–1,200 | 60–80 | 910–1,280 |
| Stabilization | 150–250 | 60–80 | 210–330 |
| TOTAL | — | — | 1,120–1,610 |
🌍 International Examples with Similar Structures
| Country | Comparable Model & Commentary |
|---|---|
| Singapore | Federal-State Working Groups (Bund-Länder) manage economic and stabilizing functions across ministries. The private sector and unions regularly involved in tripartite dialogue |
| South Korea | Uses Presidential Committees (e.g., on Science & ICT, Industrial Policy) with public–private–academic membership. Overseen by PM/Presidential Secretariat |
| Germany | Innovation policy councils led by the Prime Minister include private sector, academia, civil society; strong evaluative culture |
| Rwanda | Presidential Delivery Unit + private–public sector councils; streamlined cabinet (only ~20 ministers); heavy monitoring and centralized planning |
| Finland | Federal-State Working Groups (Bund-Länder) manage economic and stabilizing functions across ministries. The private sector and unions are regularly involved in tripartite dialogue |
🧭 Final Thoughts
The Botswana model:
- Anticipates industrial complexity by centralizing cross-ministry steering
- Rebalances state power by embedding the private sector in strategic execution
- Elevates community voices to guard against elite capture
- Mimics high-performance governance systems in Asia and Europe
BOTSWANA’S NATIONAL STRUCTURE NEEDS RETHINKING
📊 STEM Representation Across Key Governance and Economic Roles
Below is a detailed assessment of the recommended percentage of personnel with strong STEM backgrounds across various levels of leadership. This includes administration and oversight. These align with the 12 restructured ministries and the dual oversight structure you’ve established for Botswana’s manufacturing-led transformation.
This framework assumes a strategic shift where STEM capability becomes central to national planning, industrialization, and productivity growth.
| Category | Recommended % with STEM Background | Rationale |
|---|---|---|
| 1. Ministerial Positions / Appointments | 50–60% | Ministries directly linked to industrialization (e.g. Infrastructure, Science, Trade, Energy, Agriculture) require technocratic leadership; others (Justice, Health, Finance) benefit from multidisciplinary leadership with STEM familiarity. |
| 2. Dual Oversight Structure (Growth & Stabilization) | 65–75% | Growth oversight requires strong STEM grounding in industrial systems, logistics, innovation, and productivity metrics. Stabilization oversight (health, environment, labour) also demands technical leadership for evidence-based policy and regulation. |
| 3. Senior Leadership – Public Sector (Directors, PS, DGs) | 60–70% | Policy coherence, digital transformation, and program execution in a manufacturing-driven state need technical literacy at senior levels. |
| 4. Planning & Administrative Roles – Public Sector | 45–55% | Balanced composition; technical teams drive evidence-based planning, while non-STEM roles focus on governance, finance, and legal compliance. |
| 5. Senior Leadership – Private Sector | 70–80% | Manufacturing firms, industrial clusters, and innovation hubs demand leaders fluent in engineering, technology, logistics, quality control, and product development. |
| 6. Senior Leadership – Community Sector | 30–40% | Stronger STEM presence helps interface with technical programs (e.g., agritech, energy cooperatives), while retaining socio-political representation. |
| 7. Planning & Administrative Roles – Private Sector | 55–65% | Lean operations, value-chain management, and scaling industrial SMEs require technically informed back-office teams. |
| 8. General Population (target by 2055) | 35–45% | This reflects the cumulative effect of STEM investment in education, lifelong learning, and re-skilling initiatives. It is aligned with upper-middle-income economies that have transitioned through industrialization. |
🧠 Guiding Assumptions
- STEM includes science, technology, engineering, mathematics, and related applied fields (e.g., statistics, data science, biotech, agri-tech, manufacturing systems).
- These percentages assume Botswana significantly strengthens its education pipeline, vocational systems, and graduate reskilling programs in the next 15–20 years.
- This distribution balances technical competence with non-STEM leadership in law, governance, social development, and finance.
📘 International Comparisons for Benchmarking
Here is a visual breakdown. It shows the recommended percentage of personnel with strong STEM backgrounds. This applies across key governance and economic roles in Botswana’s manufacturing-led transformation. The accompanying table outlines these targets clearly.


Here’s a comparative chart showing Botswana’s STEM representation targets across key sectors, alongside benchmarks from South Korea, Singapore, and Germany. It highlights how Botswana’s ambitions align with or differ from these advanced manufacturing economies.

| Country | % STEM in Public Leadership | Notes |
|---|---|---|
| South Korea | ~60–70% (in industrial ministries) | Deep STEM bench in policy formation; engineers and scientists dominate economic planning units. |
| Finland | ~50–60% | Strong STEM literacy across all sectors; education reforms deeply integrated STEM at all levels. |
| Singapore | ~65–75% | Ministers and agency heads often come from engineering, economics, or data science backgrounds. |
| Germany | ~50–60% | Technical expertise in dual education system permeates industry and public institutions. |
📘 Projected Structure of the Education System
To meet the needs of a projected population of 10 million over the next 30 years, with 60% of school-age children accessing STEM education, Botswana would need to develop approximately:
- 2,520 public schools dedicated to STEM
- 1,080 private schools dedicated to STEM
When these are broken down by levels, the country would need approximately:
- 1,500 primary schools dedicated to STEM
- 1,260 secondary schools with a STEM focus
- 450 technical and vocational training centers
- 113 tertiary STEM institutions (universities, polytechnics, research hubs)
📘 Strategic Argument: Why Botswana Should Become a Regional STEM Hub
Strategic Location & Stability
Centrally positioned in Southern Africa with strong political and economic stability—a key precondition for long-term education investment.
Existing English-Language Advantage
English as an official language facilitates international partnerships, student mobility, and global curriculum alignment in STEM fields.
Underutilized Youth Demographic
Botswana can convert its growing youthful population into a skilled STEM workforce—supporting local industries and supplying regional labor needs.
Regional Supply Gaps in STEM Education
Neighboring countries face capacity shortages in STEM infrastructure. Botswana can fill this gap by hosting regional students and building exportable human capital.
Complement to Manufacturing Aspirations
A STEM-literate population is essential to building and operating manufacturing ecosystems. Education drives industrial competitiveness, tech innovation, and productivity.
Leverage on Botswana Innovation Hub & Tertiary Reform
Existing innovation ecosystems (e.g., BIH) and tertiary reforms can be scaled to anchor STEM clusters and attract global investment in research and high-tech industries.
Potential for Pan-African STEM Credentials
Botswana could develop standardized, recognized STEM diplomas and degrees for SADC and the African Union, setting quality benchmarks continental.
📘 Projected breakdown of the size of the public service
Based on a projected 2055 population of 10 million and a public service size target of 2% (200,000 public servants):
- Total Public Servants: 200,000
- Growth Ministries (6 total): ~21,667 staff per ministry
- Stabilizing Ministries (6 total): ~11,667 staff per ministry

Here is the breakdown of budget allocations across the 12 restructured ministries, categorized into Growth and Stabilizing groups. The allocations are presented as percentages. They are also shown in BWP amounts. This is based on an assumed national budget of BWP 100 billion.
These percentages reflect international benchmarks seen in countries like Singapore, South Korea, and Rwanda, adjusted for Botswana’s industrialization ambitions.
Certainly. Here’s how we’ll proceed for Botswana Governance Structure 2:
✅ Color Adjustments for Node Categories
To reflect the strategic orientation of ministries:
- 🔴 Stabilizing Ministries (focus: regulatory control, justice, internal balance) will be shown in red or pink.
These include:- Ministry of Finance
- Ministry of Local Government
- Ministry of Defence and Security
- Ministry of Justice
- Ministry of State President
- Ministry of Labour and Home Affairs
- Ministry of Education (basic, control-driven systems)
- 🟢 Growth Ministries (focus: economic transformation, productivity, export, STEM) will be shown in green.
These include:- Ministry of Trade and Industry
- Ministry of Agriculture
- Ministry of Communications, Knowledge and Technology
- Ministry of Minerals and Energy
- Ministry of Youth, Gender, Sport and Culture (for entrepreneurship)
- Ministry of Infrastructure and Housing Development
- Ministry of Education (tertiary, research/STEM)
🔗 Explanation of Inter-Ministerial Linkages
These linkages reflect functional interdependence—especially where policy design, budget execution, and long-term planning require joint oversight or coordination.
1. Finance ↔ All Ministries
- The Ministry of Finance is a core stabilizer, holding the budget reins.
- It must partner with both growth and stabilizing ministries to:
- Allocate funds for infrastructure, trade incentives, tech innovation (growth ministries)
- Maintain salary, compliance, public debt management (stabilizers)
2. Trade and Industry ↔ Agriculture, Communications, Minerals
- Trade and Industry is the lead growth engine.
- It must work with:
- Agriculture for commercializing food systems, exports, and agri-processing
- Communications, Knowledge & Tech to promote industrial innovation and digital commerce
- Minerals and Energy to expand beneficiation and value chains
3. Communications, Knowledge and Tech ↔ Education (Tertiary)
- Together they:
- Build a pipeline of STEM graduates
- Enable a tech-driven public service and economy
4. Youth, Gender, Sport and Culture ↔ Trade, Education, Agriculture
- Supports entrepreneurship policies tied to:
- Business development in rural and peri-urban areas (Agriculture)
- Start-ups and informal sector scaling (Trade)
- Skills and reskilling programs (Education)
5. Defence & Security ↔ State President, Local Government, Justice
- These form the national coordination and governance backbone:
- Justice ensures lawful conduct
- Defence upholds territorial and internal security
- Local Government executes stabilizing policy at local levels
6. Infrastructure & Housing ↔ All Growth Ministries
- Acts as a growth enabler.
- Supports:
- Agri-logistics and water access (Agriculture)
- Industrial parks and housing (Trade & Industry)
- Energy grids and broadband (Communications)
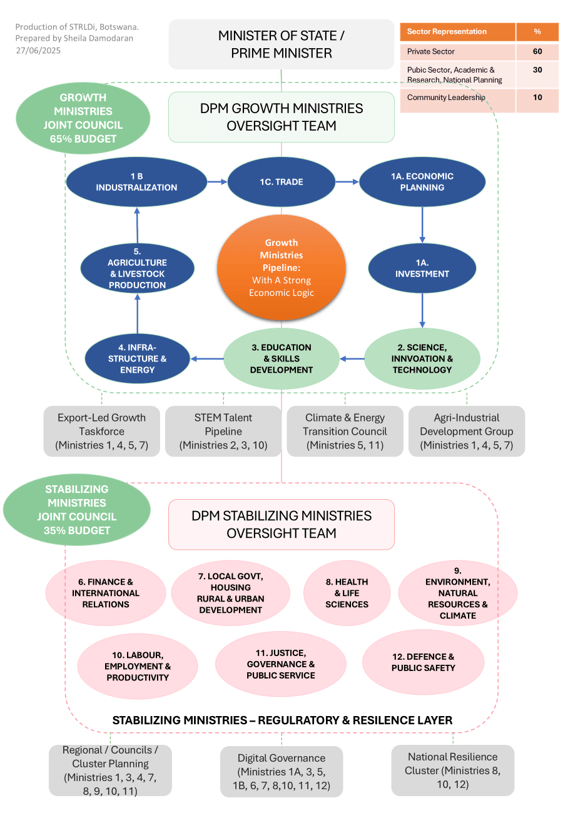

Here’s a clear, structured explanation you can use to walk someone through the diagram — Cabinet-safe, systems-faithful, and readable aloud. I’ll explain it top → middle → bottom, then close with what this fixes.
How to Read This Structure (What Is Actually Changing)
1. Political Authority and Guardrails (Top)
At the top sits the Minister of State / Prime Minister, who provides political authority, legitimacy, and national direction — not operational control.
Directly beneath is the Deputy Prime Minister (DPM) Growth Ministries Oversight Team.
This is the critical shift: growth is treated as a system requiring continuous coordination, not as isolated ministerial programmes.
The sector representation split (60% private, 30% public/academic/planning, 10% community) signals that economic growth is led by production and markets, while government provides structure, stability, and coordination.
2. Growth Ministries Joint Council (65% of Budget)
The Growth Ministries Joint Council groups together ministries whose primary function is expanding productive capacity and future revenues. This is where 65% of the national budget is intentionally concentrated — upstream, not downstream.
These ministries are not merged.
They remain distinct in mandate, but are aligned in sequence.
The blue and green ovals show the growth pipeline:
- Economic Planning & Investment define what the economy is trying to build and where capital should flow.
- Science, Innovation & Technology and Education & Skills Development ensure capability is built before demand peaks.
- Infrastructure & Energy and Agriculture & Livestock Production convert plans into physical output.
- Industrialisation and Trade anchor scale, competitiveness, and market access.
The orange circle — Growth Ministries Pipeline with a Strong Economic Logic — is the reminder that these ministries only work if sequenced together. Acting out of order creates waste, unemployment, and fiscal pressure.
3. The Nexus (Implicit but Central)
The Nexus sits between oversight and execution, even though it is not drawn as a ministry.

It does three things only:
Translates demand (domestic, regional, export) into production pathways.
Sequences decisions across ministries so actions reinforce each other.
Prevents fragmentation — where one ministry “succeeds” while the system fails.
It does not implement, regulate, or allocate budgets.
It ensures that what is implemented makes economic sense as a whole.
4. Where Business Botswana Fits
Business Botswana (BB) sits alongside the Nexus, not above or below it.
- BB consolidates private-sector inputs, constraints, and mobilisation capacity.
- BB represents firms, producers, processors, logistics players, and markets.
- The Nexus does not speak for business; it translates business signals into system logic.
This separation protects BB’s legitimacy and prevents the Nexus from becoming politicised or captured.
5. Stabilising Ministries Joint Council (35% of Budget)
Below the growth system sits the Stabilising Ministries Joint Council, deliberately capped at 35% of the budget.
These ministries:
- Finance, Labour, Health, Justice, Environment, Defence, Local Government
do not “drive growth” directly.
They protect the system from collapse while growth compounds.
They form the regulatory and resilience layer — essential, but not dominant.
Crucially:
When growth is coherent, pressure on health, justice, and welfare systems falls over time.
This diagram prevents the classic trap of over-funding downstream repair while starving upstream production.
6. Why the Taskforces Sit Below
The grey boxes at the bottom (Export-Led Growth, STEM Talent, Climate & Energy Transition, Agri-Industrial Development) are cross-ministerial delivery vehicles.
They exist because:
- No single ministry can deliver these outcomes alone.
- They cut across growth and stabilisation functions.
- They are temporary, focused, and measurable.
What This Structure Fixes (In Plain Terms)
- It stops policy whiplash between ministries.
- It prevents health and welfare systems from absorbing economic failure.
- It aligns private capital, public spending, and skills development.
- It makes growth predictable enough to plan for — nationally and regionally.
Or, put bluntly (and honestly):
This structure is how you stop mopping the floor while the tap is still running.
Governance Workforce Transition Plan
Here is a structured 30-year governance workforce transition plan to support the shift to a value-added economy starting immediately.
| Variable | 2025 Estimate | 2055 Target |
|---|---|---|
| Population | 2.5 million | 5–8 million |
| GDP | $20 billion | $60–100 billion |
| Avg. Monthly Wage (public) | P1,600 | P20,000 |
| National Workforce | ~900,000 | 2.5–3.5 million |
| Civil Service Size | ~150,000 (est.) | ~450,000 (target) |
| Public Sector Share | ~30% | ~15% (target) |
🗺️ 2. Transition Strategy (2025–2055)
🟢 Growth Ministries (85% of economic investment)
Focus: STEM, industrialization, agro-processing, innovation, infrastructure
Years 1–5 (2025–2030)
- Set up the Office of the Deputy PM for Growth
- Build 6 Growth Sector Councils (Trade, Agro, Infrastructure, Innovation, Education, Local Gov)
- Recruit initial 1,000 Growth Oversight Staff (weighted: 60% private, 30% public, 10% community)
- Embed small 10–20-person sectoral teams into each Growth Ministry
Years 6–15 (2031–2040)
- Expand industrial zones and R&D parks; formalize cluster leadership roles
- Upscale sector-specific skill pipelines (esp. STEM)
- Build automation-based M&E units across growth sectors
- Growth Ministries employ 50–70% of the government payroll (i.e., ~300,000 staff by 2040)
Years 16–30 (2041–2055)
- Rationalize ministry overlaps (e.g., unify education sectors)
- Formalize public-private governance networks with legislated roles
- Link community councils to growth delivery structures
- By 2055: ~85% of policy effort and budget directed to Growth Ministries
🔴 Stabilizing Ministries (15% of economic investment)
Focus: Justice, defence, finance, social welfare, control functions
Years 1–5
- Establish the Office of the Deputy PM for Stabilization
- Recruit ~200 Stabilization Oversight Staff
- Begin phase-out of redundant government subsidies (gradually shift safety net to family-led responsibility)
Years 6–15
- Downsize and digitize core regulatory agencies
- Merge ministries where possible (e.g., Labour & Local Gov)
- Shift security model to an intelligence-led strategy vs. a heavy force-led manpower
Years 16–30
- Create Digital and Resilience Councils to consolidate stabilizing mandates
- Stabilizing Ministries shrink to ~15% of civil service (i.e., ~67,500 staff)
📍 3. Policy Milestones
| Milestone | Target Year |
|---|---|
| Deputy PM Offices established | 2026 |
| Growth Councils & Oversight Staff hired | 2027 |
| First Growth Ministry realignment | 2029 |
| Stabilization Ministry M&A completed | 2035 |
| 50% government services digitized | 2038 |
| Growth Ministries >70% of GDP delivery | 2042 |
| Full Governance Structure Realignment | 2050 |
🔧 4. Supporting Tools & Levers
- System Mapping & Scenario Planning Units inside each DPM Office
- National training program for Fifth Discipline tools (esp. Causal Loops & BOT graphs)
- Civil service reform unit focused on merit-based staffing & downsizing plans
- Strategic economic councils including private-sector & community reps
THE DM MODEL’S ROLE — AND ITS LESSONS
Integrating Lessons from the Development Manager (DM) Model
Why the DM Model Matters in This Conversation
No discussion on rethinking Botswana’s governance model for economic transformation would be complete without addressing the Development Manager (DM) model. This model is the government’s adopted mechanism for managing large infrastructure projects. The governance framework I propose does not manage projects directly. However, it creates the enabling conditions for all national efforts to succeed. This includes DM-managed initiatives.
This section reflects not just theoretical models but lived policy experience. The DM model offers important structural innovations that hold promise when paired with a capable oversight system. However, lessons from its implementation must now be embedded into our forward-looking national governance redesign.
What the DM Model Was Designed to Solve
The DM model was introduced to address entrenched problems in Botswana’s project delivery system, including:
- Chronic delays due to bureaucratic red tape in ministries
- Procurement irregularities or patronage benefiting insiders
- Lack of technical project design and supervision capacity
- Fragmented or inconsistent contract and risk management
- Inflated costs or mid-project scope changes without clear control
The government appointed external private firms (Development Managers) to oversee project design. They managed procurement, contract supervision, and delivery. This initiative aimed to inject technical rigour, speed, and accountability into the public infrastructure pipeline.
Where the Model Worked
✅ Streamlined execution: DMs helped remove administrative bottlenecks that previously plagued ministry-led projects.
✅ Specialised project oversight: DMs brought global project management expertise to large-scale infrastructure efforts.
✅ Reduced procedural favouritism: The separation of decision-making from ministries curtailed discretionary delays and informal influence in procurement.
✅ Clear roles and contracting systems: In theory, the model created defined performance and outcome expectations.
What Went Wrong — And Why
Despite these intentions, the implementation faced critical flaws:
🚫 Scope creep and cost overruns: An estimated 70% of variation orders originate from government ministries themselves. These orders are often late or uncoordinated.
🚫 Absence of cost caps: Without a ceiling for variation claims, costs ballooned. The estimated P56 billion total was not always linked to clearly justified or pre-approved changes.
🚫 No penalty to ministries for poor planning: Ministries that triggered overruns bore no consequences. The financial burden was absorbed centrally, shielding under-performance.
🚫 Overconcentration of power in DM firms: There was no effective oversight layer. DMs often self-regulated cost justification and delivery expectations.
🚫 Unclear accountability to the citizen: The public saw projects stall or overrun budgets. However, they had limited access to the decision trail. It was unclear who was ultimately responsible.
What Needs to Change — A Reform Path Forward
Integrating Lessons from the Development Manager (DM) Model
To make the DM model successful going forward:
Variation Cost Attribution Framework
Introduce a clear cost-sharing mechanism. Ministries that initiate variation orders or cause delays must bear a proportion of the additional cost.
These variation costs can be deducted from the ministry’s future project budgets or spread over several projects.
This deters poor planning and encourages ministries to strengthen internal scoping and contract readiness.
Cap on Government-Backed Expenditure
The government should commit to funding only up to a fixed percentage (e.g., 110%) of the original approved project estimate.
Any cost overruns beyond this must be sourced by the Development Manager through private finance. They may also use risk-sharing mechanisms. The sourcing is subject to quality and timeline guarantees.
This shifts financial discipline upstream, encouraging greater accountability in design and approvals.
Independent Variation Review Panel
A neutral panel of technical, legal, and financial experts should be established to evaluate variation requests exceeding a set threshold (e.g., 5–10% of original value).
Only variations deemed justified and necessary are approved.
This ensures transparency and arms-length evaluation of politically or administratively motivated changes.
Performance-Based Ministry Ledger
Track and publish a Performance Ledger for each ministry showing:
Number and value of variation orders triggered
Projects completed on time and within budget
Frequency and cause of delays or disputes
Ministries with repeated under-performance will face reduced future allocation ceilings. They will also be required to undergo an external technical review before launching new projects.
Separation of Technical vs. Political Roles
Ministers provide strategic policy direction. They approve capital project priorities. However, they do not intervene in contract timelines, payment certificates, or variation approvals.
This reinforces professional project management standards and shields DMs from political interference.
Integrated Planning with Governance Framework
Development Managers must be embedded within the proposed national governance framework. This is necessary to ensure coordinated planning. It will help achieve harmonized standards and pipeline alignment.
The governance system will act as the “system integrator.” It will ensure national infrastructure projects fit into economic, spatial, and trade development strategies.
Distinct Role of the National Governance Framework
The national governance framework being proposed is not a replacement or duplicate of the DM model.
Instead, it focuses on:
- Building value chain ecosystems in agriculture, industry, services, and trade
- Fostering regional integration and export readiness
- Streamlining inter-ministerial policies, standards, and investment pipelines
- Facilitating collaboration between public and private sector actors
- Creating long-term planning platforms that are stable, non-partisan, and techno-cratically grounded
Think of it this way: the DM model builds roads, hospitals, and stadiums. The governance framework builds the system. It helps a farmer or manufacturer use those roads to get to market. This support enables them to grow.
Together, both models are necessary — but for different outcomes.
Final Thought
The promise of the DM model still holds. But like any tool, it must be aligned with broader systems of responsibility, discipline, and incentives. With clearer oversight mechanisms, and strategic scaffolding from a well-structured governance framework, Botswana can build faster. It can also build better and with greater purpose.
For policymakers: What would it take to begin prototyping this structure today?
For citizens and professionals: Where do you see yourself in this structure?
🧭 Pedagogical Outline of the Blog Post
Here’s a pedagogical breakdown of how the post “When the World Speaks — Governance BW” was developed. This structure helps readers move from global pattern recognition to local systemic insight. Then it guides them to structural design and finally to proposals for reform. The post is both exploratory and instructional — ideal for a systems-thinking audience.
1. Framing the Problem (Why This Matters Globally)
- Purpose: Create a shared vantage point for the reader to see governance not as a domestic or African issue, but as a global systemic breakdown.
- Method:
- Use global patterns (collapse, corruption, fragmentation) to build urgency.
- Draw parallels between systems in the Global North and South.
- Ask: Why are even capable leaders failing?
➡️ Pedagogical device: Disrupt assumptions — show that governance failures aren’t just due to corruption or incompetence, but system design.
2. Narrowing the Lens (Botswana as a Mirror of Global Patterns)
- Purpose: Bring the macro into the micro — reveal Botswana not as an outlier but as a case-in-point of deeper structures.
- Method:
- Introduce the unemployment study and onion model.
- Use mental models and archetypes to reveal invisible forces (e.g., Growth and Underinvestment, Shifting the Burden).
- Position current ministerial silos as structurally outdated.
➡️ Pedagogical device: Use of case study and systems archetypes to reveal hidden feedback loops behind national dysfunction.
3. Reframing the Solution (What Kind of Governance Do We Actually Need?)
- Purpose: Shift the conversation from personnel and politics to architecture and system design.
- Method:
- Introduce idea of a dual-sector governance framework (public + private).
- Clarify: this is not privatization — it’s system renewal based on competence, collaboration, and continuity.
- Use structural maps (e.g., sectoral councils, deputy PMs for Growth & Stabilization).
➡️ Pedagogical device: Re-anchoring solution-thinking from ‘who governs’ to ‘how governance is structured.’
4. Integrating Practice and Policy (Lessons from the DM Model)
- Purpose: Ground the theoretical proposal in real-life policy reform experience.
- Method:
- Use the Development Manager (DM) model as a lens for learning.
- List what worked and what didn’t.
- Show how poor oversight and lack of cost control mechanisms undermined good intentions.
➡️ Pedagogical device: Case-based learning — extracting systemic design principles from policy practice.
5. Designing Systemic Guardrails (Ensuring Accountability and Learning Loops)
- Purpose: Demonstrate how reform is not just an idea — but a structure of consequences and incentives.
- Method:
- Propose Variation Cost Attribution, caps on expenditure, performance ledgers by ministry.
- Clarify that the governance structure will not replace DMs — but enable their work.
➡️ Pedagogical device: Feedback structures + counterfactual analysis — showing how systems can be held accountable without centralizing power.
6. Anchoring Vision in Identity (Inviting Botswana’s Collective Leadership)
- Purpose: Make the proposal not just strategic, but culturally and morally grounded.
- Method:
- Invite industry, civil service, and community leaders to take part.
- Highlight the role of long-standing Batswana values (e.g., consensus, consultation, respect for elders and competence).
- Reposition reform as a regenerative national journey, not a technocratic fix.
➡️ Pedagogical device: Narrative invitation + identity anchoring — moving from “what we must do” to “who we are when we do it.”
📌 Summary of Pedagogical Tools Used
| Technique | Purpose |
|---|---|
| Global pattern recognition | Establish systemic context and urgency |
| Systems archetypes (Onion model) | Reveal invisible feedback loops shaping national challenges |
| Case study (Botswana DM model) | Apply lessons from real policy practice |
| Structural mapping | Translate abstract ideas into visible governance architecture |
| Counterfactual reasoning | Ask “what if?” to highlight missed opportunities and better design |
| Accountability structures | Embed learning loops and consequences into reform proposals |
| Identity and invitation framing | Build cultural and emotional resonance for ownership of the proposal |
Would you like a visual map of this pedagogy to include in your next newsletter or blog appendix?
[END OF ARTICLE.]

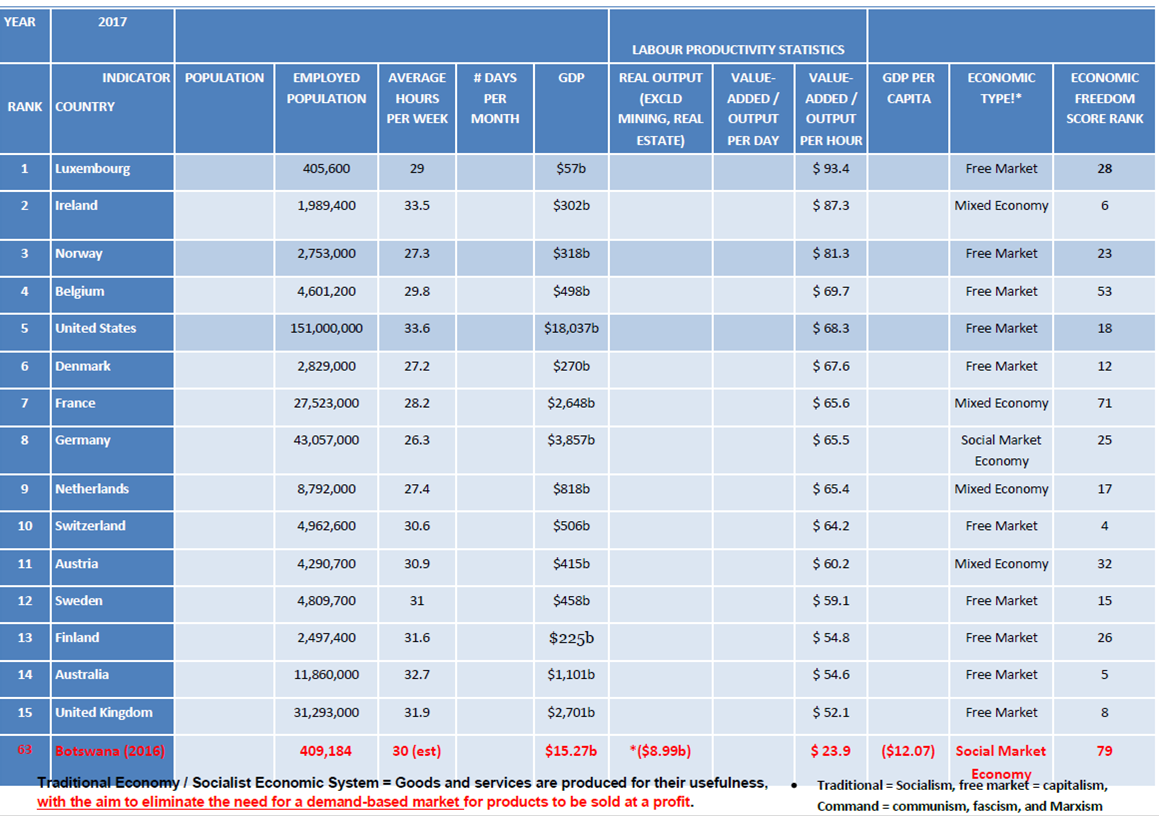


You must be logged in to post a comment.