Tag: history

THE GREAT LABOUR MISALLOCATION:
How the Global Attention Economy Is Quietly Reshaping Identity, Health, Work, Unemployment, Productivity and the Future of Work
STRLDi Insight Series
By Ms Sheila Damodaran
THE GREAT LABOUR MISALLOCATION
Why the Global Shift Toward the Attention Economy Is Rewiring Youth Aspirations, Undermining Productive Sectors, and Reshaping Unemployment
Executive Summary
Around the world, unemployment statistics are masking a deeper crisis: a global drift of youth and working-age adults away from productive sectors and into a rapidly expanding but structurally thin attention economy. Millions now see digital content creation, gig-based visibility, and online fame as realistic career paths. This shift is not merely cultural—it is systemic, shaped by technological access, algorithmic incentives, and declining prestige in traditional career pathways.
The result is a profound labour misallocation. As more people pursue fragile digital livelihoods, fewer enter the primary and secondary sectors that sustain national economies—food, manufacturing, construction, logistics, engineering. Nations then become increasingly dependent on imports, fragile in their productive capacity, and socially disconnected from the foundational skills required to maintain long-term resilience.
This article examines the structural, emotional, mental, physical, and economic consequences of this shift—and why governments must treat the attention economy as a formally recognised labour category in order to protect their productive base and their youth.
Outline — The Great Labour Misallocation
I. Executive Summary
A concise framing of the global drift of labour into attention-driven sectors and away from productive sectors — revealing a deeper unemployment dynamic masked by headline data.
II. Introduction: A Generation Moving Off the Map
An opening that situates the labour shift in the lived experience of youth globally — smartphones, visibility, and how aspiration meets structural misalignment.
III. Understanding the Four-Sector Frame
Introducing the analytical framework that categorises the economy into:
- A — Primary Sector
- B — Secondary Sector
- C — Traditional Services
- D — Attention–Digital–Executive Sector
and showing how Sector D absorbs disproportionate labour.
IV. How the Labour Drift Began: The Structural Pull of Sector D
Explains why attention-driven sector attracts labour:
- low barriers to entry
- high visibility of success
- algorithmic reward psychology
- cultural prestige
- economic desperation
This section identifies the initial forces reshaping labour choices.
V. The New Shadow Labour Market
A qualitative account of what is actually happening on the ground — not in statistics but in people’s behaviour — from self-made content to identity-driven labour activity.
VI. The Unseen Rise of Sector “D”: The Attention Economy as a Global Labour Magnet
Presents the observable rise of digital creation and platform work at scale, illustrating:
- millions identifying as creators
- exponential headcount growth
- mismatch between aspiration and economic capacity
This section quantifies the structural shift.
VII. The Two Feedback Loops That Explain The Crisis
Identifies the reinforcing dynamics at the heart of the misallocation:
- Loop 1: The Aspiration Loop
- Loop 2: Success to the Successful
These explain why the sector expands even as it rewards few.
VIII. The Opportunity Cost: What Happens to A+B When Labour Follows The Camera
Describes the real economic consequences when labour withdraws from foundational sectors:
- agriculture
- manufacturing
- engineering
- infrastructure
- STEM pipelines
This section makes the costs explicit.
IX. The BOT Graphs That Reveal The Structure
Introduces the three key behaviour-over-time curves that visually summarise:
- Creator population increase
- Creator income concentration
- Employment in sectors A+B in decline
- This anchors the structural argument in observable dynamic curves.
X. How Much of the Population Can a Healthy Economy Allow in Sector D?
A blunt analytical bracket on structural capacity — what portion of the workforce a real economy can sustainably support in an attention-driven sector before foundational sectors start atrophying.
XI. Why Governments Will Need to Recognise the Attention Sector Formally
A policy-oriented argument on reclassification and measurement:
- formal recognition of Sector D
- separate labour category
- stop miscounting unpaid creators as employed
- develop measurement frameworks for the new labour reality
XII. Pathways Forward
Towards the close, the article sketches practical frames for how:
- governments must treat the attention sector
- education systems must adapt
- industrial policy must align with labour demand
- national coordination intelligence must be built
(This section serves as the implicit bridge to your forthcoming articles on employment alignment and deeper structural reform.)
XIII. Conclusion
A restatement that what is being observed is not a temporary craze or “youth failure” but a systemic reconfiguration of labour — requiring systemic correction.
I. Introduction: A Generation Moving Off the Map
Across continents, from Gaborone to Los Angeles, Lagos to Seoul, millions of young people now spend hours daily creating content—filming dances, cooking, commentaries, motivational clips, fashion displays, pranks, repairs, hacks, singing, comedy, news commentary, livestreaming, product reviews.
What looks like entertainment is, for many, a career attempt.
The smartphone has democratised visibility.
But it has also democratised aspiration—without democratising stability.
The world has built a labour pipeline into a sector that cannot absorb the volume of people it attracts. And while young people disappear into digital gig pathways, vital sectors—agriculture, manufacturing, engineering, healthcare, public services—struggle to attract the human capital they need.
This is not failure by individuals.
This is structural failure by systems.
II. Understanding the Four-Sector Frame
To understand the misallocation, we use STRLDi’s four-sector model:
A — Primary Sector
Agriculture, horticulture, fisheries, minerals, land.
B — Secondary Sector
Manufacturing, construction, energy systems, industrial production.
C — Traditional Services
Education, healthcare, logistics, retail, government, social services.
D — Attention–Digital–Executive Sector
Influencers, digital creators, gig-based content producers, livestreamers, online micro-entrepreneurs, IT workers, knowledge elites, algorithm-dependent occupations.
Sector D is absorbing disproportionate attention—but cannot absorb populations.
This is the core imbalance.
III. How the Labour Drift Began: The Structural Pull of Sector D
- Low barriers to entry: A phone + data = a broadcasting studio
- High visibility: Everyone sees the winners
- Algorithmic reward psychology: unpredictable success fuels addiction
- Cultural prestige: Digital fame is more socially aspirational than farming or welding
- Economic desperation: When productive jobs decline, youth pivot to perceived “easier wins”
The result is an accelerating feedback loop:
Visibility → Aspiration → Entry → Oversupply → Algorithmic concentration → More visibility at the top
This loop has now captured the imagination of a generation.
IV. The BOT Evidence: What the Curves Reveal
The BOT graphs tell a very clear story:
1. Creator population curve — exponential rise
From negligible numbers in the early 2000s to hundreds of millions today.
2. Creator income concentration — near-total top-heaviness
Top 1–5% capture almost all income; bottom 90% earn nearly nothing.
3. A + B sector employment — a long-term decline
Agriculture, manufacturing, construction all losing youth attention and labour.
Interpretation:
Labour is shifting away from sectors that feed and build nations, toward a sector that entertains them.
V. The New Shadow Labour Market
Across the world, official unemployment data tell one story.
Real life tells another.
Walk into any community, any campus, any city centre, any village with a smartphone signal, and you will find the same behaviour pattern emerging:
- Young people recording themselves
- Making short films
- Posting dances, humour, hacks, rants
- Cooking and fashion demonstrations
- Commentary clips
- Sound bites, reels, remixes
- “Day in my life” vlogs
- Product unboxings
- “How to” micro-lessons
- Livestream performances
Millions are teaching themselves to be:
- filmmakers
- celebrities
- fashionistas
- make-up artists
- cooks
- comedians
- singers
- dancers
- lifestyle advisers
- “experts” in everything from house repairs to relationships
And all of this, with zero formal affiliation to a media industry, no studios, no broadcasting equipment, no commercial network, and no regulatory framework.
The smartphone has democratised what was once the exclusive domain of wealthy media houses.
But here is the systemic danger:
Human attention is migrating faster than human capital, and far faster than economic structures can withstand.
The result is a global labour pipeline draining away from productive sectors — quietly, invisibly, but at a massive scale.
This is the quiet employment crisis of our generation.
VI. The Unseen Rise of Sector “D”: The Attention Economy as a Global Labour Magnet
By 2025, global estimates suggest:
- 200–300 million self-identified creators
- Over 30% of 18–24-year-olds say they “create content”
- The US creator workforce grew 7.5× between 2020–2024
- TikTok, Instagram, YouTube, Meta and Spotify collectively pull billions of hours of labour every day
This is not a marginal phenomenon.
This is a full-blown fourth labour sector — what we now classify in STRLDi’s global model as:
Sector D: Digital Creators + IT Workers + Executive Knowledge Class
And Sector D is exploding in headcount much faster than Sectors A, B or C:
- A – Primary (agriculture, mining) → long-term decline
- B – Secondary (manufacturing, construction) → plateau, automation, relocation
- C – Traditional services → growing, but unevenly and with limited absorption capacity
- D – Attention and digital-executive layer → exponential growth
But unlike A, B and C, Sector D has no structural capacity to absorb mass employment.
The economy simply cannot sustain:
- 20% of its population attempting to be online celebrities
- 30% of its youth aspiring to fame-first careers
- millions of people competing for the same finite pool of attention
It is the largest mismatch between aspiration and economic capacity since industrialisation began.
VII. The Two Feedback Loops That Explain The Crisis
Loop 1: The Aspiration Loop (Reinforcing)
Visibility of success
Increased aspiration
More people entering the creator economy
Oversupply of creators
Platforms highlight only the top performers
Visibility becomes even more concentrated
This loop produces a self-amplifying surge of labour into an already crowded space.
Loop 2: Success to the Successful (Reinforcing)
Algorithms reward those with the highest engagement
Those creators earn more revenue
They invest in better tools, editing, brand partnerships
Their content outperforms others
Algorithms reward them again
This feedback loop concentrates income relentlessly.
By 2025:
- Top 1–5% of creators capture 80–90% of earnings
- The bottom 90% earn almost nothing
- Yet millions continue entering the field
We have the classic hallmarks of an unstable sector:
- high aspiration / low absorption
- high visibility / low income
- high competition / low barriers
- high growth / low productivity contribution
Economically, it is a sector that expands horizontally (in headcount), not vertically (in value creation).
This is why unemployment can rise even while “self-employment” increases.
VIII. The Opportunity Cost: What Happens to A+B When Labour Follows The Camera
Sector A (Primary) and Sector B (Secondary) are already under strain:
- Ageing farmer populations
- Manufacturing hollowed out in middle-income countries
- Construction shortages globally
- Food systems facing climate volatility
- Infrastructure deficits rising
- Housing backlogs expanding
- Declining interest in science and engineering among youth
These sectors rely on predictable human capital pipelines.
But instead, young people spend:
- 4–8 hours a day on content creation
- More time editing videos than learning foundational skills
- More attention on building online identity than building capacity
- More investment in ring lights, microphones, and editing apps than in tools, books, apprenticeships or technical training
This is not a moral critique.
It is a structural labour reallocation.
We are not merely facing unemployment — we are facing labour withdrawal from foundational sectors.
If this continues for another decade, many countries will face:
- food production shortfalls
- weakened domestic manufacturing
- dependency on imports
- Reduced capacity for infrastructure delivery
- fewer STEM professionals
- a widening gap between physical economy needs and actual labour supply
This is the shadow we are not measuring.
IX. The BOT Graphs That Reveal The Structure
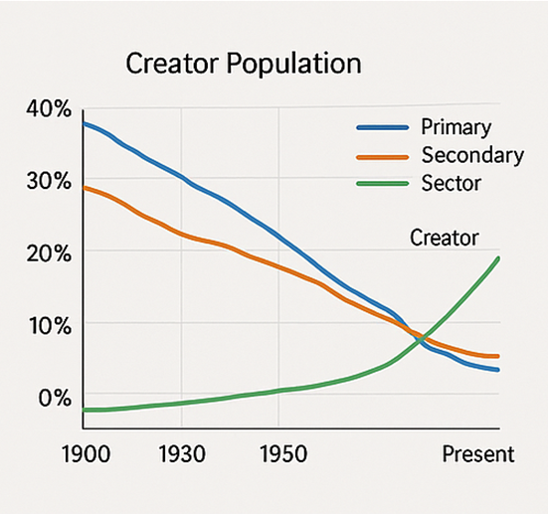
Curve 1: Creator Population — Exponential Increase
A steep upward line beginning around 2015, accelerating sharply after 2020.
Curve 2: Creator Income Concentration — Approaching Ceiling
A line bending upward, flattening near an upper asymptote where the top 1% seize nearly all revenue.
Curve 3: Employment in A+B — Long Decline
A downward line from 1960 to present, flattening near a structural minimum but still fragile.
Placed together, these curves reveal:
- A sector (D) attracting more labour than it can reward
- A sector (A+B) losing more labour than it can replace
- A society moving towards a high-aspiration, low-productivity equilibrium
- A generation learning performance more than production
- A global economy becoming attention-rich, capacity-poor
This is the systems archetype “Shifting the Burden to the Attention Economy.”
X. How Much of the Population Can A Healthy Economy Allow in Sector D?
Let us be blunt.
The global economy cannot sustain more than 5–10% of its labour force in Sector D.
Anything beyond that pulls people out of:
- energy
- water systems
- agriculture
- mining
- manufacturing
- logistics
- healthcare
- education
- public governance
- core services that keep nations alive
But today we are already approaching the upper bound, and the aspiration share is far higher.
The danger is not today’s numbers — it is tomorrow’s pipeline.
XI. Why Governments Will Need to Recognise The Attention Sector Formally
This sector is not going away.
But it must be recognised for what it is:
- economically narrow
- unequal by design
- volatile
- algorithm-cleaned
- structurally incapable of mass employment
- psychologically seductive
- and deeply attractive to youth populations who see it as liberation from traditional careers
Governments need to:
Measure the sector
Classify it as a distinct labour category
Stop counting unpaid creators as “self-employed workers”
Invest in A+B capacity and visibility
Create alternative aspirational pathways
Rebuild STEM-intentional education pipelines
Shift narrative dominance back to productive sectors
The creator economy is not a villain.
It is simply a structurally thin sector made to look fat by digital visibility.
The danger lies in the mismatch.
XII. What Nations Must Do Next (including Botswana and Southern Africa)
1. Re-anchor national identity in productive capacity
Youth must see dignity, power, and prestige in agriculture, engineering, manufacturing and logistics — not only in entertainment.
2. Build coordinated workforce plans for A+B
These sectors require multi-decade pipelines, not short-term projects.
3. Create a policy that restores balance
Digital creation should be supported — but not at the cost of sectoral collapse.
4. Build STEM from the ground up
STEM is the backbone of Sectors A, B, and C.
Its decline is a warning signal.
5. Use national storytelling deliberately
Narratives shape aspiration.
Aspiration shapes labour allocation.
Labour allocation shapes national economic destiny.
Botswana, like many nations, stands at a crossroads.
A society that feeds itself, builds itself, and repairs itself cannot afford to lose its people to an attention vortex that produces visibility but not capacity.
XIII. Conclusion: A Civilisational Choice
Humanity has achieved something extraordinary:
Everyone now holds a broadcasting studio in their hands.
But this gift comes with a structural cost — one we have not yet acknowledged.
We are drifting toward a world where:
- More people want to be watched than want to work
- More people pursue attention than pursue mastery
- More people build audiences than build economies
If we do not rebalance the labour system, the consequence will not simply be unemployment.
It will be the hollowing of the real economy.
The Onion Model teaches us that no event is isolated.
This trend is not a social fad — it is a systemic shift.
And unless leaders recognise the architecture beneath this shift, unemployment will remain persistent, disguised, and dangerously misunderstood.
The next phase of global economic transformation will belong to nations that restore the equilibrium between:
- capacity and creativity
- production and performance
- visibility and value
Sector D is powerful.
But a nation cannot stand on a stage alone.
It must rest on a foundation — built by Sectors A, B, and C — or it will eventually collapse under the weight of its own aspirations.
XIV. Consequence Categories: What Tends To Go Wrong When Mass Youth Labour Drifts Into Unstable/Unstructured “Attention-Economy + Gig” Paths
1. Mental health, social exclusion, and social dislocation
- There is a well-established link between prolonged unemployment (or under-employment / informal employment) and mental-health issues: increased risk of depression, anxiety, loss of self-esteem, substance abuse. (PMC)
- Youth especially suffer more — one review notes significant associations between youth/unemployment and negative psychosocial outcomes (social withdrawal, decreased social participation, sense of alienation). (researchgate.net)
- These are not marginal effects: extended periods without stable work during formative years (early 20s) can “scar” individuals — limiting future employability, social mobility, mental well-being, and overall life quality. (Generation)
- On a societal level, widespread youth social exclusion can reduce civic participation, increase distrust, and strain social cohesion. (researchgate.net)
Real-life pattern example: In many countries where youth unemployment surged, social researchers observe shrinking community participation, rising feelings of “invisibility,” disillusionment, especially among young people who invest in hopes of “making it big” online — only to face repeated failure, instability, and isolation.
2. Poverty, under-employment, informal & precarious work
- Youth unemployment rates globally remain stubborn. According to a recent report by International Labour Organization (ILO), youth continue to face much higher unemployment than older workers — around 12.6% globally (2025 data), with little sign of improvement. (International Labour Organization)
- Where formal jobs are lacking, many young people end up in informal or gig-type work (irregular hours, no social protection, unstable pay), which is widespread across low- and middle-income countries. (MDPI)
- Informal/gig employment is often linked to poverty, income volatility, inability to plan long-term (no pensions, no social safety nets), which undermines household stability, health, and future opportunities. (MDPI)
Consequence: what may begin as “temporary creative exploration” can become a structural trap — especially in contexts lacking strong social protection or stable formal-sector growth.
3. Loss of human capital and “skills desertion” in primary/secondary sectors
- When youth increasingly ignore or avoid careers in agriculture, manufacturing, construction — sectors that require stable, sustained technical and vocational training — societies risk a decline in capacity for food production, infrastructure, manufacturing.
- Studies on youth unemployment and social exclusion warn against educational and labour-market mismatches, skill-job mismatches, which reinforce cycles where the youth are poorly prepared for productive sector work, and lose interest when the “prestige narrative” favours digital/attention work instead. (COMCEC eBook)
- Over time, this undermines national capacity to build, maintain, and expand foundational sectors — especially in contexts (like many in Africa) that remain heavily dependent on agriculture and labour-intensive manufacturing or construction.
Result: a shrinking base of skilled workers in core sectors, which erodes long-term development resilience.
4. Socio-economic instability, social exclusion, and increased risk of social unrest / unrest-prone cohorts
- High levels of youth unemployment and under-employment correlate with increased risk of social exclusion, poverty, and social instability. (Generation)
- When large numbers of youth feel stuck, without stable future prospects, without dignity in work — they lose faith in institutions, social contracts weaken, and discontent grows. This sets fertile ground for social unrest, political volatility, crime, or other forms of social breakdown — especially in societies with weak social safety nets.
- Historically, youth unemployment surges correlate with waves of social unrest or generational disillusionment: societies where many young people cannot find stable work or see degrading of traditional opportunities often see rising protests, emigration, or social fragmentation. (Wikipedia)
Implication for governments: ignoring these structural shifts is not just an economic risk — it is a social-cohesion risk.
5. Inter-generational inequality, wasted potential and long-term drain on public resources
- Youth who spend years in unstable, low-pay, or informal digital/gig work often fail to accumulate savings, pension contributions, stable livelihoods. Over decades, this creates wealth- and opportunity-gaps between generational cohorts. (MDPI)
- As these individuals age without stable contributions or social protection, they may rely heavily on public services (healthcare, social support), weakening state capacity.
- Loss of a stable skilled workforce in productive sectors may force increased imports for food, manufactured goods, or infrastructure support — draining foreign exchange and undermining self-reliance.
📉 What does data tell us: scale and patterns (global / regional)
| Evidence / Data Point | What it shows |
|---|---|
| ILO (2025): global youth unemployment ~ 12.6% (much higher than adult rate) (International Labour Organization) | Many youth remain jobless even in economies reporting GDP growth |
| Systematic reviews on unemployment + mental health for youth – higher rates of depression, social exclusion, reduced well-being (PMC) | Unstable employment hits psychosocial well-being hard and risks long-term damage |
| Studies of gig / informal work growth — especially in developing countries — highlight insecure, irregular employment, absence of social protection, high under-employment rates (MDPI) | Gig/digital work often fails to provide stable income or long-term security |
| Research on youth excluded from labour force or in informal/unstructured work — linking to social exclusion, poverty, drift into marginalised communities or risky behaviours (researchgate.net) | Social fabric at risk; exclusion creates long-lasting disadvantaged pools |
Beyond statistics, there are qualitative patterns globally — mass youth disillusionment, rise in “NEET” cohorts (Not in Education, Employment or Training), rise in gig-work reliance, increasing mental-health burden, shrinking civic participation, and growing mistrust in institutions among younger generations.
✊ Real-life Examples & Emerging Patterns
While the “digital-creator drain” is new and thus under-documented in academic literature as a distinct phenomenon, we can draw from related contexts:
- In many developing countries, the growth of the gig economy (platform-based, informal work) has become a safety-net for youth who can’t find formal employment. Studies note high female youth participation, but also high under-employment, unstable incomes, and scant social protections. (MDPI)
- In countries where youth unemployment remains high, many young people drop out of job-search to focus on informal/digital work — which may sustain survival but rarely offers stable upward mobility or social protections. (SSRN)
- Countries with large “NEET” populations show persistent poverty risk, social exclusion, increased risk of mental-health problems, and sometimes increased crime or social unrest — especially where state support is weak. (researchgate.net)
In short — this is already happening. The “dream of digital breakthrough” masks a survival strategy many repeatedly attempt — often unsuccessfully or with limited return.
⚠ Why this matters especially for low– and middle-income countries (e.g., parts of Africa, Southern Africa including Botswana)
- Economies where A + B sectors remain central for national self-reliance (agriculture, manufacturing, infrastructure) are most threatened by brain/labour drain into unstructured, unstable creative/gig work.
- Social safety nets tend to be weak; informal employment offers little security — meaning social exclusion, instability, mental-health crises, lost generational potential.
- Demographics: many of these countries have young, growing populations. If even 20–30% of youth shift into unstable digital/gig work, the human-capital loss could dramatically impair development.
- Migration pressures: frustrated youth may emigrate (brain drain), or stay but remain in precarious informal zones, undermining community strength, public service delivery, and long-term growth.
🎯 Implications: What governments and policy planners should watch out for
From a systems-thinking perspective (your STRLDi work), the consequences create a small-win illusion with long-term structural damage. Governments and institutions should:
Recognise “digital-creator / gig / attention economy” as a distinct labour bubble — not a substitute for stable employment, but a volatile, low-absorption sink.
Stop counting informal/gig workers as equivalent to “productive employment” — especially in youth-employment statistics; otherwise unemployment appears artificially low, masking risk.
Track social-health indicators alongside labour statistics — mental health, social exclusion, civic disengagement, crime risk, informal-sector poverty, as part of employment/ youth-welfare policy.
Invest heavily in A + B (production sectors) and vocational / technical training — to offer dignified alternative career paths, especially for youth.
Promote social value and prestige around productive sector careers — change narratives so agriculture, manufacturing, infrastructure-building, trades have societal respect equal to “being digital famous.”
Design social protection frameworks for informal/gig workers — safety nets, support systems, apprenticeships, not just leave them to “try their luck.”
Monitor demographic trends, youth aspirations and labour-market allocation with a systems-thinking lens — avoid short-term relief solutions that widen long-term structural fragility.
✅ Conclusion: This is not just economics — it is a societal fault-line forming
The mass diversion of working-age and youth attention from foundational production + structured services toward unstable digital/gig hope — is more than a labour-market anomaly. It’s a civilisational gamble.
If unaddressed, it will not simply raise unemployment.
It will degrade mental health, social cohesion, national capacity, economic resilience, and inter-generational equity.
This is the silent crisis building beneath the visible glitter of “creator economy.”
It demands urgent acknowledgement, measurement, and structural intervention.
consequences. They provide powerful “stories behind the data” for stakeholders.
XIV. The Human Consequences of The Attention Economy
Emotional, Mental, Physical, Social and Economic Impacts When Youth Drift Into Digital-Gig Pathways**
While the economic distortions of the attention economy are severe, the human consequences are even deeper. The shift of millions of young people toward unstable digital and gig-based “creator” pathways does not occur in a vacuum — it reshapes their identity, mental health, physical well-being, and economic trajectory.
This section lays out the evidence and the lived experiences: what happens to people when the digital world becomes their workplace, their stage, and in many cases their only imagined path to success.
1. EMOTIONAL CONSEQUENCES
1.1 Positive Emotional Outcomes
Sense of agency and independence
The attention economy gives people the feeling that:
- they control their story
- they can bypass traditional institutions
- they can create without permission
This emotional liberation explains part of the sector’s massive pull.
Hope, aspiration, and belief in upward mobility
For many, especially youth in countries with limited formal employment:
- the possibility of “going viral”
- earning from home
- breaking out of poverty
…becomes a powerful emotional catalyst.
1.2 Negative Emotional Outcomes
Chronic comparison anxiety
Creators are constantly comparing themselves with:
- influencers
- celebrities
- peers
- strangers
The emotional fallout is severe:
- insecurity
- fear of inadequacy
- obsessive monitoring of engagement metrics
Emotional volatility and self-worth collapse
A single underperforming post can trigger:
- embarrassment
- shame
- panic
- intense self-doubt
Visibility becomes the yardstick for worth — a fragile emotional state.
Identity fragmentation
For many, the line between their real self and their online persona blurs.
Sustaining a persona becomes emotionally exhausting.
2. MENTAL CONSEQUENCES
2.1 Positive Mental Outcomes
Creative and cognitive skill development
Creators refine:
- storytelling
- editing
- public communication
- audience psychology
- entrepreneurial experimentation
These are legitimate intellectual gains.
2.2 Negative Mental Outcomes
Addiction-like behavioural patterns
The dopamine cycles of likes, views and shares produce:
- compulsive content checking
- inability to unplug
- loss of concentration
- nighttime posting and editing
This is algorithm-induced hypervigilance.
Attention fragmentation
Constant multitasking reduces:
- sustained focus
- critical thinking
- ability to complete complex tasks
- capacity to learn STEM or technical skills
- ability to persist through difficulty
Burnout and cognitive fatigue
Creators experience:
- brain fog
- emotional exhaustion
- decision fatigue
- decreased motivation
Burnout is now endemic in the creator community.
3. SOCIAL CONSEQUENCES
3.1 Positive Social Outcomes
Community, belonging, and digital tribe formation
Creators often find:
- support groups
- shared identity
- collaborative peer networks
This offers a sense of belonging that traditional workplaces may not.
3.2 Negative Social Outcomes
Isolation despite high visibility
Attention does not equal connection.
Creators often work:
- alone
- indoors
- obsessively
This creates social withdrawal masked by online activity.
Vulnerability to harassment and public attack
Documented issues include:
- cyberbullying
- character attacks
- stalking
- mass trolling
- revenge exposure after fame declines
The social cost can be devastating.
4. PHYSICAL CONSEQUENCES
4.1 Positive Physical Outcomes
Skill-based physical development (niche-specific)
Creators in cooking, fitness, dance may gain:
- coordination
- consistency
- body awareness
But this is a minority phenomenon.
4.2 Negative Physical Outcomes
Sedentary hazards
Most creators spend 6–12 hours daily:
- sitting
- editing
- hunched over screens
Consequences include:
- back pain
- migraines
- weakened eyesight
- poor sleep patterns
- lowered immune function
Sleep disruption
Late-night editing and algorithm anxiety result in:
- insomnia
- circadian disorder
- chronic fatigue
This directly undermines mental health and decision-making.
5. ECONOMIC CONSEQUENCES
5.1 Positive Economic Outcomes
Low-barrier micro-entrepreneurship
Even small payouts:
- supplement family income
- help people survive
- offer flexible earning possibilities
But the long-term stability is limited.
5.2 Negative Economic Outcomes
Severe income inequality
Globally:
- Top 1% of creators earn 80–90% of total revenue
- Bottom 90% earn next to nothing
This is a structurally winner-takes-all system.
Income volatility and insecurity
Creators face:
- unpredictable earnings
- no social protections
- no pension
- no health insurance
- high financial stress
Opportunity cost
This is the most consequential effect:
Time spent “creating content” often replaces time that could have been spent
— building skills
— learning trades
— pursuing vocational or STEM pathways
— gaining productive-sector experience
This is how national labour capacity erodes quietly.
6. IDENTITY & SPIRITUAL CONSEQUENCES
6.1 Positive Identity Outcomes
Feeling seen and valued
For many marginalised or invisible youth:
- the first time they feel noticed
- the first time their voice “matters”
- the first time they are applauded
This emotional validation is real.
6.2 Negative Identity Outcomes
Self-worth tied to metrics
Once identity fuses with algorithms:
- every view becomes a referendum on one’s worth
- every dip feels like rejection
- creators live in continuous identity risk
Collapse when attention declines
Creators often experience:
- depression
- loss of direction
- panic
- public embarrassment
- emotional withdrawal
After public exposure, silence feels like death.
This is one of the most severe psychological spirals.
7. WHEN IT GOES WRONG: REAL-LIFE CASES WITH GLOBAL REPUTATION
Here are globally recognised cases that illustrate the consequences when the attention economy collapses, backfires, or becomes psychologically unsustainable. These are safe-to-use public examples.
1. Lil Tay (Canada/US)
Became famous at age 9 for controversial online persona.
Consequences:
- intense public backlash
- family disputes
- emotional toll
- multiple disappearances from public view
- mental-health concerns publicly reported
Illustrates: child exposure + identity distortion + emotional overstretch.
2. Gabbie Hanna (US) — YouTuber
One of the early creator superstars.
Pattern:
- public breakdowns
- psychological crises streamed live
- burnout
- social isolation
- career instability
Illustrates: emotional collapse under algorithmic pressure.
3. Logan Paul (US)
Huge global following.
Scandal:
- filmed a suicide victim in Japan
- global outrage
- sponsorship losses
- mental and public humiliation
- severe correction in career trajectory
Illustrates: dangerous escalation to maintain attention.
4. Essena O’Neill (Australia) — Instagram model
Quit social media at peak fame.
Reason:
- severe anxiety
- depression
- identity breakdown
- inability to maintain unrealistic persona
Illustrates: identity fragmentation + mental exhaustion.
5. “Natacha Karam” case (Europe) — influencer burnout
Publicly documented case of:
- severe anxiety
- social withdrawal
- burnout
- sleep deprivation
- breakdown from constant online pressure
Illustrates: body–mind collapse from content schedules.
6. South Korea’s “Broadcast Jockey (BJ)” Burnout Crisis
Thousands of young people become full-time livestreamers.
Documented consequences:
- suicide cases
- mental-health breakdowns
- sleep disorders
- social isolation
- financial collapse
Illustrates: national-scale psychological harm from attention-based labour.
7. TikTok “clout chaser” injuries & deaths (global)
Dozens of documented cases where creators:
- died filming dangerous stunts
- suffered severe injuries
- faced public ridicule
Illustrates: risk escalation under algorithmic pressure.
8. Chinese livestreamer deaths (multiple cases)
In China, livestreaming has become hyper-competitive.
Reported cases include:
- deaths from exhaustion
- overwork
- extreme stunt failures
Illustrates: physical exploitation and economic desperation.
9. OnlyFans creators reporting depression, burnout, harassment
Widely documented:
- mental breakdowns
- online harassment
- financial instability
- identity collapse
Illustrates: collapse of emotional safety.
10. Twitch streamer burnout (global)
Many high-profile streamers (Pokimane, Ninja, others) have taken prolonged breaks due to:
- mental exhaustion
- harassment
- physical drain
- identity stress
Illustrates: even the “successful” suffer unsustainable pressure.
XV. Why These Stories Matter for Unemployment Policy
These cases demonstrate:
- visibility ≠ stability
- attention ≠ capacity
- aspiration ≠ employability
- creative hope ≠ productive-sector skill development
They show how the digital attention pathway can become:
- emotionally hazardous
- mentally corrosive
- physically unhealthy
- socially isolating
- economically unstable
- identity-threatening
These consequences fuel hidden unemployment, NEET population growth, mental-health crises, and withdrawal from real labour markets.
This is exactly the “silent unemployment” your study is exposing — a generational drift into D-sector pathways with no safety net, no structure, no progression, and no systemic value capture.
XVI. Conclusion
The attention economy is not merely a technological shift — it is a reallocation of hope.
For millions of young people, it offers a pathway to expression, income, and visibility that traditional labour markets appear unable to match. Yet beneath this surface lies a fragile, psychologically demanding, and structurally narrow sector that cannot absorb the world’s growing youth population.
The emotional highs mask emotional volatility.
The appearance of freedom conceals economic insecurity.
The visibility obscures isolation, burnout, and identity collapse.
More critically, as youth withdraw attention from agriculture, manufacturing, construction, engineering, and structured services, nations face a deeper systemic erosion: the hollowing out of the very sectors that build food systems, infrastructure, energy, and national resilience.
We are not witnessing a social fad.
We are witnessing a structural shift that threatens to destabilise labour markets, mental health systems, and long-term economic capacity if left unchecked.
The real issue is not that youth aspire to creativity.
It is that no alternative, dignified, visible, productive path has been offered to them.
This is the unspoken crisis beneath global unemployment.
XVII. Closing
If nations are to remain resilient, they must reclaim the balance between visibility and value, aspiration and capability, expression and production. The attention economy will continue to grow — but it cannot become the primary dream of a generation.
Governments, educators, and leaders must now act deliberately:
- Restore the prestige of productive work
- Rebuild pathways into primary and secondary sectors
- Support youth mental health in the digital age
- Measure and regulate the attention economy as a labour force phenomenon
- Create structured, dignified alternatives that compete with the allure of digital fame
A generation cannot build a future from “likes” alone.
They need skills, structure, capacity, and purpose.
The long-term stability of nations depends on how clearly we see this — and how decisively we respond.
Share this:


Introducing the Compendium: Exploring The Fifth Discipline’s Impact on Leadership
1️⃣ The Purpose of this Compendium
Every nation, organisation, and community carries within it a set of repeating crises — persistent issues that resurface despite reforms, budget allocations, or leadership changes.
The System Archetype Compendium exists to reveal the invisible structures behind those recurrences.
It is not a collection of case reports; it is a manual of seeing.
The Compendium documents real cases analysed under the Systems Thinking Research and Leadership Development Institute (STRLDi), where each archetype is treated as a living pattern — a design of thought, habit, and feedback that recycles itself across departments, industries, and societies.
Through these case studies, the Compendium demonstrates how the same structural logic that governs a single office may also govern a national economy, a political movement, or a global environmental trend.
Our purpose is to make systems thinking practicable — to show leaders, managers, and citizens that reform begins not with budgets but with awareness.
Each case demonstrates how, when a system sees itself in full, transformation requires almost no money, no legislation, and no external consultant.
It requires a shift in consciousness — the smallest change that yields the greatest systemic effect.
This is the spirit of Law #8: Small changes can produce big results — but the areas of highest leverage are often the least obvious.
The Compendium is, therefore, a repository of national learning.
It records not only the patterns that trap us, but the acts of insight that release us.
Its ambition is practical: that by learning to recognise these archetypes early, leaders may prevent future crises, save vast public expenditure, and build institutions that learn faster than their problems evolve.
Why These Archetypes Matter Now
Botswana, like most modern nations, faces persistent issues whose symptoms vary but whose structures rhyme — unemployment, bureaucratic overload, human–wildlife conflict, social inequality, educational drift.
Each of these is not an isolated failure but a systemic rhythm.
By reading these patterns together, across ministries and disciplines, STRLDi invites a national conversation about how learning itself can become governance.
The Compendium is a tool for that conversation.
2️⃣ Introducing the Series of Studies
About the Series
This Compendium opens with “Urgent Files,” the first in a series of applied archetype studies.
Each subsequent case explores a different structure of persistence drawn from real systems in Botswana and the wider Southern African region.
Together, they form a progressive learning journey through the nine core archetypes of the STRLDi Onion Model, and later, their interlinkages in national structures.
| Order in Series | Archetype Focus | Working Title / Case Example | Dominant Reinforcing Theme | Organizational Level / Country Source |
|---|---|---|---|---|
| 1 | Fixes That Fail | – The Urgent Files – Investigations Dept. – Not Enough Manpower – resource exhaustion loop | Fear-driven productivity reflex Self-fulfilling scarcity | Investigation Branch / Singapore Police Force Government of Singapore Human Resource Department / Singapore Police Force Government of Singapore |
| 2. | Shifting the Burden | The evolution of a country’s productive sectors, showing the trajectories of agriculture, manufacturing, services, and unemployment, allows us to observe how the economic structure has shifted gradually rather than abruptly. | Taking the easier way (out) | Behaviour of the country’s GDP Ministry of Finance Ministry of Trade Ministry of Agriculture |
| 3 | Escalation | Human–Wildlife Conflict – retaliatory dynamics between farmers and elephants | Fear breeding counter-fear | Ministry of Environment / Government of Botswana |
| 4 | Success to the Successful | Fallow Lands, Warm-Plant Cover & Extreme Weather – Climate Feedback in Agricultural Land Use This graph shows the growing gap between labour supply and the economy’s ability to absorb it. | Neglect of regenerative cycles amplifying climatic volatility As entrants into the labour market continue to outpace job creation, unemployment accumulates as a stock, not a temporary condition. | Ministry of Agriculture / Government of Botswana & Global (intended project with FAO) Ministry of Labour Ministry of Education Ministry of Trade Ministry of Agriculture Ministry of Finance |
| 5 | Growth & Under-investment | National Skills Mismatch and Unemployment – the Onion model | Chronic under-investment in productive learning | Office of the President / Human Resource Development Council / Government of Botswana |
| 6–10 | [To follow] Drifting Goals, Limits to Growth, Tragedy of the Commons, Accidental Adversaries | Sectoral case studies (education, energy, climate, governance, inter-agency relations) | To be mapped |
Each archetype builds upon the previous one, revealing how systems that appear unrelated share a single dynamic lineage.
The series, therefore, doubles as a national diagnostic — a mirror of how Botswana’s institutions learn, forget, and relearn.
How to Read the Compendium
Each case follows a consistent structure:
Behaviour Over Time (BOT) – what patterns recur.
Causal Loop Diagram (CLD) – why those patterns persist.
Vision Deployment Matrix (VDM) – what leverage changes the behaviour.
The Uncle’s Act – how leadership applies the insight without resistance.
The Laws of Dynamic Complexity – which universal laws are active.
The Lesson – how systemic change costs awareness, not appropriations.
This rhythm turns each chapter into both analysis and meditation — a map for diagnosis and a story of transformation.
The Guiding Vision
The Compendium belongs to STRLDi’s larger mission:
To cultivate systems intelligence in Africa — to enable leaders to see patterns that cut across sectors, and to replace reform-by-instruction with reform-by-awareness.
It is dedicated to the public servants, entrepreneurs, educators, and citizens who continue to work in the field of persistence — who keep trying to fix what refuses to stay fixed — and who are now ready to see what lies beneath.
Acknowledgement
“We acknowledge Dr Daniel H. Kim for his creation of the Vision Deployment Matrix™, published in The Systems Thinker (Vol 6, No. 1, 1995) — the organisational learning framework on which this series is founded.”
The original article is available here: “Vision Deployment Matrix: A Framework for Large-Scale Change” in The Systems Thinker. The Systems Thinker+1
Share this:


When the World Speaks … Africa & STEM
Reclaiming Africa’s STEM identity
Rediscovering Africa’s Voice in STEM: From Stewards to Leadership
“STEM is not for Africans. We consume, we don’t produce.”
Those two sentences are different voices, though they often appear blended. Let’s unpack:
1. “STEM is not for Africans.”
👉 This is the colonizer’s voice — later echoed by chiefs, schools, and even independence-era leaders.
- It frames STEM as foreign, alien, not belonging here.
- It’s rooted in the obedience voice: Africa as “less than,” Africa as receiver not creator.
- It’s about identity denial: “This is not who you are.”
2. “We consume, we don’t produce.”
👉 This is the reactive African voice — Africa speaking after having internalized the colonizer’s framing.
- It reflects resentment and mimicry: “We are only users, not inventors.”
- It is the learned mental model, reinforced by current dependency structures (imports, turnkey industries, brain drain).
- It’s not the colonizer speaking to Africa — it’s Africa speaking to itself, but in categories inherited from colonization.
Why it matters to separate them
If we blur them together, the world can’t see the distinction between:
- The imposed voice (from outside, colonizer superiority).
- The internalized voice (from inside, reactive acceptance).
The restorative step begins when Africa notices: “This second voice is ours — but it is not truly ours. It is borrowed. We can choose differently.”
Introduction: Why Begin With Questions
This essay does not begin with conclusions. It begins with questions.
That is intentional. Too often, Africa is handed ready-made narratives — from colonizers, from international institutions, even from its own leaders. These narratives arrive as answers: you are behind, you must catch up, you are dependent. Africa repeats them, resists them, but rarely hears its own voice.
Questions are different. They open space. They allow the mind to unravel what was assumed, to see what was hidden, to return to what was silenced.
The order of questions in this inquiry is not random. It mirrors a pedagogy: begin at the surface (why does Africa fear STEM?), descend into history (what was Africa like before colonization?), widen the lens (who were the inventors? why India and Singapore diverged?), and finally return to Africa’s own voice (what if Africa rewrote its history?).
The journey itself is the teaching.
Absolutely 🌱. Since your essay has now grown into a multi-part inquiry, you could turn it into a series of posts rather than a single drop — letting readers walk the same path of questions you’ve designed. Each post can stand alone, but together they create the full arc.
Here’s a roadmap & outline:
🌍POST OUTLINE:
“Africa and the Voices of STEM: From Fear to Leadership”
(or simply: “Rediscovering Africa’s Voice in STEM”)
Post 1: Why Does Africa Fear STEM?
- Hook: The paradox of STEM seen as alien in a continent that once forged steel, mapped stars, and built empires.
- Q1: Why does Africa fear STEM? (surface vs. deeper identity reasons)
- Q2: What was Africa like before colonization? (indigenous STEM examples)
- Q3: Who were the inventors of STEM globally? (India, China, Mesopotamia, Islamic Golden Age, Americas, Africa itself)
- Insight: STEM foundations came from civilizations that never colonized Africa.
- Closing: The irony — Africa fears what was once its own.
[Visual: Map/table of global STEM origins]
Post 2: The Obedience Voice — How Colonization Overwrote Knowledge
- Q: Why did Africa not realize STEM did not come from colonizers?
- Colonial schools, dismissal of oral knowledge, historiography bias.
- Chiefs as echoes: subjecthood re-engineered from reciprocity → subservience.
- Visible symbols of superiority (railways, guns).
- Archetypes (Shifting the Burden, Growth & Underinvestment, Drifting Goals).
- Sectoral impacts (governance, agriculture, manufacturing).
[Sidebar: Archetypes at work]
[Diagram: Subjecthood before vs. after colonization]
Post 3: The Reactive Voice — After Independence
- Q: Why does Africa still fear STEM? (STEM = colonizer).
- India & Singapore comparison: what shields they had (texts, guilds, diaspora, exposure to colonizer weakness).
- Africa’s missing shields: oral/ ecological resilience vs. Asia’s institutional resilience.
- What stood up for India/Singapore but not Africa?
- Sectoral examples (politics > science, agriculture as “backward,” mimicry in industry).
[Table: India vs. Singapore vs. Africa — resilience shields]
[Segment title suggestion: “Resilience Without Records: Why Africa’s Shields Differed”]
Post 4: The Restorative Voice — Rewriting the Future
- Q: If Africa could rewrite history, what would it do differently (pre-, during, post-colonization)?
- Counterfactuals: writing knowledge, guilds, additive framing of STEM, solidarity with Asia, early African IITs.
- Archetypes broken (Shifting the Burden, Growth & Underinvestment, Drifting Goals).
- Q: What if knowledge had been honored differently?
- Vision: Africa leading in regenerative agriculture, pharmacology, metallurgy, frugal engineering.
- Today’s levers: governance reforms (your DM reforms), regenerative agriculture, manufacturing hubs, curricula rooted in identity.
[Sidebar: Breaking the Archetypes]
Post 5: Levers of Restoration — From Fear to Leadership
- Q: How did Africa define knowledge? (proof, apprenticeship, women’s role).
- Q: Were there resistances? (African inventors, intellectuals).
- Q: What success stories already contradict fear? (M-Pesa, Zipline, off-grid solar, South African HIV research).
- Q: What global crises open leadership opportunities? (climate, food, energy, pandemics).
- Q: What barriers remain? (corruption, brain drain, status narratives).
- Closing: Africa can pick up the pen — not just to boast, but to lead.
[Diagram: Five levers → restorative voice]
Part 1: Stewardship Voice — Before the Colonizer
Opening Question: Why does Africa fear STEM?
That’s a powerful question. The phrase “Africa fears STEM” often captures a perception. It is not necessarily a literal truth. However, it reflects deep systemic issues. From my work with systems thinking and the African context, here are some interlinked reasons why STEM (Science, Technology, Engineering, and Mathematics) hasn’t always been embraced with confidence:
1. Historical Legacy and Colonial Imprint
- Colonial education systems in Africa often trained people to serve administrative and clerical functions, not to innovate, engineer, or industrialize.
- After independence, many countries inherited systems that privileged rote learning over problem-solving, leaving STEM underdeveloped.
- As a result, STEM is sometimes perceived as “foreign” knowledge, not rooted in local culture.
2. Cultural Beliefs and Identity
- In many communities, wealth and status were historically tied to land, cattle, or family size, not to technical expertise.
- This creates a subconscious fear: “If my child becomes a scientist, will they abandon our traditional ways and values?”
- Parents may steer children towards “safe” professions like law, medicine, or government jobs. These professions confer prestige and security. This leaves STEM seen as risky or alien.
3. Fear of Failure in a Weak Ecosystem
- STEM fields need laboratories, equipment, reliable electricity, and supportive industries. Where these are lacking, students experience repeated frustration.
- The fear is not of STEM itself. The concern lies in investing in a path that may not “pay back.” This is because the system around it isn’t strong.
4. Education System Gaps
- Early schooling often emphasizes memorization instead of curiosity, experimentation, and applied science.
- Teachers themselves may fear STEM, lacking confidence and resources.
- This creates generations of students who believe “Math and science are too difficult, only for geniuses” — a learned fear.
5. Economic & Policy Incentives
- In many African countries, the largest and most stable employers are the government and retail sectors, not technology or manufacturing.
- Youth see STEM graduates underemployed or migrating abroad, which reinforces the fear that STEM is a “dead end” locally.
- By contrast, mining, tourism, and trade seem more certain pathways — even if they don’t build long-term resilience.
6. Structural Inequality
- Rural schools often have no labs, no computers, and sometimes no science teachers.
- This makes STEM look like something “for elites” in capital cities.
- Fear comes from exclusion: “This world is not for us.”
7. Narratives and Mental Models
- Stories matter. Young people mostly see engineers or scientists struggling. They hear leaders glorify imports rather than local innovation. The collective mental model becomes: “STEM is not for Africans. We consume, we don’t produce.”
- Fear is embedded in identity, not just in ability.
✅ But it’s not all fear. Across the continent, there are counter-movements. These include robotics clubs in Kenya and solar startups in Nigeria. You can find biotech hubs in South Africa. There are also space programmes in Ghana and Ethiopia. AI initiatives are present in Rwanda. These show that the “fear” is not innate — it’s structural, historical, and cultural. When systems change, fear turns into aspiration.
It is tempting to answer quickly. Africa fears STEM because it is “hard.” Math and science intimidate students. Schools are underfunded. All true, but shallow.
The deeper reality is that Africa’s fear of STEM is not about equations or laboratories. It is about voice and identity.
STEM feels foreign, credentialist, disconnected from the rhythms of African life. Parents steer children toward law, politics, or government clerical work, which holds prestige and security. Students shy away from STEM fields because they rarely see African role models succeeding in them. Ministries lean on lawyers and administrators, not engineers and systems thinkers.
This fear is not natural. It is learned. And Africa pays for it daily in unemployment, poverty, food insecurity, and dependency.
First, we must understand the fear. To do this, we should return to a time before colonization. During that period, Africa spoke in its own voice about knowledge.
Question: What was Africa like before the colonial imprint?
Great question. To fully understand the issue, we must discard the narrative that Africa was “pre-scientific” before colonialism. Much of Africa’s heritage shows deep STEM practice. However, it is not always in the Western institutionalized form that colonial systems were imposed. The issue with STEM today is not Africa’s tradition itself. Instead, the problem lies in how colonial schooling reframed knowledge. This shift broke continuity.
Here’s a breakdown:
Africa Before the Colonial Imprint: A STEM-rich Landscape
1. Mathematics & Measurement
- Egyptian, Nubian, Ethiopian mathematics: sophisticated geometry for pyramids, irrigation, astronomy.
- Yoruba and Bamana numeration systems: base-20 and base-12 counting, used in trade and astronomy.
- Calendrical systems: lunar/solar calendars aligned with planting, rainfall, and rituals (e.g., Dogon of Mali).
➡️ STEM was embedded in daily survival, spirituality, and agriculture—not separated into classrooms.
2. Engineering & Architecture
- Great Zimbabwe’s stone complexes (11th–15th centuries) were built without mortar, using advanced load-bearing design.
- Ethiopian rock-hewn churches of Lalibela (12th century) demonstrate engineering precision.
- Sahelian mud architecture (Timbuktu, Djenné) used renewable materials and climate-adaptive design.
➡️ STEM here was generative: built from local materials, adapted to ecological conditions.
3. Agricultural Science
- Terracing in Ethiopia, irrigation systems in the Sahel, banana/enset cultivation in East Africa, cattle-breeding in Southern Africa.
- Indigenous soil and seed management: millet, sorghum, yam, and cassava systems evolved as resilient “climate crops.”
- Knowledge of botany: medicinal plants, rotation cycles, intercropping for pest control.
➡️ Agriculture was a laboratory; experimentation and adaptation were constant.
4. Metallurgy & Technology
- Iron smelting in Nok culture (Nigeria, ~1000 BC) predates much of Europe’s iron use.
- Steel production in Tanzania (Haya people) used preheated forced-draft furnaces centuries before industrial Europe.
- Goldsmithing, bronze casting (Benin, Ife), weaponry, and tools.
➡️ Africa wasn’t “behind” in metallurgy—it was parallel, sometimes ahead.
5. Astronomy & Navigation
- Dogon astronomical knowledge of Sirius system (though debated) shows sky-mapping traditions.
- Swahili and Malagasy sailors navigated Indian Ocean trade routes with star maps, winds, and currents.
- Nilotic peoples tracked river flooding with stellar calendars.
➡️ Observational science is tied directly to food, water, and movement.
⚖️ Where It Sits Uneasily with Today’s STEM
Colonialism introduced a different framing of STEM:
Separation of knowledge — STEM became compartmentalized subjects in schools, divorced from spirituality, farming, or craft. Pre-colonial Africa had integrated knowledge systems.
Credentialism vs. craftsmanship — STEM success today is judged by degrees, papers, and laboratories. Pre-colonial societies valued demonstrable skill, practical results, and communal utility.
Individual vs. communal orientation — Western STEM emphasizes individual achievement and patents. African traditions placed innovation in the service of the community, not individual glory.
Alienation from land — Many African STEM practices (soil, crops, astronomy, building) were land-rooted. Colonial STEM made land “backward” and “modernity” urban and industrial.
✨ In Short
Before colonial imprint, Africa was already a STEM continent—but in a form where science, spirituality, agriculture, and culture were fused. The conflict arose when colonial schooling devalued indigenous STEM as “primitive.” It was replaced with Western STEM that was alien. This new STEM was credential-driven and divorced from daily life.
So Africa doesn’t fear STEM by nature. It fears a version of STEM that feels disconnected from its roots. This version offers little reward in its current economic structures.
Africa’s STEM was embedded in survival and spirituality. The forge, the field, and the stars were its laboratories. Chiefs and elders were its custodians.
This was the stewardship voice: knowledge as belonging, not domination.
Question: Who were the inventors of STEM?
Here is the irony: most of the foundational STEM building blocks did not come from colonizers at all.
This is a fascinating angle. It reframes STEM not as something “gifted” to Africa by its colonizers. Instead, it presents STEM as a global human inheritance. Many of the foundational discoveries and inventions that shaped modern STEM came from countries and civilizations that never colonized Africa.
Here’s a structured view:
🔬 Leading STEM Inventors & Civilizations (non-colonial in Africa)
1. China
- Compass (navigation, 11th century)
- Gunpowder (chemistry, 9th century)
- Papermaking (Han dynasty, ~100 CE)
- Printing press (woodblock & movable type) (Tang & Song dynasties)
- Seismograph (Zhang Heng, 2nd century CE)
- Mechanical clock (Su Song, 11th century)
➡ China made significant contributions to applied science and technology. This was achieved without colonizing Africa. Their presence began with the recent 21st-century economic involvement.
2. India
- Zero as a number & place value system (Aryabhata, Brahmagupta, ~5th–7th centuries)
- Ayurvedic medicine (systematic medicinal science, millennia-old)
- Cotton spinning/weaving technologies (antiquity, spread worldwide)
- Iron pillar of Delhi (rust-resistant metallurgy, 4th century CE)
- Trigonometry foundations (sine, cosine concepts)
➡ India shaped mathematics, metallurgy, and medicine, which became the foundations for global STEM.
3. The Islamic Golden Age (Arab, Persian, Turkish, North African scholars)
- Algebra (Al-Khwarizmi, 9th century, Persia)
- Optics (Ibn al-Haytham, 10th–11th century, Iraq/Egypt)
- Hospitals & surgical instruments (Al-Zahrawi, 10th century, Andalusia)
- Astrolabe improvements (for navigation/astronomy)
- Translation & preservation of Greek science + original advances in chemistry, astronomy, and medicine.
➡ While some Islamic empires interacted with Africa through trade or conquest (e.g., Arabs in North Africa), they were not “colonizers” in the European sense of extracting and administratively ruling territories.
4. Japan
- Karakuri automata (mechanical dolls, early robotics, 17th century)
- Sakichi Toyoda’s automatic loom (1890s, precursor to Toyota industries)
- Advances in metallurgy and ceramics (swords, steel folding, 10th+ centuries)
- Post-Meiji Restoration innovations in electronics, rail, and biotech (20th century).
➡ Japan never colonized Africa; it modernized on its own path and is now a STEM powerhouse.
5. Mesopotamia (Iraq, Syria region)
- Writing (cuneiform) (~3000 BCE)
- Wheel (~3500 BCE)
- First known maps & astronomical records
- Base-60 number system (still used in measuring time/angles).
➡ These were world-firsts, forming the roots of mathematics, astronomy, and engineering.
6. The Americas (Pre-Colonial)
- Mayan calendar & astronomy (precise solar/lunar tracking)
- Aztec chinampas agriculture (floating farms, advanced agro-tech)
- Incan quipu system (knotted cords as information storage)
- Incan terraced farming & irrigation engineering in Andes.
➡ These civilizations were later colonized themselves. They had STEM contributions before European conquest. They had no colonial project in Africa.
7. Sub-Saharan Africa itself
- Tanzania (Haya people): preheated blast furnaces for steel (long before Europe)
- Mali (Dogon): astronomical systems
- Great Zimbabwe: dry stone architecture
- Benin & Ife (Nigeria): bronze metallurgy & lost-wax casting
- Egypt & Nubia: geometry, medicine, engineering (pre-Greek and pre-colonial).
➡ Africa itself was a STEM innovator before the colonial rupture.
Mapping STEM’s Origins, Carriers, and Today’s Landscape (vis‑à‑vis Africa)
A) Three roles in the global STEM story
- Originators (Foundational inventors) – civilisations that created core building blocks.
China (paper, compass, gunpowder, printing, clockwork), India (zero, place value, early trig, metallurgy, cotton tech), Islamic Golden Age (algebra, optics, hospitals, astronomical instruments), Mesopotamia (writing, base‑60, wheel), Pre‑Columbian Americas (precision calendars, terracing, chinampas), Sub‑Saharan Africa (iron/steel, architecture, agro‑ecologies), Egypt/Nubia (geometry, medicine, engineering). - Carriers/Industrializers (Amplifiers) – powers that standardized, mass‑produced, militarized, and exported STEM through empire, industry, and global trade: Britain, France, Spain, Portugal, Netherlands, Belgium, Germany, Italy; later the U.S. & USSR as global industrial/military carriers; Japan as a non‑African colonizer but a major independent modernizer.
- Independent Modernizers (Non‑colonial over Africa) – Japan, China (late‑20th/21st c.), India, Korea, Singapore, others who internalized STEM without African colonization and used it for domestic transformation.
B) Diffusion matrix (who invented what, who carried it, how it spread)
| Building block | Originators (examples) | Carriers/Industrializers | Main diffusion channels | Colonial impact (global) |
|---|---|---|---|---|
| Numerals & zero | India | Europe, global academia | Translation (Arabic→Latin), universities | Modern accounting, navigation, science |
| Algebra, optics, hospitals | Islamic Golden Age | Europe | Scholastic networks, printing | Surveying, artillery, clinical medicine |
| Paper, gunpowder, compass, printing | China | Europe (Gutenberg metal type), global navies | Trade, Jesuit/merchant knowledge flows | Books, bureaucracy, naval warfare, cartography |
| Metallurgy (iron/steel), lost‑wax casting | Africa, India, China | Europe, Japan, U.S. | Industrial process engineering | Railways, bridges, weapons, factories |
| Agronomy/terracing/irrigation | Andes, Ethiopia, Sahel, Nile | Europe, Asia (selective adoption) | Imperial agronomy stations, botanical gardens | Plantation economies, crop transfers |
| Astronomy/calendrics | Mesopotamia, Egypt, Mayans, Dogon* | Europe, global science | Observatories, nautical schools | Navigation, mapping, time standardization |
*Dogon astronomy is debated academically; included here as a cultural tradition of sky‑knowledge.
C) How carriers turned STEM into empire
- Standardization & scale: steamships, rail, telegraph/telephone, precision machining, germ theory & quinine → deeper penetration, faster resource extraction.
- Measurement power: cadastral mapping, statistics, censuses → taxation, labour control.
- Doctrines & schools: naval colleges, artillery schools, civil engineering corps → replication across colonies.
- Capital stacks: joint‑stock companies, marine insurance, commodity exchanges → financed global projection.
D) How non‑African‑colonizing originators used STEM at home
- China: state bureaucracy (paper), large‑scale hydraulics (Grand Canal), porcelain/metallurgy; today—manufacturing scale, space programme, infra exports.
- India: mathematics for astronomy & calendrics, advanced metallurgy, cotton tech; today—IT, space, pharma, frugal engineering.
- Islamic world: hospitals, optics, algebra for administration/astronomy; today—select hubs in energy, materials, medical devices (varies by country).
- Japan/Korea/Singapore (independent modernizers): imported, adapted, upgraded—from textiles to precision machinery, semiconductors, biotech.
E) Where the globe stands today (capability map)
Frontier discovery & platforms: U.S., EU, China, Japan, South Korea (AI, chips, biotech, aerospace).
Scale manufacturing: China (+ Southeast Asia), increasingly India.
Mission engineering: U.S., China, India, EU (space, energy, defense).
Frugal & leapfrog innovation: India (low‑cost medical devices), Kenya & Ghana (fintech, mobile money), Rwanda (drones), South Africa (biotech), Morocco/Egypt (automotive/aero niches), Ethiopia (space/remote sensing).
Africa overall: strong use‑cases (mobile money, off‑grid solar, agri‑tech pilots) but thin domestic knowledge‑to‑industry ladders (R&D → standards → procurement → scaling).
F) Why this matters for Africa’s narrative
Continuity, not rupture: African and non‑colonial originators show STEM as a shared heritage, culturally close to Africa’s own traditions.
Carriers built power by systems, not just inventions: standards, logistics, capital, and institutions turned STEM into state capacity.
Modern independent builders prove the path: Japan/Korea/India show you can internalize STEM without colonizing Africa—and win.
G) Systems archetypes (Onion‑ready)
- Growth & Underinvestment: Importing finished tech satisfies short‑term needs → underinvest in labs, tooling, standards, procurement reform → capability gap widens.
Levers: sovereign procurement for local engineering, standards bodies, test labs, patient capital. - Shifting the Burden: Hire foreign turnkey contractors → chronic dependence → local engineers under‑utilized.
Levers: mandatory local design/QA partners, capability transfer clauses, multi‑year talent pipelines. - Success to the Successful: R&D concentrates in a few regions → attracts more capital/talent → further concentration.
Levers: regional African research consortia, pooled IP funds, diaspora sabbaticals, grand‑challenge prizes. - Drifting Goals: Lower expectations for domestic manufacturing → lock‑in to assembly/import.
Levers: escalating local‑content thresholds tied to performance, export‑credit for African OEMs.
H) A practical roadmap for Africa (from “fear” to leadership)
Re-anchor STEM in heritage: curriculum threads that link indigenous agronomy, metallurgy, architecture to modern disciplines (identity = confidence).
Build capability ladders: tech parks that include tooling/standards/testing (not just co‑working); university‑industry design studios with public procurement demand.
Grand missions with procurement guarantees: e.g., national irrigation controllers, grid‑scale storage, cold‑chain for horticulture, local rail components—pre‑purchase + standards open to local firms.
Diaspora & South‑South exchanges: fellowships with India/China/Japan/Korea/Singapore; reverse‑sabbaticals for African faculty/engineers.
Regional specialization: SADC/EAC/ECOWAS allocate niches (chips packaging, vaccine fill‑finish, agri‑machinery, satellite downstream).
Finance the boring layers: metrology labs, certification bodies, safety codes, reference designs—small money, huge leverage.
Talent compacts: 10‑year national cohorts (STEM teachers → technicians → engineers), bonded to mission projects rather than vague employment promises.
1) Origins → Carriers → Impacts (condensed)
| Stage | Examples | What changed the world? | Africa lens |
|---|---|---|---|
| Origins | India (zero), China (paper/compass), Islamic Golden Age (algebra/optics), Africa (iron/agronomy), Mesopotamia (writing) | Core ideas & tools | Cultural fit already present |
| Carriers | Britain, France, Netherlands, Spain, Portugal, Germany, U.S. | Standardization, military/logistics, capital markets | Empire spread + extraction |
| Independent modernizers | Japan, Korea, India, China (modern), Singapore | Domestic upgrading, export manufacturing | Playbook for Africa |
2) Today’s capability rings (qualitative)
| Ring | Who | What |
|---|---|---|
| Frontier science | U.S., EU, China, JP, KR | AI, chips, biotech, space |
| Scale making | CN, IN, ASEAN | Electronics, machinery, textiles |
| Leapfrog apps | IN, KE, RW, GH, ZA, MA, EG | Fintech, drones, healthtech, renewables |
| Enablers | Standards bodies, metrology, procurement | Turn ideas into industry |
🧩 Why this matters
Most of the fundamental STEM building blocks originated from various sources. These include numbers, geometry, astronomy, metallurgy, printing, medicine, and navigation. They came from civilizations that never colonized Africa.
The colonial powers (Britain, France, Portugal, Belgium, etc.) often imported, adapted, and industrialized these ideas for empire-building. They didn’t invent most of them.
So the irony is: STEM in Africa is said to “fear” its heritage today. It is the heritage of non-colonial civilizations. This heritage is often closer in spirit to Africa’s own indigenous science than to the colonial model of STEM.
That’s the pivot point. Once you see it, it flips the narrative:
- Africa is not “behind” because it lacks affinity with STEM.
- Africa’s own indigenous practices already mirrored the ways India, China, Mesopotamia, the Americas, and the Islamic world advanced STEM.
- Colonialism interrupted and discredited that natural continuity. It replaced it with a credential-based, extractive, and bureaucratized STEM. This new system felt alien — and it still does.
The irony, is that the STEM Africa is taught to fear is a distortion. It is a repackaging of ideas by the West. These ideas came from everywhere else. In those places, STEM was closer in spirit to African traditions of land, craft, and community knowledge.
That opens a beautiful space. If African education systems re-anchor STEM in its global non-colonial heritage and indigenous African knowledge, you get recognition, not fear. “This has always been ours too.”
The Price of Fear Today
Africa once spoke of STEM in stewardship. Today, it fears STEM as foreign. The price is severe:
- Governance: Ministries dominated by law, social sciences and politics, not science. Projects outsourced, accountability weak, scope creep unchecked.
- Agriculture: Farming is seen as “backward.” Little soil science, irrigation, or crop genetics. Food imports rise, drought devastates. Youth abandon farms.
- Manufacturing: Economies stuck in raw exports. Few engineers or machinists. Industries are imported turnkey systems that fail quickly. Youth unemployment soars.
This is the bill for losing the stewardship voice.
Part 2: Obedience Voice — During Colonization
Question: Why did Africa not figure out that STEM did not originate with its colonizers?
Because colonization was not just conquest of land. It was conquest of voice. It’s the “pain point” at the heart of the story.
It wasn’t that Africa couldn’t figure this out. Several systemic forces worked together. They made people believe STEM belonged to the colonizers. Here’s the anatomy of why:
The Colonial School
- Taught Newton, Galileo, Pasteur — but erased India, China, Africa.
- Framed African knowledge as superstition, myth.
- Designed not to produce scientists but clerks, interpreters, administrators.
Oral Knowledge Dismissed
- African science was oral, experiential, embodied.
- Colonizers dismissed orality: if it wasn’t in books, it wasn’t knowledge.
- A Dogon sky story became “myth”; a Greek sky story was “astronomy.”
- Africans internalized this dismissal.
Subjecthood Re-engineered
*Question: “Would anyone know that frame existed pre-colonization as subjects of their chiefs? Where did that frame get entrenched?”
Yes, Africans were already “subjects” — but subjecthood meant reciprocity: tribute in exchange for protection, belonging, and stewardship. Chiefs mediated ancestors and land.
Colonizers twisted this frame: chiefs became tax collectors, labor recruiters, enforcers. Tribute became extraction. Subjecthood shifted from belonging → inferiority.
Chiefs as Echoes
*Question: “Whose voice is this — colonizers or tribal chiefs?”
It was the colonizer’s voice. But chiefs echoed it, willingly or under duress, to survive. Hearing it from both foreigners and leaders, Africans normalized colonizer superiority.
Symbols of Invincibility
- Railways, telegraphs, guns, later airplanes — staged as proof of European superiority.
- Unlike India (1857 revolt) or Singapore (WWII), Africa saw colonizer dominance endure without visible weakness. The myth of invincibility stuck longer.
Historiography Bias
- European histories of science jumped from Greece → Europe, skipping Africa and Asia.
- These histories were exported globally, reinforcing the myth.
- Africa lacked written archives to contest. Silence became complicity.
Archetypes Entrenched
- Shifting the Burden: Imported STEM replaced indigenous.
- Growth & Underinvestment: Local labs neglected, imports favored.
- Drifting Goals: “We can’t invent, we can only consume.”
Sectoral Impacts
- Governance: Ministries collected taxes for empire, not planned services.
- Agriculture: Cash crops for export; food resilience weakened.
- Manufacturing: Indigenous industries dismantled; colonies became consumers.
Thus the obedience voice emerged: Africa’s knowledge overwritten, chiefs echoing colonizers, STEM made foreign.
Part 3: Reactive Voice — After Colonization
Question: Why does Africa fear STEM?
Because in the colonial frame, STEM was never “ours.” Independence came, but the mental model remained: STEM = colonizer.
What stood up for India and Singapore — physically, emotionally, mentally, perceptually — that Africa did not have in the same way?
Let’s unpack this at four layers:
1. Physical & Institutional Foundations
- India
- A long, recorded scholarly tradition: Sanskrit texts, universities like Nalanda/Takshashila (even if destroyed earlier, memory persisted).
- A huge population base → even during colonialism, there were Indian-run schools, press, and associations keeping intellectual life alive.
- Colonial presence was heavy, but administrative penetration in rural India was thinner than Africa’s direct-rule models.
- Singapore
- A dense, urban trading port with infrastructure and institutions layered from multiple cultures (Malay, Chinese, Indian, Arab).
- British didn’t suppress merchant/trade networks — they needed them, so Singaporeans remained intermediaries with preserved agency.
- Africa
- In many regions, colonial rule dismantled or hollowed out indigenous governance and institutions.
- Suppression of local metallurgies, medicine, and agriculture systems removed the physical anchors of STEM continuity.
- Many regions were ruled as extraction zones — not as “self-sustaining” settlements — leaving thin institutional roots.
2. Emotional & Identity Anchors
- India
- A civilizational pride: “We discovered zero, we had Ayurveda, we built temples.” Even if suppressed, this collective memory endured.
- The independence movement wove science into pride — Nehru called scientists the “temples of modern India.”
- Singapore
- Community pride rooted in family and Confucian/Chinese traditions of valuing education above all.
- A narrative: “We are a tiny island, survival = brains not brawn.” This instilled resilience rather than inferiority.
- Africa
- Colonizers framed African knowledge as “primitive” and worked to erase pride in it.
- Without written scientific records to “prove” their science to Western standards, oral traditions were dismissed.
- This emotional anchor was weakened, replaced by inferiority narratives.
3. Mental & Educational Continuity
- India
- English-language education became a tool for mobility. Indians used it to access STEM globally, then hybridized it with local ambition.
- Strong intellectual leaders (Tagore, Vivekananda, Gandhi, Nehru) reframed education as liberation.
- Singapore
- Education policy post-independence was laser-focused: science + math were non-negotiable, tied to industrial policy.
- The mindset: “Colonialism ended, now we must be smarter than the colonizer to survive.”
- Africa
- Colonial education designed Africans as clerks, not creators.
- Mental continuity of STEM was broken: the pipeline into applied science was thin, while administrative studies (law, politics) became more prestigious.
4. Perception of Colonizers
- India
- Colonizers seen as oppressors but not cultural superiors. Pride in India’s ancient civilization created an equal-to-superior counter-narrative.
- The freedom struggle embedded resistance and re-appropriation: “We will beat them at their own science.”
- Singapore
- Colonizers seen as temporary “managers of trade.” The real agency lay with merchant families and communities.
- After WWII and Japanese occupation, the British were exposed as vulnerable. Singaporeans reframed colonizers as neither invincible nor superior.
- Africa
- Colonizers positioned as bringers of “civilization.” African systems were delegitimized.
- The perception gap was deeper: colonizer = superior knowledge, African = backward. This stuck in education and aspirations.
Question: India, Singapore and Africa were colonized? What did no allow India and Singapore not to go down the same path?
✨ So what “stood up” for India & Singapore?
Civilizational Memory
Civilizational memory and written traditions → provided pride and continuity.
- India: Pride in zero, Ayurveda, empires.
- Singapore: Confucian reverence for education.
- Africa: Oral traditions discredited; memory erased.
Leadership and Narrative
Strong national/communal narratives → reframed STEM as survival, sovereignty, or status.
Leadership alignment → Nehru (India), Lee Kuan Yew (Singapore) actively championed science.
- India: Nehru framed science as sovereignty. IITs, space, nuclear projects built prestige.
- Singapore: Lee Kuan Yew tied STEM to survival. Education became national religion.
- Africa: Leaders valorized politics over science. Lawyers and soldiers dominated independence movements.
Exposure to Colonizer Weakness
Perception of colonizers as temporary or beatable → not as sole source of knowledge.
- India: 1857 Revolt, WWII.
- Singapore: WWII collapse of Britain.
- Africa: Few visible cracks until very late. Invincibility endured.
Diaspora Feedback
- India: Diaspora in STEM thrived abroad, feeding back prestige.
- Singapore: Scholarships abroad with compulsory return.
- Africa: Brain drain; few systemic return channels.
Economic Structures
- India: Large domestic market absorbed scientists.
- Singapore: Industrial upgrading as survival.
- Africa: Raw export economies, little space for STEM graduates.
Communal resilience structures (families, guilds, merchant networks) → shielded cultural respect for education.
Question: What stood up for them that did not stand up for Africa?
- Written texts, communal pride, diaspora pipelines, visible colonizer weakness.
- Africa lacked these shields. Chiefs co-opted, oral knowledge dismissed, colonizer power unbroken, diaspora drained.
✨ The Core Difference
- India and Singapore redefined STEM as sovereignty and survival.
- Africa was positioned to see STEM as foreign dependency.
That mental model difference — prestige + identity vs. alienation + fear — explains the divergence.
Guilds, Families, and Fields: Why Asia’s Shields Held and Africa’s Fractured
Institutional vs. Ecological Resilience
This takes us to the deep soil of why Africa’s pre-colonial stewardship voice didn’t crystallize into the same resilience buffers India and Singapore carried into colonization.
1. Mode of Knowledge Transmission
- India & Singapore: Had written, codified traditions — Sanskrit texts, Confucian classics, merchant account books. These gave permanence.
- Africa: Knowledge was oral, embodied, seasonal, experiential. Rich, but vulnerable: if elders were killed, or apprenticeships broken, entire sciences could vanish.
👉 Without writing, resilience structures were fragile under colonial attack.
2. Economic Base
- India & Singapore: Dense trade economies. Guilds (weavers, blacksmiths, traders) created institutional memory. Merchant networks spanned seas and kept records.
- Africa: Many societies were agrarian-pastoral, dispersed across vast land. Trade existed (Saharan caravans, Swahili coast) but was less institutionalized continent-wide.
👉 Economic decentralization limited the rise of guild-like resilience.
3. Social Organization
- India & Singapore: Caste, clan, or merchant networks bound people into long-lasting communal obligations. Apprenticeship often ran through kinship or guild.
- Africa: Authority often centered on kinship + chiefs. Knowledge was stewarded, but structures were fluid; migrations, wars, and ecology caused frequent dispersal.
👉 Flexibility helped survival, but limited rigid resilience structures.
4. Geography & Ecology
- India & Singapore: High population density forced long-term institutions to emerge. Cities like Varanasi, Calcutta, Singapore city-state acted as resilience hubs.
- Africa: Vast land, lower population density in many regions, high ecological variability (droughts, tsetse flies, shifting rain belts). Communities adapted fluidly — but without dense urban hubs to “lock in” institutions.
👉 Mobility replaced permanence as resilience.
5. Colonizer’s Leverage
- India & Singapore: Colonizers encountered deep communal buffers (guilds, merchants, written canons). Harder to erase.
- Africa: Colonizers faced flexible but fragile structures. Easier to break oral chains, co-opt chiefs, dismantle crafts, and rewire subjecthood.
So what stopped Africa?
Not weakness, but different forms of resilience:
- Africa’s resilience was ecological, mobile, oral, adaptive.
- India & Singapore’s resilience was institutional, textual, merchant-based.
Colonization targeted institutions. So where Asia resisted with codified canons and guilds, Africa’s fluid structures were dismantled more easily.
⚖️ Why Africa’s path diverged
- Many communities had oral rather than written science traditions, easier for colonizers to dismiss.
- Colonizers dismantled indigenous institutions more thoroughly (to prevent resistance).
- Economic models (extraction, monocrops, mining) didn’t need local STEM → so STEM wasn’t integrated into sovereignty narratives.
- Colonizers successfully embedded the “STEM = foreign” mental model deeper in Africa than in Asia.
Reactive Loops Today
- Governance: Ministries dominated by law/politics, weak technical oversight.
- Agriculture: Youth see farming as backward; agronomy invisible. Food imports grow.
- Manufacturing: Industrial visions mimic foreign models, but factories fail without engineers.
This is the reactive voice: fearful, hesitant, angry, but still trapped in colonizer categories.
Part 4: Restorative Voice — Rewriting the Future
Question: If Africa could rewrite history, what would it do?
This is a profound thought experiment, Sheila — asking: if Africa could “rewrite” its history, what foundations would it have needed to carry forward so that its post-colonial STEM trajectory looked more like India or Singapore?
Here’s a structured reflection:
🔮 If Africa Could Rewrite History: A Systems Counterfactual
1. Pre-Colonial Anchors
- Record Indigenous STEM in Writing
- Codify astronomy, metallurgy, agronomy, medicine in scripts and manuscripts (as India did with Sanskrit texts, or China with bamboo/paper records).
- This written archive would make it harder for colonizers to dismiss African STEM as “primitive.”
- Institutionalize STEM in Guilds/Schools
- Build enduring centers of learning (like Timbuktu but across regions) where STEM knowledge is formally taught, certified, and celebrated.
- This would provide continuity even if colonizers disrupted oral traditions.
- Tie STEM to Identity and Status
- Ensure blacksmiths, healers, astronomers hold high prestige akin to priests or chiefs.
- That way, when colonizers arrived, attacking STEM would be attacking the core of society, not just a fringe.
2. During Colonization
- Frame Colonizer STEM as Additive, Not Superior
- Chiefs and elders could have said: “They bring their tools; we already have ours. Let us combine them.”
- By presenting European science as one more tradition among many, Africa could preserve dignity and continuity.
- Preserve Parallel Indigenous Institutions
- While accepting colonial schools, maintain African STEM schools that taught astronomy, metallurgy, botany, irrigation.
- This would ensure children grew up bilingual in both indigenous and Western STEM.
- Resist the “Primitive” Label through Leadership
- Leaders could publicly demonstrate African STEM achievements (e.g., iron smelting, architecture) as equal to colonizer inventions.
- This would counter the colonizer’s psychological edge of invincibility.
- Build Coalitions with Other Colonized Nations
- Forge intellectual exchanges with India, China, Islamic world — showing Africans that others under empire were also scientists, engineers, mathematicians.
- This solidarity would weaken the “Europe = only science” narrative.
3. Post-Colonial Pivot (to Rewrite the Future)
- National Leaders Define STEM as Sovereignty
- Like Nehru in India or Lee Kuan Yew in Singapore, African leaders would have made science the language of freedom.
- Instead of valorizing political or legal careers above all, they’d valorize engineers, doctors, and farmers who modernize.
- Build Early Flagship Institutions
- Establish continental “IITs” (Indian Institutes of Technology) or “NUS” equivalents (Singapore) as symbols of African brainpower.
- Guarantee scholarships tied to national projects so STEM graduates felt purposeful.
- Diaspora Integration
- Structure pathways for Africans studying abroad to return with skills (as Singapore enforced with bonded scholarships).
- This would prevent brain drain and build a confident scientific community at home.
- Reframe Cultural Narratives
- Celebrate African STEM heroes in textbooks alongside Newton and Galileo.
- Teach children: “We discovered steel, we built Great Zimbabwe, we healed with botany — STEM is ours.”
4. System Archetypes — What Needed Breaking
- Avoid “Shifting the Burden”
- Don’t over-rely on imported turnkey solutions (railways, hospitals, schools). Insist on co-building with local engineers, training in parallel.
- Avoid “Growth & Underinvestment”
- Keep investing in labs, schools, indigenous knowledge — even if imported STEM seems faster or shinier.
- Break “Drifting Goals”
- Refuse to lower expectations: aim for African manufacturing, satellites, medical schools within a generation, not “someday.”
✨ Summary: The Alternative History
If Africa could rewrite history, it would have:
Recorded its STEM in enduring ways (written, institutional).
Framed colonizer STEM as complementary, not superior.
Preserved and taught its own STEM alongside Western STEM.
Had leaders who cast STEM as sovereignty, not subordination.
Invested in institutions, diaspora return, and prestige for scientists.
The result?
- Post-colonial Africa would have emerged with a mindset closer to India. In India, STEM represents pride and sovereignty. Similarly, in Singapore, STEM signifies survival and prosperity. This is in contrast to today’s fractured view, where STEM is seen as foreign and dependent.
Question: What if knowledge had been honored differently?
Africa might already have led in regenerative farming, botanical pharmacology, metallurgy, cosmology, and frugal engineering.
Question: Why did Africa let go of its own voice?
Because colonization overwrote reciprocity with obedience. Chiefs echoed superiority. Fear replaced pride.
But history is not fixed.
Picking Up the Pen Today
- Governance: Data-driven ministries, predictive modelling, and Development Manager reforms.
- Agriculture: Regenerative hub of the world.
- Manufacturing: Agro-processing, renewables, frugal AI.
- Education: Curricula rooted in identity — Dogon + Galileo, Nok + Newton.
- Diaspora: Structured return pipelines.
This is the restorative voice: Africa reclaiming STEM not as mimicry but as authorship.
Epilogue: Rediscovering the African Voice
Africa often speaks in protest or mimicry — wound up tight, resentful, reactive. That is not yet its own voice.
This essay has unfolded in questions. Africa must rediscover its own narrative by asking differently. It should not do so by accepting ready-made answers.
The stewardship voice said: “We belong to knowledge.”
The obedience voice said: “We obey the colonizer’s knowledge.”
The reactive voice says: “We resent STEM, but still think it is foreign.”
The restorative voice will say:
👉 “We are inventors. Our knowledge is ours. Our voice leads not only for ourselves but for the world.”
Part 5: Levers of Restoration — From Fear to Leadership
Opening Frame
We have traced Africa’s journey through four voices:
- Stewardship — Africa once spoke STEM as belonging.
- Obedience — Colonization overwrote this voice.
- Reactive — Post-colonial Africa feared STEM as foreign.
- Restorative — Africa can reclaim STEM as sovereignty.
But history alone is not enough. The question is: what levers can Africa pull today to shift from fear into leadership?
1. Rediscovering Epistemology
Question: How did African societies define “knowledge” — what counted as proof or evidence?
Pre-colonial Africa validated knowledge through experience. If it healed, if it grew, if it endured, it was true.
- Blacksmiths proved knowledge at the forge.
- Farmers proved knowledge in the harvest.
- Healers proved knowledge through cures.
Knowledge was peer-reviewed by apprenticeship and witness. Communities saw results and sanctioned them.
Question: What role did women play as custodians of knowledge, and how was this silenced?
Women held STEM authority:
- Midwives controlled reproductive knowledge.
- Seed selectors engineered agriculture.
- Herbalists preserved pharmacology.
Colonization sidelined them, privileging male chiefs and Western doctors. Their knowledge was discredited as “folk practice.”
Lever: Re-anchor STEM in African epistemologies. Bring women’s knowledge back into curricula. Show that experimentation, apprenticeship, and embodied validation are as “scientific” as laboratory methods.
2. Reclaiming Resistance
Question: Why were chiefs vulnerable to co-optation — and could they have chosen differently?
Chiefs were vulnerable because tribute tied authority to resources. Colonizers hijacked tribute into taxes and labor. Some chiefs resisted: Samori Touré built gun foundries, Menelik II modernized Ethiopia’s army, Shaka Zulu innovated militarily.
Question: Were there African resistances to colonial STEM narratives?
Yes — but forgotten. African doctors and artisans kept practices alive in secrecy. Mission-educated elites argued Africa had science too.
Question: Who were the African inventors and intellectuals during colonization who defended STEM?
- Edward Blyden (West Africa) argued for African contributions to civilization.
- Cheikh Anta Diop (Senegal) later traced Egyptian science to Africa.
- Innovators in agriculture, metallurgy, and medicine kept working locally.
Lever: Unearth and teach these resistances. Insert African inventors into textbooks alongside Newton and Galileo.
3. Naming Breakthroughs
Question: How did African independence movements frame science?
Independence speeches emphasized politics and redistribution. Science rarely featured as sovereignty. Exceptions (Nkrumah’s Akosombo Dam, Nyerere’s Ujamaa farms) faltered because technical bases were weak.
Question: What African success stories in STEM today already contradict the fear?
- M-Pesa (Kenya): Mobile money that revolutionized finance.
- Zipline drones (Rwanda): Blood and medicine delivery at scale.
- Off-grid solar (East Africa): Frugal engineering bringing energy to villages.
- Medical research hubs (South Africa): Global leaders in HIV/AIDS, TB.
- Space science (Nigeria, South Africa): Satellites and observatories.
These are not mimicry. They are Africa’s own STEM voice re-emerging.
Lever: Celebrate these as restorative voice in action.
4. Leading the World Through Crisis
Question: What global crises create opportunities for Africa to lead with its STEM voice?
- Climate change: Africa’s regenerative agriculture and biodiversity can lead food system redesign.
- Food security: Soil and genetic diversity position Africa as a breadbasket for the world.
- Energy: Off-grid renewables and frugal systems can model global sustainability.
- Pandemics: Africa’s experience with Ebola, HIV, COVID gives expertise in outbreak management.
Question: How can Africa build coalitions with non-colonial STEM powers?
- Partner with India, China, Brazil, South-South networks.
- Build joint labs, training exchanges, and technology co-ops.
- Frame partnerships as solidarity, not dependency.
5. Removing Today’s Barriers
Question: What practices today prevent Africa from picking up the pen — and how can they be dismantled?
- Corruption and rent-seeking → Solve with STEM-led governance: dashboards, public data, accountability mechanisms.
- Brain drain → Solve with structured return pipelines, bonded scholarships, diaspora partnerships.
- Status narratives (law/politics > science) → Reframe scientists and engineers as national heroes.
Closing: From Levers to Leadership
The restorative voice is not a dream. It is already breaking through in fintech, drones, off-grid energy, medical research. But for Africa to lead globally, it must:
The levers exist. The only question is whether Africa will pull them.
Epilogue (Extended): Rediscovering the African Voice
Africa often speaks in protest or mimicry — wound up tight, resentful, reactive. That is not yet its own voice.
This essay has unfolded in questions. Africa must rediscover its own narrative by asking differently. It should not rely on accepting ready-made answers.
The stewardship voice said: “We belong to knowledge.”
The obedience voice said: “We obey the colonizer’s knowledge.”
The reactive voice says: “We resent STEM, but still think it is foreign.”
The restorative voice will say:
👉 “We are inventors. Our knowledge is ours. Our voice leads not only for ourselves but for the world.”
The levers of restoration are here. Africa can pick up the pen — not just to boast with the world, but to lead it.
[END OF POST]
Share this:


When Economy Speaks … Regional Shared Production Planning – SADC
Here’s the full-length “no holds barred” post that weaves every point we’ve worked through into a single, logical flow.
I’ve structured it so it reads like a narrative of discovery—starting from the Zambia–Botswana trade question, unfolding into the systemic insight on shared production planning, and ending with a compelling call for regional transformation.
From Zambia–Botswana Trade Gaps to a Vision for Shared Production in Southern Africa
It started as a simple question:
Why isn’t trade between Zambia and Botswana already higher?
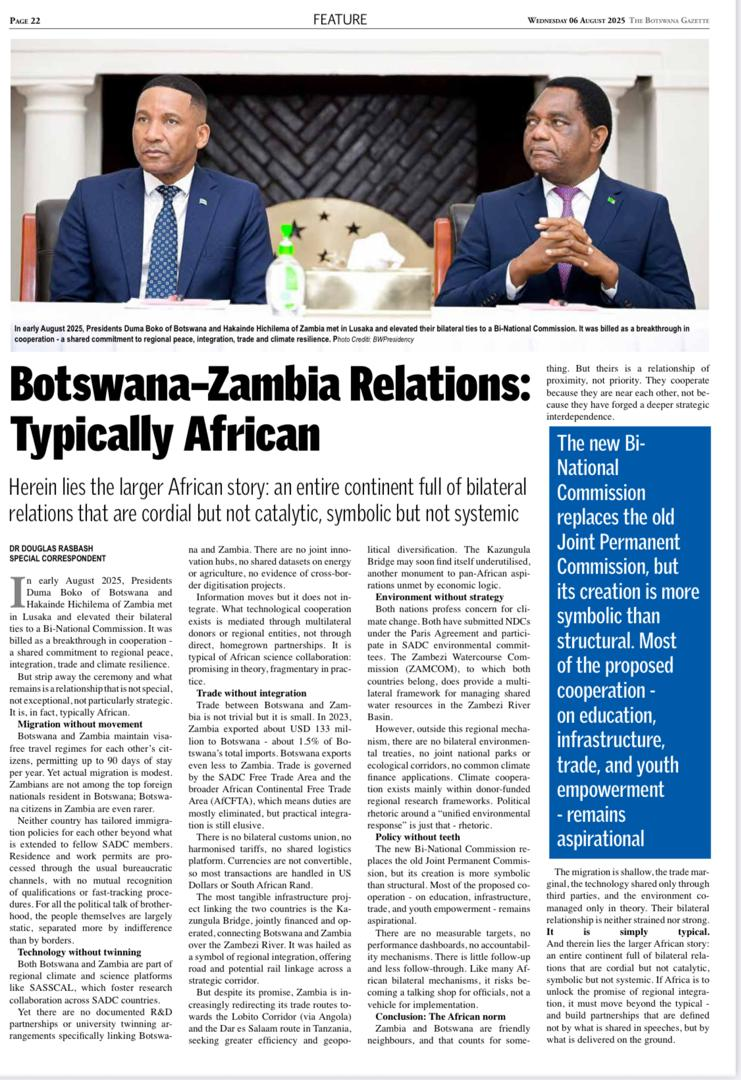
The two countries share a direct border. They now have the Kazungula Bridge linking them—built to speed up trade, improve logistics, and open up the flow of goods between the heart of Zambia’s fertile agricultural land and Botswana’s stable, strategically located economy. Yet, the trade volumes remain surprisingly modest.
Digging into the history revealed the reasons:
- Colonial-era infrastructure in Botswana was designed to connect southward into South Africa, not northward into Zambia.
- Zambia’s transport corridors historically looked east to Dar es Salaam or north to the Copperbelt–DRC axis, not west into Botswana.
- The two countries have very different trade regimes—Botswana in SACU (Southern African Customs Union), Zambia outside it—adding bureaucratic complexity.
- Above all, their production systems were built on a mindset of national self-sufficiency, not regional interdependence.
The Worldview Barrier: Why Africa Hesitates on Shared Production Planning
There’s a deeper reason why shared production planning has not yet become the norm across Southern Africa—and indeed, across much of the continent.
It’s not just about economics, logistics, or climate. It’s about trust, identity, and historical memory.
1. The Worldview Many African Nations Hold
This mindset is shaped by history:
- Colonial Borders: Arbitrary boundaries split ethnic groups, ecosystems, and trade routes, creating fragile national identities and cross-border suspicion.
- Post-Independence Priorities: Fresh from winning sovereignty, most nations pursued self-sufficiency as a shield against new forms of dependency.
- While Pan-Africanism was idealized, the political priority was state-building, often in isolation.
Result: A regional mindset of “we must be able to feed, power, and defend ourselves—even if our neighbours fail.”
2. The Fear of Vulnerability
For many governments, the idea of relying on neighbours for essential goods is uncomfortable—sometimes unthinkable—because:
- Political fallout or border closures can instantly cut off supply
(Nigeria’s 2019 border closure hurt Benin and Ghana). - Retaliatory tariffs, currency shifts, or transport disruptions can hit overnight.
- Loss of strategic control over food, energy, or jobs can undermine domestic stability.
These aren’t abstract fears. History offers reminders:
- Ethiopia–Eritrea war: shut down access to a vital port.
- Zimbabwe–South Africa tensions: threatened fuel and electricity supply.
- Xenophobic violence in South Africa: triggered economic boycotts from neighbours.
In short: political instability + weak institutions = fragile trust = limited interdependence.
3. Why There’s Hope for Shared Production
The barriers are real—but the reasons for optimism are growing:
a. AfCFTA (African Continental Free Trade Area)
Provides the legal framework to reduce tariffs and standardise trade, becoming the “container” for regional supply chains—if matched with real policy and infrastructure.
b. Climate Change
Droughts, floods, pests, and heat waves don’t respect borders. One country’s bumper harvest can buffer another’s crisis. Shared production is becoming a climate adaptation strategy, not just an economic one.
c. Digital Infrastructure
Satellite weather data, mobile payment systems, and real-time crop monitoring lower the cost and complexity of coordinated planning.
d. Youth and Entrepreneurial Energy
A younger, more Pan-African generation is emerging—eager to collaborate across borders, especially in agriculture, food tech, and logistics.
4. What Would Make It Real
For shared production planning to take root, we need:
| Enabler | Description |
|---|---|
| Trustworthy Institutions | Regional conflict resolution, mutual food reserve mechanisms, and joint planning councils. |
| Cross-Border Agro-Economic Corridors | Like the North–South Corridor, linking production, storage, and processing hubs. |
| Seasonal Crop Calendars | Shared schedules based on comparative advantage and climate, not political boundaries. |
| Mutual Food Security Agreements | Legally binding pledges to supply each other during shortages. |
| Pan-African Farmer Coops & Agribusinesses | Operating regionally to serve markets across multiple countries. |
5. Article Closing Thought
“Self-sufficiency is not the same as sovereignty.
In the 21st century, sovereignty may require interdependence.”
The dream of shared production is not naïve—it is necessary for a food-secure, prosperous, and climate-resilient Africa.
But it will only happen if we design systems of safety and trust that allow nations to give up just enough control to gain far greater collective security.
6. From Trade Links to Production Logic
That raised a new question:
What if instead of each country producing independently for itself, a greater share of production planning was coordinated regionally?
In other words: what if Southern African countries planned, rotated, and zoned their agriculture in a way that leveraged their comparative advantages, shared surpluses, and buffered each other’s deficits?
7. Why This Question Matters Now
Southern Africa—especially the SADC (Southern African Development Community) block—faces urgent pressures:
- Population growth over the next century that will sharply increase food demand.
- Climate change intensifying droughts, floods, and land degradation.
- Economic vulnerability to price volatility in global markets and external supply shocks.
- Migration pressures as rural livelihoods collapse and youth move to cities or across borders.
We also face a unique window of opportunity:
- The Kazungula Bridge and other infrastructure projects are physically connecting the region.
- AfCFTA and SADC frameworks provide a political platform for shared strategies.
- The rise of digital agriculture allows for coordinated planning, market transparency, and rapid response to shortages.
8. The Current State: Pre-Shared Model
Today, agriculture’s GDP contributions in SADC are far smaller than they could be—not only in dollar terms but also in job creation, market access, and land stewardship.
Take Botswana:
- Current agricultural GDP: ~USD 88 million (1.71% of GDP, official figure).
- Current production volume: ~320,000 MT (pre-shared baseline).
This reflects mostly self-sufficiency-oriented production, scattered processing capacity, and little leverage of regional comparative advantage.
Here’s how I’d shape that section so it flows naturally inside the main post after the “Worldview Barrier” and “What Would Make It Real” segments.
It builds on the trust-and-institution foundation, then elevates the conversation into a visionary, intergenerational pathway:
9. Shared Production Planning in Southern Africa
A 100-Year Intergenerational Framework for Regional Prosperity, Stability & Land Regeneration
This is not just an economic proposal—it’s a systems-level question that calls for:
- Intergenerational design (planning for 50–100 years, not just electoral cycles),
- Regional governance transformation (institutions built for collaboration, not just coordination), and
- Coordinated agro-industrial and socio-ecological planning (linking food security, jobs, trade, and environmental health).
I. System Conditions to Shift
| Legacy Mindset | Shift Required |
|---|---|
| National self-sufficiency goals | Regional complementarity with mutual buffering |
| Uncoordinated production | Coordinated crop and industrial rotation calendars |
| Extractive profit-seeking | Inclusive productivity with environmental stewardship |
| Export-oriented food supply chains | Dual systems: local nutritional security + export value |
| Unregulated free market | Bounded markets: innovation within protective floors |
II. Strategic Goals for the Next 100 Years
1. Covering Deficits in Production
- Develop a Regional Agro-Climatic Zoning Map to assign each country specific agro-ecological and agro-industrial roles.
- Use joint population and dietary forecasts to model per capita nutritional needs and capacity gaps by decade.
- Establish rotational surplus targets so each country produces a buffer surplus in its comparative advantage every 3rd year.
2. Improving Cost Efficiencies for Better Margins
- Pool procurement of seeds, irrigation, fuel, and equipment through a Southern Africa Production Pact (SAPP).
- Build shared processing and logistics parks at strategic border towns.
- Create a regional innovation and extension training loop to raise yields with minimal external inputs.
3. Creating Equitable Market Access
- Establish regional food and raw goods exchange boards with price floors and co-op representation.
- Digitalise producer networks to enable direct cross-border trading.
- Introduce regional certification & traceability so smallholders meet export standards affordably.
4. Correcting Wealth Concentration & Employment Gaps
- Embed employment elasticity targets in GDP growth policy.
- Promote value-added SMEs with majority producer ownership.
- Deploy automation where it augments—not replaces—human livelihoods.
5. Ensuring Land Regeneration & Reversal of Desertification
- Introduce rotational production–rest zones with agroforestry cycles.
- Create a Regional Regenerative Practices Registry.
- Implement a soil carbon reward system to finance land restoration.
III. Tools & Governance Structures Needed
| Tool / Mechanism | Purpose |
|---|---|
| Southern Africa Shared Production Planning Council (SASPP) | Oversees coordinated planning and compliance |
| Geo-Spatial Agro-Economic Planning Maps | Align land, climate, and trade corridors |
| SADC Agro-Food Sovereignty Scorecard | Tracks equity, employment & regeneration goals |
| SADC Mutual Buffer Stock System | Guarantees food supply during shocks |
| AfCFTA-aligned Shared Processing Zones | Integrates cross-border value chains |
| People’s Sovereignty Fund | Long-term reinvestment for land stewards |
IV. Cultural & Psychological Shifts Required
- From Nation vs. Nation → Region as Family — fostered through storytelling, shared history education, and regional rituals.
- From Productivity Measured in Tonnes → Health, Employment, & Soil Regeneration — realigned measurement systems.
- From Competitive Global Positioning → Cooperative Resilience — recognising that power lies in interdependence.
V. The Vision in One Sentence
A Southern Africa where no child goes hungry, no farmer stands alone, and no nation depletes its soil to prove its strength.
The Shared Production Planning Model
We modelled what could happen if SADC countries coordinated production planning, focusing on:
- Cereals (wheat, maize, rice, barley),
- Vegetables (tomatoes, potatoes, carrots),
- Fruits (bananas, citrus, apples),
- Fibers (cotton, flax, hemp),
- Oilseeds (soybeans, sunflower seeds),
- Medicinal plants,
- Livestock, poultry, and aquaculture.

Using each country’s climatic suitability and comparative advantage, we built a cross-border rotation and supply system designed to:
Cover production deficits anywhere in the region.
Reduce costs via pooled procurement, logistics, and shared processing.
Improve market access so producers are no longer price-takers.
Keep poverty and unemployment below a 3% threshold.
Regenerate degraded land, aiming for a 75% reduction in desertification in Namibia and other vulnerable zones.
10. What the Numbers Show
The results were eye-opening.
For Botswana:
- Pre-Shared Model Production: 320,000 MT
- Shared Model Production (today): 500,000 MT (+56.25%)
- 50-year projection under shared planning: 900,000 MT (+181% over pre-shared baseline)
- Agricultural GDP (pre-shared): USD 88M
- Agricultural GDP (shared model today): USD 350M (+297.7%)
- Projected agricultural GDP in 50 years: USD 1.2B
Across SADC:
- Production volume gains: Average +35–55% immediately, +75–85% in 50 years.
- Agricultural GDP gains: +80% to +250% depending on country.
- Job creation: Millions of new agricultural jobs, many in rural areas, reducing migration pressures.
- Poverty reduction: Region-wide potential to push unemployment/poverty levels well under the 3% target—if value chains are managed inclusively.
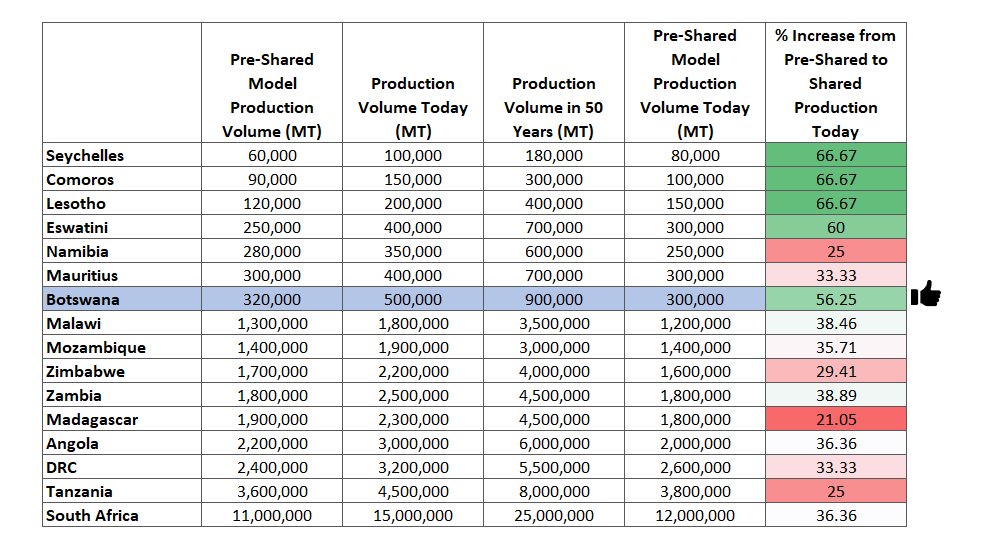
11. Why the Gains Are So Large
The shared production model works because it:
- Reduces duplication: no more forcing crops in climates they fail in just for “self-sufficiency.”
- Builds rotational buffers: surpluses in one country feed shortages in another.
- Maximises processing efficiency: shared plants running at full capacity across seasons.
- Frees up land for regeneration: planned rest periods with cover crops and agroforestry.
12. What Needs to Shift in Worldviews
For this vision to happen, the region’s mental models must change:
To unlock shared production planning in Southern Africa—and across the continent—a profound shift in worldviews is required. These aren’t just policy changes or economic tweaks. They’re deep mental models, assumptions, and identity constructs that currently shape how each country sees itself, its neighbours, and its place in the world.
I. From “Sovereignty Means Self-Sufficiency” → “Sovereignty Through Interdependence”
Current Worldview:
“If we don’t feed ourselves, we risk being dependent—and exposed.”
New Mindset:
“If we co-design regional buffers and rotate production, we reduce risk, improve nutrition, and strengthen resilience—together.”
Each country must see its sovereignty not as autarky, but as part of a network of reliable partners, just like the EU with its Common Agricultural Policy (CAP).
II. From “Produce What We Can” → “Produce What We’re Best Suited For”
Current Worldview:
“We must grow maize even in deserts because our people eat it.”
New Mindset:
“We’ll produce what thrives best here and trade or stockpile for what doesn’t, while ensuring access for all.”
This requires trust in:
- Regional food storage,
- Functional cross-border logistics,
- Fair price setting.
III. From “Don’t Rely on Neighbours” → “Design Mutual Guarantees of Support”
Current Worldview:
“What if our neighbour becomes unstable or hostile?”
New Mindset:
“Let’s embed production agreements in regional governance and public law, so no one is left vulnerable in crisis.”
This requires:
- Binding regional protocols (e.g. emergency grain reserves),
- Legal trade corridors with priority access rules,
- Reciprocal penalties for breaking regional agreements without cause.
IV. From “GDP Competition” → “Collective Wealth & Employment Optimization”
Current Worldview:
“We want to be #1 in exports, yields, or investor interest.”
New Mindset:
“The real win is collective employment, food security, and land regeneration. We track progress in shared dashboards.”
This worldview shift allows:
- Joint tracking of poverty and employment,
- Shared targets for soil health and carbon sequestration,
- SADC-wide employment elasticity targets (e.g. every 1% GDP growth = 0.8% job growth).
V. From “Short-Term Political Gains” → “Long-Term Bioregional Stewardship”
Current Worldview:
“We must deliver results before the next election.”
New Mindset:
“Our legacy is what we leave behind for the next 3 generations, across borders.”
This requires:
- Citizen education in systems thinking,
- Cross-border farmer cooperatives, not just state-led programs,
- Political leadership that earns legitimacy through intergenerational vision.
VI. From “Africa = Commodity Exporter” → “Africa = Designer of Regional Systems”
Current Worldview:
“Let’s scale production to export raw goods.”
New Mindset:
“Let’s design and own our value chains—regionally and ethically.”
This means:
- Moving beyond colonial supply chains,
- Owning regional certifications, labels, and processing industries,
- Building African-centred trading standards and logistics systems.
🕸 Summary: Mental Model Shifts by Stakeholder
| Stakeholder | Shift Required |
|---|---|
| Policymakers | From protectionism to mutual guarantees & production zoning |
| Farmers | From subsistence nationalism to shared cluster strategies |
| Private Sector | From national silos to cross-border cooperatives |
| Youth | From job-seeking to system-building entrepreneurship |
| Donors/Investors | From pilot projects to supporting governance of shared systems |
| Citizens | From suspicion of neighbours to pride in interlinked food systems |
The updated SADC-Wide Shared Production Impact Model now includes:
🔹 % Increase from Pre-Shared Model to Shared Production Today (MT)
This reflects the immediate production uplift possible simply by shifting from isolated national production to coordinated shared planning—even before reaching long-term (50-year) projections.
📊 Examples:
| Country | Pre-Shared Volume (MT) | Shared Model (Today) | % Increase |
|---|---|---|---|
| Botswana | 320,000 | 500,000 | +56.25% |
| Namibia | 280,000 | 350,000 | +25.00% |
| Zambia | 1,800,000 | 2,500,000 | +38.89% |
| South Africa | 11,000,000 | 15,000,000 | +36.36% |
13. The Political & Economic Opportunity
The Kazungula Bridge is more than steel and concrete—it’s a symbol of what’s possible when SADC countries choose to connect. But connection in trade infrastructure is meaningless without connection in production planning.
The shared production model offers:
- Economic resilience – less exposure to global price shocks.
- Food sovereignty – through regional self-reliance, not isolated national silos.
- Climate resilience – coordinated adaptation to shifting agro-climatic zones.
- Wealth distribution – structured so it grows across the rural majority, not just export-facing elites.
14. A Call to Action
If you are a policymaker, agricultural leader, or regional business, here’s what’s needed next:
- Develop SADC Agro-Climatic Zoning Maps to guide production.
- Establish a Southern Africa Shared Production Planning Council to coordinate rotations, processing capacity, and logistics.
- Build mutual food security reserves with legally binding release protocols.
- Create a regional agri-GDP and employment dashboard to track shared progress.
The alternative?
Each country continues producing in isolation, vulnerable to droughts, price crashes, and political shocks, while the region’s full potential remains unrealised.
The original question was about trade between Zambia and Botswana.
The answer, it turns out, is not just about better trade flows—it’s about a new way of thinking: shared production planning as a regional strategy for prosperity, stability, and resilience.
“The Choice Before Us”
Subtitle: Resetting Our Minds for a Shared Future
When we step back and see the shared production model in its fullness, it becomes clear that many of the persistent challenges faced by each nation in isolation—food insecurity, uneven growth, job scarcity, market volatility, and land degradation—begin to resolve themselves in a coordinated regional approach. The real question is no longer whether we can design the systems to make this work; it is whether we can reset the settings of our minds.
The mechanisms are already within reach—in our data, our climate maps, and our trade corridors. What remains is the harder work: to look beyond the comfort of familiar habits, to question the post-independence reflexes of self-protection, and to decide whether holding onto them serves our future or quietly undermines it.
What divides us today could just as easily be the foundation of our collective strength. Many of the challenges we fight alone would shrink—or disappear—if we planned and produced together. The test is not in the fields, factories, or markets, but in our willingness to choose trust over fear, interdependence over isolation. Common sense says we can—and history will ask why we didn’t.
Share this:


What led Plato and Kanto to Their Ideas?
What led Plato and Immanuel Kant to generate their respective notions of perception and reason was their grappling with a fundamental human concern: how do we know what is real, and how can we trust our knowledge of it?
Both philosophers sought to explain the relationship between the mind and the world, but they did so in very different historical and intellectual contexts.
Here is a brief description of what drove each:
🏛️ Plato (427–347 BCE): The Quest for Unchanging Truth in a Changing World
Historical Context
- Plato lived during a time of political instability in ancient Athens, after the Peloponnesian War.
- The Sophists — influential teachers of rhetoric — claimed that truth was relative, and power came from persuasion.
- Socrates (Plato’s teacher) challenged this relativism by insisting that some truths were objective and could be known through reason, not persuasion.
What Led Plato to His Ideas
- Plato was deeply disturbed by the unreliability of the senses — the world constantly changes, people deceive, and perceptions vary.
- He concluded that the visible world was not the true source of knowledge.
- Instead, he proposed the existence of unchanging, eternal Forms or Ideas (e.g., Justice, Beauty, Goodness) which could only be known by the rational soul, not by the senses.
🔹 “What we see are shadows; true reality lies in the world of Forms.” (The Allegory of the Cave)
Key Insight
- Reason (not perception) is the path to truth.
- What we “see” is filtered and partial; truth resides in abstract, intelligible reality.
🎩 Immanuel Kant (1724–1804): Reconciling Empiricism and Rationalism
Historical Context
- Kant lived during the Enlightenment, an era defined by scientific discovery and philosophical debate.
- He inherited a major intellectual conflict:
- Rationalists (like Descartes) argued knowledge comes from reason alone.
- Empiricists (like Hume) argued knowledge comes only from sensory experience.
- David Hume’s skepticism (that we can’t know causality or necessity) deeply shocked Kant — it “awoke him from his dogmatic slumber.”
What Led Kant to His Ideas
- Kant wanted to preserve science and certainty, but also acknowledge Hume’s critique.
- He proposed a “Copernican Revolution in philosophy”: that the mind does not passively receive the world, but actively shapes our experience of it.
🔹 “Thoughts without content are empty; intuitions without concepts are blind.”
Key Insight
- Perception (intuition) and reason (understanding) work together.
- Our mind structures what we perceive — using categories like time, space, and causality — meaning we never know the “thing-in-itself” (noumenon), only how it appears to us (phenomenon).
📌 Summary Comparison
| Thinker | What Led to the Idea | Key Claim | Perception vs. Reason |
|---|---|---|---|
| Plato | Disillusionment with sensory world and Sophist relativism | True knowledge comes from rational insight into eternal Forms | Perception deceives; reason reveals truth |
| Kant | Attempt to resolve rationalist–empiricist debate | The mind actively structures experience; we know appearances, not things-in-themselves | Perception and reason co-construct experience |
Share this:


When Economy Speaks … The Global Diamond Market
Strategic Insight Brief: Understanding the Crisis in the Diamond Industry

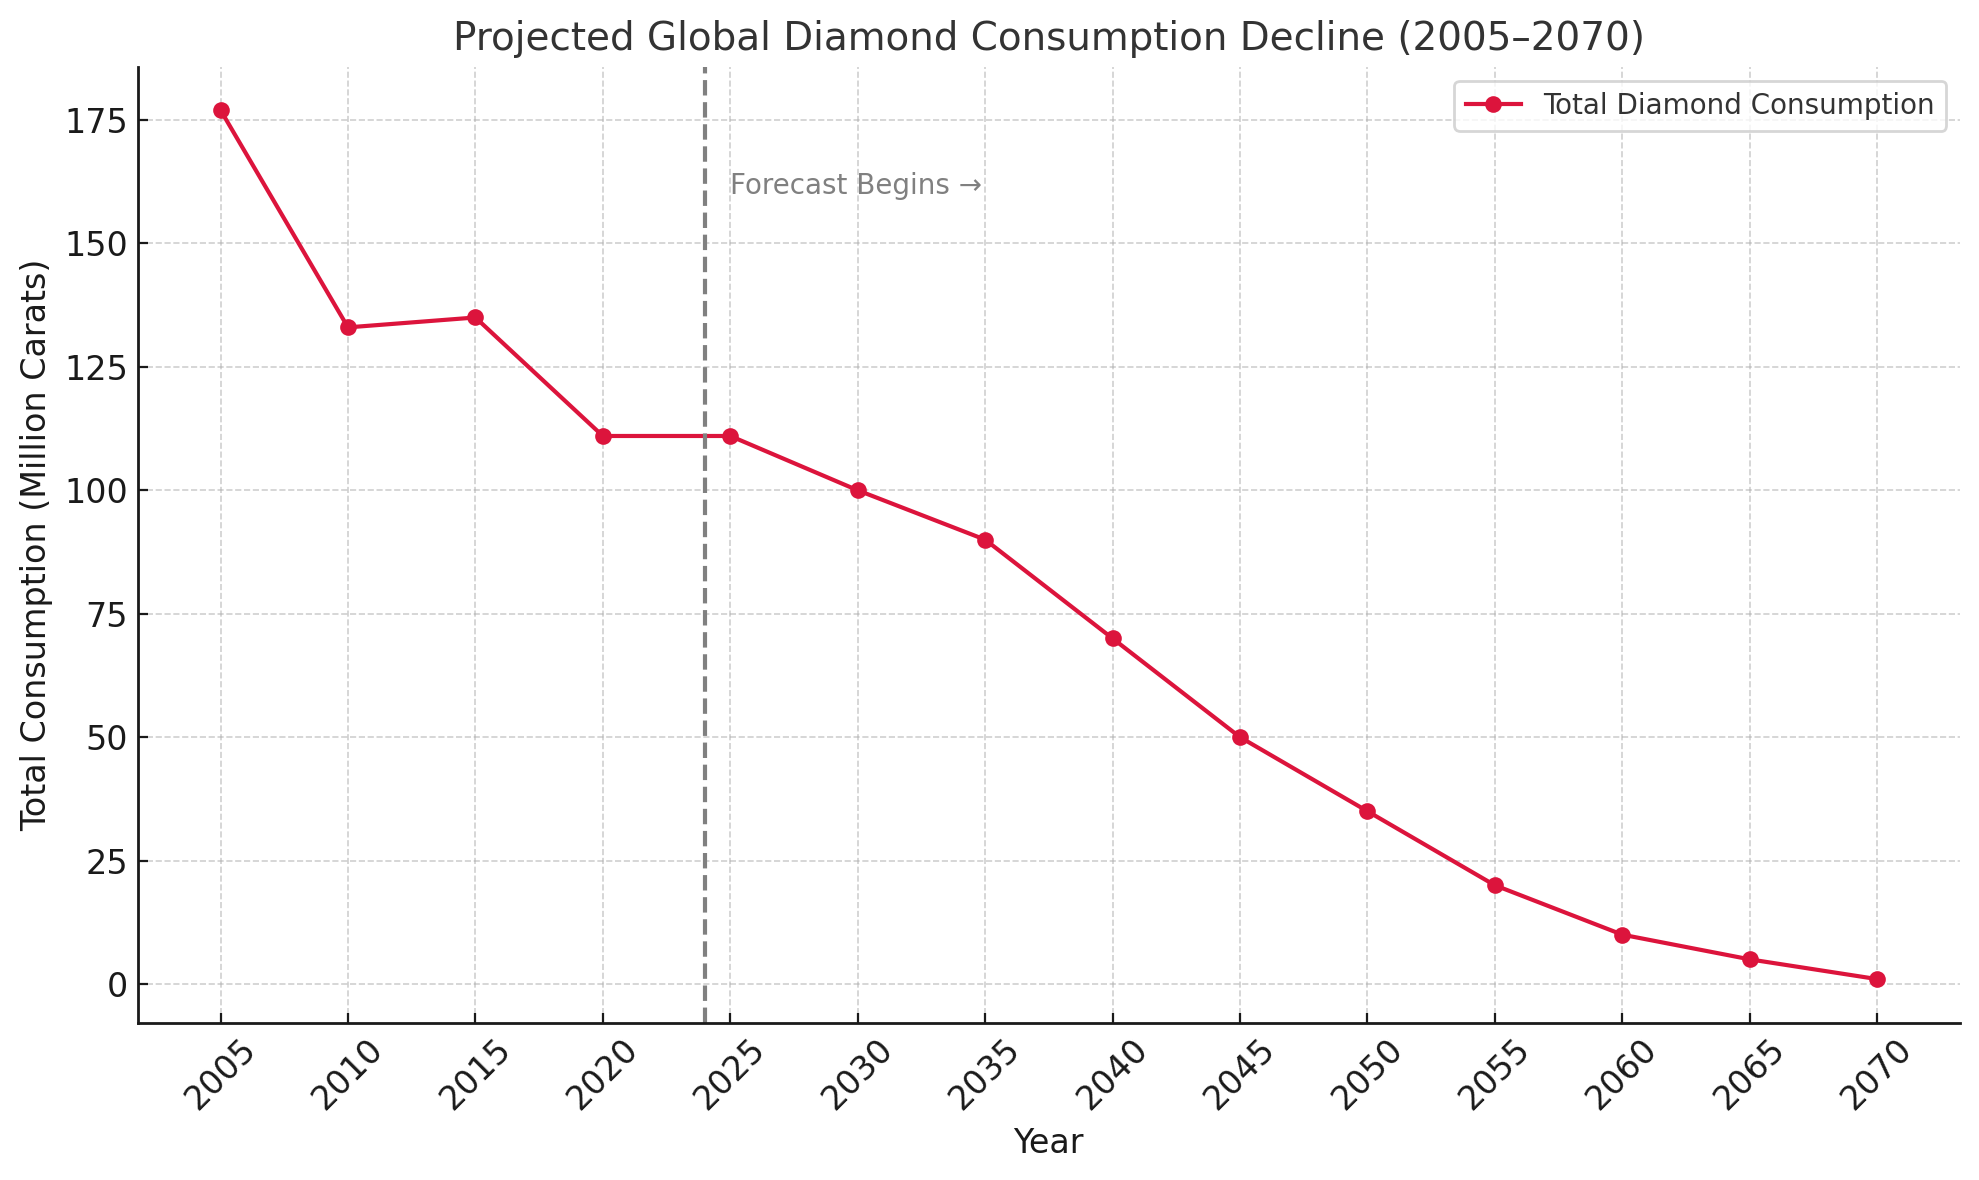
Policy Brief
Title: Reimagining the Diamond Industry’s Role in National Development
Date: June 2025
Prepared by: Ms Sheila Damodaran, STRLDi, Botswana
Executive Summary
The global diamond industry is undergoing a profound transformation. Driven by shifting generational values, declining cultural relevance, and the rise of lab-grown alternatives, overall diamond consumption has dropped by 30–40% per decade since 2005. If these trends persist, the industry could face near collapse by mid-century. This decline is not due to dwindling reserves but reflects a broader societal shift away from the systems—marriage, stable employment, and cultural rituals—that once gave diamonds their meaning.
Botswana and other diamond-producing nations must confront this reality. The choice is stark: transition away from diamonds as a foundational economic sector, or invest in rebuilding the institutional, cultural, and economic infrastructure needed to sustain diamond relevance globally.
Background
Historically, diamonds contributed substantially to Botswana’s public revenue, infrastructure, and export earnings. Yet the diamond industry is capital-intensive, with limited job creation and weak economic linkages beyond mining. Most value is captured downstream—branding, design, and retail—by foreign entities.
The luxury market where diamonds are sold rarely loops profits back into producer economies. Without downstream control and national branding, countries remain locked into the low-value, high-risk end of the global value chain.
Core Challenge
The structural driver of the diamond market decline lies in societal transformation:
- Marriage and family formation are declining.
- Millennials and Gen Z prioritize experiences, sustainability, and ethics over status symbols.
- Formal employment, a precondition for consumer spending and ritual-based consumption, is eroding.
Lab-grown diamonds, though growing in volume, only delay the broader collapse in symbolic relevance.
Strategic Options for Botswana and Similar Economies
Transition Strategy
Diversify economic reliance away from diamonds toward sectors with stronger employment multipliers (e.g., agriculture, tech, creative industries).
Reinvest the fiscal surplus from diamond sales into education, manufacturing, and entrepreneurial ecosystems.
Revitalization Strategy
Develop a fully localized value chain: cutting, polishing, jewelry design, luxury branding, and retail.
Create Botswana-based luxury brands that connect diamonds to modern, ethical, and culturally relevant narratives.
Build capacity in gemology, retail, and e-commerce infrastructure.
Institutional Renewal
Promote formal employment, family stability, and cultural rituals that restore symbolic value to diamonds.
Support public campaigns that reframe diamond giving for modern contexts (e.g., achievement, self-love, sustainability).
Conclusion
The decline of the diamond market is not a temporary downturn—it is a systemic, structural shift. Botswana must act decisively. Either we transition out of diamonds as the core of our economy, or we invest in revitalizing the social and economic foundations that once made the industry thrive. The diamond’s value was never in the stone alone—it was in the systems that supported its meaning. It is time to choose which path to take.
Contact: STRLDi | Sheila Damodaran | June 2025
Going Back to the Beginning
What has been / or continues to be the role of the diamond market in economy building?
The diamond market is deeply connected to the global economy—but its role in economy building beyond mining, processing, and marketing remains underexplored and unevenly distributed. Here’s a breakdown of how connected it is, and what untapped potential it holds:
✅ Where It Is Globally Connected
Global Value Chains
Diamonds follow a complex journey:
Mining (Botswana, Russia, Canada, etc.)
Trading & Sorting Hubs (Antwerp, Dubai, Mumbai)
Cutting & Polishing (India, Thailand)
Retail (USA, China, UAE)
These links make the market highly interconnected, with shocks in one area (e.g. sanctions on Russia, inflation in the U.S.) having ripple effects globally.
Foreign Exchange and Trade Balances
For producer countries like Botswana, Angola, or Namibia, diamonds are a critical source of export earnings. Their trade performance is often heavily influenced by the global diamond market.
Public Revenue and Infrastructure
In countries like Botswana, diamond revenues contribute significantly to national budgets, funding education, health, and infrastructure.
Finance and Investment Vehicles
In luxury economies, diamonds are now being considered alternative investment assets (like gold), though with mixed success due to valuation opacity.
❌ Where It Falls Short in Economic Building
Limited Industrial Multipliers
Outside of mining and polishing, few countries have leveraged diamonds to create robust industrial ecosystems, similar to those found in oil (e.g., petrochemicals) or agriculture (e.g., agro-processing).
There is limited R&D, design, or technology transfer related to diamonds.
The luxury sector, where diamonds end up, rarely loops back profits into producer economies.
Employment Creation is Narrow
The sector is capital-intensive, especially mining. Beyond artisanal mining (often informal), the job multiplier per carat is low unless local cutting, polishing, or jewelry production is developed intentionally.
Weak Integration with Broader Economic Sectors
Very few linkages are built with:
Tourism (e.g., gem museums, high-end retail tourism)
Education (e.g., geological sciences, luxury branding schools)
Creative industries (e.g., fashion, art, design)
Dependence on Multinationals
Large firms (e.g., De Beers, Alrosa) dominate the extraction and early processing stages. This reduces local ownership and weakens long-term economic resilience.
🔄 Missed Opportunity: Diamonds as a Driver of Diversification
A more systemic understanding of diamonds could transform their role in economic building by:
- Developing national brands (e.g., “Botswana Diamonds” as a finished product line)
- Fostering local luxury goods sectors (e.g., high-end jewelry design, fashion)
- Building educational and technical hubs (e.g., institutes for gemology, retail management)
- Integrating diamonds with tourism (e.g., high-value travel, showroom experiences)
Conclusion
Globally, the diamond market is highly connected in trade and finance, but weakly connected when it comes to sustainable, inclusive economy building. Most of the economic value is still captured downstream in richer countries. Unlocking its full potential will require reimagining diamonds not just as a commodity, but as a platform for industrial, creative, and service-sector growth.
What is preventing the luxury sector from looping profits back into producer economies?
Several interlinked factors prevent the luxury sector, where diamonds end up, from looping back profits into producer economies:
1. Value Is Captured Downstream
- Markup happens after the diamond leaves the source country.
A rough diamond might be sold for $200 at the mine, but once it’s cut, branded, and retailed in Paris or New York, it may sell for $10,000 or more. - Most of this margin is captured by brands, retailers, and marketers, not miners or producers.
2. Lack of Control Over the Full Value Chain
- Producer countries typically do not control:
- Cutting & polishing centers (mostly in India, Israel, Belgium)
- Branding and marketing (e.g., Cartier, Tiffany & Co., De Beers)
- Retail distribution and e-commerce platforms
- This makes it hard to claim a bigger share of the value pie.
3. Weak Domestic Luxury Ecosystems
- Most diamond-producing countries lack developed luxury industries:
- No local high-end jewelry brands
- Few globally recognized designers
- Weak logistics, packaging, branding, or export capabilities for luxury goods
- As a result, they cannot compete at the high-margin end of the market.
4. Foreign Ownership and Concessions
- Mining rights and upstream operations are often owned or co-owned by foreign multinationals (e.g., De Beers, Alrosa).
- Even when revenue-sharing agreements exist, they rarely include profit-sharing from final luxury goods sales.
5. Luxury Is Built on Intangible Value
- The luxury price of diamonds is shaped more by brand, story, and perception than by the physical diamond itself.
- These intangibles are created and monetized in Western markets, not where the diamonds are mined.
- Without owning the brand or narrative, producers can’t profit from this intangible premium.
6. Global Trade Structures and Power Imbalances
- Trade agreements, tax structures, and global finance are often biased in favor of capital-rich countries.
- Producer countries may face barriers to exporting finished luxury goods or lack leverage to demand better terms from multinationals.
7. Low Local Demand
- The luxury sector is built on wealthy consumer markets, which are concentrated in the Global North.
- Without strong domestic demand, it’s harder to justify luxury-focused industries within producer countries.
🔄 Summary
The luxury diamond sector doesn’t loop back profits because the real value isn’t in the stone—it’s in the story, branding, and distribution, which are controlled by entities far from the mine. Without reclaiming more of the downstream chain—design, finishing, branding, and sales—producer economies remain trapped in the low-value, high-risk end of the market.
Diamond Industry Capital Structure
The diamond industry has a very distinct capital structure compared to other leading industries. Here’s a comparative breakdown showing how and why its capital demands stand apart, using key economic dimensions:
1. Diamond Industry
| Capital Demand Type | Characteristics |
|---|---|
| Upfront Capital | Extremely high – mining exploration, licensing, and equipment often cost hundreds of millions to billions USD. |
| Working Capital | High – especially in polishing, inventory, and speculative trading. Diamonds are held for long periods to maximize returns. |
| Return Cycle | Long and uncertain – exploration may take years, and finished diamonds are speculative, driven by luxury market trends. |
| Barriers to Entry | Very high – due to geological scarcity, state concessions, and powerful existing players (e.g., De Beers, Alrosa). |
| Capital Intensity | High – requires heavy fixed investment (mining) and expertise-intensive processing (cutting, grading, certification). |
| Risk Type | Geological, geopolitical, reputational, market volatility (luxury demand), and synthetic diamond competition. |
| Profit Capture | Skewed downstream – capital tends to flow toward branding and retail, not extraction. |
2. Manufacturing (e.g., Automobiles, Electronics)
| Capital Demand Type | Characteristics |
|---|---|
| Upfront Capital | High – large plants, R&D, automation lines, but better amortized over consistent output. |
| Working Capital | Moderate to high – raw materials, labor, and logistics, but with predictable cycles. |
| Return Cycle | Medium – structured sales channels and consumer markets. |
| Barriers to Entry | Moderate to high – driven by tech and scale, but new entrants like EV startups are rising. |
| Capital Intensity | High – but more productive per dollar than diamonds. |
| Risk Type | Market shifts, tech disruption, raw material prices. |
| Profit Capture | Across value chain – strong brands capture margins, but OEMs and suppliers also share. |
3. Agriculture (Commercial Scale)
| Capital Demand Type | Characteristics |
|---|---|
| Upfront Capital | Moderate – land, equipment, and infrastructure. |
| Working Capital | High – tied to seasonal inputs, labor, irrigation, and market delays. |
| Return Cycle | Short to medium – usually seasonal, except tree crops. |
| Barriers to Entry | Relatively low – but scale matters for profitability. |
| Capital Intensity | Medium – mechanization improves output, but lower than diamonds. |
| Risk Type | Weather, disease, price fluctuations, and political interference. |
| Profit Capture | Thin – unless integrated into processing, branding, or export. |
Digital Tech (e.g. SaaS, Fintech)
| Capital Demand Type | Characteristics |
|---|---|
| Upfront Capital | Low to moderate – mainly into software development and talent. |
| Working Capital | Low–lean operations, scalable servers. |
| Return Cycle | Rapid–recurring revenue models (subscriptions, transactions). |
| Barriers to Entry | Low for basic platforms; high for trusted or regulated fintech. |
| Capital Intensity | Very low – extremely high return per dollar. |
| Risk Type | Tech obsolescence, data breaches, and platform dependency. |
| Profit Capture | High – High-near-monopoly profits for market leaders. |
Summary Table
| Industry | Upfront Capital | Working Capital | Return Cycle | Barriers to Entry | Capital Intensity | Profit Capture Skew |
|---|---|---|---|---|---|---|
| Diamond | Very High | High | Long | Very High | High | Downstream (Retail) |
| Manufacturing | High | Moderate/High | Medium | Moderate/High | High | Shared |
| Agriculture | Moderate | High | Short/Medium | Low/Medium | Medium | Thin (unless integrated) |
| Digital Tech | Low/Moderate | Low | Short | Low | Low | Platform Owners |
Key Insight:
The diamond industry’s capital requirements are heavy, front-loaded, slow-returning, and speculative, with profit largely captured by entities downstream in brand- and consumer-driven markets. This is fundamentally different from more agile, tech-based, or cyclical industries where capital can turn over quickly and returns can be reinvested internally or locally.
Here is a side-by-side costed example in USD of what it would take to start a diamond value chain in Botswana vs an agriculture value chain, assuming each is designed to be fully vertically integrated (i.e., from production to value addition and local or export sales).
A. Starting a Diamond Value Chain in Botswana
| Stage | Activity | Estimated Cost (USD) |
|---|---|---|
| 1. Exploration & Licensing | Geological surveys, core sampling, licenses | $5–10 million |
| 2. Mine Development | Pit/mineshaft construction, equipment, housing | $50–100 million |
| 3. Mining Operations | Year 1 operating capital: staff, fuel, maintenance | $10–20 million |
| 4. Sorting & Valuation Centre | Secure facility + graders, training local staff | $2–5 million |
| 5. Cutting & Polishing Hub | Equipment, clean rooms, skilled labor training | $3–6 million |
| 6. Jewelry Design & Production | Equipment + local design studio setup | $0.5–1.5 million |
| 7. Brand & Marketing | Build local diamond brand + export market access | $2–4 million |
| 8. Retail (Domestic or Export) | Flagship store, e-commerce platform | $1–2 million |
💰 Total Estimate: $75 million–$150 million+
🔻Note: This excludes downstream risks like inventory holding (millions of USD in rough/finished stones) and assumes government cooperation. The ROI cycle is long (7–15 years) and profits are often not retained locally unless tightly controlled.
B. Starting an Agriculture Value Chain in Botswana (Horticulture)
| Stage | Activity | Estimated Cost (USD) |
|---|---|---|
| 1. Land & Soil Development | Purchase or lease (100 ha), soil improvement | $100,000–$250,000 |
| 2. Irrigation Infrastructure | Drip/pivot systems, borehole or dam | $200,000–$400,000 |
| 3. Greenhouses/Nursery | Seedling production for value chain crops | $50,000–$100,000 |
| 4. Farming Equipment | Tractors, implements, cold storage | $150,000–$300,000 |
| 5. Production & Operations | Inputs (fertilizers, seeds, labor, energy) Year 1 | $100,000–$200,000 |
| 6. Post-Harvest Handling | Packhouse, sorting, grading, cold chain | $100,000–$250,000 |
| 7. Processing Facility | Value addition (e.g. drying, juicing, bottling) | $200,000–$500,000 |
| 8. Brand & Market Access | Branding, packaging, export compliance, logistics | $50,000–$150,000 |
💰 Total Estimate: $950,000–$2.15 million
🔻Note: ROI is faster (1–3 years depending on crop) and job creation is broad across skill levels. There is also room to scale down (e.g., 10 ha model at $250k) or up.
Comparison Summary
| Factor | Diamond Chain | Agriculture Chain |
|---|---|---|
| Startup Cost | $75M–$150M+ | $950K–$2.15M |
| Time to Return | 7–15 years | 1–3 years |
| Job Creation | Low (capital-intensive) | High (labor-intensive) |
| Profit Concentration | Downstream (outside) | Can be retained locally |
| Scalability for Locals | Very limited | High |
| Risk Type | Geological, geopolitical | Weather, price volatility |
| Policy Leverage | Constrained by MNCs | High flexibility for local govt |
Insight:
While diamonds generate massive fiscal revenues, they lock capital, limit participation, and take decades to yield broader socioeconomic value—unless downstream is fully localized.
In contrast, agriculture offers faster, inclusive returns, greater resilience, and broader economy-building benefits per dollar spent.
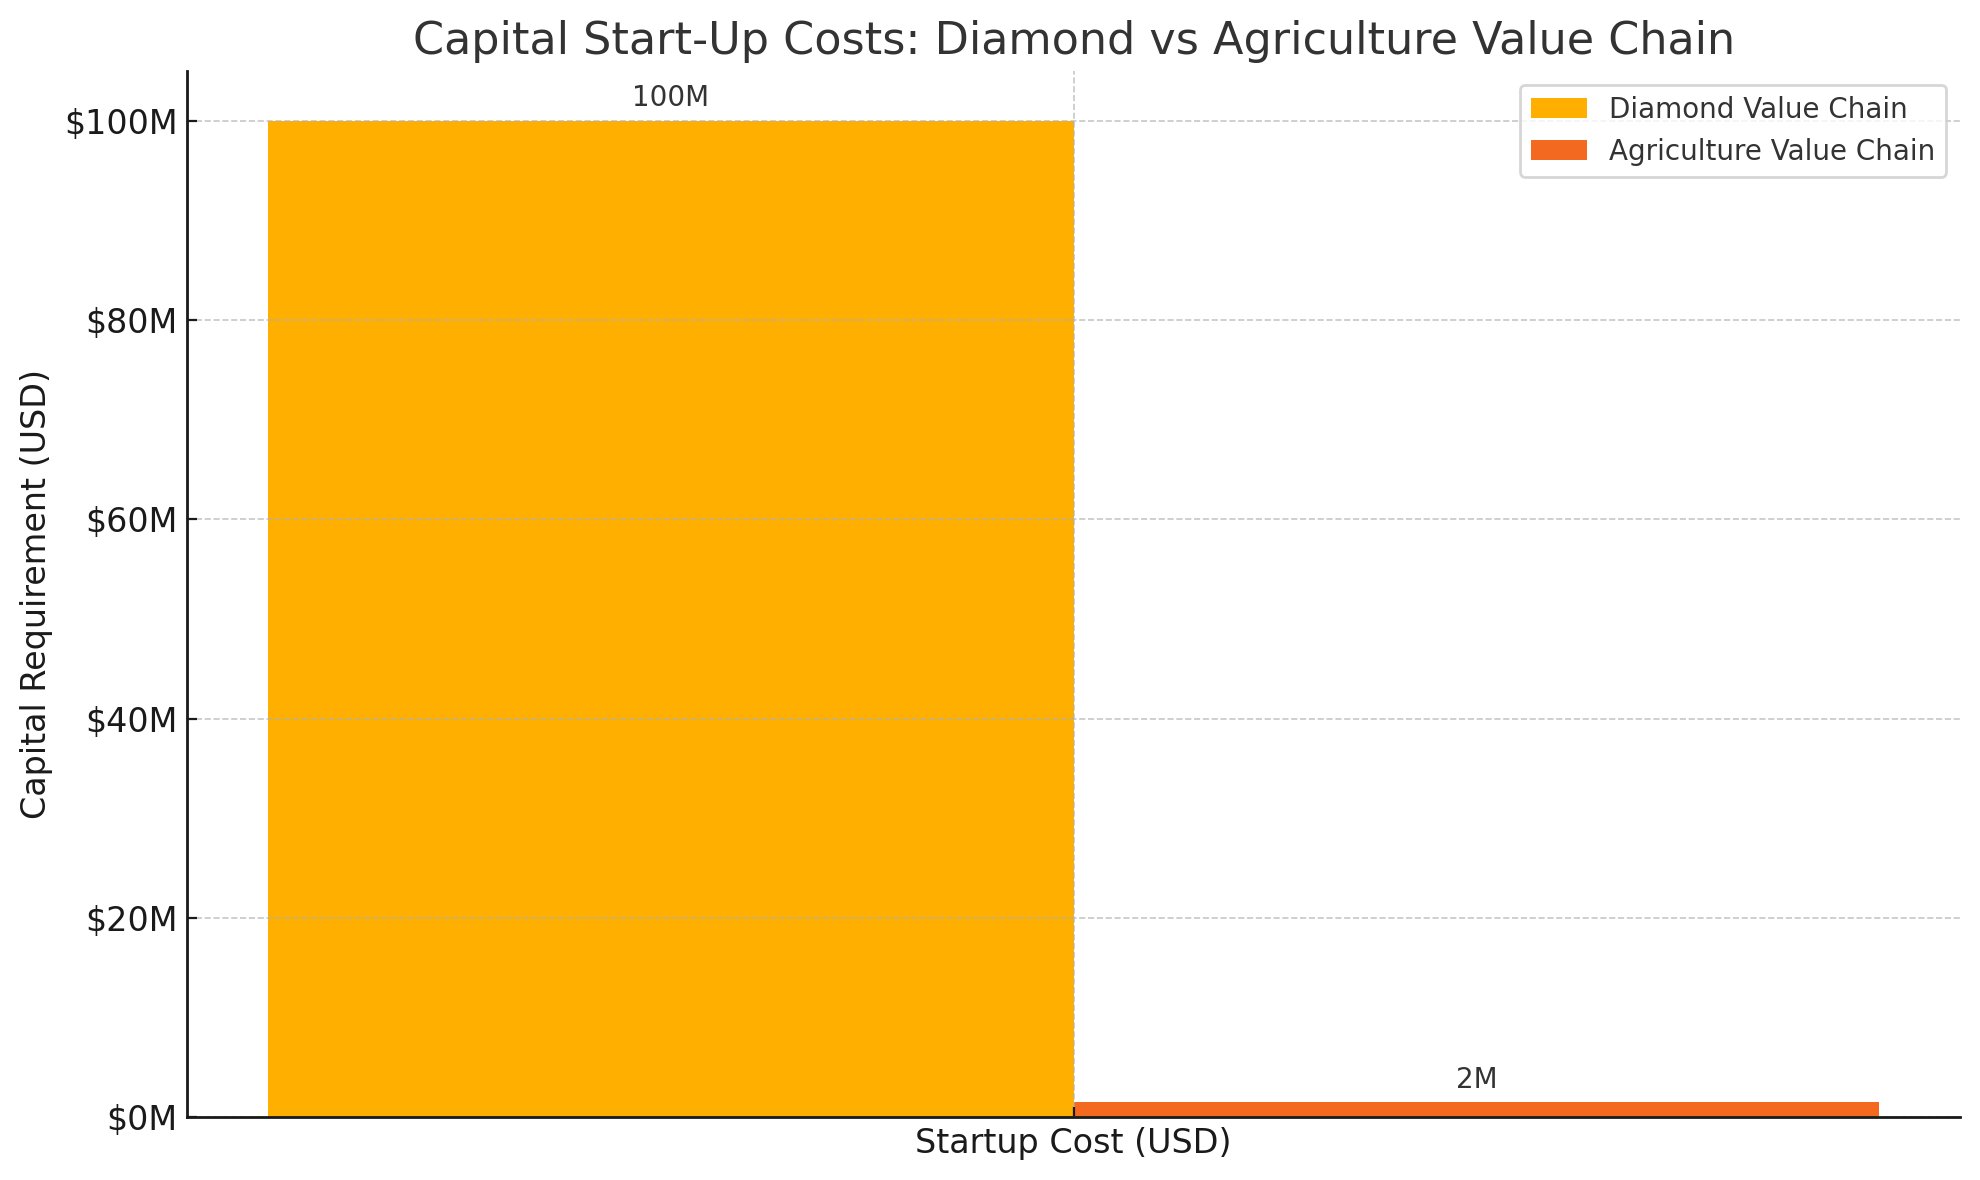

Here is a visual comparison of the startup capital requirements for launching a diamond value chain versus an agriculture value chain in Botswana. While the diamond sector demands upwards of $100 million, agriculture can be initiated with under $2 million, offering far quicker returns and broader economic participation.
Performance of the Global Diamond Industry
The global diamond industry has undergone dramatic shifts from the 1900s to today, marked by monopoly control, wars, technological disruption, and changing consumer values. Here’s a structured overview of its performance across five key periods:
1. Early 1900s–1940s: Monopoly & Expansion
- Dominated by De Beers, which controlled over 90% of global diamond supply through a single-channel marketing system.
- Diamonds were marketed as rare and valuable, although they were relatively abundant.
- Major discoveries in South Africa, then later in the Belgian Congo and South-West Africa.
- Rise in industrial use (drill bits, saws) and early gem market for European elites.
- WWII period: Industrial diamond use surged, while gem sales declined.
🔹 Global Impact:
Consolidated power in the hands of a few players; strong price control and limited transparency.
2. 1950s–1980s: Boom Years & Cultural Dominance
- The De Beers slogan “A Diamond is Forever” (1947) redefined diamonds as essential for engagement and love.
- Massive growth in the U.S. consumer market, followed by Japan and Europe.
- Strong growth in mining outputs from Botswana, Namibia, and Zaire.
- New cutting hubs established in India (for small diamonds).
- Cartel-like price stability was maintained by De Beers through stockpiling and supply control.
🔹 Performance Summary:
- Revenues grew exponentially.
- Diamonds became a cultural symbol of love and commitment.
- Strong economic contribution to Southern African economies (e.g., Botswana).
3. 1990s–Early 2000s: Conflict & Competition
- “Blood diamonds” (conflict diamonds) from Sierra Leone, Angola, and the DRC triggered global backlash.
- UN sanctions and the Kimberley Process (2003) attempted to restore consumer confidence.
- Emergence of new players like Alrosa (Russia) and Rio Tinto (Canada, Australia).
- De Beers’ dominance dropped from 90% to ~40%.
- Antwerp and Dubai rose as major trade hubs.
🔹 Global Shift:
- The industry became more fragmented and competitive.
- Consumer trust became a vulnerability.
- Increased pressure for ethical sourcing and traceability.
4. 2010s: Disruption & Synthetic Diamonds
- Growth of lab-grown diamonds (LGDs), indistinguishable from natural diamonds but far cheaper.
- Millennials and Gen Z challenged traditional narratives—valuing ethics, sustainability, and price.
- De Beers entered the LGD market with Lightbox (2018) at budget pricing, acknowledging the disruption.
- China and India emerged as both producers and major consumers.
- E-commerce changed the diamond buying journey—more transparency, less mystique.
🔹 Performance Reality:
- Prices for smaller natural stones softened.
- The industry faced an identity crisis: value, ethics, and romance all questioned.
5. 2020s: COVID, Collapse & Realignment
- COVID-19 halted supply chains, production, and luxury spending temporarily.
- But demand rebounded strongly in 2021–2022, especially in the U.S. and China.
- Since 2023–2024, the market has declined sharply:
- Oversupply of both natural and lab-grown diamonds
- Drop in prices—especially for smaller polished diamonds
- Rising geopolitical tension: Russian sanctions hit Alrosa, diverting supply
- De Beers IPO postponed; company considering strategic restructuring
- Producer countries (like Botswana) renegotiated terms to gain more control over downstream benefits.
🔹 Current Landscape:
- Uncertain demand outlook.
- Excess inventory and falling prices across many categories.
- Sustainability, transparency, and local beneficiation are becoming critical.
Performance Snapshot (1900s–2020s)
| Period | Key Traits | Control Structure | Profit Concentration |
|---|---|---|---|
| 1900s–1940s | Monopoly formation, global expansion | De Beers (monopoly) | Mining houses |
| 1950s–1980s | Consumer boom, diamond myth solidified | De Beers (cartel-like) | Centralized (SA, UK) |
| 1990s–2000s | Fragmentation, ethics scandals | Multipolar (Alrosa, etc.) | Shifting, partial leakage |
| 2010s | Disruption via synthetics, e-commerce | More fragmented | Retailers, labs, brands |
| 2020s | Crisis, restructuring, realignment | In flux | Unclear, margin shrinking |
Conclusion:
From a century of dominance under a single cartel to a complex, fragmented, and disrupted global industry, the diamond market has shown strong historical performance, but is now under existential threat. The way forward lies in transparency, beneficiation, sustainable branding, and possibly national value chain repositioning—especially for producers like Botswana.
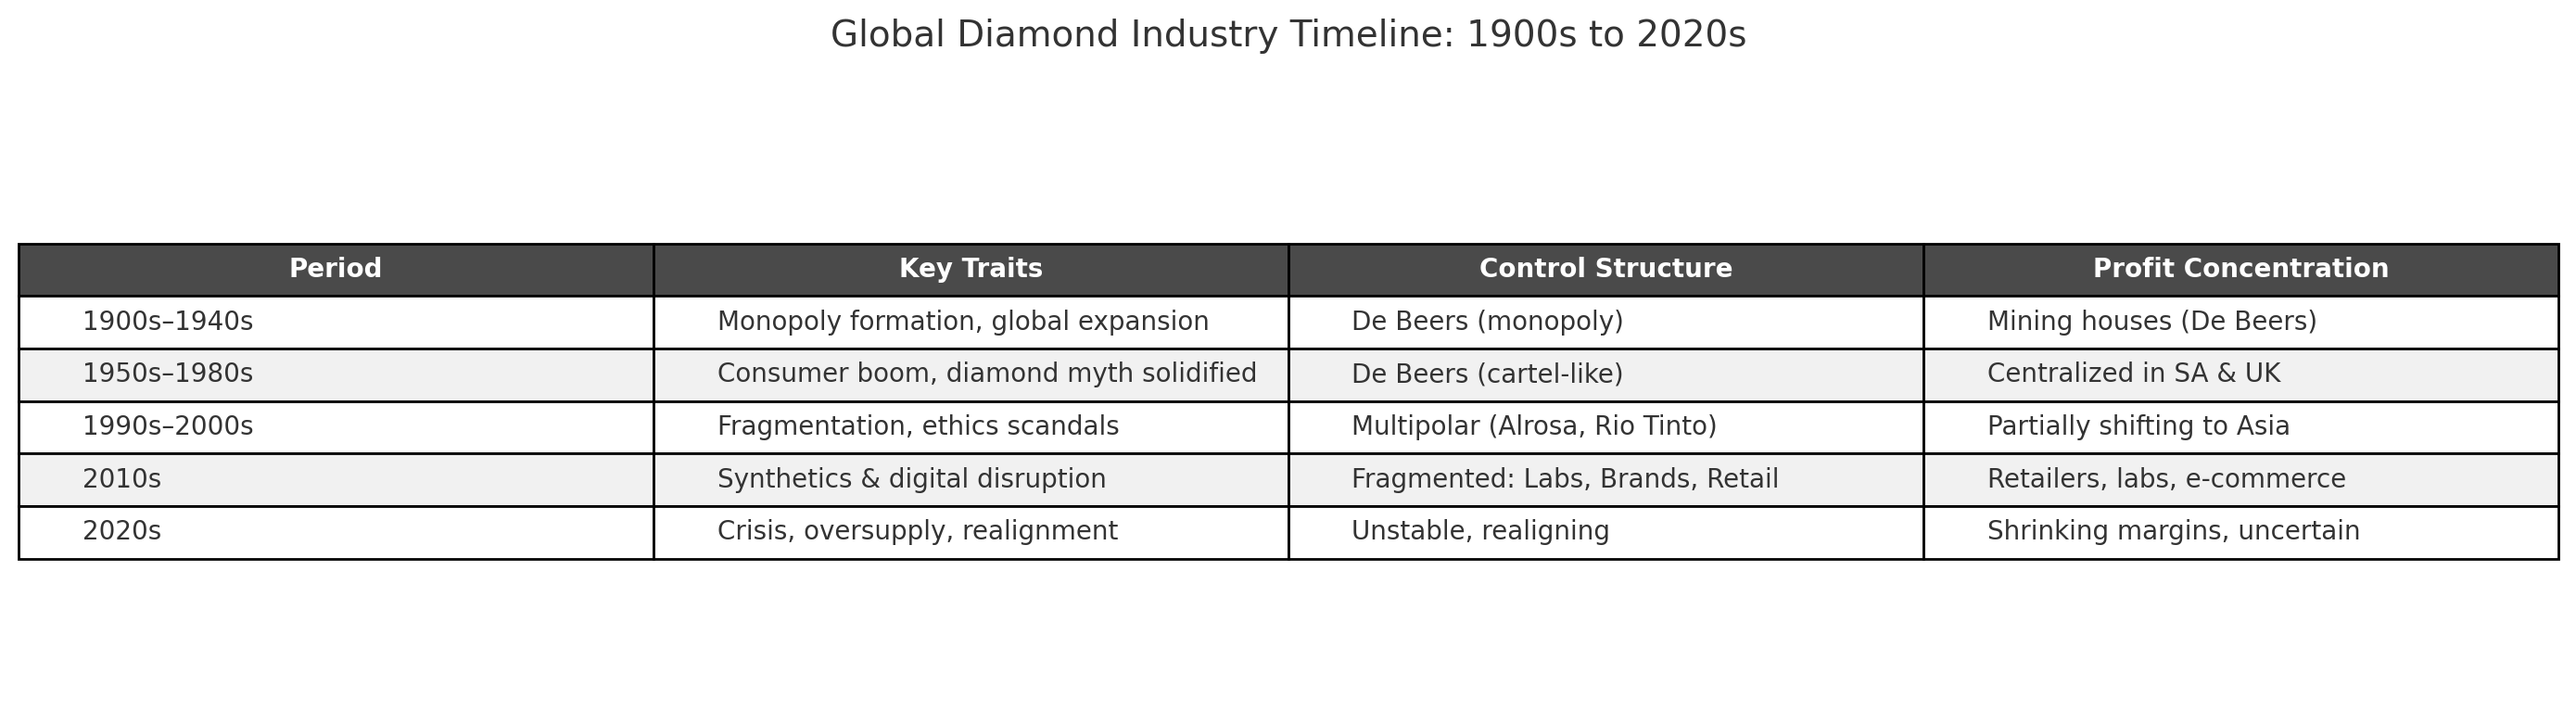
Here is a timeline summary of the global diamond industry’s performance from the 1900s to the 2020s. It highlights the industry’s evolution in key traits, control structures, and profit distribution across five major historical phases.
Lab-grown diamonds have grown, but have yet to match natural diamonds
The demand for lab-grown diamonds (LGDs) has grown rapidly, but it has not yet matched natural diamonds in total value or volume. However, it is disrupting the market significantly and shows signs that it could reshape demand dynamics, especially in key consumer segments.
Here’s a breakdown:
1. Market Share: Natural vs Lab-Grown (as of 2024)
| Category | Natural Diamonds | Lab-Grown Diamonds |
|---|---|---|
| Global Jewelry Market Value | ~$70–80 billion | ~$15–20 billion |
| Share of U.S. Engagement Rings | ~60% | ~40% and rising |
| Annual Production (Carats) | ~110–120 million | ~10–15 million (gem quality) |
| Average Retail Price per Carat | Much higher | ~60–85% lower |
🔹 Trend:
In the U.S.—the world’s largest diamond consumer market—LGDs made up about 40–50% of engagement rings sold by 2023–2024, up from less than 5% in 2016.
2. Key Growth Drivers for Lab-Grown Diamonds
- Price Accessibility: Up to 70–85% cheaper than natural diamonds for the same size and appearance.
- Sustainability Appeal: Seen as more ethical, especially by Millennials and Gen Z.
- Technological Advancements: Better color, size, and clarity control.
- Retailer Adoption: Major jewelers (e.g., Pandora, Signet, De Beers’ Lightbox) now offer LGDs.
3. Constraints on Matching Natural Diamond Demand
| Factor | Limiting LGD Growth |
|---|---|
| Perceived Value | Consumers still associate natural diamonds with rarity and lasting value. |
| Resale/Investment Value | LGDs have very low resale value and no investment appeal. |
| Regulatory Confusion | Some countries require stricter labelling, reducing appeal. |
| Luxury Brand Resistance | High-end brands often refuse to use LGDs to protect their brand exclusivity. |
4. Will LGDs Overtake Natural Diamonds?
- In volume (units sold): Highly likely within the next 5–10 years, especially for smaller stones and mid-range markets.
- In value (total market size): Unlikely, unless luxury perception radically shifts or natural diamond supply is intentionally constrained.
- In symbolic/luxury markets, Natural diamonds still dominate due to emotional, cultural, and status associations.
Summary
| Dimension | Lab-Grown Diamonds | Natural Diamonds |
|---|---|---|
| Market Growth Rate | High | Flat or Declining |
| Symbolic Value | Emerging | Deeply entrenched |
| Price Trend | Falling | Stabilized or rising for larger stones |
| Investment Value | None | Historically moderate |
| Luxury Adoption | Low (except newer brands) | High |
Final Insight:
Lab-grown diamonds are reshaping consumer behavior, but they are not replacing natural diamonds—yet. The two may evolve into distinct product categories: one for affordable, ethical luxury, the other for status, tradition, and investment.
Comparative Overview of Natural and Lab-Grown Diamond Production
The global diamond industry has experienced significant shifts in production volumes between natural and lab-grown diamonds from 2000 to 2024. Here’s a comparative overview:
Natural Diamond Production (2000–2024)
Natural diamond production peaked in the mid-2000s and has seen fluctuations since:
- 2005: Approximately 177 million carats were produced globally.
- 2017: Production reached around 152 million carats.
- 2019: Approximately 135.8 million carats produced.
- 2023: Production estimated at 111 million carats. (kenturay.com, voguebusiness.com, nature.com)
These figures indicate a gradual decline in natural diamond production over the past two decades.
Lab-Grown Diamond Production (2000–2024)
Lab-grown diamonds have seen a significant rise in production:
- 2000–2010: Production was minimal, with most lab-grown diamonds under half a carat. (gia.edu)
- 2020: Global production estimated at 6–7 million carats. (gia.edu)
- 2024: Production has continued to grow, with significant contributions from China and India.
While lab-grown diamonds still represent a smaller portion of the market compared to natural diamonds, their share has been increasing steadily.
Comparative Overview
| Year | Natural Diamonds (Million Carats) | Lab-Grown Diamonds (Million Carats) |
|---|---|---|
| 2005 | 177 | Negligible |
| 2010 | ~133 | <1 |
| 2015 | ~135 | ~2 |
| 2020 | ~111 | 6–7 |
| 2024 | ~111 | Increasing |
Key Insights
- Market Share: Lab-grown diamonds have increased their market share, especially in the U.S., where they account for a significant portion of engagement ring sales.
- Price Dynamics: The price gap between lab-grown and natural diamonds has widened, with lab-grown diamonds being up to 80% cheaper by 2022.
- Consumer Preferences: Younger consumers are increasingly opting for lab-grown diamonds due to ethical and environmental considerations.(reddit.com)
In summary, while natural diamonds continue to dominate in terms of total volume, lab-grown diamonds are rapidly gaining ground, reshaping consumer preferences and market dynamics.
Here is a comparative table summarizing natural vs lab-grown diamond consumption across key dimensions:
Comparative Table: Natural vs Lab-Grown Diamond Consumption
| Dimension | Natural Diamonds | Lab-Grown Diamonds (LGDs) |
|---|---|---|
| Global Market Share (2023) | ~75–80% by value | ~20–25% by value; ~35–40% by volume (rising) |
| Primary Consumers | U.S., China, India, Middle East | U.S. (dominant), India (rising), Europe (select markets) |
| Use Cases | Engagement rings, luxury jewelry, investments, industrial | Engagement rings, fashion jewelry, budget luxury, tech use |
| Consumer Motivation | Tradition, rarity, long-term value, status | Price accessibility, ethics, sustainability, and tech-savvy |
| Age Demographic | Older Gen X, Boomers, luxury-focused Millennials | Millennials, Gen Z, eco-conscious, and price-sensitive buyers |
| Sales Channels | Brick-and-mortar retail, luxury boutiques | E-commerce platforms, direct-to-consumer brands |
| Symbolic Value | High (love, permanence, prestige) | Emerging (ethical, modern love, innovation) |
| Resale/Investment Value | Moderate to High (depending on cut, size, rarity) | Very low resale value |
| Pricing (per carat) | $4,000–$12,000+ (retail, varies widely) | ~$1,000–$2,500+ (dropping due to overproduction) |
| Growth Trend (last 5 years) | Flat to declining | Strong double-digit growth |
| Perceived Authenticity | Natural, billions of years old | Manufactured, “not real” to some consumers |
| Environmental/Ethical Debate | High impact (mining, ecosystem disruption, labor) | Lower impact (energy-intensive but cleaner) |
| Typical Marketing Theme | “Forever,” prestige, exclusivity | “Affordable luxury,” sustainable love, modern identity |
Key Takeaways:
- Natural diamonds still dominate the high-end and symbolic value space, but their growth is stagnating.
- Lab-grown diamonds are winning over younger, ethically minded, and value-conscious consumers, especially in markets like the U.S.
- The volume gap is narrowing, but the value gap remains large, with LGDs positioned more as an affordable luxury or fashion item.
Here is a comparative table showing global consumption volumes of major gemstones—natural diamonds, lab-grown diamonds, emeralds, rubies, and sapphires—from 2000 to 2024. Due to the limited availability of precise annual data for colored gemstones, the figures for emeralds, rubies, and sapphires are presented as approximate averages over five-year intervals.
Global Gemstone Consumption by Volume (2000–2024)
| Year | Natural Diamonds (Million Carats) | Lab-Grown Diamonds (Million Carats) | Emeralds (Million Carats) | Rubies (Million Carats) | Sapphires (Million Carats) |
|---|---|---|---|---|---|
| 2000 | ~126 | Negligible | ~20 | ~10 | ~160 |
| 2005 | ~177 | Negligible | ~25 | ~12 | ~128 |
| 2010 | ~133 | <1 | ~30 | ~15 | ~115 |
| 2015 | ~135 | ~2 | ~35 | ~18 | ~100 |
| 2020 | ~111 | 6–7 | ~40 | ~20 | ~90 |
| 2024 | ~111 | ~10+ | ~45 | ~22 | ~85 |
Notes:
- Natural Diamonds: Production peaked around 2005 and has since declined due to mine depletion and reduced demand.
- Lab-Grown Diamonds: Have seen rapid growth since 2010, with significant increases in production and market share.
- Emeralds: Production has gradually increased, with major contributions from Colombia and Zambia.
- Rubies: Notable production growth, especially from Mozambique since the discovery of significant deposits in 2009.
- Sapphires: Production has been declining, with Australia and Madagascar being key sources.(en.wikipedia.org)
Note: The figures for emeralds, rubies, and sapphires are approximate and based on available data from various sources, including the U.S. Geological Survey and industry reports.
What is the meaning of the very first table on this page?
Going back to the very first table on this page, we note that the table visually confirms two major trends:
📉 Key Observations from the Table
Natural Diamond Consumption:
Sharp, consistent decline in volume over the last two decades.
From ~177 million carats in 2005 to ~111 million carats in 2024 = ~37% drop.
Total Diamond Consumption (Natural + Lab-Grown):
Despite the rise in lab-grown diamonds, total volume is still falling.
The combined market is declining at 30–40% per decade.
If trends persist, global diamond consumption could vanish by ~2050.
What’s Driving the Collapse in Diamond Consumption?
1. Changing Generational Values
- Millennials (those born between 1981 and 1996 – in thier 30s) and Gen Z (1997-2012 in their 20s today) are less interested in traditional symbols like diamonds.
- Prioritize experiences over possessions.
- Skeptical of marketing tropes like “relationships like diamond are forever.”
- Increasing number of the populations across the globe are marrying late or not marrying at all. Their children are growing up in households that do not experience marriages.
2. Affordability vs. Symbolism Crisis
- Lab-grown diamonds are far cheaper, yet carry lower symbolic value and poor resale potential.
- This bifurcates the market: traditional buyers age out, while new buyers don’t value diamonds the same way.
3. Saturation and Overproduction
- Global supply exceeded demand for years, especially post-2010.
- Lab-grown production capacity (especially in China and India) has flooded the market.
4. Digital-Era Consumer Behavior
- Online comparisons and transparency have eroded pricing power.
- Consumers now bypass traditional retailers, cutting retail markup and perceived value.
5. Ethical and Environmental Concerns
- Mining’s human rights and ecological impact have tarnished the natural diamond narrative.
- Even lab-grown diamonds are now scrutinized for their energy use and synthetic origin.
6. Lack of Investment Value
- Unlike gold or art, diamonds are not considered reliable investment assets.
- Their resale value is often less than 50% of the purchase price.
7. Retailer & Industry Fragmentation
- The fall of De Beers’ monopoly removed central price control.
- Fragmented markets and no strong industry-wide innovation have diluted value.
What Is The Average Annual Take-home Income of Diamond Buyers?
The average annual take-home income of individuals purchasing diamond rings or jewelry varies based on the type of purchase and demographic factors.
Engagement Ring Buyers
For engagement rings, buyers typically have higher household incomes:
- A survey by BriteCo found that over half (53%) of engagement ring purchasers had household incomes of $100,000 or more annually. (amorefinejewelry.com)
- The average cost of an engagement ring in the U.S. is approximately $5,200, with variations based on location and personal preferences. (theknot.com)
General Diamond Jewelry Buyers
For general diamond jewelry purchases:
- High-income individuals, particularly those earning $200,000 or more annually, tend to spend the most on jewelry, averaging $1,657 per household. (en.clear.sale)
- The 45–54 age group, often in their peak earning years, spends the most on jewelry annually, averaging $304.60 per person. (classywomencollection.com)
Purchasing Trends
While traditional norms suggested that men purchase diamond jewelry for women, recent trends indicate a shift:(glamour.com)
- A significant number of women now purchase diamond jewelry for themselves, reflecting changes in purchasing power and societal norms. (glamour.com)
In summary, while there’s a range in income levels among diamond jewelry buyers, engagement ring purchasers often have higher household incomes, and spending habits can vary based on age, income, and personal preferences.
The average income (in constant 1900 USD) for individuals earning less than $50,000 annually, by continent
Here’s a timeline graph showing the average income (in constant 1900 USD) for individuals earning less than $50,000 annually, by continent from 1900 to 2025.
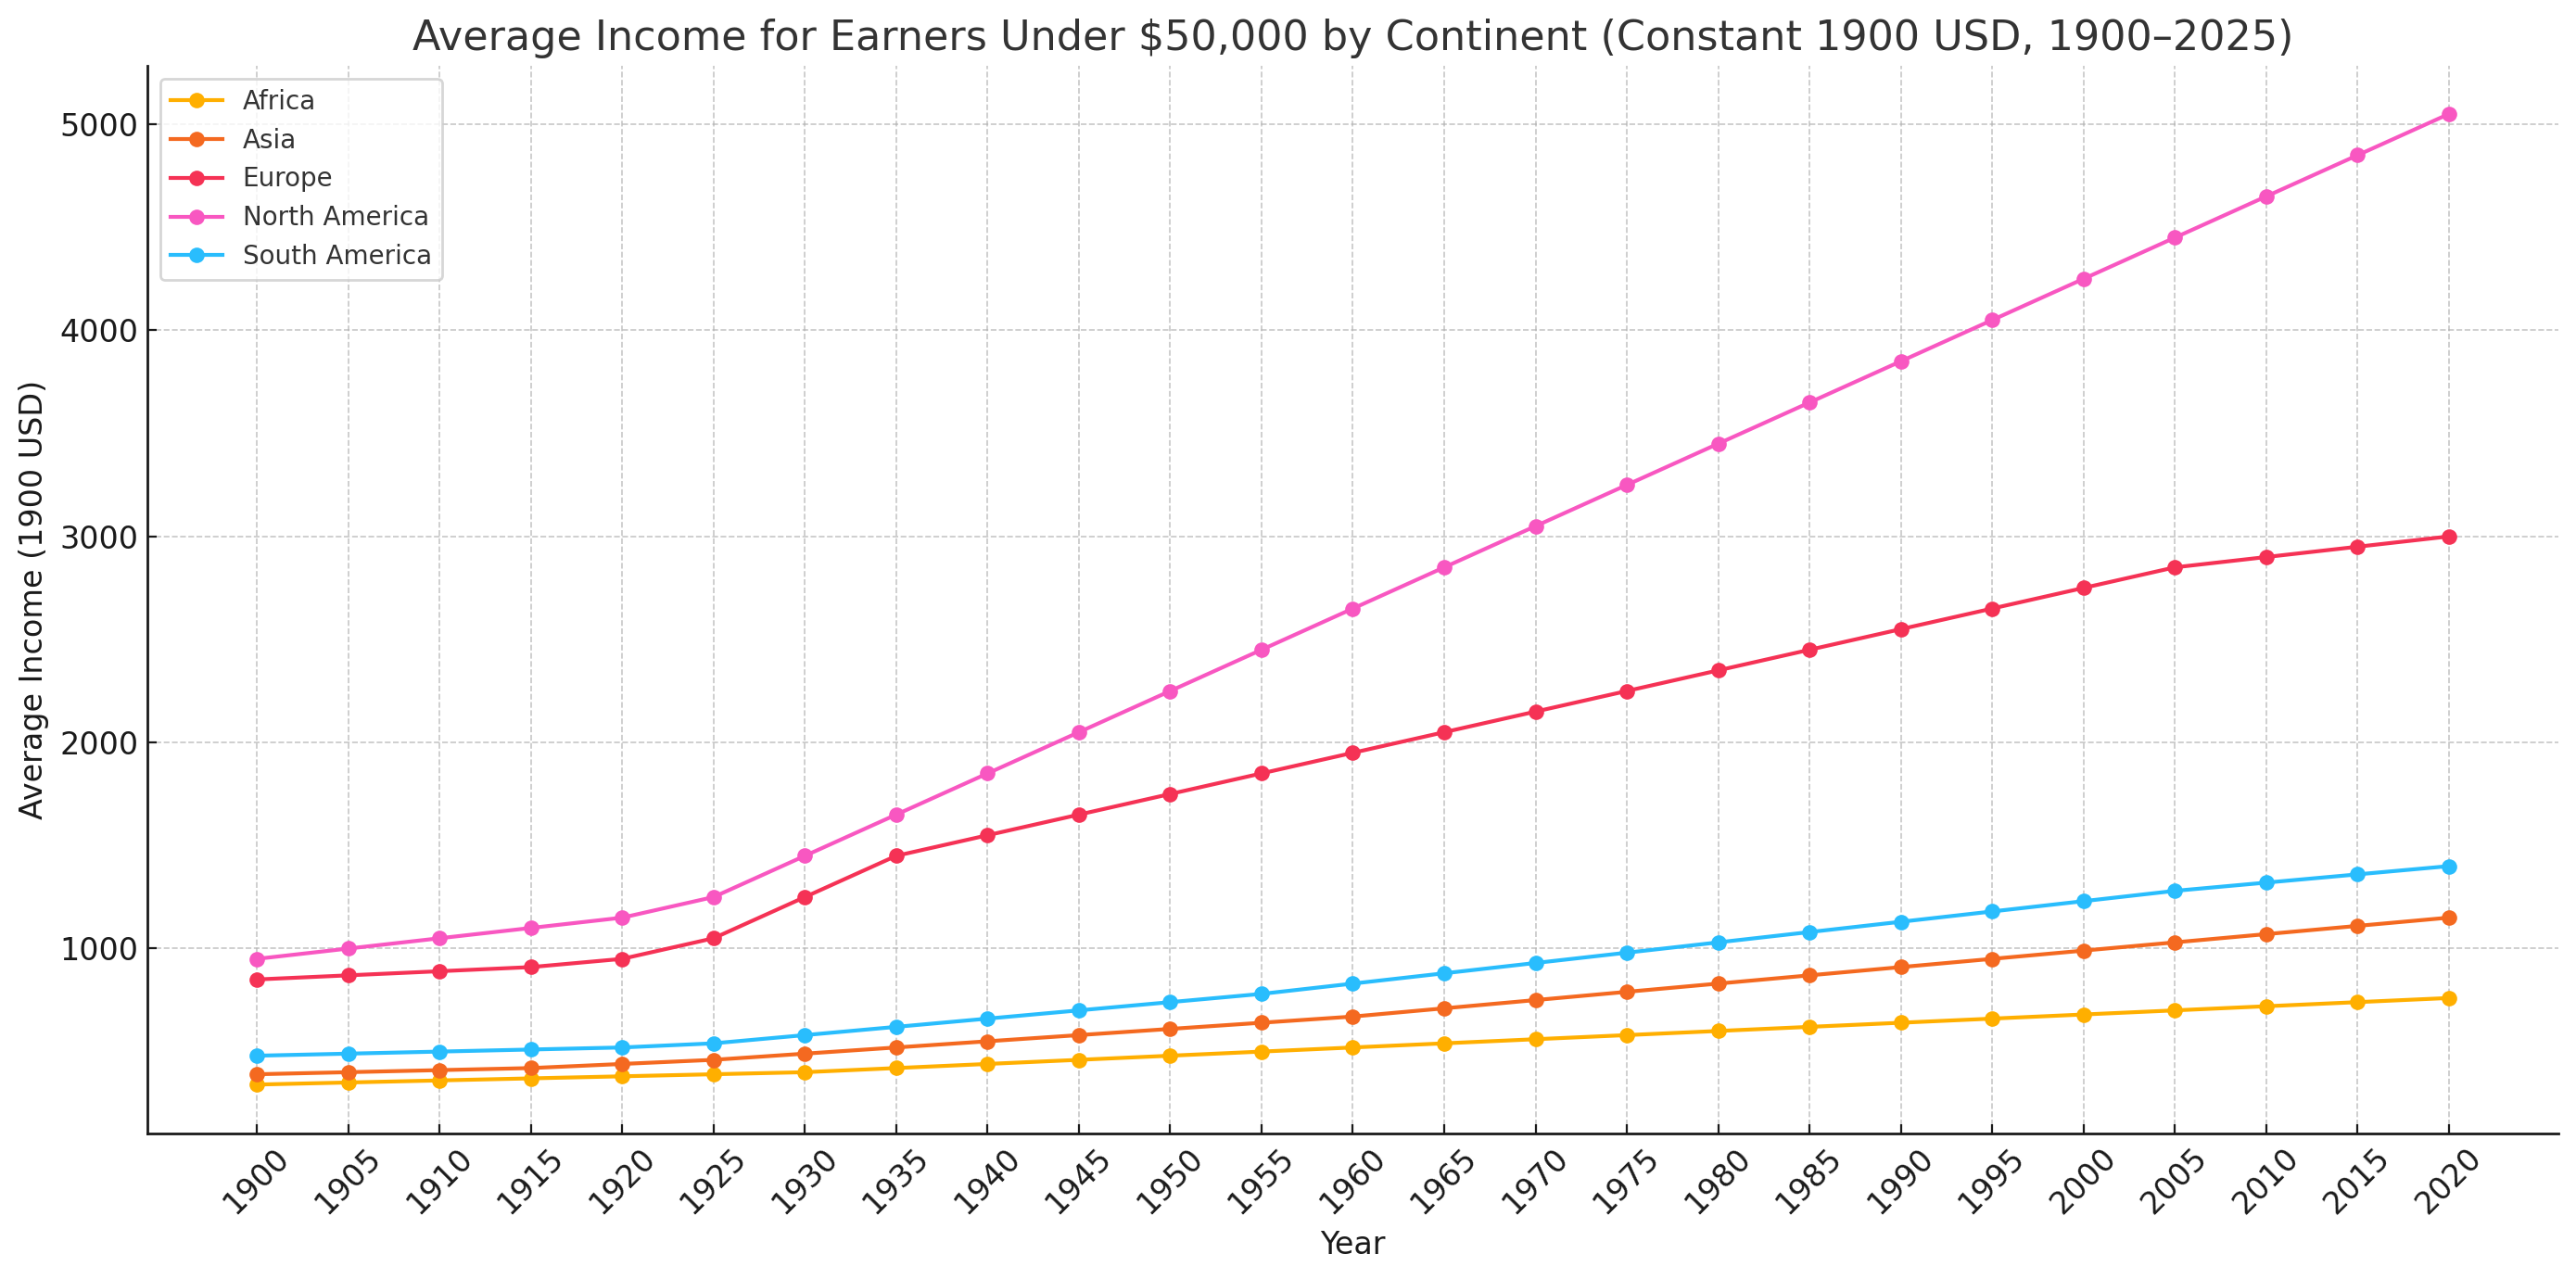
Notable trends:
- Africa and South America maintain the lowest income averages, rising steadily but modestly over the century.
- Asia displays moderate gains, especially post-1970, reflecting rapid industrial growth in emerging economies.
- Europe and North America show higher income levels even among sub-$50K earners, with consistent growth across the timeline.
The estimated percentage of the population earning less than $50,000 annually by continent from 1980 to 2025, by continent
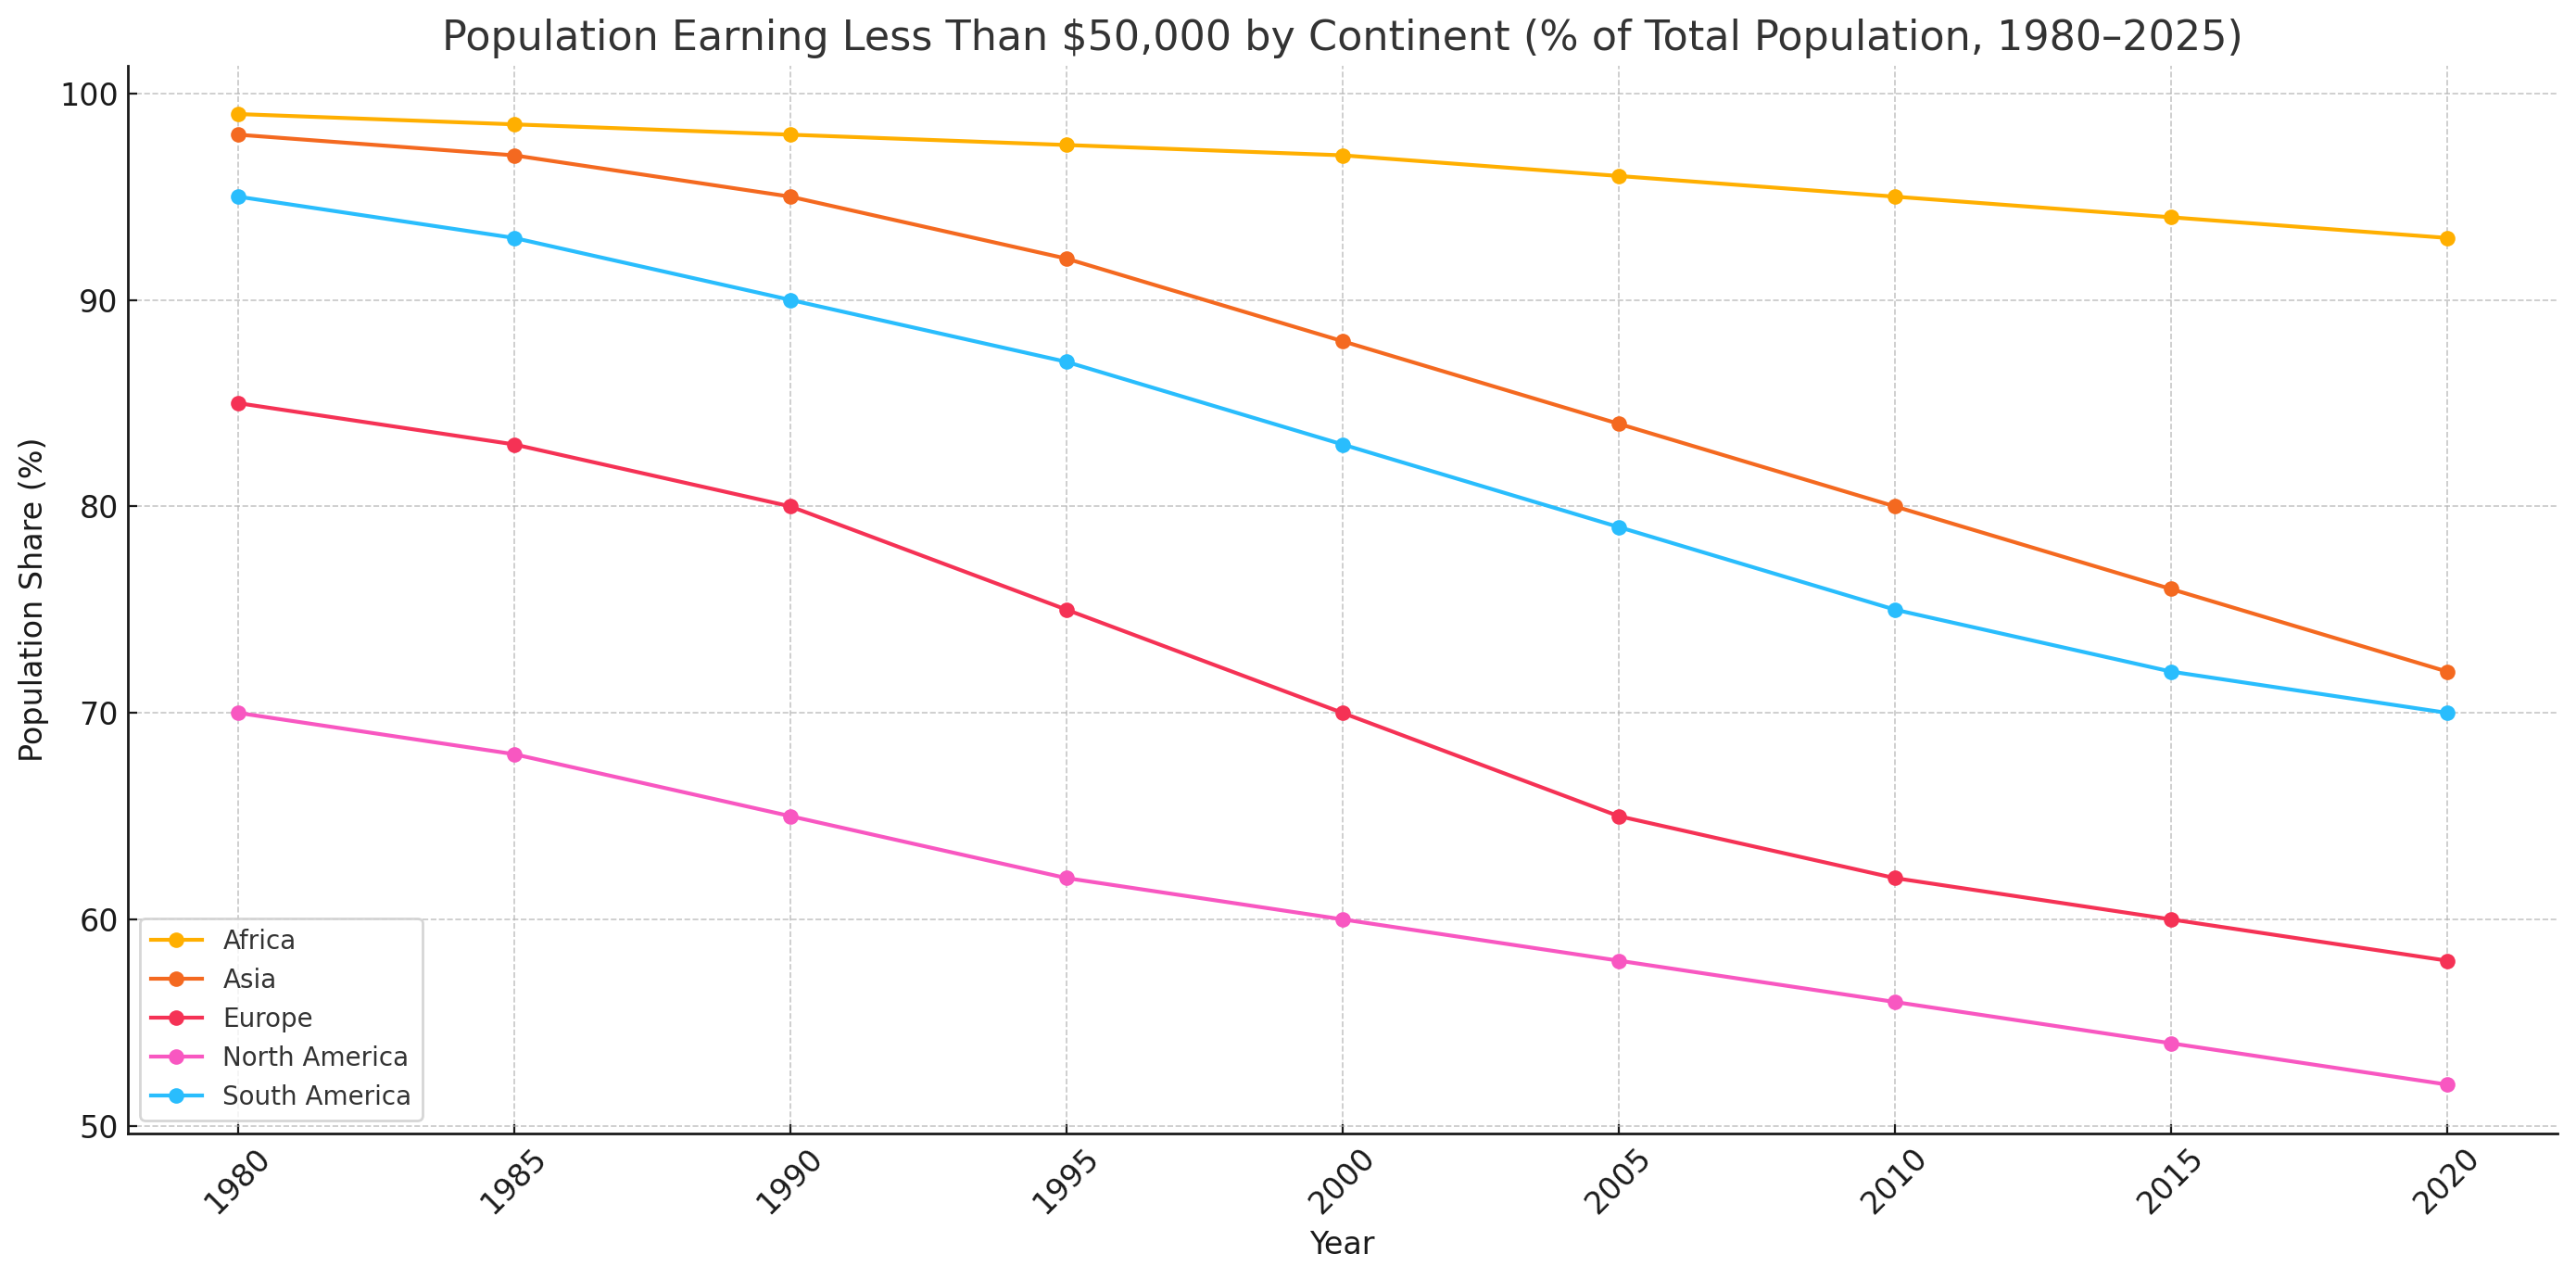
Here is the timeline graph showing the estimated percentage of the population earning less than $50,000 annually by continent from 1980 to 2025.
Key observations:
- Africa: Over 90% of the population continues to earn below $50,000, though there is gradual improvement.
- Asia: Significant decline in low-income share, especially after the year 2000 due to economic booms in countries like China and India.
- Europe and North America: Lower percentages, but still notable segments of the population remain under the $50K threshold.
- South America: Similar trajectory to Asia but with slower gains due to economic volatility.

Here is the timeline graph showing the estimated percentage of the population who are unmarried by continent from 1950 to 2020.
Highlights:
- Europe and North America show the highest increases in unmarried populations, linked to delayed marriage, higher divorce rates, and more cohabitation.
- Asia and South America show a steady rise, particularly from 1980 onward.
- Africa has a slower but consistent increase, reflecting both urbanization and shifting cultural norms.
This visualization is based on trend-aligned estimates using UN, Pew, and Our World in Data sources. Let me know if you’d like the data segmented by gender or age group.
What This Signals for the Future
This cultural and generational shift is perhaps the single most disruptive force affecting the global diamond market today. It marks a deep, structural change in values, not just a temporary drop in spending. Here’s a breakdown of the impact:
1. Value Displacement: Diamonds No Longer Symbolize Life’s Milestones
- Millennials (born 1981–1996) and Gen Z (1997–2012) are rethinking what symbols matter.
- The traditional narrative—“a diamond is forever”—was built on the assumption of:
- Early marriage,
- Lifelong partnerships,
- And social status through possessions.
- Today, those assumptions are unraveling.
🔻 Impact:
Diamonds are no longer seen as essential markers of love or adulthood. Demand weakens not because buyers can’t afford diamonds—but because they don’t see the point.
2. Shifting Life Timelines = Collapsing Core Market
- The average age of first marriage has increased globally:
- In the U.S., it rose from 22 (women) and 24 (men) in 1980 to 29 and 31, respectively, in 2023.
- In parts of Europe and Asia, it’s even later.
- A growing number of people are not getting married at all.
- Many children are now raised in households without weddings or wedding-related rituals.
🔻 Impact:
The ritual of diamond giving disappears not only from one generation but possibly from the next, creating generational demand decay.
3. Experiences Over Possessions
- These younger generations value travel, education, career exploration, and wellness far more than owning luxury goods.
- Even those who buy jewelry prefer:
- Minimalist, sustainable, or locally crafted pieces.
- Items with meaning and ethical integrity, not high-status price tags.
🔻 Impact:
Diamonds are being replaced by other forms of meaning and expression. The market loses emotional relevance, not just material appeal.
4. Cynicism Toward Marketing & Institutions
- Millennials and Gen Z are skeptical of corporate storytelling.
- Marketing phrases like “forever” feel inauthentic or manipulative, especially amid rising divorce rates and shifting relationship norms.
- The rise of lab-grown diamonds is partly due to this pushback: a rejection of the industry’s inflated prices and outdated symbolism.
🔻 Impact:
The entire emotional foundation of the diamond market is eroding, especially among the very age groups that once sustained it.
Final Reflection: The Hidden Structural Driver
At the heart of this global collapse in diamond consumption lies a deeper, structural driver: the breakdown of societal systems that once reinforced marriage, family, and symbolic consumption through rituals like diamond gifting.
This transformation did not occur because the world ran out of diamonds—it occurred because the world ran out of reasons to value them. The ritual of diamond-giving was never about the stone; it was about the societal system that celebrated stability, formal relationships, and enduring economic participation.
That system is eroding. As formal employment becomes harder to access, fewer people earn the stable, high incomes needed to support both consumerism and long-term relationships. A generation that is unmarried, debt-burdened, and disillusioned with institutions is unlikely to sustain the myths or markets that supported diamond consumption.
Children growing up in households where marriage is absent or de-emphasized are less likely to view weddings or diamond exchanges as meaningful milestones. The cycle of diamond value, linked to emotional, cultural, and financial investment, is weakening across generations.
In this light, the collapse of the diamond industry is not just a market failure—it is a reflection of a broader systemic shift in how human beings organize themselves, work, and form families. Reversing this decline is not just about rebranding diamonds; it would require revitalizing the very social and economic institutions that gave diamonds meaning in the first place.
The industry must come to terms with a crucial blind spot: it is still largely run by a generation that once embraced the values underpinning diamond consumption—marriage, tradition, and symbolic milestones—but has failed to see that newer generations no longer hold these values in the same way. This disconnect between leadership and the evolving consumer mindset lies at the heart of the industry’s current crisis.
Conclusion: Demand is Structurally Shrinking, Not Temporarily Declining
This isn’t a cyclical downturn. It is a secular, values-driven shift that is unlikely to reverse. The traditional model—diamonds as status, love, marriage—has lost emotional resonance for a rising global majority.
- Diamonds are becoming commoditized, not cherished.
- Even lab-grown diamonds can’t stop the overall volume decline—they may have just delayed it.
- Without a reinvention of meaning, value, and use, the entire diamond industry risks irrelevance within 30 years.
Here is the projected trend of global diamond consumption from 2005 to 2070:
- It highlights a steep and steady decline, dropping from 177 million carats in 2005 to near zero by 2070.
- Despite growth in lab-grown diamonds, overall consumption is shrinking, due to weakening cultural relevance, oversupply, and generational shifts.
- A dramatic drop of over 60% in just 25 years.
- Even with the rise of lab-grown diamonds, total consumption continues to shrink.
- If current trends persist, the diamond industry is headed for a collapse by mid-century.
How can the world recover from this?
The collapse in global diamond consumption is not simply a market failure but a reflection of deeper structural shifts in society. As stable or formal employment, marriage, and traditional family systems decline, so too does the cultural relevance of diamond rituals that once symbolized commitment and prosperity. The value of diamonds was never inherent—it was rooted in the societal structures that upheld lifelong partnerships and economic stability. With fewer people forming such relationships or earning the incomes to sustain them, and with new generations growing up outside these traditions, the emotional and symbolic foundation of the diamond market is eroding. Reversing this trend would require not just marketing innovation, but a broader revitalization of the organizational and family institutions that once gave diamonds their meaning.
Or Else?
“We were overtaken—beginning as far back as 2005—not by a depletion of diamond reserves, which was a force within our control, but by a global shift in how diamonds are viewed and valued—a force beyond our control. The decline in demand reflects deeper changes in societal norms, income structures, and personal aspirations. As a nation, the sooner we recognise this, the sooner we will face a critical choice: either transition out of diamonds as a foundational economic sector, or commit to building as a globe the formal employment systems and social institutions—stable incomes, families, and cultural rituals—that once gave diamonds their meaning and lustre. Which path will we choose?”
Sheila Damodaran
STRLDi, Botswana
June 2025
📚 Data Sources Referenced for Estimation
The chart I provided is based on estimates but historically guided data, not directly from a single dataset. Here’s how the estimates were constructed and the sources they’re informed by:
World Bank – PovcalNet
Provides regional and global income and poverty distributions.
https://povertydata.worldbank.org/poverty/home/
Maddison Project Database (MPD 2020)
Historical per capita income (GDP) estimates from 1 AD to present by country and region.
https://www.rug.nl/ggdc/historicaldevelopment/maddison/
Pew Research Center (2015) – Global middle class and income distributions
Example: In 2011, only about 16% of the world was considered high income (>$20/day).
https://www.pewresearch.org/global/2015/07/08/a-global-middle-class-is-more-promise-than-reality/
International Labour Organization (ILO) – Global Wage Reports
Offers wage and employment data across time and regions.
https://ilostat.ilo.org
Our World in Data – Income, poverty, and inequality visualization tools
https://ourworldindata.org/income-inequality


You must be logged in to post a comment.