Systems at Edge: The Five-Card Masterstroke & The Shift to Abundance
The Ground Indonesia Is Moving
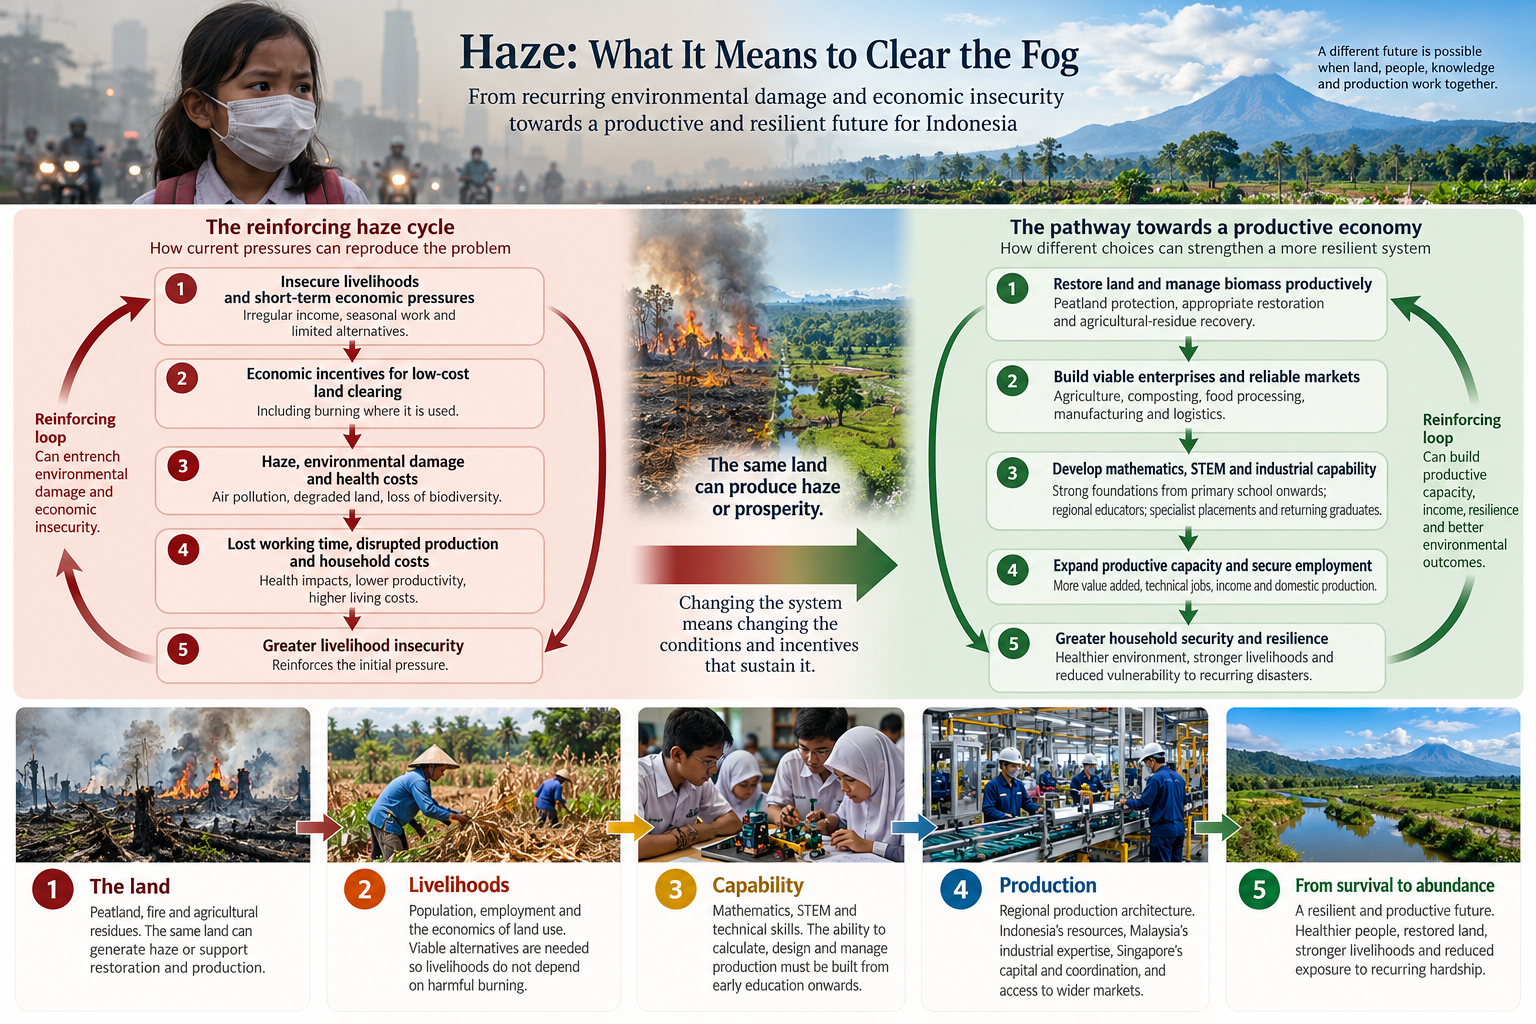
When the system changes, the smoke clears. It does not have to be forever.
Author’s Note:
I lived in Singapore for almost 20 years, experiencing the haze until I left in 2008. Nearly 20 years later in 2026, the region continues to experience recurring haze and its consequences.
That passage of time prompted me to ask: why does the problem persist, and what would it take to change the system that reproduces it?
Recent conversations, including those with Melissa Aratani Kwee, Eileen Lim, Miftahul Huda and Jack Sim, prompted us to put these thoughts to paper.
I have proposed assembling a team, including Indonesian partners, to explore how economic restructuring could address both unemployment and recurring haze. I would be happy to share STRLDi’s study as a starting point for this work.
Melissa’s post: How to Solve the Haze Forever
Relief is essential. Accountability is essential. But lasting change requires redesigning the system that reproduces the crisis.
What can we build together that changes the outcome?
Imagine placing five cards on a table in front of someone responsible for the future of Indonesia: peatland fires and transboundary haze; a vast workforce with insecure livelihoods; mathematics and technical capability; a regional manufacturing opportunity; and a country repeatedly exposed to natural calamities. Each card belongs to a different policy domain. Each has its own institutions, budgets, experts and performance measures.
Now imagine that the five cards are not separate problems. They are connected parts of a single economic system.
What would become visible if we stopped looking at each card independently and began tracing the relationships between them? What if the recurring haze were not only an environmental problem, but also an outcome of how land, labour, education, production and income interact? And what if the same system that repeatedly generates vulnerability could be redesigned to produce the conditions for greater security and abundance?
This is an inquiry into that possibility. It begins with the ground itself.
Card 1 — The ground beneath the smoke
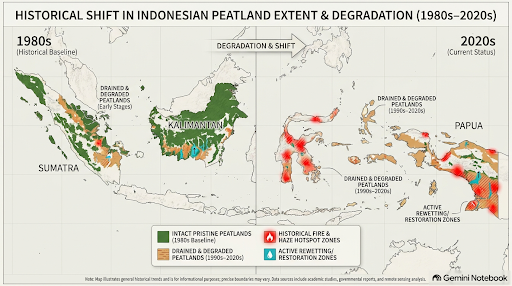
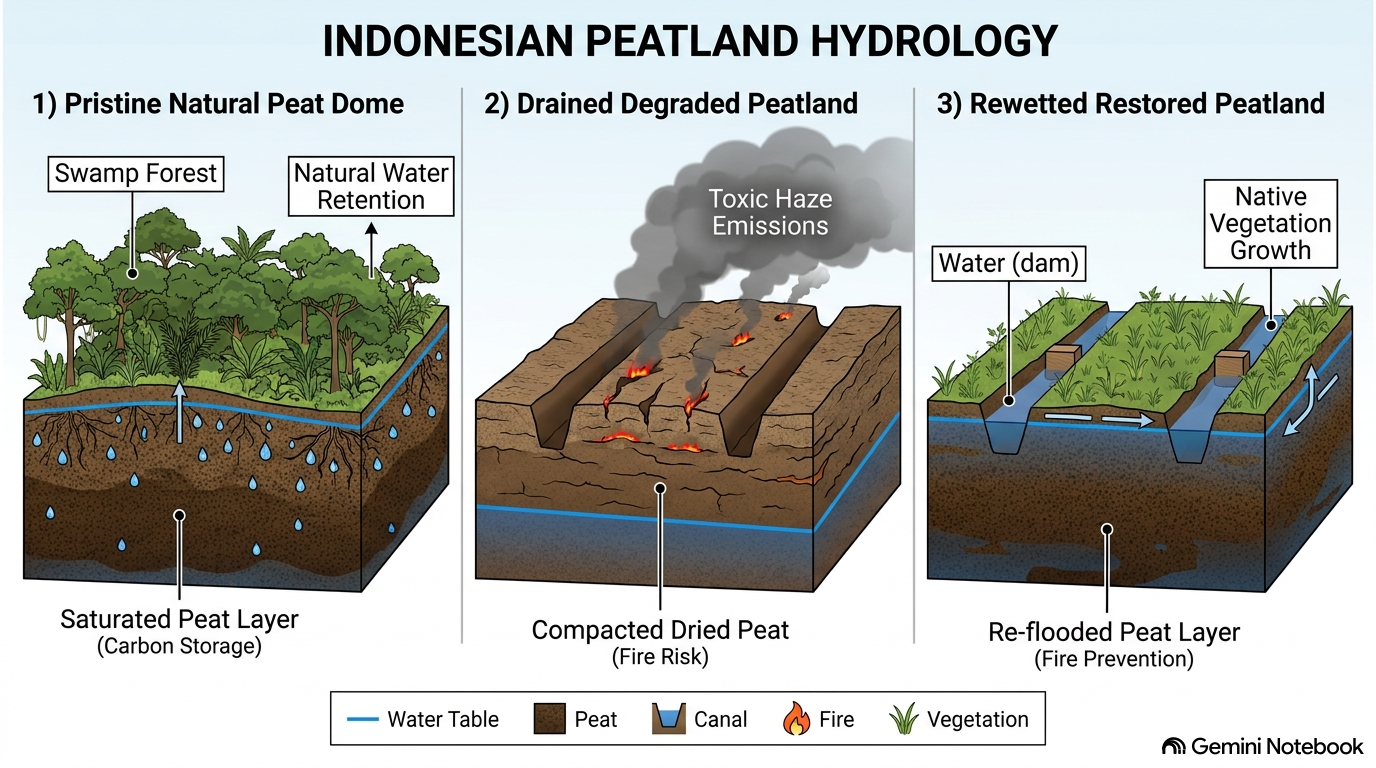
Indonesia’s peatlands are not ordinary agricultural land. Peat stores large quantities of carbon in waterlogged organic matter. When peatlands are drained, the ground can dry, oxidise and become vulnerable to fire. Fires can burn below the surface, persist after flames appear to have disappeared, and produce haze that crosses national borders. The consequences extend beyond forests: public health, transport, schools, business operations and regional relations are all exposed.
The scale is not abstract. In October 2026, Reuters reported estimates of 637,000–900,000 hectares burned during the 2026 fire season, with more than 283,000 respiratory illness cases reported across seven Indonesian provinces. These are reported estimates and cases, not a definitive final national tally. Reuters also reported that approximately 16 million of Indonesia’s 24 million hectares of peatland were considered fire-prone, and that only a small proportion of peatland affected by earlier restoration efforts had been restored. See Reuters’ October 2026 reporting on peatland degradation and its regional haze explainer.
The familiar response is to suppress fires, restore damaged land, enforce regulations and prepare for the next dry season. These activities matter. But another question sits underneath them: what economic arrangement makes the land-clearing decision attractive in the first place, and what alternative would make it more valuable to keep the ground productive and wet?
Consider the agricultural residues generated by Indonesia’s productive economy: oil-palm empty fruit bunches, crop stalks and other plant materials. These can be waste-disposal problems, or they can become feedstock for processing enterprises. The distinction depends on collection systems, processing technology, quality control, transport costs, market demand and the economics of the alternative uses.
The proposition is not to extract peat and sell it as compost. It is to protect peatlands while investigating whether above-ground agricultural residues can be processed into mature organic soil amendments. Such products might serve Indonesian agriculture, support soil restoration in suitable highland farming areas, or find export markets if the economics and agronomic evidence justify it.
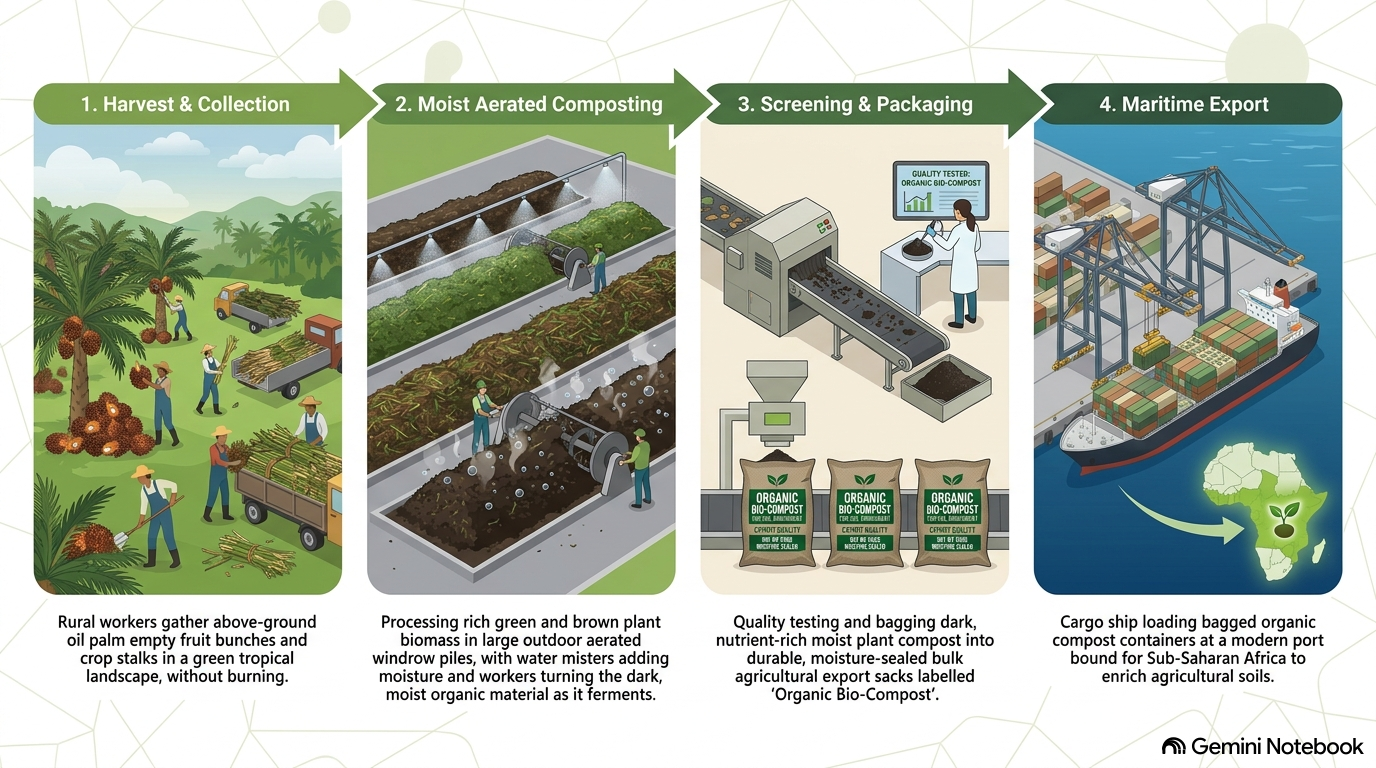
Garlic provides one possible test case. Research in northwest Ethiopia has examined the effects of fertilizer and manure on garlic yields and soil properties (study record). This does not establish that Indonesian compost would be commercially viable in Ethiopia, or that compost alone could replace Indonesian food imports. It establishes a reason to investigate soil restoration, nutrient requirements, crop response and the economics of transporting or producing compost locally.
The first question, therefore, is not simply how to stop the fire. It is how to create a productive economic use for materials and land that the present system undervalues.
Pause here: If agricultural residues could support commercial processing, soil regeneration and stable employment, what would have to change for that value to be realised at scale?
Card 2 — The ground beneath livelihoods
The next card appears to belong to a different discussion: employment. Yet it is connected to the haze. The question is not simply how many people have jobs, but how livelihoods, land use and the organisation of production interact—and whether the economy offers people viable alternatives to practices that impose costs on the wider population.
Indonesia’s population was approximately 285.7 million in 2025, according to UNFPA’s population data. The planning model explored in this analysis uses a population of approximately 287.2 million in 2026, rising towards 318 million by 2046. The 2046 figure is a model projection, not an observed population count; its assumptions need to be stated and tested.
A growing population requires more than more jobs in the abstract. It requires productive capacity that grows fast enough to provide incomes, goods and services for the people entering the workforce. The critical question is whether the economy creates enough year-round, sufficiently productive work to reduce reliance on irregular or seasonal earnings.
The working population table estimates 146.54 million people employed and 140.66 million not employed in a population of 287.2 million. These figures must be interpreted carefully: people who are not employed are not necessarily unemployed, since this category also includes children, students, retirees and others outside the labour force.
| Population and employment category | Estimated people | % of total population |
|---|---|---|
| Total population | 287.20 million | 100.00% |
| Total employed population | 146.54 million | 51.03% |
| Informally employed — working estimate | 97.70 million | 34.01% |
| Formally employed — working estimate | 48.80 million | 16.99% |
| Population not employed | 140.66 million | 48.97% |
| Potential seasonal agricultural workers — illustrative scenario | 14.33 million | 4.99% |
| Workers involved in field-burning activities — illustrative assumption | 1.00 million | 0.35% |
The formal and informal employment figures above retain the original working model’s estimates; they do not reconcile with the 146.54 million employed total and must therefore be treated as a separate, unreconciled scenario pending verification against official Indonesian labour-force data. The seasonal-worker and field-burning figures are illustrative assumptions, not official statistics. These categories overlap and must not be added to the employment totals.
The relationship worth investigating is this: where households face irregular income and few accessible alternatives, immediate cash can outweigh the longer-term environmental costs of a land-clearing practice. A worker cannot be expected to exchange a day’s income for an uncertain promise of future sustainability. Nor can a prohibition, by itself, create the productive jobs that make a different choice economically possible.
This does not establish that informal workers or seasonal agricultural workers are responsible for fires. The question is who carries out or commissions field burning, what economic incentives sustain it, who benefits, and who bears the costs. The illustrative estimate of one million people involved in field-burning activities must be validated before it can be presented as a national count. It may also overlap with agricultural employment, seasonal work and informal employment.
This is where Card 1 and Card 2 begin to connect. If biomass collection and processing were developed into viable enterprises, agricultural residues could generate demand for collection, sorting, transport, compost production, quality testing, packaging, distribution and equipment maintenance. But the number of jobs, their duration, their wages and their capacity to displace harmful practices would all have to be demonstrated. They cannot be assumed from the volume of available biomass alone.
The proposed three-stage wage bridge gives the question a measurable form:
| Development stage | Proposed monthly wage range | What would have to support it |
|---|---|---|
| Years 1–5: establish a wage floor | US$250–350 | Reliable biomass supply, viable farm and collection operations, and contracted demand |
| Years 5–10: accumulate productive capital | US$450–650 | Local processing, packaging, machinery services and higher-value production |
| Years 10–20: capture the industrial dividend | US$800–1,200 | More technically demanding manufacturing, engineering and industrial management |
These are proposed targets, not forecasts or established Indonesian wage outcomes. They would need to be tested against local wage levels, productivity, prices, regional differences, business costs and international competitiveness. The model’s ambition is to move people towards formal, year-round employment—not to claim that every informal worker can be absorbed by a single bioeconomy.
The model also proposes a long-term target of moving 48.8 million people from informal into formal employment. That is an exceptionally large transformation. Its feasibility depends on the total investment required, the number and scale of viable enterprises, labour productivity, the pace of industrial expansion and the jobs created elsewhere in the economy. The number is a hypothesis to test, not a result already achieved.
The deeper systems question is whether Indonesia can redirect economic activity towards forms of production that provide livelihoods while restoring land, reducing the incentives for harmful burning and creating more value domestically. If short-term land-clearing incentives remain economically attractive while alternatives remain inaccessible, the pressures sustaining the problem may persist even when authorities intervene against the fires.
Pause here: If a national economy needs to create productive employment on this scale, which industries could absorb labour while simultaneously addressing environmental damage, food vulnerability and dependence on imported value-added products?
Card 3 — The ground beneath technical capability
The third card is mathematics.
In the OECD’s PISA 2022 results for Indonesia, Indonesian 15-year-old students scored 366 in mathematics, compared with the OECD average of 472. Only 18% reached at least Level 2 proficiency, compared with 69% across OECD countries. Among the 81 participating countries and economies, Indonesia’s score was near the bottom of the distribution, at approximately 70th place in a simple ranking by mean score.
Top 10 countries and economies in PISA 2022 mathematics
| Rank by mean score | Country or economy | Mathematics score |
|---|---|---|
| 1 | Singapore | 575 |
| 2 | Macao (China) | 552 |
| 3 | Chinese Taipei | 547 |
| 4 | Hong Kong (China) | 540 |
| 5 | Japan | 536 |
| 6 | Korea | 527 |
| 7 | Estonia | 510 |
| 8 | Switzerland | 508 |
| 9 | Canada | 497 |
| 10 | Netherlands | 493 |
Source: OECD, PISA 2022 results. These are positions in a simple ordering by mean mathematics score; statistical uncertainty means adjacent positions should not be interpreted as definitive differences in performance.
The contrast raises a fundamental national planning question: what mathematical capability does Indonesia need to plan its economy, determine what it should produce and at what scale, build its industries, and equip its population to participate in them?
Mathematics is needed first to calculate what Indonesia should produce, in what quantities, where, when and for which markets. This requires calculating the land, capital, energy, transport, infrastructure and workforce needed across connected sectors. Mathematics is then needed inside each enterprise to calculate soil nutrients, compost formulation, agricultural yields, material balances, processing temperatures, machinery capacity, costs, quality and productivity. IT can support and automate these processes, but it cannot replace the mathematical reasoning required to design and manage them.
1. The mathematics capability gap
| PISA 2022 mathematics benchmark | Score or result |
|---|---|
| Indonesia | 366 |
| OECD average | 472 |
| Finland | 484 |
| Indonesian students reaching at least Level 2 | 18% |
| OECD students reaching at least Level 2 | 69% |
| Proposed first Indonesian milestone | 420 |
| Proposed longer-term milestones | 450–480, then 500+ |
The proposed milestones are planning ambitions, not forecasts. The objective is to strengthen foundational mathematics across the school population while developing the advanced capabilities required for engineering, manufacturing, research and industrial innovation.
2. Education capacity: examine teachers, not just headcount
Our working model applies assumed student-to-teacher ratios to Indonesia’s reported 44.59 million students.
| School level | Students in working model | Assumed ratio | Teachers calculated |
|---|---|---|---|
| Primary | 24.02m | 13:1 | 1.85m |
| Junior secondary | 10.11m | 9:1 | 1.12m |
| Senior and vocational secondary | 10.46m | 17:1 | 0.62m |
| Total | 44.59m | — | 3.59m |
These are model calculations, not verified Finnish staffing requirements. The figures must be reconciled with comparable definitions of teachers, enrolment and school levels before conclusions can be drawn. The important question is whether Indonesia has the right distribution of qualified mathematics and science teachers, effective teaching methods and classroom support—not simply whether it needs more teachers.
3. Bring regional STEM teaching capability into Indonesian schools
Indonesia could mobilise experienced mathematics and science teachers, teacher educators and technical specialists from across the region, including suitably qualified retired educators from Singapore and Malaysia who are willing to participate. They would work alongside Indonesian teachers, teacher-training institutions and technical schools, strengthening teaching capability at every level.
The programme would begin in primary school, where mathematical foundations are established, and continue through junior and senior secondary education, vocational schools, universities and postgraduate specialisation. The purpose would not be to rely indefinitely on imported educators. It would be to strengthen Indonesian teachers and institutions so that they can sustain and multiply the capability themselves.
Mathematics and science would also be taught in connection with what Indonesia needs to calculate, design and produce. Students would see how mathematical reasoning applies to agriculture, soil restoration, food processing, machinery, metallurgy, manufacturing and other productive sectors. The curriculum would develop both the ability to calculate and the ability to understand what those calculations make possible.
4. A 15-year STEM pipeline, with industrial development beginning around Year 6
The education pathway and the industrial pathway must develop together. Indonesia should not have to wait 15 years for the first results: the full horizon develops successive generations of capability, while selected postgraduate specialists return earlier to help build productive sectors.
| Period | Education and specialist development | Industrial development |
|---|---|---|
| Years 1–5 | Strengthen mathematics and science from primary school through secondary and tertiary education. Bring regional STEM educators into Indonesian schools and teacher-training institutions. Select and groom strong Indonesian postgraduate mathematics, science and engineering specialists for placements in Singaporean and Malaysian firms. | Identify priority sectors, calculate production requirements, prepare investment and infrastructure, and establish the enterprises and technical capacity that returning specialists will help develop. |
| Around Year 6 | The first cohort of groomed postgraduate specialists begins returning to Indonesia. School-level education, teacher development and subsequent specialist cohorts continue. | Returning specialists begin helping to establish and strengthen processing industries, engineering teams, technical training, maintenance capacity and applied research. |
| Years 6–10 | Continue strengthening mathematics and science teaching at all levels. Develop further cohorts of specialists through regional firm placements and advanced technical learning. | Expand productive enterprises, build local technical teams and connect education and research to actual industrial requirements. |
| Years 11–15 | Produce successive generations of graduates and specialists with stronger mathematical, scientific and engineering foundations. Build Indonesian institutions’ ability to train and develop their own specialists. | Expand industrial capability and develop a larger generation of Indonesian engineers, technical leaders and industrial innovators able to design, improve and scale production. |
The placements in Singaporean and Malaysian firms must be structured as deliberate learning experiences. Participants should learn how enterprises are financed, engineered, operated, maintained and scaled, and how technical decisions connect to costs, productivity, quality and markets. Their return should be linked to identified sector-development roles and credible investment plans, rather than treated as a placement programme that ends when graduates come home.
5. Calculate the enterprises and jobs the pipeline must support
The employment model must connect the desired shift towards formal employment to actual production capacity. The working proposal aims to move 48.8 million people from informal to formal employment over time. This is a target, not an established forecast, and the number of enterprises required cannot be calculated responsibly without specifying sector output, enterprise scale, productivity and employment assumptions.
| Production sector | What must be modelled | Employment calculation |
|---|---|---|
| Biomass collection and transport | Tonnes collected, routes, equipment and operating shifts | Jobs per unit of biomass handled |
| Commercial agriculture | Hectares, crop mix, yields and seasonal labour | Jobs per hectare and per tonne produced |
| Bio-compost and agricultural processing | Plant capacity, throughput and automation | Jobs per plant at each capacity level |
| Food manufacturing and import substitution | Domestic output targets, imports replaced and market demand | Jobs per unit of production |
| Nickel and other manufacturing | Plant capacity, production stages and technical requirements | Jobs by occupation and plant |
| Machinery and industrial equipment | Domestic manufacturing and maintenance demand | Jobs per production facility |
| Logistics, research and technical services | Supply-chain volume and specialist requirements | Jobs linked to sector output |
The calculations must run in both directions. Planners need to determine the required output, number and scale of enterprises, jobs by sector and occupation, and mathematical and technical capabilities required. They can then calculate the number and distribution of teachers, training places and specialist-development opportunities needed to supply those capabilities. The model must also test whether investment, infrastructure, productivity and market demand can sustain the planned output and employment.
The 15-year STEM pipeline is therefore not a separate education initiative. It is the capability-building component of the economic plan: stronger mathematics education from primary school onwards, regional educators multiplying Indonesian teaching capacity, postgraduate specialists learning inside Singaporean and Malaysian firms, and the first returning specialists helping to build Indonesian industries around Year 6.
The central question for national planners is: What must Indonesia learn to calculate, design and produce—and at what scale—to build the economy its population needs?
Pause here: Mathematics and STEM capability
If a country must calculate what to produce, in what quantities, where and when—and then engineer the processes that make production possible—what mathematical and scientific capabilities must it build from primary school onwards, and how can those capabilities be connected to industrial development within the first six years?
Inflection: From the need for jobs to the knowledge and technical capability required to create them.
Card 4 — The ground beneath the regional economy
The fourth card concerns geography, capital and markets.
Indonesia has the population, natural resources and potential production scale to support much more extensive manufacturing and agricultural processing. Singapore has strengths in finance, international trade, logistics, headquarters functions and intellectual property. Malaysia has industrial experience, engineering capability and manufacturing supply chains. India offers a much larger market that could be connected to a regional production network.
These roles are a proposed architecture for cooperation, not a claim that the countries have agreed to such an arrangement.
Under this model, the division of productive functions would be deliberate:
| Partner | Potential contribution to an integrated production system |
|---|---|
| Indonesia | Agricultural and mineral resources, production sites, processing capacity, workforce development and domestic industrial expansion |
| Singapore | Capital mobilisation, headquarters functions, intellectual property, green finance, logistics and access to international markets |
| Malaysia | Machinery, factory engineering, industrial equipment, technical services and manufacturing partnerships |
| India | A large additional market for products and industrial supply chains, subject to commercial and trade conditions |
The point is not merely to trade more. It is to connect capabilities so that more stages of production can be developed, retained and expanded within the region.
The combined population of ASEAN and India is approximately 2.1 billion people, depending on the reference year and population estimates used. That is a measure of potential market scale, not proof of purchasing power or guaranteed demand. A market of that size becomes economically meaningful only when products are competitive, distribution works, standards are met, trade arrangements are viable and households or businesses can afford what is produced.
The potential industrial network is broader than compost. Agricultural processing, machinery, oleochemicals, mineral downstreaming, battery materials, logistics and other manufacturing activities could provide different layers of demand for technical skills and productive investment. The exact portfolio would need to emerge from market analysis, resource assessments, infrastructure requirements and commercial feasibility—not from assuming that every proposed industry will succeed.
For the bioeconomy example, the commercial test is particularly important. Is it more economical to transport wet compost across long distances, or to process residues near their source and export a higher-value, quality-controlled product? Would the economics support local soil-restoration markets first, with export markets only where they make sense? What equipment, standards, energy, water, transport and working capital would be required? These are questions for agronomists, engineers, investors and producers to investigate together.
The regional arrangement also creates a reason to invest in the STEM pipeline. Indonesia would not merely need workers to collect biomass; it would need people who can operate plants, design equipment, improve processes, manage industrial quality and develop products for competitive markets. Singapore and Malaysia would not merely be sources of finance or machinery; their institutions and enterprises could become partners in capability development. India would not simply add a population figure; it would need to become a real market for specific products at competitive prices.
Pause here: Regional production architecture
What if Indonesia’s productive resources and workforce, Malaysia’s industrial expertise, Singapore’s capital and regional coordination, and access to ASEAN and Indian markets were planned as complementary parts of one production system? What could the region produce together that individual countries would struggle to build alone?
Inflection: From developing national capability to organising regional capability at scale.
Card 5 — The ground beneath a society in a state of defense
Indonesia’s physical geography adds a dimension that economic planning cannot ignore. Earthquakes, tsunamis, volcanic eruptions, floods, droughts and peatland fires create repeated demands on public institutions, households, infrastructure and productive activity.
The 2025 WorldRiskReport placed Indonesia third globally on the WorldRiskIndex, with a score of 39.80, according to the figures recorded in the working material. The WorldRiskIndex combines exposure to natural hazards with vulnerability; it is not a ranking of countries by disaster deaths. The historical death tolls recorded in the same material show why the distinction matters: the 2004 Indian Ocean tsunami caused more than 167,000 deaths in Indonesia, while Myanmar’s 2008 Cyclone Nargis caused more than 138,000 deaths. These single-event tolls should not be confused with cumulative disaster mortality or composite risk scores.
The question is not whether Indonesians are familiar with calamity. The question is what repeated exposure to calamity does to the way a society organises its resources, institutions and human effort.
This is where a further hypothesis enters the analysis. In societies shaped by harsh environments, repeated disasters, historical persecution or prolonged insecurity, kinship, religious institutions and protective family obligations can provide continuity and mutual support. They can help people survive conditions that would otherwise overwhelm individuals and households. But what happens when the organisation of social life remains heavily oriented towards protecting people from hardship, while less attention is given to building the technical and productive capacity to reduce the hardship itself?
This is a question about social organisation, not a claim that a religion or a population is inherently opposed to innovation. Religious learning, kinship and family responsibility are not uniform across Indonesia, and their effects cannot be inferred from disaster statistics. The hypothesis needs evidence: how educational choices are made, how authority and expectations operate within households, how young people enter scientific and technical careers, and how cultural institutions support or constrain experimentation and enterprise.
The deeper question is whether the responsibility to protect one’s family can be extended beyond surviving hardship to building an economy that reduces the hardship future generations must endure.
That distinction gives meaning to the terms State of Defense and State of Abundance. A State of Defense continually mobilises resources to withstand the next shock. A State of Abundance builds productive capacity, technical knowledge, secure livelihoods and resilient infrastructure so that fewer resources must be consumed by recurring emergencies. These are not mutually exclusive states: a disaster-prone country must remain prepared. The issue is whether preparedness becomes the organising purpose of the economy, or whether it is supported by an expanding capacity to create value and reduce vulnerability.
The five cards now connect. Peatland management affects fire risk and the use of agricultural residues. Residue processing may create enterprises and employment, but only if the economics work. Productive enterprises need technical skills, and technical skills depend in part on mathematics and science education. Regional partnerships may help mobilise capital, machinery and markets, but they require domestic capability and competitive production. All of these operate within a society that must protect its people while also creating the conditions for them to thrive.
Pause here: Disaster, social protection and abundance
If so much effort and resource must repeatedly be devoted to surviving and recovering from disasters, what would it take to build an economy that reduces people’s exposure to hardship while retaining the capacity to protect them when disasters occur? Could the responsibility to protect future generations extend from helping them survive adversity to building the productive capacity that prevents avoidable hardship?
Inflection: From repeatedly managing the consequences of hardship to changing the conditions that reproduce it.
From five cards to one economic pipeline
The system can be represented as a chain of relationships:
Population and education → technical capability → investment and enterprises → production and processing → markets → employment and income → household security and reinvestment.
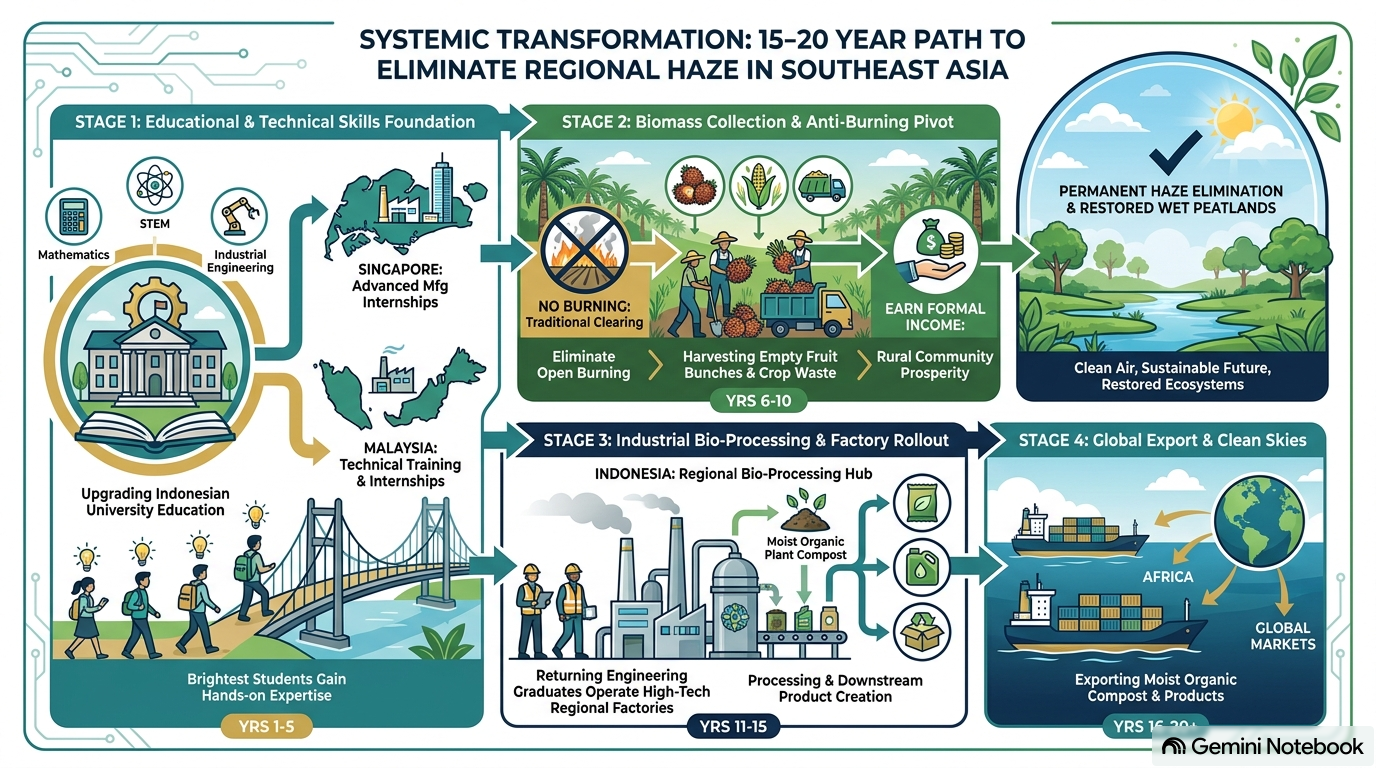
Land, soil, food security and disaster resilience both shape and are shaped by this pipeline. The relationships also run in reverse. A more productive economy can create resources for education and restoration; better technical capability can improve production and environmental management; more secure incomes can widen the choices available to households. Whether these feedback effects become strong enough to change the overall trajectory is an empirical question.
The proposed transformation therefore has several different horizons. Immediate livelihood and residue-collection experiments could test whether alternative income can be generated without burning. Over the first five years, regional partnerships and processing enterprises could establish whether there is a commercially viable base for expansion. Over 10–20 years, if investment, markets and education align, higher-value production could create demand for a larger and more specialised technical workforce. The 15-year STEM pipeline would need to begin early because industrial capability takes time to develop.
The model’s wage bridge—US$250–350 a month in the first stage, US$450–650 as processing and manufacturing expand, and US$800–1,200 in higher-value industrial roles—is one way of making the ambition measurable. So is the proposed target of moving 48.8 million workers into formal employment. Neither should be treated as guaranteed. Both require a transparent account of investment, enterprise numbers, productivity, wage affordability, labour demand and the pace at which jobs can actually be created.
The same discipline applies to import substitution. The working material cites Indonesian imports of more than 2.6 million tonnes of soybeans annually and approximately 600,000 tonnes of garlic. These figures need to be checked against the relevant trade year and commodity definitions before publication as current totals. Even when import volumes are confirmed, compost alone cannot be assumed to replace those imports: crop suitability, seed, irrigation, varieties, agronomy, storage, processing, prices and farmer incentives all affect domestic competitiveness. The opportunity is to test whether better soil management and stronger agricultural value chains can contribute to reducing food vulnerability—not to promise that one input can solve it.
The practical question is whether Indonesia can move from treating peatland fires, informal employment, educational capability, food imports, manufacturing and disaster exposure as separate policy concerns to examining their combined economic consequences. A systems view does not remove the need for specialist knowledge. It gives specialists a common structure in which to test how their decisions affect one another.
That is the work of discovery: establish the data, map the causal relationships, test the assumptions, identify the leverage points, and learn whether the proposed pathway can work at scale.
Questions for Systems Thinkers
To our readers across regional planning, institutional investment, research, and corporate strategy:
- 💡 What surprised you most about how peatland hydrology, highland food import substitution, and mathematics education lock into a single economic pipeline?
- 🚀 What excited you about the prospect of a 20-year cross-border bioeconomy pipeline connecting Singapore, Malaysia, Indonesia, and an ASEAN + India market of 2.14 billion people?
- 🔍 What curiosity did this raise for you regarding how we measure informal labor and soil capital?
- 🧭 What would you like to see happen next—or what would you personally like to do next to explore this?
- 🛠️ If our region were to actually execute an idea of this scale—what do you think it would take to pull it off?


