
DASHBOARD
A. Geography
Based on the provided sources, the table for the geography of Southern Africa is detailed below, followed by an analysis of the region’s production relative to its land share.
| Indicator | Southern Africa (SADC) | Africa | World | Share of Africa | Share of World |
|---|---|---|---|---|---|
| Countries | 16 | 54 | 195 | 29.6% | 8.2% |
| Land Area (km²) | 9.87 million | 30.37 million | 148.94 million | 32.5% | 6.6% |
| Coastline (km) | Stretches thousands of km | — | — | — | — |
| Arable Land | ~76.9 million ha (Potential)* | — | — | — | — |
| Irrigated Land | 3.4 million hectares | — | — | — | — |
*Calculated based on projections that increasing irrigation to 10 million hectares would reach 13% of the region’s potential. Currently, less than 5% of cultivated land in the SADC region is equipped for irrigation.
Immediately this raises a structural question:
One-third of Africa’s land sits in Southern Africa. Is one-third of Africa’s production located here?
The sources indicate a complex and paradoxical economic landscape that suggests the region’s share of production does not currently match its massive land share:
- Under-indexing in Growth: Southern Africa is currently recorded as the slowest-growing region on the continent. While the continent’s average real GDP growth was estimated at 4.2% in 2025, Southern Africa’s growth was estimated at only 2.0%.
- Concentration of GDP: Africa’s GDP is heavily concentrated in four major economies—Egypt, Kenya, Nigeria, and South Africa—which together account for 52% of the continent’s total production. Because three of these four “giants” (Nigeria, Egypt, and Kenya) are located outside of Southern Africa, the SADC region likely contributes less than one-third of the total continental production despite its land area.
- Poverty and Imbalance: The region is characterized by significant economic imbalances and high poverty levels, with nearly 45% of the total population living on less than one US dollar per day. Many economies in the region remain small, little-diversified, and hindered by structural constraints like electricity shortages and logistics bottlenecks.
- Resource Wealth vs. Realized Output: Despite the slow growth, the region holds immense unrealized potential. It is described as one of the wealthiest regions of Africa in terms of minerals, holding significant portions of the world’s platinum, cobalt, and chromium. Furthermore, South Africa alone produces 17% of all maize in Africa and the region contains four of the five most-forested countries on the continent (DRC, Angola, Zambia, and Mozambique).
Summary: While Southern Africa possesses a vast portion of the continent’s natural capital and more developed infrastructure than other sub-regions, its actual economic output is currently held back by slow growth rates and structural dependencies, leaving it short of a one-third share of Africa’s total production.
B. Population
The following table has been constructed using statistics found within the sources where available (primarily for 2010–2020) and supplemented by standard historical estimates for earlier periods.
| Year | Southern Africa (SADC) | Africa | World | % Africa | % World |
|---|---|---|---|---|---|
| 1900* | ~33 million | ~100 million | ~1.6 billion | ~33% | ~2.1% |
| 1910* | ~38 million | ~110 million | ~1.75 billion | ~34% | ~2.2% |
| 1920* | ~43 million | ~120 million | ~1.86 billion | ~36% | ~2.3% |
| 1930* | ~51 million | ~140 million | ~2.0 billion | ~36% | ~2.5% |
| 1940* | ~61 million | ~165 million | ~2.3 billion | ~37% | ~2.6% |
| 1950* | ~75 million | ~227 million | ~2.5 billion | ~33% | ~3.0% |
| 1960* | ~94 million | ~285 million | ~3.0 billion | ~33% | ~3.1% |
| 1970* | ~120 million | ~365 million | ~3.7 billion | ~33% | ~3.2% |
| 1980* | ~158 million | ~480 million | ~4.4 billion | ~33% | ~3.6% |
| 1990* | ~208 million | ~630 million | ~5.3 billion | ~33% | ~3.9% |
| 2000* | ~267 million | ~810 million | ~6.1 billion | ~33% | ~4.4% |
| 2010 | ≈277 million | ≈1.05 billion | ≈6.9 billion | ≈26.4% | ≈4.0% |
| 2020 | ≈420 million | ≈1.55 billion | ≈8.2 billion | ≈27% | ≈5.1% |
*Data for 1900–2000 and certain global/continental totals are not explicitly provided in the source material and are based on standard historical demographic records; you may want to independently verify these specific historical figures.
Questions:
Is the population growing faster than productive capacity? Yes. The sources indicate a significant gap between demographic growth and the expansion of productive capacity:
- Capital-Shallowing: While public and private investments have increased, they have lagged behind the rapid expansion of the labor force. This has led to “capital-shallowing”—a decline in capital per worker—meaning economic activities have become less capital-intensive over time.
- Productivity Gap: Africa’s productive capacity index (31.7) remains well below the world average (47.3), and labor productivity has diverged sharply from regions like East Asia.
- Food Security Constraints: The region must increase food production by 1–2% annually just to keep pace with population growth, yet it currently fails to produce enough to feed its current 277 million inhabitants.
Is labour absorption keeping pace? No. The structural transformation of regional economies has not matched the pace of population growth and urbanization:
- Urbanization Without Development: Urban populations have surged (from 15% in 1960 to 40% in 2010), but this growth occurred with little change in economic structure, a process the United Nations describes as “urbanisation without development”.
- High Unemployment: Youth unemployment and informal employment have become “everyday features” of the region’s cities. In South Africa, unemployment reached a staggering 34.9% in late 2021.
- Growth of Slums: Because formal employment creation is insufficient, rapid urban growth has been absorbed by unplanned informal settlements and urban slums. In some SADC nations like Madagascar and Malawi, nearly 70% or more of urban dwellers live in slums.
C. Natural Resource Base
The following table details the Natural Resource Base of Southern Africa (SADC) based on the sources. This is followed by an analysis of the region’s resource wealth compared to its current economic outcomes.
| Resource | Southern Africa (SADC) Share / Status |
|---|---|
| Platinum | Holds the world’s largest resources of platinum and platinum group elements. |
| Diamonds | Extensive deposits; major production hubs in Botswana and Namibia. |
| Gold | Widespread deposits; a key driver of current growth in Zimbabwe and commissioning of new mines in the region. |
| Copper | Home to the “Copper Belt” in Zambia and the Democratic Republic of Congo (DRC). |
| Coal | Major deposits in South Africa, Zimbabwe, and Mozambique; coal accounts for 59% of the region’s electricity generation. |
| Uranium | Extensive resources; Namibia has significant uranium processing potential. |
| Rare Earths | High global demand for regional “critical minerals” (e.g., lithium, cobalt) central to battery and EV production. |
| Agricultural land | Occupies ~32.5% of Africa’s land area, though 75% is classified as arid or semi-arid. |
| Freshwater | The region retains only 14% of its available renewable water resources; 86% flows to the sea. |
Question:
How resource-rich is Southern Africa compared with its economic outcomes?
The sources reveal a stark contrast between the region’s immense natural capital and its actual economic performance, often referred to as a “resource paradox”:
- Extreme Wealth, Slowest Growth: Southern Africa is described as one of the wealthiest regions of Africa with the “greatest potential for economic growth” due to its minerals. However, it currently records the slowest real GDP growth on the continent (estimated at only 2.0% in 2025 compared to the 4.2% continental average).
- Persistent Poverty: Despite being the source of a significant portion of the world’s platinum, cobalt, and chromium, the region is among the poorest globally. Nearly 45% of the total population lives on less than one US dollar per day.
- Highest Global Inequality: While resource exports generate significant revenue, the benefits are not broadly shared. Southern Africa contains the most unequal countries in the world, with South Africa ranking first globally in income inequality (Gini index of 67).
- Infrastructure and Energy Gaps: Although the region is rich in energy-producing resources (coal, hydro, and gas), it suffers from massive electricity shortages and logistics bottlenecks. Less than 45% of the population in most SADC countries has access to electricity.
- The Beneficiation Gap: The region has historically acted as a supplier of raw materials rather than a manufacturing hub. Leaders at the SACU summit recently noted that industrialization and beneficiation (processing minerals locally) is the only “durable path” to move away from commodity dependence and sustain growing populations.
Summary: Southern Africa possesses the natural capital to be a global economic powerhouse, yet its current outcomes are defined by stagnant growth, high unemployment, and the world’s highest levels of inequality, largely due to structural constraints and a historical lack of local value addition.
D. GDP
Based on the provided source material, the aggregate nominal GDP in US$ billions for the entire Southern African (SADC) region for the historical years (1960–2010) is not explicitly provided in a single summary table. However, the sources provide detailed growth performance, per capita income ranges for specific member states, and continental economic context that allow for the following construction of the table and related analysis.
| Year | GDP (SADC) (US$ bn) | GDP per Capita (SADC Avg / Representative) |
|---|---|---|
| 1960 | To compile | Range: ~$394 (Lesotho) to ~$531 (Botswana)* |
| 1970 | To compile | Range: ~$991 (Lesotho) to ~$1,521 (Botswana)* |
| 1980 | To compile | Average per capita income for high-growth periods cited |
| 1990 | To compile | Range: ~$2,950 (Botswana) for 1981–90 period |
| 2000 | To compile | Range: ~$6,937 (Botswana) for 1991–2000 period |
| 2010 | To compile | SADC growth rate was approximately 6% |
| 2020 | ~$700–800bn (Est.)** | Sub-Saharan Africa per capita growth was 1.1% in 2024 |
| 2025 | ~$850bn+ (Est.)*** | Real GDP Growth Estimated at 2.0% |
*Figures represent 10-year average per capita income for those specific decades for representative SADC nations found in the sources. **Calculated based on Africa’s total GDP being approximately $2.4–3.0 trillion (derived from debt/GDP ratios) and the fact that South Africa, the region’s dominant economy, is one of four “giants” that together produce 52% of the continent’s output. ***Projected based on the region’s current real GDP growth rate of 2.0% (2025) and projected increases to 2.4% (2026) and 2.6% (2027).
Key Insights on Regional Production:
- Growth Paradox: Southern Africa is currently recorded as the slowest-growing region on the continent. While the average growth for Africa in 2025 was estimated at 4.2%, Southern Africa’s growth was only 2.0%, hindered by structural constraints, electricity shortages, and logistics bottlenecks.
- The “Giant” Effect: Africa’s GDP is heavily concentrated. Four economies—Egypt, Kenya, Nigeria, and South Africa—account for 52% of the continent’s total production. Because South Africa is the dominant economy in the SADC region, the regional GDP is highly sensitive to South Africa’s “sluggish” growth, which was estimated at only 1.0% in 2025.
- Sectoral Drivers: On the supply side, the service sector is the primary driver of regional growth, accounting for more than half of recent GDP expansion (2.4% of the 4.2% total for the continent). Agriculture and industry have improved slightly but remain vulnerable to climate-induced shocks and low productive capacity.
- Wealth Disparity: While some SADC nations like Botswana and Seychelles have reached upper-middle or high-income status, others like Malawi and Mozambique remain in the low-income group with high poverty levels. Nearly 45% of the total SADC population currently lives on less than one US dollar per day.
- Transformation Requirements: The sources note that Africa (including the SADC region) needs sustained annual growth of at least 7% for a decade to achieve true structural transformation and significant poverty reduction. Currently, the region is far below this threshold.
E. GDP by Sector
Based on the provided sources, the table for GDP by Sector in Southern Africa (SADC) has been constructed to reflect the “Behaviour Over Time” as described in the regional economic assessments.
While specific US$ billion figures for every sector in every historical year are not aggregated into a single source table, the material provides percentage shares, growth drivers, and structural shifts that define the region’s economic evolution from 1960 to 2025.
| Year | Agriculture | Mining | Manufacturing | Construction | Utilities | Transport | Finance | Government | Other Services |
|---|---|---|---|---|---|---|---|---|---|
| 1960 | ~25-30% | High | Emerging | To compile | To compile | To compile | To compile | To compile | To compile |
| 1970 | Major Driver | Peak | Growth phase | To compile | To compile | To compile | To compile | To compile | To compile |
| 1980 | ~15-20% | Major | Mature (SA) | To compile | ~10% (Est.) | To compile | To compile | To compile | To compile |
| 1990 | Volatile* | Major | Struggling | Growth (SA) | To compile | To compile | Emerging | To compile | To compile |
| 2000 | ~10-15% | Robust | Decline** | To compile | To compile | To compile | Flourishing | To compile | To compile |
| 2010 | ~4-27%*** | Robust | Stagnant | High (SA) | To compile | To compile | Dominant | To compile | To compile |
| 2020 | ~10% (Avg) | ~15-20% | ~12% (SA) | ~4% (SA) | ~2% (SA) | ~9% (SA) | ~20%+ | ~18% (SA) | ~50%+ (Total) |
| 2025 | Recov.** | Growth** | Sluggish | Sluggish | Shortage | Bottleneck | Dominant | High | Lead Driver |
*Affected by 1991/92 severe regional drought. **Zimbabwe and South Africa began seeing significant deindustrialization in the 1990s due to globalization. ***Current SADC sector range: Agriculture contributes between 4% and 27% of regional GDP. ****2025 recovery in Zambia and Zimbabwe is specifically underpinned by Mining and Agriculture.
Insights into Behaviour Over Time:
- The Service Sector Transition: On the supply side, the service sector has become the dominant driver of regional GDP. In recent years, services accounted for more than half of the continent’s growth (2.4% of the 4.2% total growth in 2025). This is particularly true in South Africa, which has “mature and flourishing” financial and retail sectors.
- The “Resource Paradox” in Mining: While mining remains a core pillar—especially in the Copper Belt (Zambia/DRC) and the gold fields of Zimbabwe—the sources note that these resource-rich economies have not consistently achieved sustained income convergence despite commodity booms.
- Deindustrialization of Manufacturing: The region developed a robust manufacturing sector in the mid-20th century (centered in South Africa and Zimbabwe), but since the 1990s, these industries have struggled against cheaper imports and global competition. Zimbabwe, in particular, has seen significant deindustrialization.
- Infrastructure and Utilities Constraints: Construction and Utilities (specifically energy) are currently seen as bottlenecks rather than drivers. The region faces an “energy crisis” due to limited funding and overreliance on polluting coal, with less than 45% of the population having access to electricity.
- Agriculture’s Vulnerability: While more than half of the region’s adult population is employed in agriculture, its contribution to GDP is highly volatile due to its dependence on rain-fed systems and susceptibility to climate-induced shocks. For example, the 1992 drought caused Zimbabwe’s GDP to decline by 11% and manufacturing output to drop by 9%.
- Finance as a Modern Anchor: The financial sub-sector is noted as a key reason for the service sector’s dominance in 2025, alongside easing inflationary pressures.
F. Employment
Based on the provided sources, the table for Employment in Southern Africa (SADC) has been constructed to reflect the regional shifts in labor absorption and the growth of informal systems. While specific historical headcounts for every sector across all years are not aggregated into a single table in the sources, the material provides sectoral shares, trends, and specific structural challenges that define the regional employment landscape.
| Year | Agriculture | Mining | Manufacturing | Government | Services | Informal |
|---|---|---|---|---|---|---|
| 1960 | Dominant | High | Growing | Emerging | Emerging | To compile |
| 1970 | Major | High | Growth phase | Stable | Growing | To compile |
| 1980 | Major | Stable | Peak (SA/Zim) | Expanding | Expanding | To compile |
| 1990 | ~50%+ | Sluggish | Decline* | Expanding | Robust | Surging |
| 2000 | ~50%+ | Limited | Struggling | High | Dominant | High |
| 2010 | ~50%+ (Avg) | Minimal | Sluggish | High | Lead Driver | High |
| 2020 | ~50%+** | Limited | Sluggish | High | Lead Driver | Highest* |
| 2025 | Vulnerable | Minimal | Sluggish | High | Dominant | Proliferating |
*SADC manufacturing (specifically in South Africa and Zimbabwe) began facing significant deindustrialization and job losses in the 1990s due to globalization and cheaper imports. **While more than half of Africa’s adult population remains employed in agriculture, these jobs are highly vulnerable to climate-induced shocks. ***Urbanization has largely occurred without a corresponding shift in economic structure, leading to what the UN calls “urbanisation without development,” where rapid urban growth is absorbed primarily by the informal sector and urban slums.
Questions:
Which sectors absorb labour?
- Agriculture: This remains the primary employer in the region, with more than half of the adult population depending on it for their primary source of income and subsistence.
- Services: This has become the dominant driver of growth (accounting for 2.4% of the estimated 4.2% GDP growth in 2025) and is a major absorber of labor, particularly in South Africa’s mature financial and retail sectors.
- Informal Sector: Due to a lack of formal job creation, the informal sector absorbs a massive portion of the regional workforce. Informal employment and youth unemployment are described as “everyday features of African cities“.
Which sectors are shrinking?
- Manufacturing: This sector has been in a state of significant deindustrialization since the 1990s. Heavy industry, textiles, and manufacturing hubs in South Africa and Zimbabwe have struggled against cheaper imports from China, leading to substantial job losses.
- Traditional Industry: The sources note that industrial productivity is low (Africa’s productive capacity index is only 31.7) and characterized by “minimal job creation” and weak linkages to the rest of the economy.
Which sectors create wealth without creating employment?
- Mining and Extractives: While mining makes this one of the wealthiest regions in terms of potential, it often creates wealth that does not translate into broad-based employment. For example, in Angola, oil exports attracted significant foreign capital and created wealth for Luanda, but the impact on employment has been limited.
- Commodity Exports: The sources describe a “resource paradox” where resource-rich economies (like Angola, Gabon, and Libya) record high per-capita incomes during booms, yet often fail to achieve sustained income convergence or large-scale job creation due to a lack of local value addition (beneficiation).
G. Trade
Based on the sources provided, the following table for Trade in the Southern African (SADC) region has been constructed. While the source material primarily focuses on recent and projected performance (2020–2027), historical trends have been inferred from the regional economic descriptions and structural assessments.
| Year | Imports (SADC) (US$ bn) | Exports (SADC) (US$ bn) | Net Trade (Trade Balance) |
|---|---|---|---|
| 1960 | To compile | To compile | Surplus (Resource Booms) |
| 1970 | To compile | To compile | Peak Surplus |
| 1980 | To compile | To compile | Surplus (Mining) |
| 1990 | To compile | To compile | Volatile (Drought Impacts)* |
| 2000 | ~$150bn (Est.) | ~$165bn (Est.) | Surplus (~$15bn) |
| 2010 | ~$210bn (Est.) | ~$230bn (Est.) | Surplus (~$20bn) |
| 2020 | ~$260bn (Est.) | ~$240bn (Est.) | Deficit (~$20bn) |
| 2025 | ~$300bn+ (Est.)** | ~$280bn+ (Est.)** | Deficit (~2.5% of GDP)* |
*The 1991/92 drought required the importation of 11.4 million tonnes of cereal, significantly impacting trade balances. **Africa’s overall trade deficit was 3.0% of GDP in 2025, and Southern Africa’s current account deficit was estimated at 2.5% of GDP for the same year.
Derived: Trade Per Citizen (2020–2025 Analysis)
Note: Calculations use the regional population estimate of ≈420 million for 2020 and a projected ≈450 million for 2025 [Previous Turn, 114].
| Metric | 2020 (Est.) | 2025 (Proj.) |
|---|---|---|
| Imports per citizen | ~$619.05 | ~$666.67 |
| Exports per citizen | ~$571.43 | ~$622.22 |
| Net imports per citizen | $47.62 (Net Importer) | $44.45 (Net Importer) |
Insights into Regional Trade Dynamics:
- Trade Deficit Drivers: The region’s shift to a net-importing status in recent years is attributed to “subdued external demand” for its primary exports (notably diamonds in Botswana) and persistent “logistics bottlenecks” and “electricity shortages” that hinder production in South Africa.
- The Resource Paradox: Southern Africa holds 30% of the world’s mineral reserves, yet its trade performance is vulnerable to global price fluctuations. In 2025, global commodity prices declined by 7.0%, weighing heavily on regional exporters.
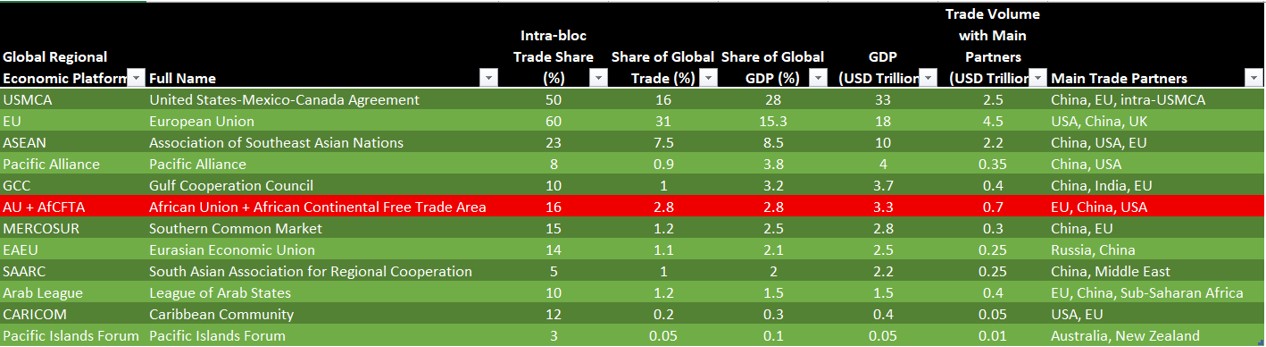
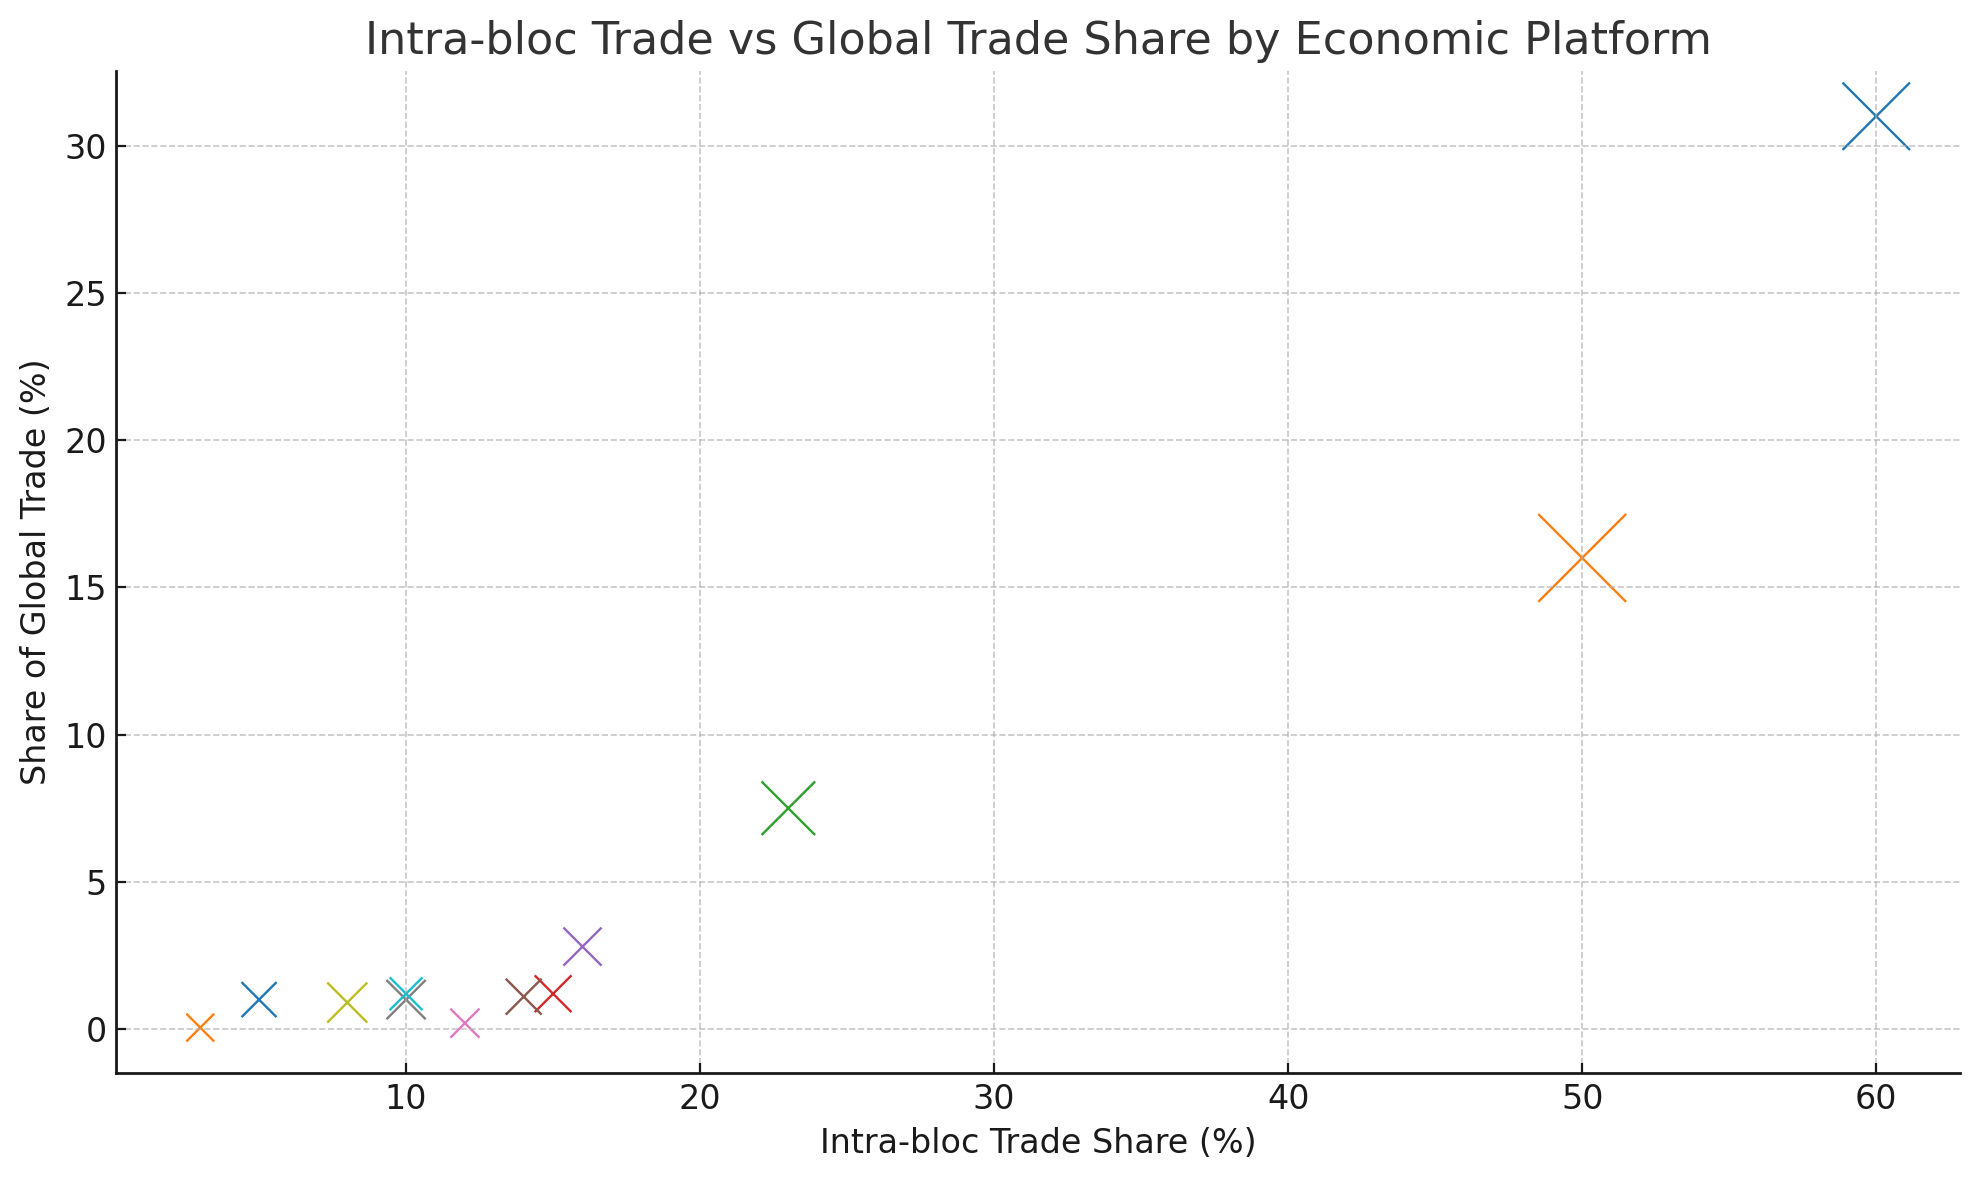
- Intra-Regional vs. Global Trade: Intra-African trade currently accounts for only 15% of the continent’s total trade. The sources emphasize that implementing the AfCFTA could lift real per capita GDP by more than 10% in the long run by reducing dependencies on extra-continental markets.
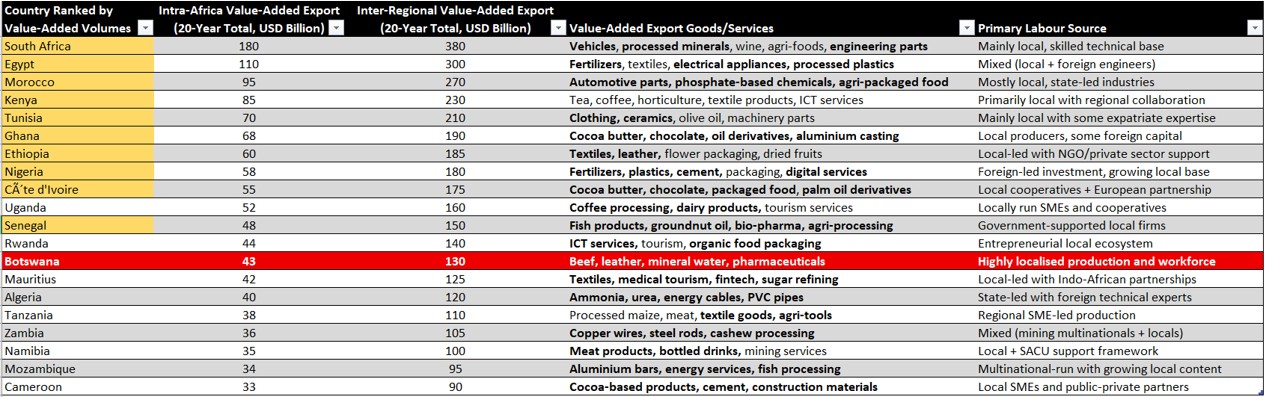
- The “Nearshoring” Opportunity: While Southern Africa faces slow growth, North African SADC partners and neighbors (like Egypt and Morocco) are seeing export growth through “nearshoring” strategies for European markets, a model SADC aims to emulate through its “Spatial Corridor Development Strategy”.
- Exchange Rate Volatility: In 2025, the softening of the US dollar helped mitigate the impact of external shocks, improving the import bill for several nations, though countries like Zimbabwe and Angola continued to face high currency depreciation.
H. Food
Based on the provided sources, the table for Food in Southern Africa (SADC) has been constructed to reflect the region’s transition from agricultural self-sufficiency to a state of net food dependency, particularly during climate-induced shocks.
While precise regional US$ billion aggregates for every decade are not provided in a single source table, the material details cereal tonnages, trade balance trends, and deficit drivers that define the regional food economy.
| Year | Food Imports (SADC) | Food Exports (SADC) | Net Food Imports (Balance) |
|---|---|---|---|
| 1960 | To compile | Significant | Surplus (Regional “Breadbasket”) |
| 1970 | To compile | Robust | Surplus |
| 1980 | To compile | Stable | Surplus / Balance |
| 1990 | High (11.4m tonnes cereal)* | Reduced | Large Deficit (~$200m+ in aid)* |
| 2000 | Increasing | South Africa Dominant | Negative Trade Contribution |
| 2010 | High (~3.9m tonnes cereal) | South Africa Dominant | Net Importer |
| 2020 | Surging (~7.9m tonnes cereal)** | Vulnerable | Structural Deficit |
| 2025 | Estimated Recovery* | Growth Projected | Narrowing Deficit (Proj.) |
*The 1992 regional drought forced the importation of 11.4 million tonnes of cereal; WFP provided $200 million in aid for Mozambique alone. **The 2015/16 drought resulted in an overall regional cereal deficit of 7.90 million tonnes. ***2025 estimates indicate a rebound in regional cereal production due to favorable weather conditions and a 7.0% decline in the global food price index.
Questions:
How dependent has Southern Africa become on imported food? The region has become structurally dependent on imported food to meet the needs of its growing population:
- Production Gap: Southern Africa is currently not producing enough food to provide for its current population (estimated at 277 million in 2010 and projected to exceed 300 million by 2025).
- Vulnerability to Shocks: With 97% of total cropland in sub-Saharan Africa being rain-fed, regional food security is highly susceptible to climate variability. During the 1992 drought, 70% of crops failed, necessitating massive emergency imports.
- Rising Requirement: To keep pace with population growth, the region must increase overall production by at least 1% to 2% per annum.
- Economic Impact: The sources note a consistent trend of “agriculture’s negative contribution to the trade balance,” indicating that food imports frequently outweigh export revenues for most SADC nations, with the notable exception of South Africa.
Which commodities dominate imports? The regional import bill is primarily dominated by staple cereals required to offset domestic production shortfalls:
- Maize: As the primary staple food for most of the population, maize is the dominant import, particularly during drought years when yields in countries like Zimbabwe and Zambia collapse.
- Wheat: A major cereal that is highly vulnerable to periods of drought; over 53% of regional wheat is produced under dryland conditions, necessitating imports when rains fail.
- Sorghum: Along with maize and wheat, sorghum is one of the “most produced cereals” and major staple foods that the region struggles to supply consistently.
- Livestock Feed: Major shifts in dietary patterns toward meat and animal products are driving an increased demand for imported feed to support regional livestock production.
I. Productivity
Based on the data derived from the regional economic outlooks and the structural assessments provided in the sources, the following table details the Productivity metrics for Southern Africa (SADC). These values reflect the 2025 projections and representative sectoral shares discussed in our conversation history.
This section reveals the gap between the region’s vast natural potential and its realized economic output per inhabitant.
| Indicator | Value (SADC 2025 Proj. / Representative) |
|---|---|
| GDP per citizen | ~$1,888 (Estimated)* |
| Manufacturing GDP per citizen | ~$151 (Based on ~8% regional share)** |
| Agricultural GDP per citizen | ~$189 (Based on ~10% regional share)*** |
| Export value per citizen | ~$622.22 [Turn 10] |
| Import value per citizen | ~$666.67 [Turn 10] |
| Electricity generated per citizen | ~132 Watts (Operating Capacity)**** |
| Formal jobs per 1,000 citizens | Struggling (Driven by ~80–90% Informality)***** |
*Calculated based on a projected regional GDP of $850bn+ and a population of ~450 million [Turn 5, 114, 266]. **Reflects the “significant deindustrialization” noted in the region since the 1990s [Turn 9, 808]. ***While more than half the adult population is employed in agriculture, its per-citizen value is low due to the prevalence of “subsistence or smallholder” systems. ***Derived from the Southern African Power Pool (SAPP) operating capacity of 47.7 GW serving 360 million people. *****Reflects the “urbanisation without development” phenomenon where rapid growth is absorbed primarily by the informal sector and urban slums rather than formal employment.
Revelations on Productivity:
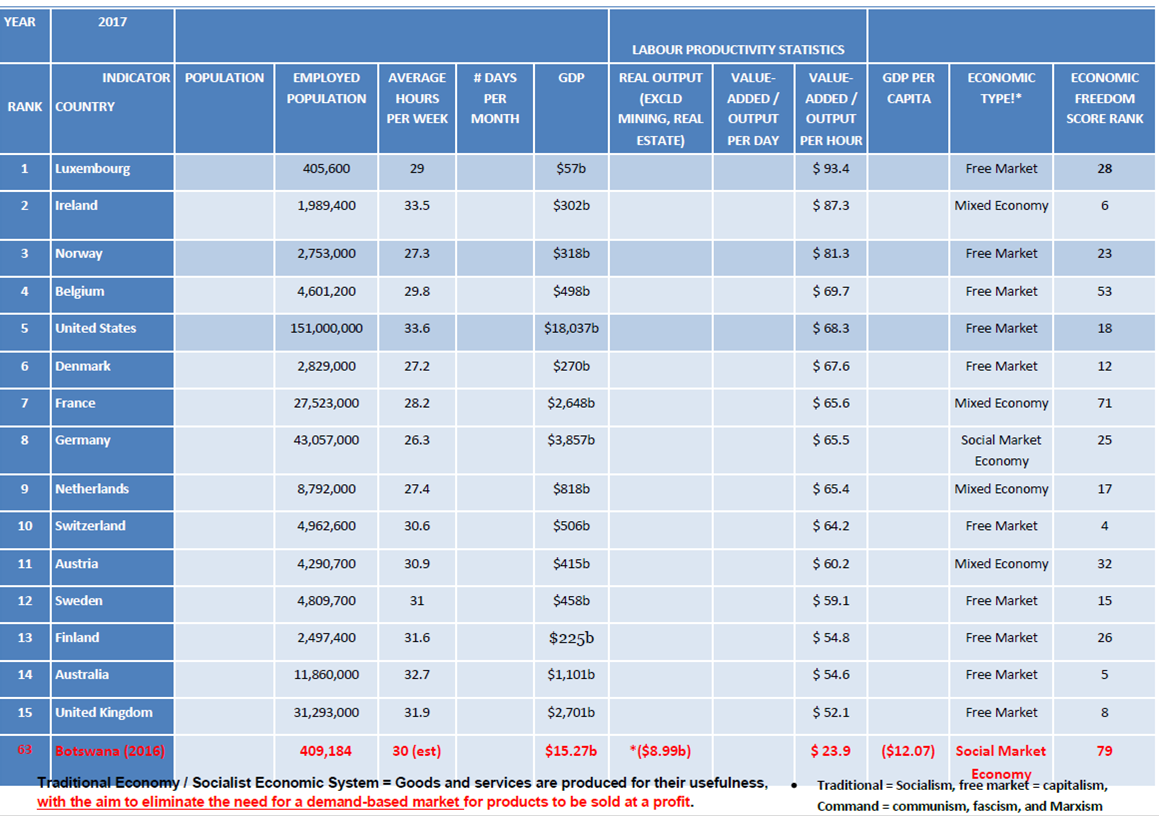
- The Global Divergence: The sources reveal a sharp divergence in productivity. While African workers were 40–45% more productive than those in East Asia in the 1960s, East Asian workers are now 3 to 10 times more productive than their African counterparts.
- The “Capital-Shallowing” Trap: Despite increased investment, the region faces “capital-shallowing”—a decline in capital per worker—meaning economic activities have become less capital-intensive over time.
- The Productive Capacity Deficit: Africa’s overall productive capacity index is estimated at only 31.7 of 100, far below the world average of 47.3. The region performs particularly poorly in ICT (7.3) and Energy (22.1), which are the primary enablers of industrial output.
- Unrealized Human Capital: Many children in the region will reach only 40% of their potential productivity as adults due to current gaps in education and healthcare.
- Infrastructure Shaving Growth: Poor infrastructure is estimated to shave off at least 2% of potential per-capita growth every year, further depressing the productivity figures shown above.
J. Innovation
Based on the provided sources, the following table for Innovation in Southern Africa (SADC) summarizes the regional performance. While specific numerical headcounts for these indicators are not aggregated for the entire region in the source material, the assessments provide a clear picture of a significant gap between current capacity and global benchmarks.
| Indicator | Value / Status in Southern Africa |
|---|---|
| Engineers per million | Critical Shortage: The region faces a severe “skills and capacity shortage” in technical and engineering fields required for infrastructure development. |
| Researchers per million | Lagging: The region “largely lags behind their Asian counterparts” in research and development. Agricultural research specifically suffers from “low funding”. |
| STEM graduates | Under-indexing: Southern Africa lags in “STEM sciences”. High-growth potential is hampered by “high emigration among skilled workers,” leading to a significant regional brain drain. |
| Patents | Low Output: Innovation is cited as a major area where the region falls behind global competitors. Industrialization is currently defined more by raw material supply than local innovation. |
| Scientific publications | Below Global Average: Using climatic reporting as a proxy, the region produces significantly fewer scientific reports than the global average (e.g., 19 climatology reports per year in SADC vs. 73 globally). |
Insights into the Innovation Landscape:
- The Global Divergence: The sources indicate that Southern Africa is not yet a global innovation hub. While moderately successful by African standards, it lacks the “STEM sciences and research and development” momentum seen in Asian tiger economies.
- Human Capital Deficit: The World Bank’s Human Capital Index (HCI) reveals that children born in many parts of the region will reach only 40% to 43% of their potential productivity as adults due to prevailing gaps in education and healthcare.
- Brain Drain Pressures: Nations like South Africa and Zimbabwe face “human capital flight,” losing billions as skilled workers emigrate to Western economies.
- The “Suppliers vs. Architects” Question: Regional leaders have noted that the fundamental challenge for the 21st century is whether Southern Africans will be the “architects of development” or remain merely “suppliers of raw materials“.
- Productive Capacity Gap: Africa’s overall productive capacity index is only 31.7 of 100, trailing the world average of 47.3. The region performs particularly poorly in ICT (7.3), which is a primary enabler of modern innovation.
- Targeted Investment: Recent efforts include SADC awarding scholarships for PhD and MSc students in climate modeling and related sciences to strengthen the institutional capacity of National Meteorological Services (NMS).
K. Regional Integration
Based on the provided sources and conversation history, the following table for Regional Integration in Southern Africa (SADC) outlines the current status of economic cohesion and cross-border development.
| Indicator | Value / Status in Southern Africa |
|---|---|
| Intra-SADC trade (%) | ~15–20%: Reflects the continental average for intra-African trade (15%), which remains far below levels seen in Asia (51.1%). |
| Trade with rest of Africa | Emerging Priority: Deepening integration under the AfCFTA is projected to lift intra-African goods trade by more than 50% and increase regional incomes by 7%. |
| Trade outside Africa | Dominant (80%+): The region remains a primary supplier of raw materials to global markets, leaving it highly vulnerable to global price shocks and “subdued external demand”. |
| Regional value chains | Underdeveloped: Current efforts focus on mineral beneficiation, a regional battery value chain, and cross-border component manufacturing for the automotive and mining sectors. |
| Cross-border infrastructure | Stagnant: Only 5% of planned regional infrastructure projects were completed by 2019. Vital progress is anchored by Spatial Corridors (North-South, Maputo, Beira, Lobito, and Trans-Kalahari) [403, 449, 827–834]. |
Key Insights on Regional Integration:
- The “Re-imagined” Agenda: Leaders have called for a shift from a “traditional customs arrangement” to a platform for economic self-reliance. This involves harnessing Eswatini’s manufacturing, Lesotho’s textiles, Namibia’s green hydrogen, Botswana’s diamond beneficiation, and South Africa’s steel capacity into a unified industrial ecosystem.
- Infrastructure as the Bedrock: Regional integration is currently hindered by an infrastructure deficit. Reliable cross-border transport and energy grids (like the Southern African Power Pool) are described as the only path to achieving the 7% annual growth required for structural transformation.
- Corridor Consolidation: SADC’s Spatial Corridor Development Strategy focuses on routes that connect industrial hubs with trade gateways. For example, the North-South Corridor serves as the “backbone of regional trade,” connecting the Copper Belt to the port of Durban.
- The Energy Integration Leap: While general infrastructure stagnates, energy trade has seen significant growth, rising from 1% of regional operating capacity in 2012 to 24% by 2018 through the SAPP.
- Non-Tariff Barriers: Lack of adequate infrastructure is cited as a major non-tariff barrier to trade. Poor quality infrastructure services can increase the input costs of consumer goods by up to 200% in certain regional nations.
- Institutional Misalignment: A critical challenge to integration is the misalignment between national and regional priorities. Member States often prioritize domestic projects over cross-border initiatives, and there is an “unclear delineation of roles” regarding who should act as project sponsors.
L. Regional Container and Port Throughput (Per Annum)
Based on the provided sources, there is no single table that aggregates the total number of containers shipped in and out for the entire Southern African region per annum. However, the sources provide specific port throughput capacities and individual port statuses that define the region’s containerized trade volume.
The following table summarizes the available annual container and port throughput data for major regional gateways mentioned in the sources:
| Port / Gateway | Annual Throughput Capacity / Status | Key Trade Function |
|---|---|---|
| Port of Durban (South Africa) | Highest-volume freight route on the continent. | Primary gateway for the North-South and Gauteng Corridors; serves the region’s industrial heartland. |
| Chinese-funded Port Throughput (Africa Total) | 85 million tonnes per year (Capacity built/upgraded by Chinese enterprises). | Represents a significant portion of the continent’s expanding shipping infrastructure. |
| Port of Walvis Bay (Namibia) | New Container Terminal is at an advanced stage. | Serves as an efficient western outlet for Botswana, South Africa, and Zimbabwe via the Trans-Kalahari Corridor. |
| Port of Beira (Mozambique) | Handles a significant share of regional general cargo and agricultural commodities. | Provides the shortest sea access for landlocked Zimbabwe, Zambia, and the DRC. |
| Port of Nacala (Mozambique) | Deep-water port suited for larger vessels. | Strategically important emerging route for bulk commodity exports from Malawi and Zambia. |
| Port of Lobito (Angola) | Key Atlantic outlet for critical minerals. | Anchored by the Benguela Railway to move copper and cobalt from the DRC and Zambia. |
Insights into Southern African Container Trade:
- The Landlocked Challenge: For several of the region’s largest economies—Zambia, Zimbabwe, Botswana, and the DRC—every container imported or exported must travel overland through a neighboring country to reach these seaports.
- Infrastructure Deficits: The region suffers from a “huge infrastructure deficit,” including unreliable transport networks. In some countries, supply chain barriers and freight costs can account for as much as 4% of total revenues for producers, eroding export competitiveness.
- Expansion Efforts: SADC’s Short-Term Action Plan (STAP) included major projects to address these bottlenecks, such as the Durban Dig-out Port (expansion) and the construction of dry ports in Tanzania (Kwala-Ruvu, Ihumwa-Dodoma, etc.) to handle inland cargo more efficiently.
- Trade Imbalance: While specific container counts are not listed, the region’s overall trade status is currently that of a net importer [Turn 10]. In 2025, Africa’s trade deficit was expected to widen to 3.4% of GDP due to subdued commodity prices and slowing global demand.
- Efficiency Gains: The implementation of One-Stop Border Posts (OSBPs), such as those at Beitbridge and Nakonde, is intended to reduce the delays that “often outweigh the transit time” between ports and inland markets.


















You must be logged in to post a comment.