
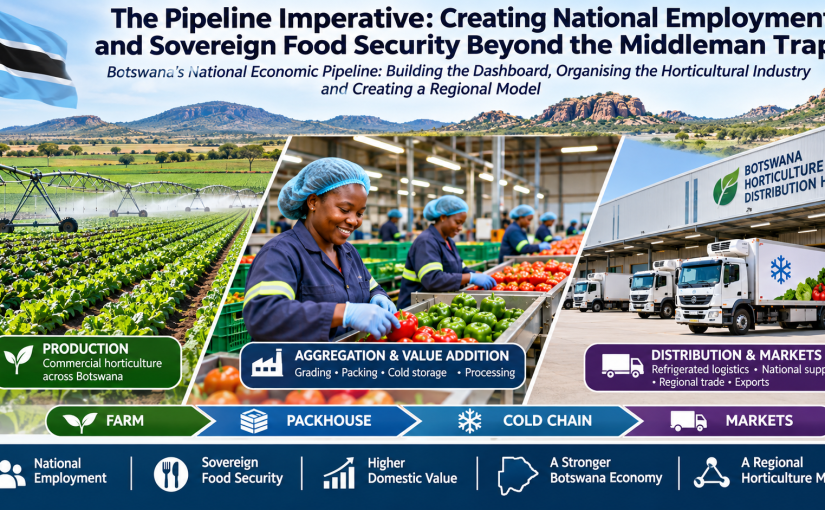
Botswana’s National Economic Pipeline: Building the Dashboard, Organising the Horticultural Industry and Creating a Regional Model
Executive Perspective
Botswana stands at a historic economic crossroads. Following the bold implementation of horticultural import restrictions, domestic vegetable and fruit production surged to an unprecedented 140,881 metric tonnes (MT) in 2025/26—up from just 58,715 MT in 2019. The national import bill plummeted from P1.2 billion in 2021 to approximately P150 million, while government matching grants under the Impact Accelerator Subsidy (IAS) surpassed P144 million, supporting over 1,630 citizen farmers. Meanwhile, flagship foreign direct investments like the Selebi-Phikwe Citrus project (>P200 million FDI out of a P491 million capital expenditure) generated 22,000 MT of export-grade fruit.
Yet, despite these production triumphs, the horticultural sector faces a structural bottleneck that threatens citizen farm viability: an estimated 35,881 metric tonnes of locally grown produce (25%) is lost annually to in-field spoilage, post-harvest heat deterioration, and supermarket rejections.
As policy makers evaluate the next stage of market organization, a seductive proposal has gained traction: importing the Johannesburg Fresh Produce Market (JFPM) commission-agent model. On the surface, floor brokerage looks vibrant, busy, and visually dynamic. However, transplanting an urban spot-market trading floor into Botswana’s developing agricultural landscape risks creating a class of speculative middlemen who extract producer margins without taking spoilage risk, while failing to solve the cold-chain deficits that lock citizen farmers out of retail supply chains.
This strategic paper presents an alternative: an Integrated National Cold Supply Pipeline. By comparing the two models across job creation, risk absorption, price stability, and farmer support systems, this analysis demonstrates why a national pipeline is the essential engine to secure citizen farm profitability, eliminate post-harvest waste, and generate thousands of sustainable industrial and rural jobs across Botswana.
1. The Middleman Trap: Why the Commission Agent Model Fails Botswana
The Johannesburg commission-agent model was designed a century ago for a massive, highly dense agricultural market with established cold infrastructure. In that setting, commission agents act as floor brokers matching spot buyers and sellers, taking a 5% to 12% cut on gross sales.
When applied to Botswana’s current horticultural reality, the commission-agent concept introduces severe economic distortions:
- Zero Risk-Taking: Commission agents do not own cold trucks, do not build refrigerated packhouses, and do not buy crops. If 10 tonnes of citizen tomatoes rot on a market floor during a seasonal heatwave or market glut, the farmer absorbs 100% of the financial loss. The agent incurs no loss and simply collects a fee on whatever portion sells.
- Extraction of Producer Margins: By taking an 8% to 15% commission off gross turnover, floor traders reduce the net revenue returning to the farm gate. In a sector where smallholders already face high input costs for seeds, fertilizers, and solar irrigation, this margin extraction destroys farm profitability and forces farmers to cut field wages.
- Failure to Solve Retail Access: Major South African supermarket chains operating in Botswana enforce strict quality standards, maximum residue limits (MRL), uniform grading, and temperature-controlled deliveries. Supermarket distribution centers reject smallholder crops due to broken cold chains—not due to a lack of floor brokers. An agent standing on a trading floor cannot fix a heat-damaged cucumber.
- Incentivizing Market Chaos: Commission agents thrive on daily price volatility. During seasonal harvest peaks, agents drop floor prices to clearance levels, forcing smallholders to sell below production cost. This volatility discourages planned, staggered planting and keeps the national agricultural economy fragmented.
2. The Employment Math: Floor Traders vs. A National Supply Grid
A primary argument advanced by proponents of the commission-agent model is job creation. However, a rigorous comparative analysis reveals that spot-market brokerage produces a low-volume, urban-centric employment footprint, whereas an Integrated Cold Supply Pipeline creates a multi-tiered, nationwide industrial labor market.
┌────────────────────────────────────────────────────────────────────────┐│ COMMISSION AGENT MODEL (Urban Floor Brokerage) ││ ──> Concentrated urban floor traders & commission brokers ││ ──> Squeezes farm profitability ──> Reduces rural farm-level wages │└────────────────────────────────────────────────────────────────────────┘┌────────────────────────────────────────────────────────────────────────┐│ INTEGRATED NATIONAL PIPELINE (Distributed Cold Supply Grid) ││ ──> Rural packhouse managers & pre-cooling technicians ││ ──> Digital quality control, grading & MRL compliance officers ││ ──> Logistics dispatchers & refrigerated fleet drivers ││ ──> District agronomic planners & extension coordinators ││ ──> Industrial agri-processing workers (curbing 35,881 MT loss) ││ ──> Expands farmer revenue ──> Multiplies farm & rural employment │└────────────────────────────────────────────────────────────────────────┘
Comparative Job Creation Matrix
| Job Category | Commission Agent Floor Model | Integrated National Supply Pipeline |
|---|---|---|
| Primary Location | Central urban trading floors (e.g., Gaborone/Francistown). | Distributed across all rural agricultural districts (Chobe, Tuli, Boteti, Lobatse, Central). |
| Direct Roles Created | Floor sales agents, desk brokers, manual off-loaders. | Packhouse supervisors, refrigeration technicians, digital graders, MRL lab technicians, fleet drivers, processing operators, agronomic data planners. |
| Indirect Employment Impact | Negative: Erodes farmer margins, forcing farms to reduce field labor. | Highly Positive: Expands farm gate revenues, enabling commercial farms to scale field labor (expanding the current 66% citizen / 34% foreign labor force into formal, year-round employment). |
| Skill & Salary Profile | Low-tier, transactional sales commission roles. | Skilled technical, engineering, logistical, and managerial positions with long-term career pathways. |
| Industrial Spillover | Minimal: No processing or infrastructure integration. | High: Drives local manufacturing in packaging, cold-room assembly, transport maintenance, and value-added food processing. |
3. What the Pipeline Delivers: A Structural Safety Net for Citizen Farmers
An integrated pipeline moves horticultural management from chaotic spot trading to a structured, demand-driven value chain. It provides four critical support systems that commission agents can never deliver:
A. Farm-Gate Pre-Cooling & Cold Chain Preservation
Survey data indicates that only 1 out of 102 surveyed smallholders in Botswana owns a cold room, and only 1 utilizes a refrigerated transport vehicle. The National Pipeline establishes regional aggregation hubs equipped with rapid pre-cooling facilities and climate-controlled transport fleets. By cooling produce immediately after harvest, the pipeline directly targets the 35,881 MT in annual post-harvest losses, transforming spoiled crops into saleable inventory.
B. Standardized Quality Grading & Retail Off-Take Compliance
Rather than leaving farmers to negotiate individually with supermarket procurement managers, pipeline aggregation hubs inspect, wash, sort, and package produce to exact retail specifications. This guarantees that smallholder output meets the stringent requirements of national retail chains, replacing informal rejection with guaranteed contract fulfillment.
C. Transparent Cost-Plus Pricing & Financial Security
The pipeline operates on transparent, cost-plus pricing contracts linked to verified quality grades. By shielding farmers from predatory daily price drops during harvest gluts, the pipeline ensures that citizen growers earn predictable returns, enabling them to service CEDA and NDB loans and reinvest in greenhouse and drip irrigation infrastructure.
D. Coordinated District Cropping Schedules
To prevent localized gluts—such as simultaneous overproduction of cabbage across multiple districts—the pipeline utilizes a national digital dashboard. Agronomic planners coordinate planting schedules across ecological zones (e.g., balancing Chobe’s winter output with Tuli Block’s summer production), maintaining a smooth, year-round supply that matches national consumption patterns (restoring ~44.8 kg/person/year net availability up to natonal historical highs of 58.4 kg/person/year).
4. Macroeconomic Impact: Reclaiming P250 Million in Lost National Wealth
The strategic justification for an Integrated Supply Pipeline extends beyond individual farm gate economics to national fiscal stability:
- Monetizing Post-Harvest Waste: The 35,881 MT of produce currently lost to spoilage represents over P250 Million in uncollected farm revenue. Recovering even 70% of this lost volume through cold pipeline logistics immediately injects P175 million back into the rural economy.
- Reinforcing Import Substitution: While trade bans reduced imports from 94,954 MT in 2021 to ~25,000 MT in 2025/26, retail shortages still occur during seasonal transitions. A cold pipeline stores and distributes seasonal surpluses, permanently closing the remaining import gap without triggering food inflation.
- Crowding in Private Capital: Government commitments, such as the P65 Million allocated toward Letsema market infrastructure, act as seed capital. Demonstrating a structured pipeline attracts further private logistics investment, building on private benchmark facilities like the P65 Million Safe Pro cold storage unit in Sherwood.
5. Roadmap for National Leadership: Organizing for Execution
Achieving this vision requires joint strategic coordination between the primary government institutions governing production and trade. National leadership must move beyond fragmented initiatives and convene a unified executive briefing.
┌────────────────────────────────────────────────────────────────────────┐│ JOINT MINISTERIAL EXECUTIVE BRIEFING ││ ┌──────────────────────────────────┐ ┌──────────────────────────────┐ ││ │ Ministry of Agriculture │ │ Ministry of Entrepreneurship │ ││ │ (IAS Grants, Extension, Yields) │ │ & Trade / CEDA / NDB │ ││ └──────────────────────────────────┘ └──────────────────────────────┘ │└───────────────────────────────────┬────────────────────────────────────┘ │ ▼┌────────────────────────────────────────────────────────────────────────┐│ DELIVERABLES & DECISION AGENDA ││ 1. Empirical Horticultural Employment & Value-Chain Study ││ 2. Integrated National Cold Supply Pipeline Architecture ││ 3. Capability Gap Assessment & 10-Year Implementation Roadmap │└────────────────────────────────────────────────────────────────────────┘
Action Plan for Government Engagement
- Convene Joint Ministerial Briefing: Secure a formal working session uniting the Minister of Agriculture and the Minister of Entrepreneurship/Trade, alongside senior leadership from CEDA, NDB, and the Competition Authority.
- Present the Empirical Employment Study: Share full econometric data proving that the Integrated Supply Pipeline generates five times more skilled, distributed jobs than an urban agent floor model.
- Establish the Pipeline Infrastructure Blueprint: Review the spatial layout for regional aggregation hubs, cold-fleet logistics, and digital market dashboards.
- Define Capability & Skills Development Programs: Commit to a structured capability-building roadmap to train Batswana youth as cold-chain engineers, packhouse managers, digital crop graders, and supply chain managers.
Conclusion
Botswana’s horticultural sector has successfully proved its capacity to produce. The national imperative now is to build the pipeline that protects this production. Copying a century-old commission-agent model will lock citizen farmers into a cycle of predatory spot pricing, unabsorbed spoilage, and retail exclusion.
By investing in an Integrated National Cold Supply Pipeline, Botswana can eliminate post-harvest waste, protect citizen farm capital, and establish a vibrant, multi-industry employment engine that guarantees national food sovereignty for generations to come.
From the conversation with Mr Ratsele Molefhe to a national industry architecture
1. The conversation: a bigger question than the role of agents
The conversation with Mr Molefhe began with a question about how agents could organise the marketing and distribution of horticultural produce in Botswana. The Johannesburg Fresh Produce Market (JFPM) commission-agent model offers a familiar reference point: farmers consign their produce to agents, who negotiate sales with buyers and earn commissions on transactions. It is an established commercial arrangement within a large agricultural market, and it is understandable why its visible activity and market connections might appear attractive when considering how Botswana should organise its growing horticultural sector.
However, the question facing Botswana reaches considerably further. Who will organise the national horticultural economy so that production responds to actual demand, farmers have reliable market access, produce moves efficiently, consumers receive affordable food, and the resulting economic activity creates employment and domestic value? An agent-driven marketplace can facilitate transactions. A national economic pipeline must organise the productive system that generates those transactions in the first place.
This distinction is central to the discussion. The objective is to help Mr Molefhe and the wider industry move from considering a market arrangement to considering a national industry architecture. The first industry meeting can provide the starting point: a shared examination of what Botswana needs to organise, what information must be available, which institutions and businesses must work together, what capabilities are required, and how the country can build a model that becomes a reference point for the region.
The opportunity is considerably larger than establishing a trading floor. Botswana can develop a demand-led national economic pipeline, beginning with horticulture, supported by a national dashboard and connected through physical production, aggregation, processing, logistics and distribution corridors. This architecture can become a practical foundation for employment creation, food security, industrial development and regional trade.
2. Botswana has increased production. The next task is to organise the economy around it.
The horticultural production figures in the strategy document indicate a significant expansion in domestic production. Production is reported to have increased from 58,715 metric tonnes in 2019 to 140,881 metric tonnes in the 2025/26 season. The document also reports that the Horticulture Impact Accelerator Subsidy (IAS) exceeded P144 million, supporting more than 1,630 citizen farmers across over 5,192 hectares. Import expenditure is reported to have fallen from P1.2 billion in 2021 to approximately P150 million.
These figures describe a substantial production response. They also raise a more demanding economic question: how much of the production reaches the intended market, at what cost, through which commercial channels, and with what value retained by Botswana’s farmers, workers and businesses? Production volume alone cannot answer those questions. The country needs visibility across the full movement of produce, from the original production decision through to final consumption, processing or export.
The strategy estimates annual losses of 35,881 metric tonnes, valued at more than P250 million in uncollected farm revenue. It also identifies supermarket rejection, inconsistent grading, maximum residue limit (MRL) requirements, inadequate pre-cooling, fragmented delivery arrangements and insufficient cold-chain capacity as structural constraints. These estimates and operational claims require validation against the underlying food balance data, survey methodology and current facility performance. They nevertheless identify the central organising challenge: Botswana’s ability to produce has advanced, while the national systems connecting production to markets require further development.
The national task is therefore to convert production capacity into a dependable economic flow. That requires demand intelligence, coordinated production, aggregation, quality assurance, storage, processing, transport, distribution, commercial arrangements and performance information to operate as one connected system.
3. Two different ways of organising the horticultural industry
An agent-driven marketplace and a national supply pipeline perform different functions. The agent model primarily organises transactions between producers and buyers. The pipeline organises the relationships between demand, productive capacity, physical movement, market requirements and the institutions responsible for coordinating the system.
An agent can connect a farmer to a buyer, negotiate a sale, arrange a consignment or provide distribution. These services can have commercial value. The wider question is whether each farmer should have to independently find market information, negotiate buyer access, coordinate collection, arrange quality compliance and manage several intermediary relationships after the country has already invested in production support.
A national pipeline changes the starting point. It establishes what the market requires, translates that demand into production plans, coordinates farmers and clusters, and organises the movement of produce through the appropriate infrastructure and commercial services. Agents and other service providers can then operate within a system whose requirements, information flows and responsibilities are visible.
The pipeline is the organising system. Agents are service providers within that system. This is the distinction that should guide the discussion with Mr Molefhe.
Systematic comparison: commission-agent floor and national pipeline
| Economic dimension | Commission-agent floor model | Integrated national supply pipeline |
|---|---|---|
| Operational concept | Urban commission traders negotiating daily spot prices between individual growers and buyers | Integrated digital and physical network connecting demand, farm clusters, aggregation, processing, logistics and markets |
| Primary function | Facilitates transactions involving produce arriving at the market | Organises demand-led production, quality, aggregation, storage, distribution and market delivery |
| Risk and loss allocation | Under the consignment arrangement described in the source, the farmer carries the risk of unsold or spoiled produce; contractual terms determine the precise allocation | Reduces losses through planned production, pre-cooling, grading, storage and coordinated delivery; risk allocation is defined through commercial agreements |
| Pricing and revenue | Daily spot prices and commission charges, with exposure to seasonal price volatility | Transparent cost and margin structures, quality specifications and scheduled commercial arrangements |
| Retail integration | Brokerage alone cannot provide grading, MRL compliance, cold-chain integrity or reliable delivery schedules | Coordinates the physical and quality requirements of retail procurement |
| National market visibility | Information may remain distributed among individual agents and private transaction records | A shared national dashboard provides visibility of demand, production, inventory, prices and deliveries |
| Employment profile | Brokerage and market-handling roles concentrated around trading locations | Employment across farms, clusters, packhouses, quality assurance, cold storage, logistics, processing, data and commercial management |
| Economic reach | Primarily transaction-focused | Connects production, services, manufacturing, trade, employment and national food security |
The commission rates cited in the working material vary: 5–12%, 5–15% and 8–15%. These ranges should be checked against the actual JFPM arrangements and the proposed Botswana model before they are used as a definitive rate. Similarly, the degree of risk carried by an agent depends on the consignment contract, the transfer of title and the allocation of losses. The important distinction is that a commission arrangement by itself does not provide the cold-chain infrastructure, national demand intelligence or production coordination that Botswana requires.
The JFPM model emerged within a mature, high-volume agricultural environment with established market infrastructure. Botswana must consider its own production geography, market size, infrastructure, institutional capabilities and farmer structure when designing its arrangements. A familiar trading-floor model cannot substitute for the wider work of organising the national industry.
4. The national economic pipeline: three interconnected spines
The pipeline should be organised through three interconnected management structures: the Demand Spine, the Supply Spine and the Throughput Spine. These are functional components of one national system. They provide a practical basis for defining institutional responsibilities, professional capabilities, information requirements and the physical infrastructure needed to move produce from production to market.
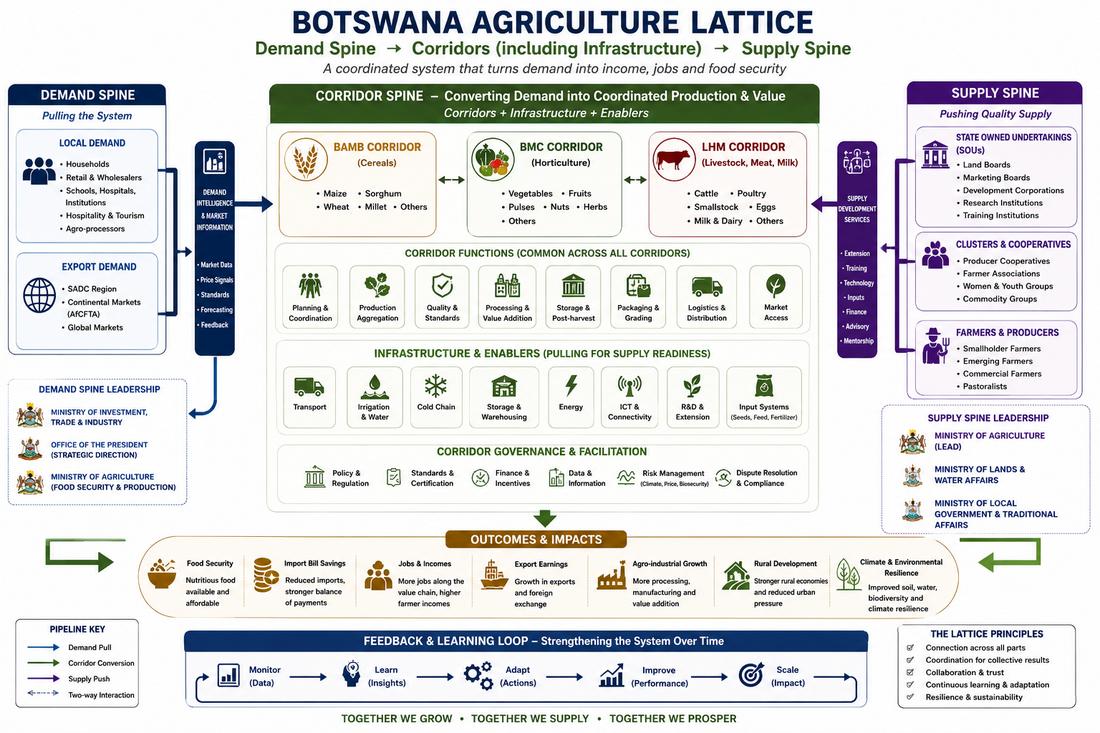
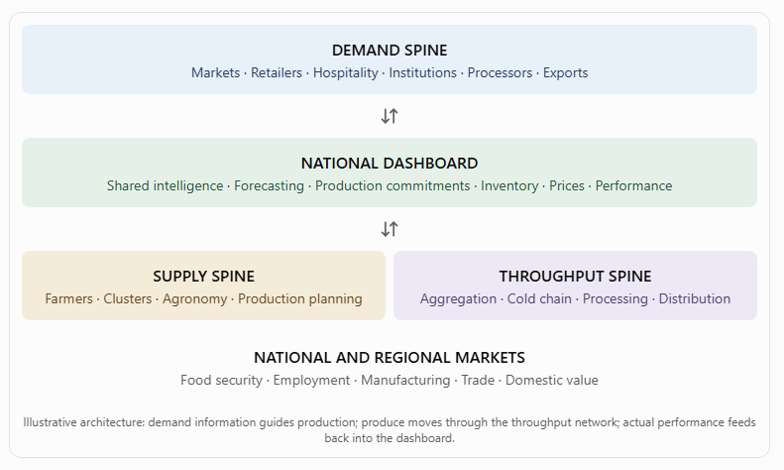
The Demand Spine — Ministry of Trade and the wider economic-development system
The Demand Spine establishes what the market requires, in what quantities, at what time, to which specifications and at what price expectations. It must cover household consumption, grocery retailers, hotels, restaurants, hospitals, schools, public institutions, food manufacturers, wholesale markets and regional export markets.
Demand intelligence must identify crop varieties, grades, volumes, packaging, delivery locations, seasonal requirements, contract conditions and market absorption. It must also distinguish between projected demand, confirmed orders and actual purchases. This information provides the basis for determining what Botswana should produce and where the market opportunity exists.
The Supply Spine — Ministry of Agriculture
The Supply Spine organises the country’s productive capacity. It identifies farmers, land, water, infrastructure, crop suitability, production capacity and the geographic organisation of farmer clusters. It translates market requirements into coordinated production plans, including crop selection, planting schedules, expected harvest volumes, quality specifications and delivery commitments.
Farmers and clusters must be able to work against a clear production requirement. This strengthens the relationship between public production support, commercial farming decisions and actual market opportunities.
The Throughput Spine — aggregation, logistics, processing and distribution
The Throughput Spine organises the physical movement of produce from farms and clusters to aggregation points, processors, retailers, institutions and consumers. It covers collection, pre-cooling, grading, certification, washing, sizing, packaging, storage, refrigerated transport, distribution and export logistics.
Its infrastructure requirements must emerge from the production flow and market demand. A cold room, packhouse, distribution centre or processing facility should be located and sized according to the volumes, timing, geography, throughput and delivery requirements it will serve.
These three spines must operate as one system. Demand information moves upstream to guide production. Produce and commercial value move downstream to markets. Actual performance, sales, prices, inventory and delivery information then feed back into the next production cycle.
The national pipeline is therefore more than a physical route for moving vegetables. It is an organising mechanism for information, people, infrastructure, commercial relationships, decisions and accountability.
5. The national dashboard: the industry’s shared intelligence centre
The three spines require a common information architecture. The national dashboard should become the industry’s shared intelligence centre, providing an integrated picture of demand, production, physical supply movement, market absorption and economic performance.
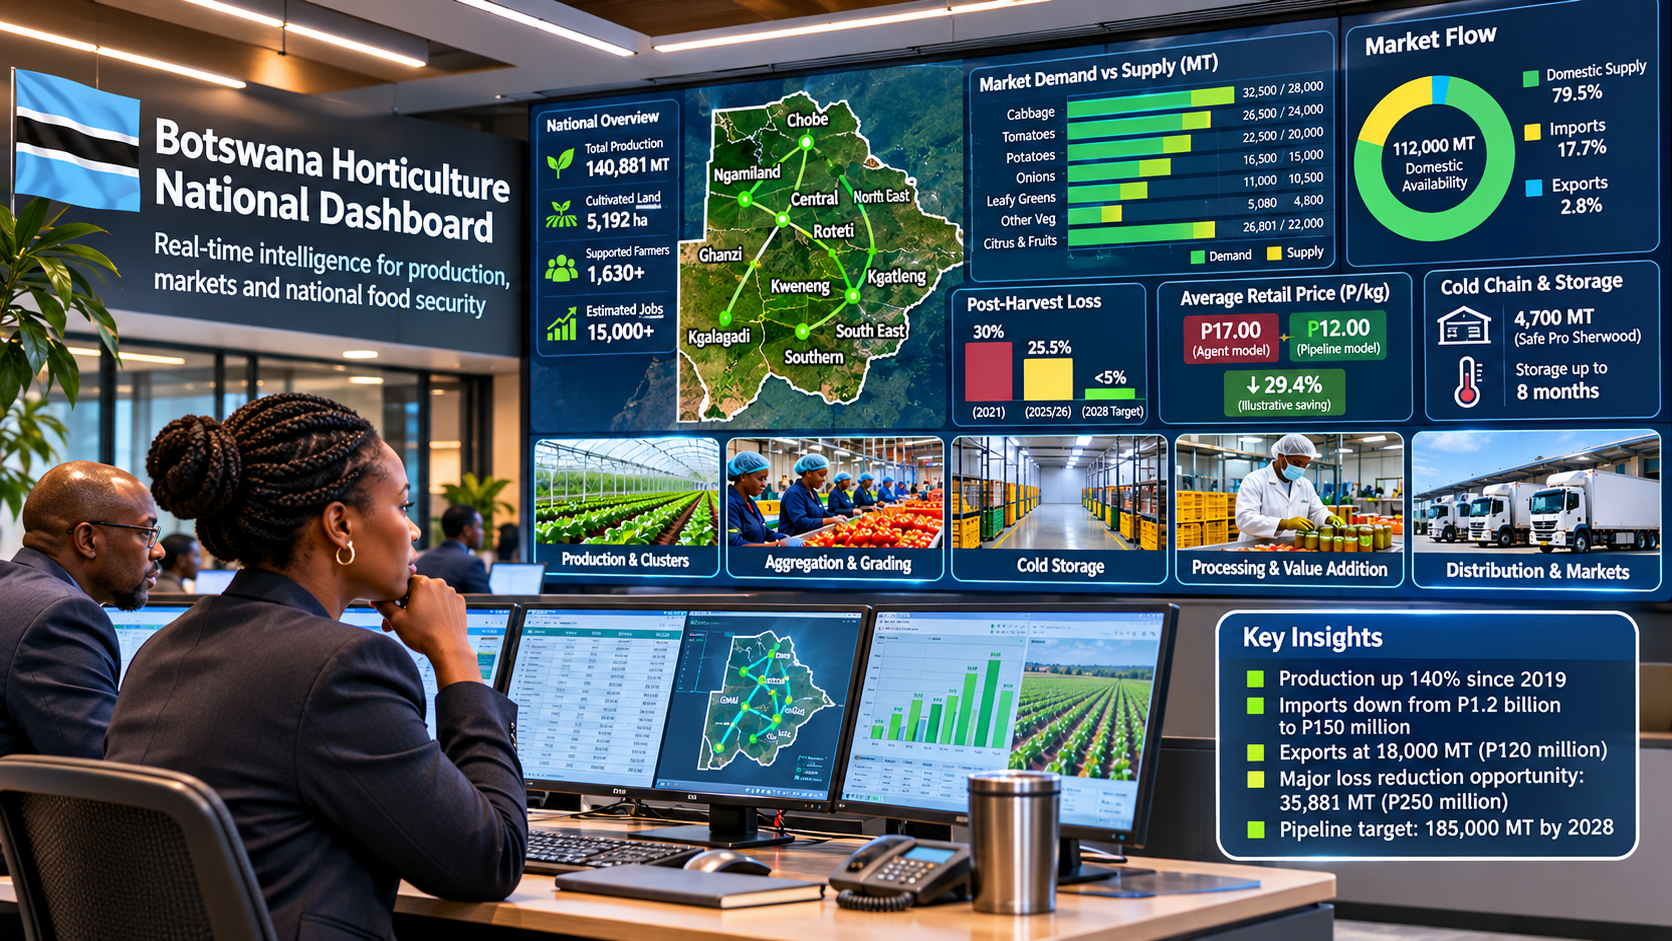
A registration database showing farmers and hectares planted is useful, but it is only one part of the information required. The dashboard must show the relationship between what the market requires, what farmers plan to produce, what is actually harvested, what enters the distribution system and what ultimately reaches consumers, processors or export markets.
Core information requirements for the national dashboard
| Information area | Data to be captured | Principal management question |
|---|---|---|
| Market demand | Crop, variety, grade, volume, location, season, delivery schedule and buyer requirements | What does the market require, and when? |
| Confirmed orders | Retail, institutional, hospitality, processing and export orders | What demand is commercially committed? |
| Production capacity | Farmers, clusters, hectares, crop plans, land, water and productive capacity | What can the country produce, where and when? |
| Planting and harvest | Planned planting, actual planting, crop progress, expected harvest and actual harvest | Is production following the national plan? |
| Aggregation | Quantities dispatched, received, graded, accepted and rejected | What volume enters the formal distribution system? |
| Storage and cold chain | Facility capacity, actual inventory, storage duration, temperature integrity and utilisation | Where is produce held, and for how long? |
| Distribution | Dispatch quantities, routes, delivery schedules, quantities received and delivery performance | Is produce reaching its intended destination? |
| Market absorption | Retail sales, institutional use, processing volumes, wholesale sales and exports | How much produce is actually absorbed by the market? |
| Trade flows | Imports, exports, regional movements and seasonal trade | Where is Botswana importing from and where can it supply? |
| Price formation | Farm-gate, aggregation, wholesale and retail prices; commissions and service charges | Where are costs and margins accumulating? |
| Employment and value | Jobs by occupation, location and employment type; farmer revenue and domestic value retained | What economic value is the pipeline creating? |
| Losses and discrepancies | Spoilage, rejection, delays, diversion, unexplained inventory differences and unsold produce | Where is value being lost, delayed or diverted? |
The dashboard must also support appropriate commercial confidentiality and access rules. It should provide shared national planning information while protecting sensitive buyer contracts, individual commercial terms and proprietary business information. Its governance should establish who can submit data, who can access it, how information is verified, and how discrepancies are investigated.
There is an important national-interest dimension here. Whoever controls demand information has considerable influence over what farmers produce and who gains access to markets. A shared national dashboard reduces the risk that essential market intelligence becomes concentrated in a small number of private hands. It gives government, farmers, lenders, processors, retailers and service providers a common basis for planning and investment.
The dashboard should also record actual physical movement. It must distinguish between a forecast harvest and produce that has been harvested, dispatched, received, stored, sold or exported. This is essential for understanding market shortages, inventory levels, price movements and the possibility of deliberate supply suppression.
6. Farmers, clusters and the changing role of agents
Once market demand has been quantified, the Ministry of Agriculture and cluster management can coordinate farmers around agreed production requirements. Farmers should have clarity on the crop, quantity, quality, planting schedule and delivery period required by the market. This creates a more dependable relationship between the farmer’s production decision and the commercial opportunity.
The farmer’s principal responsibility is to produce the agreed quantity and quality. The national production system and cluster management provide the coordination that supports this commitment. This includes technical guidance, production monitoring, aggregation planning and communication with the relevant market channels.
This is where the role of agents changes fundamentally. Once the farmer has agreed with cluster management and Ministry of Agriculture data on what to produce, and has produced the required quantity and quality, the farmer’s principal external service requirement is distribution. A distribution agent can provide collection, transport, delivery coordination and related services under a transparent service agreement.
The farmer should not have to pay several intermediary layers separately for market information, buyer connections, procurement coordination and access to a market that the national system has already identified and organised. These functions should be coordinated as part of the pipeline. Commercial service providers remain important, but their responsibilities and charges should be clear.
The distribution agent becomes a competitive service provider within the pipeline, rather than the gatekeeper of the farmer’s market access, buyer information or commercial relationships. This distinction allows private enterprise to participate while reducing unnecessary intermediation and cumulative charges.
The role of the agent within the pipeline
| Function | Organising responsibility | Role of commercial service providers |
|---|---|---|
| National demand intelligence | Demand Spine and dashboard | Provide market data, buyer information and specialist research under agreed standards |
| Production planning | Ministry of Agriculture and production coordination | Provide technical services, inputs and contract-farming support |
| Farmer and cluster coordination | Agricultural coordination and cluster management | Provide contracted technical, operational and management services |
| Buyer requirements and commercial agreements | Demand management and market coordination | Participate in procurement, contracting and buyer services |
| Aggregation and quality | Throughput coordination and accredited facilities | Operate packhouses, grading, certification, storage and handling services |
| Distribution | Throughput planning and delivery coordination | Compete to provide collection, transport and delivery services |
| Market feedback | National dashboard and system governance | Submit verified delivery, sales, inventory and performance data |
This arrangement is not an attempt to remove commercial enterprise from the horticultural economy. It is an attempt to organise the functions so that businesses compete to provide valuable services within a coordinated national system. The pipeline creates opportunities for logistics companies, warehouse operators, graders, processors, transport providers, data businesses and commercial agents, while giving farmers a clearer route to market.
7. Price formation, the spoilage tax and the cost of intermediation
The price consumers pay for produce accumulates across the journey from farm to market. It can include the farm-gate price, procurement and brokerage charges, collection, grading, packaging, storage, transport, losses, wholesale margins and retail margins. The purpose of the pipeline is to identify the legitimate costs of these activities, expose duplication and inefficiency, and improve the transparency of the margins accumulated along the way.
One of the highest hidden costs is the spoilage tax. When produce is lost in the field, deteriorates during transit or is rejected after arrival, the cost of that loss can be recovered through the price of the produce that survives. Consumers may therefore pay more because the system has lost produce elsewhere. Farmers, meanwhile, may receive little or no return on the produce that was lost.
The working strategy provides an illustrative comparison of a one-kilogram basket under a commission-agent spot model and an integrated cold-pipeline model. It estimates a consumer price of P17 per kilogram under the agent model and P12 under the pipeline model. The comparison illustrates how lower spoilage and more coordinated logistics could reduce the cost reaching the consumer while allowing the farmer a higher baseline return.
Step-by-step retail price build-up comparison: illustrative 1 kg basket
| Price build-up stage | Commission-agent spot model (BWP) | Integrated cold-pipeline model (BWP) | Economic impact and driver |
|---|---|---|---|
| 1. Baseline farm-gate cost | P6.00/kg | P6.50/kg | Pipeline model provides a higher, more predictable grower return |
| 2. Post-harvest waste / spoilage factor | +P2.57/kg (30% loss) | +P0.34/kg (less than 5% loss) | Pre-cooling and cold-chain management reduce the spoilage cost |
| 3. Middleman / logistics fee | +P1.03/kg (12% agent fee) | +P1.20/kg (integrated cold logistics) | Replaces floor brokerage with coordinated physical logistics |
| 4. Uncooled transit and handling | +P1.50/kg | Included in pipeline | Reduces separate uncooled handling and transit costs |
| 5. Retail supermarket risk markup | +P5.90/kg (high-risk allowance) | +P3.96/kg (standard retail margin) | More reliable grading and delivery reduce retailer risk |
| Final consumer checkout price | P17.00/kg | P12.00/kg | P5.00/kg difference; approximately 29.4% lower |
| Consumer home shelf life | 24–48 hours | 7–10 days | Longer household usability through improved handling and preservation |
The P5 difference represents an illustrative saving of approximately 29.4% against the P17 comparison price. The model’s components add to the stated totals. These are scenario values supplied in the strategy document; they should be treated as a model for testing rather than a verified national retail price survey. Actual results will vary by crop, grade, season, route, storage requirement, contract and retailer.
The scale of the potential value is worth examining. If a P5/kg saving were achieved across different annual throughput volumes, the resulting scenario values would be:
| Annual throughput | Illustrative saving at P5/kg |
|---|---|
| 1,000 MT | P5 million |
| 10,000 MT | P50 million |
| 25,000 MT | P125 million |
| 50,000 MT | P250 million |
| 100,000 MT | P500 million |
These figures are scenario calculations, not guaranteed savings or realised national benefits. They show why the industry should measure cost per kilogram across the entire pipeline. The objective is to improve farmer returns and consumer affordability together by reducing avoidable losses, duplicate handling and unnecessary intermediary charges.
8. Artificial scarcity: monitoring the movement of produce
A further issue for the national dashboard is the possibility of artificial supply suppression. A genuine shortage may result from weather, seasonality, crop failure or insufficient productive capacity. A different situation arises when available produce is deliberately withheld, delayed, diverted or restricted from reaching the market in order to influence prices.
Where several intermediary layers control information and the movement of produce, opportunities for artificial scarcity may increase. Prices can rise even when sufficient produce exists within farms, aggregation facilities, storage or distribution networks. The farmer may receive no corresponding benefit from the higher price paid by the consumer.
Regulation of agents alone cannot resolve this issue. The pipeline must track what was produced, harvested, dispatched, received, graded, stored, sold, diverted, exported or lost. It must compare actual supply with market deliveries and price movements, identifying discrepancies for investigation. A price increase alongside a fall in market deliveries may be a signal requiring investigation; it is not, by itself, proof of deliberate manipulation.
The dashboard therefore becomes a practical instrument of market transparency and accountability. It enables the industry and relevant authorities to distinguish genuine supply shortages from breakdowns in distribution, inventory accumulation, delayed deliveries or potentially deliberate withholding.
The pipeline must remain wide. Production capacity, throughput, distribution, information and market access must expand together. A system that produces sufficient food but allows its movement to become artificially restricted will struggle to deliver the food-security and affordability benefits that production growth should create.
9. The physical corridor: building infrastructure around the flow
The national pipeline requires a physical network that connects production clusters to markets. The Integrated National Cold Supply Pipeline is a major component of the Throughput Spine, but it is one part of the wider national economic pipeline. Its purpose is to preserve quality, reduce losses, support aggregation and make reliable delivery possible.
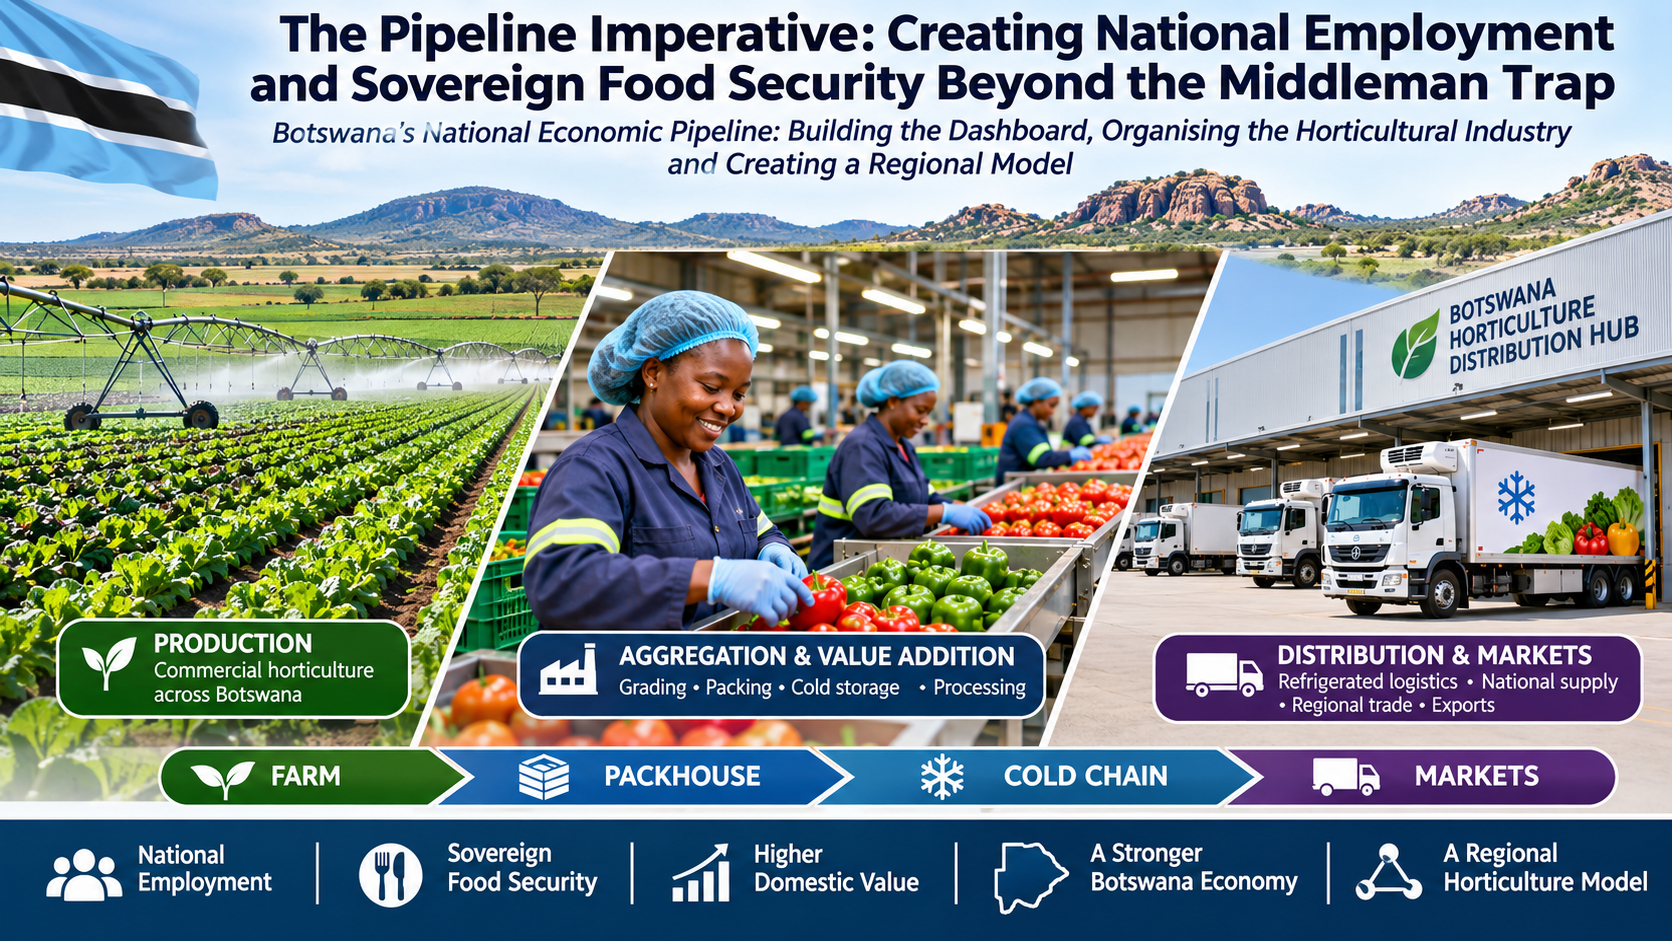
The operational sequence can include:
Farm production clusters → farm packhouses and pre-cooling → refrigerated transport → regional aggregation hubs → grading and certification → cold storage → processing and distribution → retail, institutional and export markets.
Facilities such as CEDA Letsema and the Safe Pro Sherwood facility are identified in the working material as elements of the existing or emerging infrastructure landscape. The source reports a 4,700-tonne capacity for the Safe Pro facility and a P65 million investment, with storage capability of up to eight months. These figures, together with current operational status, actual utilisation, temperature performance and commercial access arrangements, should be verified before infrastructure planning relies on them.
The strategy also identifies a significant infrastructure gap among smallholders: in a survey of 102 smallholders, only one reportedly owned a cold room and only one used a refrigerated truck. This is an important indicator of the scale of the challenge, subject to verification of the survey methodology and sample coverage.
Infrastructure planning must follow demand, production geography, seasonality and throughput. A distribution centre, cold-storage facility or packhouse should be justified by the actual volumes it will handle, the routes it will serve, the time produce needs to be held and the commercial requirements of its buyers. Building facilities first and searching for throughput afterwards risks creating expensive assets that fail to solve the underlying problem.
The same principle applies to processing. Produce that does not meet fresh retail specifications may still have value for processing, depending on food safety, quality and the intended product. The working strategy identifies NAPRO and potential products such as tomato paste, juices, pickles and dried produce. Processing can provide an additional market for suitable seasonal surplus, create manufacturing employment and retain more value within Botswana.
Seasonal coordination is equally important. The strategy gives the example of balancing Chobe’s winter output with Tuli Block’s summer production. The dashboard and production planners should use such geographic and seasonal differences to organise a more consistent national supply, reducing simultaneous gluts and improving year-round market availability.
10. The skills required to organise the pipeline
The pipeline requires a multidisciplinary management capability across the three spines and the information systems connecting them. Agricultural officers alone cannot manage the full national system, just as commercial agents alone cannot organise it. The work requires professionals in economics, mathematics, statistics, operations research, horticulture, engineering, logistics, quality assurance, commercial management, information systems and governance.
The absence of a particular skill in the current workforce establishes a capability-building requirement. It gives Botswana a reason to identify the expertise needed, quantify the gaps, determine where the skills can be sourced and organise their development. The pipeline itself provides the framework for identifying the country’s skills requirements.
Professional capabilities required across the national pipeline
| Capability | Skills required | Principal responsibility |
|---|---|---|
| Demand intelligence | Mathematicians, statisticians, economists, market researchers and data analysts | Quantify demand and identify market requirements |
| Production planning | Agricultural economists, operations researchers and production planners | Translate demand into production volumes, locations and schedules |
| Agricultural coordination | Agronomists, horticulturalists, irrigation and crop specialists | Assess and coordinate productive capacity |
| Farmer and cluster management | Extension specialists, cluster coordinators and farm managers | Organise farmers and monitor production commitments |
| Aggregation and quality | Food scientists, post-harvest specialists and quality assurance officers | Manage collection, grading, standards and consolidation |
| Logistics and distribution | Supply-chain specialists, transport planners and cold-chain managers | Coordinate physical movement and delivery |
| Commercial management | Procurement, contract and trade specialists | Coordinate buyer requirements and commercial agreements |
| Information and governance | Systems analysts, information managers, auditors and monitoring specialists | Operate the dashboard, track performance and identify discrepancies |
These capabilities do not all have to sit within one institution. Their institutional placement should follow function, mandate and accountability. What matters is that the capabilities exist, that responsibilities are clear and that the three spines are connected.
Botswana can map the expertise already available across ministries, universities, research institutions, the private sector and professional bodies. Critical specialist expertise can be recruited from the region or internationally, with structured knowledge transfer and local professional development. Partnerships with tertiary institutions, internships, practical placements and postgraduate training can build the next generation of cold-chain engineers, packhouse managers, digital crop graders, supply-chain specialists and agricultural planners.
11. How many people are required to manage the pipeline?
The discussion must move beyond naming professional disciplines to estimating the actual workforce required. An initial planning hypothesis in the working material proposes a national coordinating unit of approximately 25–35 specialists. Regional aggregation corridor teams could require approximately 10–14 people each, depending on geographic coverage, throughput, crop range and operational complexity.
These are indicative planning assumptions, rather than a completed Botswana workforce assessment. They must be tested against the actual number of production clusters, participating farmers, crop varieties, production volumes, delivery destinations, distances and infrastructure requirements.
Indicative management staffing model
| Management level | Indicative staffing | Main responsibilities |
|---|---|---|
| National pipeline coordinating unit | 25–35 specialists | National leadership, demand intelligence, production planning, technical coordination, logistics planning, commercial coordination, dashboard management and governance |
| Each established regional corridor | 10–14 people | Corridor management, production and cluster coordination, agricultural support, aggregation, quality, logistics and reporting |
| Five regional corridors | 50–70 people | Combined regional corridor management capacity |
| National and five corridor teams | 75–105 people | Indicative combined national and corridor management workforce |
| Cluster coordination | Additional staffing to be assessed | Farmer coordination, production monitoring and technical support based on cluster numbers, geographic spread and service intensity |
Cluster coordination should be calculated against the number of participating clusters, their geographic spread and the level of technical support required. One possible planning assumption is one cluster coordinator for every 10–15 clusters, with technical specialists supporting several clusters. The actual ratio will depend on travel distances, farm sizes, crop diversity and the intensity of production support.
The assessment should produce three distinct workforce estimates:
- National system-management workforce: people who plan, coordinate, analyse and govern the pipeline.
- Regional and cluster-management workforce: people who coordinate production, farmer participation, aggregation and delivery.
- Productive and commercial workforce: people directly involved in farming, technical services, grading, warehousing, transport, processing and distribution.
The national coordinating unit should remain lean and focused on system performance. It is not intended to employ every person working in horticulture. The wider employment footprint emerges through farms, service businesses, logistics, processing, retail and the supporting industries connected to the pipeline.
12. Employment throughout the pipeline: a national economic dividend
A common justification for the commission-agent model is its potential to generate employment. The wider pipeline provides a much broader employment base, distributed across production districts and across a range of technical, operational, commercial and manufacturing occupations.
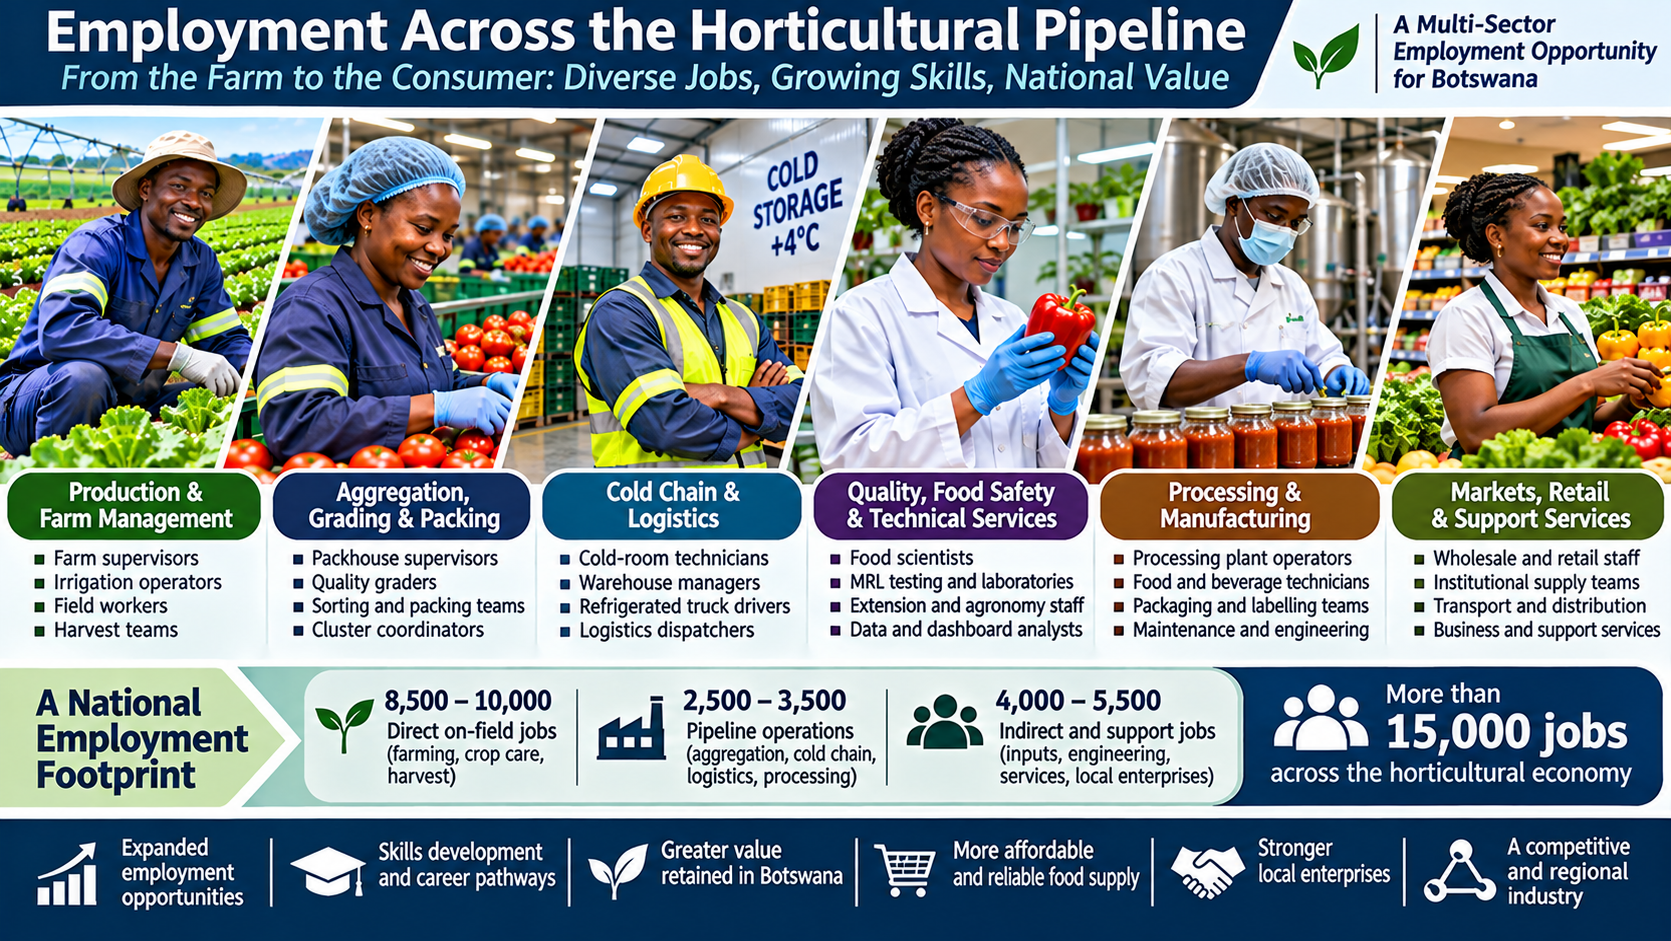
The strategy estimates more than 15,000 jobs across direct field employment, pipeline operations and indirect and support services, compared with an estimate of fewer than 300 floor-broker roles under the commission-agent model. These figures are projections and require a transparent employment methodology before being presented as a verified comparative impact study. In particular, the analysis should distinguish permanent, seasonal and full-time-equivalent jobs, avoid double counting, and separate direct, indirect and induced employment.
Comprehensive national employment projections matrix
| Employment sector / tier | Specific functional roles | Projected jobs | Primary location | Labour demographics and skill profile |
|---|---|---|---|---|
| Tier 1: Direct on-field labour | Farm supervisors, irrigation operators, field hands and seasonal harvesters | 8,500–10,000 | Rural agricultural districts: Chobe, Tuli, Boteti, Lobatse and Central | Source estimates 66% Batswana citizens and 34% regional skilled labour, including 30% Zimbabwean workers |
| Tier 2: Direct pipeline operations | Packhouse supervisors, digital quality graders and cold-room technicians | 800–1,200 | District aggregation hubs and packhouses | Skilled technical and supervisory roles |
| Tier 2: Direct pipeline operations | Cold-storage facilities and warehouse managers | 400–600 | Commercial cold hubs, including Safe Pro Sherwood | Certified refrigeration and warehouse staff |
| Tier 2: Direct pipeline operations | Refrigerated transport fleet drivers and logistics dispatchers | 500–700 | Logistics corridors and fleet depots | Professional heavy-vehicle and fleet coordination |
| Tier 2: Direct pipeline operations | Aggregators, Letsema hub managers and market staff | 300–500 | Regional market distribution hubs | Market operations and commercial management |
| Tier 2: Direct pipeline operations | Agro-processing operators: NAPRO, juices, pastes and drying | 500–800 | Industrial processing zones | Industrial manufacturing and food-science technicians |
| Subtotal Tier 2 pipeline | Pipeline infrastructure and operations | 2,500–3,500 | Nationwide logistics network | Technical and logistics careers |
| Tier 3: Indirect and support | Input manufacturing: shade nets, drip pipes, fertiliser, nurseries | 1,200–1,500 | Industrial centres and rural supply stores | Manufacturing, retail and nursery labour |
| Tier 3: Indirect and support | Technical engineering: boreholes, solar pumps and machinery repair | 800–1,000 | Field service corridors | Skilled mechanical and solar technicians |
| Tier 3: Indirect and support | Extension officers, MRL laboratory testing and digital dashboard analysts | 500–700 | Regional service centres and laboratories | Agronomists, laboratory scientists and data analysts |
| Tier 3: Indirect and support | Induced community retail, hawking and local services | 1,500–2,300 | Farming townships and rural centres | Informal retail and service micro-entrepreneurs |
| Subtotal Tier 3 indirect | Indirect and support footprint | 4,000–5,500 | Broad national economy | Multi-sector economic spillover |
| Total employment | Complete national footprint | More than 15,000 | Nationwide | Distributed agricultural and industrial employment |
The workforce estimates in the source document provide a starting model for examining employment across the horticultural economy. The labour composition figure of 66% citizens and 34% foreign workers, including 30% Zimbabwean workers, also requires confirmation of its survey source, sample and date. Once validated, it should inform workforce planning and training policy.
Employment develops progressively as the pipeline becomes operational. Organising demand creates analytical and planning roles. Mobilising production creates work for farmers, farm managers, agronomists, irrigation specialists and field workers. Building throughput creates jobs for graders, packhouse teams, warehouse operators, cold-chain technicians and drivers. Increasing value addition creates opportunities for food technologists, manufacturing workers, packaging specialists, maintenance personnel and export professionals.
The employment study should therefore examine more than a headline job total. It should measure job quality, occupation, location, remuneration, skills, employment duration, investment per job, productivity and the value retained within Botswana.
13. National production, land and project projections
The strategy document provides a crop-level production and land matrix for the 2025/26 baseline. This is important because a national pipeline must be designed around the actual composition of production, rather than treating horticulture as a single undifferentiated volume.
National produce, land and project projections matrix: 2025/26 baseline
| Crop category | Specific crop type | Projected volume (MT) | Share of total volume | Cultivated land area (ha) | Primary production system |
|---|---|---|---|---|---|
| Local vegetables | Cabbage | 32,500 | 23.1% | 1,100 | Open field / drip irrigation |
| Local vegetables | Tomatoes | 26,500 | 18.8% | 850 | Shade nets / tunnels / open field |
| Local vegetables | Potatoes | 22,500 | 16.0% | 750 | Commercial open field, high density |
| Local vegetables | Onions | 16,500 | 11.7% | 550 | Commercial open field |
| Local vegetables | Rape and leafy greens | 11,000 | 7.8% | 400 | Smallholder open field |
| Local vegetables | Other vegetables: carrots, beetroot, peppers and butternut | 5,080 | 3.6% | 465 | Mixed open field / shade nets |
| Subtotal vegetables | All vegetable crops | 114,080 | 80.9% | 4,115 | 85% open field / 15% protected |
| Local fruits | Commercial citrus: oranges, lemons and grapefruit | 22,000 | 15.6% | 1,077 | Integrated commercial FDI orchard |
| Local fruits | Watermelons and subtropical fruits | 4,801 | 3.4% | Approximately 350 | Open field, rain-fed / drip |
| Subtotal fruits | All fruit crops | 26,801 | 19.1% | 1,427 | Integrated orchard and field |
| Total national | Horticulture production | 140,881 | 100.0% | More than 5,192 | 1,630+ active citizen and commercial farms |
The crop matrix identifies where the greatest production volumes and land commitments are concentrated. It can inform aggregation capacity, seasonal storage, transport planning, grading specifications, processing opportunities and the geographical placement of facilities. Before implementation, the production figures and land totals should be checked against the underlying agricultural records, particularly where commercial estates and citizen-farmer programmes are reported together.
The strategy also identifies the Selebi-Phikwe Citrus development as a major commercial investment, with reported capital expenditure of P491 million, more than P200 million in foreign direct investment and 1,077 hectares. The source reports an initial harvest of 22,000 MT and exports of 18,000 MT in 2025/26, valued at approximately P120 million, with destinations including Europe, the Middle East, Zambia and Namibia. These project-specific figures should be verified with the project and trade records. The wider point is that large-scale commercial production can connect Botswana to export markets when production, packhouse capacity, quality and logistics are organised together.
14. Food balance, domestic availability and regional trade
Production growth must be examined alongside the volume of food that reaches domestic consumers. The food balance matrix in the strategy document illustrates why this distinction matters. It compares local production, post-harvest losses, imports, exports, net domestic availability and estimated per-capita availability across a 2021 baseline, the 2025/26 position and a 2028 pipeline target.
Food balance sheet and regional trade pipeline matrix
| Food balance sheet metric | Pre-pipeline baseline (2021) | Current status (2025/26) | Pipeline target (2028 horizon) | Strategic and regional significance |
|---|---|---|---|---|
| Total local production | 66,000 MT | 140,881 MT | 185,000 MT | Expanded civilian and commercial production |
| Post-harvest loss | 19,800 MT (30%) | 35,881 MT (25.5%) | Less than 9,250 MT (less than 5%) | Targeted reduction in annual spoilage |
| Total imports | 94,954 MT | Approximately 25,000 MT | Less than 10,000 MT | Import volume and expenditure reduction |
| Total exports | 1,000 MT (approximately P10M) | 18,000 MT (approximately P120M) | More than 45,000 MT (more than P320M) | Growth through citrus and regional SADC trade |
| Net domestic availability | 140,154 MT | 112,000 MT | 165,750 MT | Food volume reaching domestic consumers |
| Net per-capita availability | Approximately 58.4 kg/person/year | Approximately 44.8 kg/person/year | Approximately 63.8 kg/person/year | Domestic availability and food-security indicator |
The figures in this table are reproduced from the working strategy. They require a full reconciliation against the underlying food balance methodology before publication as official national statistics. In particular, the calculation of net domestic availability must account consistently for production, imports, exports, losses, stock changes and any other relevant adjustments. Per-capita availability is a food-balance indicator and should not be described as measured household consumption.
The regional dimension is essential. Botswana’s horticultural development should strengthen its capacity to supply domestic markets while building competitive export corridors. The Selebi-Phikwe Citrus development illustrates the potential of connecting commercial production to international and regional markets. A national pipeline can extend that capacity to other crops and production areas by coordinating quality, volumes, logistics, and buyer requirements.
The working strategy also raises the importance of SACU trade relations and the Common Revenue Pool. Trade restrictions and import controls have wider regional and fiscal implications. A pipeline-led approach can support a more balanced two-way trade framework: Botswana develops its domestic productive capacity, exports surplus and high-value produce, and participates in regional trade through reliable supply arrangements. The implications of particular restrictions should be assessed against SACU obligations, regional commitments and the country’s wider trade interests.
Agro-processing provides another route for regional value creation. A dependable supply of graded raw materials can support processors such as NAPRO and businesses producing tomato paste, juices, dried foods and other horticultural products. This connects primary agriculture to manufacturing, packaging, transport, marketing and regional distribution.
15. Fitness to farm, competition and citizen participation
The growth of horticulture also raises questions about who produces, under what authority, who controls market access and how local farmers participate in the expanding economy. These questions should form part of the national industry discussion, supported by evidence and consistent standards.
Reported concerns about land use, operating permissions, equipment, infrastructure, business compliance and supply arrangements require investigation. The same standards should apply to citizen and non-citizen operators. The relevant questions include whether land and operating permissions are valid, whether production activity complies with applicable requirements, what productive capacity is being used, how businesses employ and pay workers, and where the produce is sold.
There are also questions about direct supply relationships between large commercial producers and grocery retailers, and the potential barriers facing independent local farmers. These relationships should be examined through procurement data, supply contracts, market shares, volumes and competition analysis. Allegations about particular operators or supply arrangements require verification before they are presented as established facts.
The working material proposes progressive citizen procurement quotas over a ten-year period. These are proposals for consideration, rather than existing legal requirements.
Proposed progressive citizen procurement framework
| Implementation period | Proposed citizen procurement share |
|---|---|
| Years 1–3 | 20–30% |
| Years 4–6 | 35–45% |
| Years 7–9 | 50–60% |
| Year 10 | 65% or more |
Any such framework would require a careful assessment of productive capacity, crop availability, quality, price competitiveness, procurement law, competition policy and Botswana’s regional and international trade obligations. The objective should be to strengthen citizen participation, enterprise development, employment and domestic value creation while providing a sound framework for productive investment.
The distinction between domestic production and citizen ownership also matters. Produce grown in Botswana contributes to domestic supply, while citizen ownership and participation raise additional questions about the distribution of economic opportunity. The national dashboard and industry data should make these dimensions visible so that policy can be informed by evidence.
16. What the first industry meeting should organise
The first industry meeting led by Mr Molefhe should provide a practical starting point for the wider architecture. Its immediate purpose is to establish a shared understanding of what must be organised, who must take responsibility, what information is required and what work should begin first. It should bring together the productive, commercial, institutional and technical perspectives needed to shape the national pipeline.
The discussion should move beyond whether Botswana needs agents or a trading floor. It should examine the national Demand, Supply and Throughput Spines, the dashboard that connects them, and the commercial and physical services required to make them work.
The meeting should consider the following work areas:
- National demand intelligence: Identify the major domestic and regional markets, quantify demand by crop and specification, and establish how buyer information will be collected and updated.
- Production capacity and farmer clusters: Map farmers, production areas, land, water, crop suitability, infrastructure, seasonal production and the potential organisation of clusters.
- The national dashboard: Define the information required, the institutions and businesses that will contribute data, governance arrangements, access rules and the process for validating information.
- Aggregation and distribution corridors: Map existing facilities, identify infrastructure gaps and determine the location, capacity and commercial justification of required aggregation, cold-chain and distribution services.
- Commercial arrangements and agent services: Define the role of distribution agents and other service providers within the pipeline, including transparent service charges, performance requirements and accountability.
- Skills and workforce requirements: Identify existing professional capabilities, estimate national and corridor staffing requirements, map skills gaps and establish recruitment, regional partnership and training priorities.
- Price, loss and market transparency: Establish how the industry will measure farm-gate, wholesale and retail prices, commissions, spoilage, rejections, storage, delivery performance and unexplained supply discrepancies.
- Employment and domestic value creation: Define how direct, indirect and induced employment, farmer income, citizen participation, processing and value retained in Botswana will be measured.
- Regional trade and processing: Identify opportunities for exports, seasonal exchange, processing and regional market partnerships, while assessing the relevant trade and regulatory implications.
The immediate objective is to establish the organisational requirements and agree on the first work programme. It is a focused industry-organising exercise, with the national economic pipeline as its framework. The wider economic transformation agenda remains a national responsibility. The first meeting can help establish the industry architecture, the evidence base and the institutional coordination required to advance it.
17. The regional opportunity: building a model others can learn from
Botswana has an opportunity to develop a national horticultural pipeline that connects productive capacity, market demand, logistics, processing, skills and trade through a shared information system. The model can begin with horticulture, where the production expansion and the challenges of market access, post-harvest loss and distribution make the need for coordination visible.
Its regional value will come from the way the system is organised. A national dashboard can provide market and production intelligence. Coordinated clusters can organise supply. Aggregation and cold-chain corridors can preserve quality and move produce. Processing can convert suitable surplus into manufactured products. Regional trade can connect seasonal production differences and expand market opportunities.
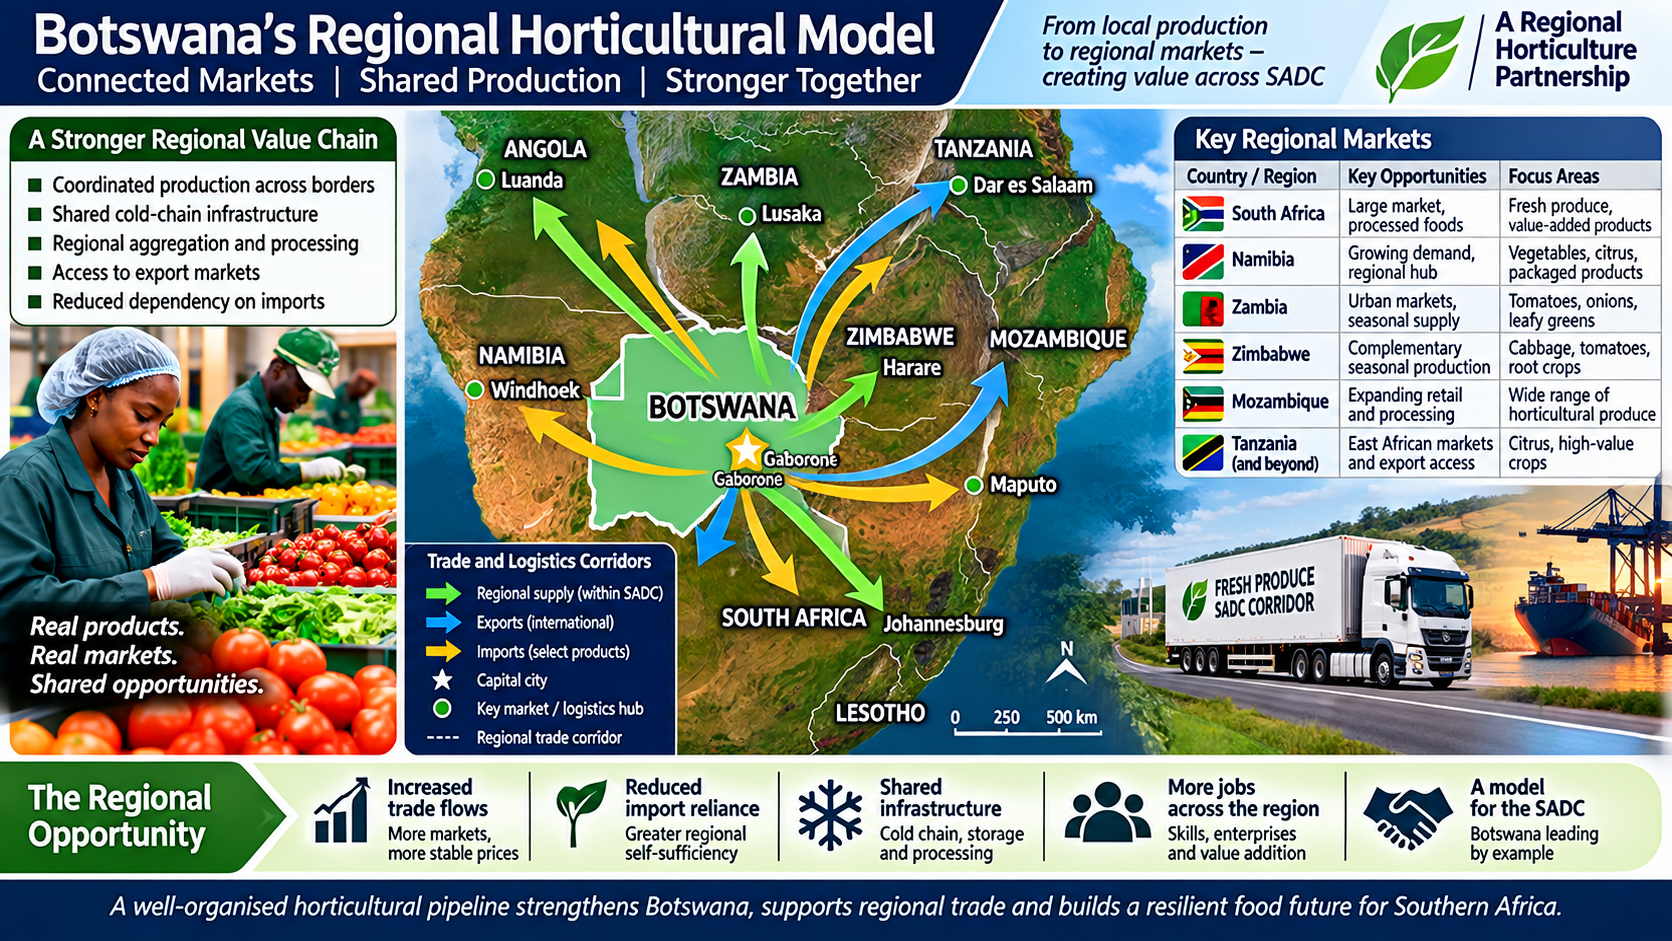
The ambition should be to build a model that the region can study and adapt: one that demonstrates how a country can organise its agricultural economy around verified demand, coordinated production, transparent commercial services, accountable physical movement and measurable employment outcomes.
This is a wider opportunity for Botswana’s professional and technical workforce. It creates demand for economists, statisticians, agricultural planners, agronomists, engineers, food scientists, quality specialists, logistics managers, data analysts, procurement professionals and commercial operators. It also creates opportunities for local businesses to provide services and build enterprises around the national production system.
The pipeline can therefore become a platform for national capability development. Rather than waiting for every required skill to be available before the system begins, Botswana can identify the skills required by each stage, map existing expertise, recruit critical capabilities and develop local professionals through practical deployment.
18. The national imperative
Botswana has demonstrated that horticultural production can expand. The next task is to organise the economic relationships that turn production into reliable supply, viable farms, affordable food, employment, manufacturing and regional trade.
The national dashboard provides the shared intelligence. The Demand Spine identifies what the market requires. The Supply Spine organises productive capacity and farmers. The Throughput Spine moves produce through aggregation, storage, processing, logistics and distribution. Professional management connects these functions, monitors performance and ensures that the system learns from actual results.
Within this architecture, agents and other commercial service providers have a place. Their contribution should be defined by the service they provide, the cost they charge and the value they create. Distribution is an essential service. Market intelligence, production planning, quality management, aggregation and commercial coordination are also essential capabilities, but they should be organised as part of the national pipeline rather than duplicated through layers of fragmented intermediation.
The employment opportunity extends far beyond the trading floor. It reaches farms, clusters, packhouses, cold stores, laboratories, transport companies, processing facilities, data operations, input manufacturing and regional trade. The food-security opportunity is equally significant: more of what Botswana produces can reach domestic consumers, while a stronger production and distribution system can support competitive exports.
The national imperative is to build the pipeline that connects the country’s productive capacity to its economic future. The first industry meeting is an opportunity to begin that work with clarity: organise the information, define the functions, identify the skills, quantify the workforce, map the physical flow and establish the shared responsibilities.
The opportunity before Botswana is to move beyond organising transactions and begin organising the productive economy itself.
Editorial and data note: This article integrates the supplied national horticulture pipeline strategy and the subsequent working material on the Demand, Supply and Throughput Spines, dashboard, staffing, agent functions and industry meeting. Figures described as estimates, projections, proposals, or scenario values retain that status. Source discrepancies and claims requiring verification have been identified in the relevant sections. The tables are retained in the article body for readers to examine alongside the argument.
The National Horticultural Pipeline and the Commodity Exchange Market: Why they should connect, why they should remain distinct, and how they can work together
Responding to the need for price discovery
In our conversation, Mr Molefhe raised an important issue: the need for price discovery in the horticultural market. I agree with him. Farmers, buyers, processors, retailers, and other participants need reliable information about prevailing prices, available quantities, quality specifications, and market demand. Without this information, farmers make production decisions with limited knowledge of the market, while buyers and sellers negotiate from different information positions.
A commodity exchange can contribute meaningfully to addressing this problem. However, I believe we should examine its role within the wider national horticultural system before making it the centre of our proposed market arrangements.
The distinction I would like us to consider is between organising the market for trading commodities and organising the national economy that produces, processes and distributes those commodities.
Our proposed national horticultural pipeline addresses the latter. A commodity exchange can become one of the mechanisms operating within it.
1. Why we should consider a commodity exchange
A commodity exchange provides an organised marketplace through which buyers and sellers can trade according to established rules, commodity specifications and transaction procedures. Its contribution to the horticultural industry could include:
Price discovery: Published prices and recorded transactions can provide farmers and buyers with a more reliable reference for commercial negotiations. This can reduce dependence on individual agents or isolated buyer quotations.
Market access: An organised exchange can bring together a wider pool of buyers and sellers, potentially increasing competition and creating opportunities for producers to reach markets beyond their existing commercial relationships.
Transparency: Transaction records, traded volumes, commodity grades and prices can provide a clearer picture of market activity. This information can help identify price differences between locations, grades and market channels.
Commercial planning: Where suitable arrangements exist, spot trading and forward contracts can help buyers and producers plan their procurement and production commitments.
Access to finance: Standardised grades, documented transactions and reliable storage arrangements can support the development of warehouse receipt systems and other financing mechanisms. These require appropriate legal, institutional and physical infrastructure.
These are worthwhile contributions. We should therefore recognise the commodity exchange as a potentially valuable institution within Botswana’s horticultural market architecture.
2. Why the commodity exchange cannot replace the national pipeline
A commodity exchange primarily organises trading. It does not automatically organise the productive and physical systems required to make commodities available.
For example, a published market price for tomatoes does not establish how many tonnes farmers should plant, where production should take place, when harvesting should occur, how the produce will be graded, where it will be stored, or how it will reach the buyer before its shelf life expires.
Those are national pipeline functions.
Our proposed pipeline brings together three interconnected spines:
The Demand Spine establishes what the market requires: the crops, quantities, grades, quality, delivery locations, prices and schedules required by households, retailers, hospitality businesses, processors, public institutions, wholesalers and regional markets.
The Supply Spine organises the productive response. It connects the Ministry of Agriculture, farmers, production clusters, land and water resources, crop suitability, planting schedules, technical support and production commitments.
The Throughput Spine organises the physical movement of produce through harvesting, aggregation, grading, certification, pre-cooling, cold storage, processing, logistics and distribution.
The national dashboard connects these three spines. It provides the intelligence required to compare market demand with productive capacity and actual produce movement.
A commodity exchange can support price discovery and transactions within this arrangement. It cannot perform all these functions on its own.
3. Why we should be cautious about making an exchange the organising institution
There are several considerations, particularly for fresh horticultural produce.
First, market participation requires productive capacity. Farmers need sufficient volumes, consistent quality, appropriate grading, storage, transport and access to buyers. Small and independent farmers may face barriers to exchange participation if these requirements are left to individual producers to meet.
Second, horticultural produce is perishable. Tomatoes, lettuce, leafy vegetables and other fresh produce require close coordination between harvesting, handling, storage and delivery. A trading platform cannot compensate for inadequate cold-chain infrastructure or delayed distribution.
Third, price transparency does not automatically produce fair participation. A farmer may know the prevailing market price but still lack the bargaining power, financial capacity, volume or infrastructure to access that market.
Fourth, an exchange introduces its own costs and requirements. Membership, brokerage, transaction charges, grading, certification, storage and delivery arrangements must be examined to establish whether participation improves the farmer’s net return.
Fifth, trading information and physical supply information are different. Recorded transactions tell us what has been traded. The national pipeline must also establish what has been produced, harvested, dispatched, received, stored, rejected, sold, diverted or lost.
We should therefore avoid assuming that establishing an exchange will, by itself, resolve the structural problems facing the horticultural industry.
4. Does the agent model fit better with a commodity exchange?
The traditional commission-agent model is more closely associated with intermediary-based trading. Agents connect farmers with buyers, facilitate sales and earn commissions. Brokers also have a recognised role in organised exchange markets.
However, we should distinguish between the traditional commission floor arrangement and a broker operating under the rules of a regulated exchange.
Both can facilitate transactions, but the conditions governing price information, fees, trading records, market access and accountability may differ.
Our position should therefore accommodate agents and brokers as commercial service providers, while establishing transparent rules for their participation.
The pipeline changes the starting point.
Once production has been coordinated through the farmer clusters and the Ministry of Agriculture’s production information, and the farmer has met the agreed crop, quantity, quality and schedule, the farmer’s principal external service requirement becomes access to distribution and buyers.
Distribution agents can compete to provide that service. Other specialist businesses can provide aggregation, grading, storage, processing, logistics and market services.
The objective is to create a competitive service environment within an organised national system, rather than allow the entire system to depend on individual intermediary relationships.
5. How the two models can work together
I propose that we retain the national horticultural pipeline as the organising architecture and connect it to a national horticultural market platform.
The market platform could accommodate several trading arrangements:
- Direct supply contracts: Agreements between farmers or farmer clusters and retailers, processors, hospitality businesses and institutional buyers.
- Wholesale markets: Competitive trading and aggregation for buyers and sellers requiring physical market facilities.
- Agents and brokers: Commercial intermediaries operating under transparent terms, with clearly defined responsibilities and charges.
- Commodity exchange transactions: Trading of suitable commodities through an organised exchange, subject to the required standards and infrastructure.
- Forward supply agreements: Commercial arrangements that connect planned production with anticipated buyer requirements.
- Institutional procurement: Structured procurement arrangements for public institutions and other large-volume buyers.
The national dashboard would provide the shared intelligence required to connect these mechanisms. It would track market requirements, production commitments, actual harvests, available inventory, prices, deliveries, losses and market absorption.
This would give the industry a common information foundation while allowing different commercial models to operate competitively.
6. Which horticultural commodities are suitable for exchange-based trading?
We should also recognise that horticultural commodities have different physical and commercial characteristics.
Grains such as maize, wheat and sorghum are generally more suited to conventional commodity exchange arrangements because they can be graded, stored and traded in standardised quantities over longer periods.
Fresh vegetables and fruit require more immediate coordination. Their quality, maturity, shelf life, handling requirements and delivery schedules can vary considerably.
Processed and storable horticultural products may offer additional opportunities. Dried produce, tomato paste, juices and other standardised products can potentially be traded under arrangements that differ from those required for fresh produce.
This does not exclude fresh produce from an exchange. It means that the trading arrangements must be designed around the commodity and the physical supply chain.
7. Who benefits, and who carries the cost?
This should be one of our central tests when assessing any proposed market institution.
We should ask whether the arrangement improves the position of farmers, consumers and local enterprises, or whether it primarily improves the efficiency of transactions for those who already control market access.
The assessment should consider:
- Whether farmers receive better market information and improve their net returns after commissions, logistics and other charges.
- Whether small and independent farmers can participate through aggregation and shared infrastructure.
- Whether buyers gain reliable access to quality produce and competitive supply.
- Whether consumers benefit from improved availability, quality and affordability.
- Whether local enterprises develop in storage, logistics, processing, packaging and distribution.
- Whether employment expands beyond primary agricultural production.
- Whether Botswana retains a greater proportion of the value generated by its horticultural production.
A commodity exchange can improve price discovery and trading transparency. The national pipeline must ensure that the wider productive economy benefits from those improvements.
8. How we should proceed
I would suggest that the first industry meeting examine the relationship between the two models before committing to a particular institutional arrangement.
The discussion could focus on five areas:
A. Understand existing market arrangements
Map the current wholesale markets, commission agents, brokers, direct procurement arrangements, processors, retailers and institutional buyers. Establish how prices are currently determined, where information is generated and who has access to it.
B. Examine price discovery requirements
Determine which prices need to be visible nationally: farmgate, wholesale, retail, processor procurement and regional market prices. Identify the frequency of reporting, the quality and grade specifications, the transaction volumes and the locations required.
C. Assess existing commodity exchange infrastructure
Establish what existing exchange facilities and institutions can accommodate, which commodities they serve, their participation requirements, transaction costs, trading volumes and regulatory arrangements. Identify whether a dedicated horticultural trading mechanism is necessary or whether existing facilities can be adapted.
D. Design the national dashboard and pipeline
Establish the information required to connect demand, production and physical throughput. The dashboard should distinguish between projected production, actual harvest, quantities dispatched, inventory received, quantities sold, losses and unsold or delayed stock.
E. Determine the appropriate market architecture
Only after understanding the existing arrangements and requirements should we decide which functions belong within direct contracts, wholesale markets, agent services, commodity exchange transactions or other commercial mechanisms.
The institutional arrangements should follow the requirements of the national system.
9. The proposition we should take forward
I believe Mr Molefhe’s observation about price discovery provides an important entry point into a much wider conversation.
We should not dismiss the commodity exchange. Equally, we should avoid assuming that a commodity exchange is the solution to the organisation of the horticultural industry.
Price discovery tells us what the market is willing to pay. Production planning tells us what the country should produce. The throughput system ensures that the produce reaches the market. The national dashboard connects the information and measures the performance of the entire system.
These functions are complementary.
Our ambition should be to establish a national horticultural pipeline within which farmers, agents, brokers, commodity exchanges, processors, logistics operators, retailers and other market participants can operate under transparent and competitive arrangements.
The ultimate objective is larger than improving the sale of produce. It is to organise a productive national economy that creates employment, strengthens local enterprises, improves food security, reduces avoidable losses and retains more economic value in Botswana.
We should organise the national pipeline first, establish the market mechanisms that best serve it, and ensure that price discovery becomes an instrument of national productive development.
Executive Cheat Sheet for Mr. Molefhe
Here is an executive TL;DR crib sheet tailored for Mr. Molefhe, specifically referencing the core economic arguments published in The Pipeline Imperative: Creating National Employment and Sovereign Food Security Beyond the Middleman Trap.
1. Zero Risk-Taking vs. Active Spoilage Elimination
- The Agent Floor: Commission traders take zero financial or spoilage risk. If produce rots on a market floor, the farmer absorbs 100% of the loss, while the agent collects an 8%–15% fee on whatever portion happens to sell.
- The National Pipeline: Establishes farm-gate pre-cooling and climate-controlled transit to eliminate Botswana’s 35,881 metric tonnes of annual post-harvest loss (~P250 Million in wasted farm revenue).
2. The Employment Reality: 300 Urban Brokers vs. 15,000 National Jobs
- The Agent Floor: Generates fewer than 300 urban broker jobs in Gaborone and Francistown while extracting producer margins, forcing growers to cut field labor.
- The National Pipeline: Creates >15,000 nationwide jobs across rural packhouses, digital quality grading, cold-fleet logistics, refrigeration engineering, agro-processing (NAPRO), and agronomic extension.
3. Supermarket Shelf Access: The Cold Chain Gap
- The Agent Floor: Supermarkets reject local smallholder produce due to broken cold chains, pesticide residue (MRL) non-compliance, and inconsistent grading—not because of a lack of floor traders. An agent on a trading floor cannot fix a heat-damaged crop.
- The National Pipeline: Aggregates, pre-cools, and digitally grades smallholder produce to exact supermarket specifications, securing guaranteed retail off-take.
4. Consumer Wallet & Price Impact: P17/kg vs. P12/kg (~29% Savings)
- The Agent Floor (P17.00/kg checkout): Consumers pay a hidden “spoilage tax” (+P2.57/kg) and agent markup (+P1.03/kg) to cover rotted stock, while farmers face predatory price crashes during harvest gluts.
- The National Pipeline (P12.00/kg checkout): Eliminates waste, pays the farmer more at the farm gate (P6.50 vs P6.00/kg), and delivers 4x longer fridge shelf life (7–10 days vs 24–48 hours) for Batswana families.
5. National Control: Market Chaos vs. The Single Digital Dashboard
- The Agent Floor: Crop data is trapped inside private broker ledgers, driving uncoordinated planting gluts followed by off-season shortages.
- The National Pipeline: Operates on a Single National Digital Dashboard connecting Cabinet, Ministry planners, CEDA/NDB lenders, and district farming clusters to stagger planting schedules across ecological zones (Chobe vs. Tuli Block vs. Boteti).
Core Framing Statement for Molefhe
“Mr Molefhe, agents do not buy cold trucks, build packhouses, or take spoilage risk. Our goal is not to build a trading floor for middlemen—it is to convene the Ministry of Agriculture and the Ministry of Entrepreneurship/Trade to deliver an Integrated National Cold Pipeline that protects our farmers, lowers consumer food prices, and creates 15,000 jobs.”
#NationalHorticulturalPipeline #BotswanaAgriculture #FoodSecurity #NationalEmployment #SystemsThinking #HorticulturalTransformation #PriceDiscovery #SADCRegionalTrade


