Newspaper Column #10: Why do some problems defy, no, NOT change? – Part II


As it appeared in the Sunday Standard, Botswana on  Sunday Dec 23, 2012 edition.

Seeing the Trees and the Forest

If the problem is solved, it should not come back.  Period!  We would be seeing results.

If it recurs, then this is a sign that we have not solved it.  Yet.  Period!

Last week, we ran a story of the occurrence (an event) of 9/11, and then we learned it was actually a re-ocurrence (pattern) of an issue that has now become persistent or as we say, stubborn.  The event was not meant to be one-off.

Of course, we know that now.

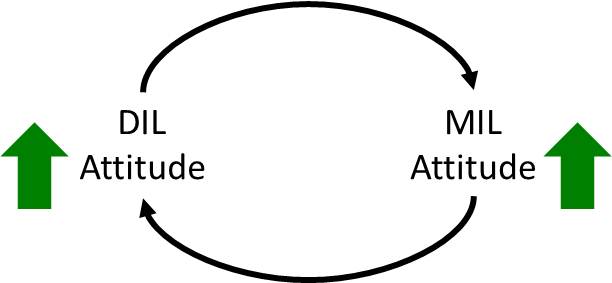
The more one ‘did this’, the more the other ‘did that back’, which in turn led one to ‘do this’ and so on (see figure).  Similar stories run between the eastern and the western worlds.  Between locals and foreigners, between husband and wife, families, neighbours, communities, organizations, nations, between mothers-in-law and daughters-in-law, and so on.  You can substitute A and B for any of the above, and it will explain its recurrence.  Try it.

Reinforcing Loop

The purpose of the recurrences is to point to the need to learn of another way to solve stubborn problems.  We learn these by watching its behaviour over time, even before our lifetimes.

Characteristics of vicious cycles

Firstly, the more the cycle runs viciously, the more it becomes expensive.  Think the 2008 economic global recession.  Some would say, we are still feeling its effects, today in 2012.

In circular causality there is NO starting or ending points.  The root cause has a cause.  I know this defies everything we have learned.  This reasoning is important as it will help us appreciate that the starting point is not in any one part of the cycle.

For example, the thinking rainfall causes vegetation is part true.  It is part true, because, vegetation too in turn causes rainfall.  This can also mean we cannot get away by saying that the developed countries have ‘caused’ global warming.  Their TVs and phones are in our homes.  If we did not demand for them, they would not have been producing it.

But unlike a wheel that retards on friction, this one gathers its strength with each iteration of the cycle.  It grows stronger.

The land appears drier.  More youths walk on the streets for jobs.  More adults succumb to HIV.  School grades continue to decline.  Couples divorce.  Addictions increase.  Crime and corruption increases.  And so on.  It is now behaving like a bullet that has just been released from its gun.  It continues to stay on its course and resist our efforts to change it until we are able to see and learn to work with the cycle as a whole.

Yet, separately, both sides would find it difficult to see the interwoven and vicious nature of this circle of causality between the two.

It was obviously difficult for ‘Bush and Bin Laden’ to sit side-by-side with each other, to see for themselves this non-stopping (and vicious) nature of this cycle that keeps all of us in a spin.  It is still difficult today.  It happens to the best of us.  Often, we become too busy either looking out at ourselves or at the other party.  Yet, till we do so, the issue remains unresolved.

Ten years on, from 2011, we now know that this is true.  How about ten years from today?

Lastly, the trick is not about working at it harder.  We have done so exactly that since biblical times.  Having said so, it will be difficult to appreciate this failure, in just seeing our lifetime of experiences.

The solution

But if this circle of causality is the real culprit, then blaming any one side of it will really not solve the problem.  While we could blame the people or government or a sector separately for our woes, we really do so because it is the easier way out.  It is easy because it is the part of the circle of causality that is obvious to us.  We are usually oblivious to the rest of the the circle of causality.

Blaming is therefore not a solution.

Can vicious cycles of causality turn around by itself?  No!

It is like a wheel that has been set into motion.  Like a bullet released from the gun.  It does not reverse its course on its own.

To solve it, first the circle needs to become more obvious to our perceptions.

The solution to this interwoven complexity then lies in working with the interwoven nature of the problem as a whole.  Not directly at the problem per se or parts of the causality.

How do we do then treat these vicious cycles?

Here’s a story to illustrate how this may be done.  This is Part I.  Part II will be presented in the next insert.

The title of the story is, “The Healing Poison”.

A Story

This daughter-in-law (DIL) finds herself in a difficult relationship with her mother-in-law (MIL) (see figure)!

She (DIL) had done everything possible to try and bridge the gap between the two, except the more she tried, the worse their relationship seems to become.  She has now arrived at a point where she has concluded that “The problem is mother-in-law (MIL).  So, if I wish to get rid of the problem, then all I have to do is to get rid of mother-in-law”.

Except, it was not easy, to get rid of MIL.  The more she tried, the more she worried that somebody might suspect it was her.  One afternoon at wits end, as she sat down to rest, she suddenly thought of her favourite uncle.  Someone, whom as she grew up took care of her problems for her and she gas come to respect him for his wisdom.  She decided, she should pay him a visit the very next day to seek help to her current problem.

The uncle was delighted to see her.  As they settled down, she starts talking.  “What is happening?” asks the uncle.  The DIL spills her beans.  So when the uncle asks, “What do you want to do?”, she shares that she’s arrived at this conclusion that should we get rid of the MIL, the problem will be solved!  The uncles probes and asks, so “What do you want me to do about this?”  She quips, “I would like you to help me get rid of MIL!”

“I see.  Wait here”, says the uncle.

A few minutes later, he pops back and this time, he is holding a small bottle with some liquid inside.  He then adds, “Here’s what you need to do.  Every day, drop two drops of this liquid, in a hot cup of milk.  Present the cup of milk to her, one for every night for the next six months, and make sure that she drinks it.”

“Well, that’s easy.  Is there anything else I have to do?”, asks the DIL.

“Yes, there is one more thing you have to do.”  “What is that?” she asks.

“Well,” adds the uncle.  “Every night, when you present the milk to your MIL, you must make sure that you smile.  Because if you do not, somebody might suspect it was you.”

Hmm …. that’s going to be tough.  To smile.  “Are you sure she will be gone, at the end of six months?”  “Yes!”, assured the uncle.” “Well, in that case, I shall do it!”

On that note, the uncle hands the bottle to her and wishes her well.  As the DIL turns quickly to walk back home, you could almost detect a twinkle in the uncle’s eye and a smile on his lips!

Could the uncle see the circle of causality between the two?  Does he see the trees and the forest at the same time?  How about the DIL?  The MIL?  How do you think the story would end?

These will be the subject of discussion of this column in the new year.  Happy discovering and learning with your family and friends over the holidays!

Merry Christmas and of course, wishing you ahead, may everything you wish for, become real for you in the New Year!

Ms Sheila Damodaran, an international strategy development consultant for national planning commissions, welcomes comments at sheila@loatwork.com.  For upcoming programmes, refer to www.loatwork.com/Senior_Leadership_Introduction.html.

Newspaper Column #9: Why do some problems defy, no, NOT change? – Part I


As it appeared in the Sunday Standard, Botswana on  Sunday Dec 16, 2012 edition.

Dynamic Complexity vs. Detail Complexity

We face problems daily.  And, we do not doubt our ability to deal with them.

Sometimes, this confidence can pull wool over our heads that we can deal even with the stubborn ones, in much the same way.  We would say to ourselves, just work harder.  We will overcome it.

Stubborn problems are issues that despite efforts to manage or contain it, while it first they may look like they are relenting, the results are short-lived (two-to-three years).  And, then it comes back again, this time harder and faster.

For example, in our efforts to survive arid conditions, we engage in pastoral farming.  Except, over time, such practices wipe out the greens (as when livestock consume grass) that would otherwise encourage rainfall.  In some countries, this means it gets only summer rainfall.  This causes conditions to become arid even further.

Notice, however, when droughts strike, they wipe out the livestock numbers.  This is an attempt by the system to do a correction, so as to recover itself.  The correction by the system is usually not that visible to us.  We now have a stubborn problem in our hands.

Can you tell, who comes across as more stubborn?

I am sure you can think of lots of other examples of stubborn problems.  Economic growth declines.  Lack of wage increases.  Divorce rates.  Rainfall levels and/or water tables (Nov/Dec 2012 series of this column).  New HIV/AIDs infection (coming in Jan 2013).  Unemployment (October 2012 series).  National school grades.  Performance in agriculture, manufacturing and retail sectors.  Economic diversification.  Crime.  Obesity.  Diabetes.  Road accidents.  Poaching.  Budget deficits.  Wars.  These are some, among others.

Firstly, the stubborn nature in such issues is usually not that easily visible at the onset, till we have had to face them for years on end, sometimes even decades.  It escapes our attention even for the best of us when tasked to manage them for the short-term (three-to-five years).

As legislatures, managers and enforcers we believe in the power of our word or our hands and feet to make a difference to such problems.  We become effective at doling out corrections each time the problem surfaces.

And when we fail to do so, it looks like project implementation is not taking off or the officer or the function is not performing well.  The enemy is out there.  Or, we may sometimes, shrug them off as ‘things that are beyond our borders and therefore our control’.

Where such problems exist, managing one time occurrences are easy.  Recurrence makes them tough.

Two kinds

However, to understand why such problems resist change, we need to first understand what causes their persistence.  To do so, it helps to appreciate that there are two kinds of complexity.  Detail and dynamic complexity.

Most organizations (and professions) are designed to deal with the first kind.  Detail complexity.  As it would be, when one “drills down”.  How many baskets did we sell last month?  What was our profit this year?  How many permits did we issue?  How many crimes were committed?

We are not quite organized to deal with the second.  What causes sales or profits to keep falling?  Or why does crime keep rising?

But first, what does the word complexity mean here?  The dictionary says “it consists of related parts” (as in composites) or “complicated” (as in a complex problem).

But it is perhaps the Latin word “complexus” from which this word derives its meaning that sets it apart for us.  It says “embracing, interwoven”.

To see the interwoven nature of a problem, it would require our minds to “zoom out” from the problem.  However, our years of drilling our minds down to details, makes the experience of letting go of the problem to see its dynamic nature, a new and rather anxious one for many of us.  It is understandable.

However, when we do not see the interwoven nature of these issues, it makes some of the most persistent issues of the day, well … remain stubborn.   Yet the solutions to some of our most pressing issues lie in learning to see and work with this interwoven nature.  There is no easy way out.  No shortcuts.  No magic pill.  Unfortunately.

First, let’s see what the interwoven nature of a problem would look like.

Interwoven nature of reality

We shall use an example.

Let’s go back to 2001.  9/11: The day when the two planes hit the World Trade Centre.  Notice what happened.  Overnight, airports around the world responded in exactly the same way.  First stunned.  And then a mad scramble to ‘shore its security’.  Yes?

Overnight, we saw passengers snake their way over two-hour waits to security screens.  No belt, shoe or stone were left unturned.  Do you remember those days?

One passenger underwent several levels of security screenings.  A typical airport would have thousands of passengers passing through its doors in a single day.  In a month or in a year, we would say well, that was a lot of work!

What would you call that kind of complexity?  This is what we refer to as ‘Detail Complexity’.

Most professions and performance management systems have their focus on this.

Systemic Thinking on the other hand, focusses its attention on ‘Dynamic Complexity’.

Let’s go back to the same context.

To find the dynamic complexity we start by asking, ‘why did we do what we did’?  Why did we build those screens?

Well we say it was important to do that so as to ‘weed the terrorists out’.

Yet, should we go across to “the enemy”, and ask the question, “From your view, who would you say, is the terrorist?”  What do you think would be their answer?  Did somebody whisper, “The other side”.  You bet!

So what do you notice?

Can you see what causes its recurrence?  Some might add, the recurrence has been happening since biblical times.  If so, will doing ‘corrections’ by one side acting on the other’ ever put a stop to the other side doing its corrections to us?   We know, that will not stop the problem.  And continuing to fight ‘the other side’, becomes very expensive.

But notice this dynamic complexity view becomes clearer to see when we zoom away from the bustle of managing the activities at the airports.

Why is it important to see this inter-relationship?  How then, do we handle such problems?  How do we handle Dynamic Complexities?

This will be the subject of the 2nd part of this article.

Ms Sheila Damodaran, an international strategy development consultant for national planning commissions welcomes comments at sheila@loatwork.com.  For upcoming programmes, refer to www.loatwork.com/Senior_Leadership_Introduction.html.

Newspaper Column #8: Have Greens, Will Rain! – Part V


As it appeared in the Sunday Standard, Botswana on  Sunday Dec 9, 2012 edition.

Actions have consequences

When we bring a bowser to a place that needs water, is that a solution to, or a relief from the problem?

The test will be, if that’s the only time we have had to do it.  Then it is a solution.  Otherwise, it is a measure to stop the gap.  But the gap remains there.

To take care of recurrent (persistent) nature of water shortages of a nation, we would have to take care of the water cycle.  The whole cycle.  Not parts of it (as excerpted from Part IV of this series).

Except the truth is, most of us and organizations, be they units, departments, sometimes even whole Ministries are not designed to do so.  We work at best in parts.  And, as citizens, we have not mandated anyone to do so, otherwise.  Not as yet.

This allows stubborn problems to slip away from our focus, but they return to haunt us (you and I) more deeply each year.  It is a reminder of work to be done as yet.

The water cycle is one example of circles of causality, we have been ignoring for decades.  There are many more.

Nature of cycles

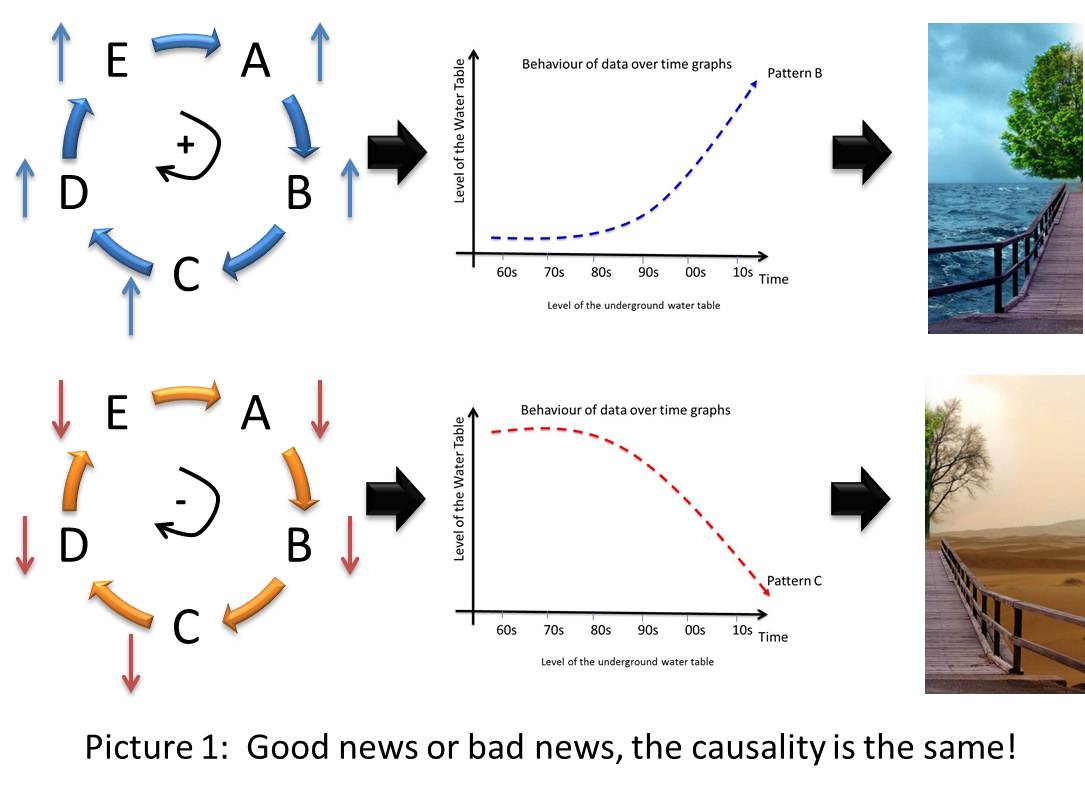
The cycle can go two ways (see Picture 1).

20121209Picture1

They could either reinforce positively or negatively.  When the cycle reinforces positively, we would see the world around us look more like the Amazons.  When the same cycle reinforces the other way, we would see the Sahara unfold right in front of our eyes.  The outcomes may be different.  But the circular causality is the same.  The difference is in knowing which way the cycle is reinforcing for us?

Causes of reality

In the last article, I left a question:  What are the consequences of the following actions on the water cycle?  Run a test against the cycle.  (see Table 1)

Table 1: What are the impacts over time of the following actions on the water cycle?

Action Plan Given and constraints Consequence Impact
Growing drought-resistant varieties of crops? Given there are already large-scale existence of drought-resistant plants that we grow in our gardens, and as vegetation and forests on the land. Persistent growth of such varieties cause persistent reduction of transpiration by plants and therefore the atmospheric moisture in the region Negative.  Would see reduced levels of rainfall and water tables over time
Producing livestock that depend on greens? When number of livestock exceeds carrying capacity of the land, it leads animals (including wildlife) to consume greens at rates faster than at which they may rejuvenate. Sees wipe outs of greens and humus in the topsoil needed to see sustained growth of vegetation leading to non-sustainable levels of transpiration. Negative.  Would see reduced levels of rainfall and water table over time
Production of brews? It can take up to ten cans of water to produce one can of beer.   When the consumption of water exceeds the water table recharge levels, it causes the distance between the topsoil and the water table to increase. Sees wipe outs of greens and humus in the topsoil needed to see sustained growth of vegetation.  The land appears drier, leading to non-sustainable levels of transpiration. Negative.  Would see reduced levels of rainfall and water table over time
Drilling or deepening of boreholes? When the rate of extraction of water table exceeds recharge levels, it causes the gaps between topsoil and the water table to increase. Sees wipe outs of greens and humus in the topsoil needed to see sustained growth of vegetation.  The land appears drier, leading to non-sustainable levels of transpiration. Negative.  Would see reduced levels of rainfall and water table over time
Presence of dams? One dam-full of water could see up to two-thirds of its water evaporate from its surfaces. The rate of evaporation is too fast unlike the more organic pace of transpiration by plants.  The land appears drier, leading to non- sustainable levels of transpiration. Negative.  Would see reduced levels of rainfall and water table over time

What do you notice?  While our actions were intended to be a response to declining water tables, continuing to take these actions, actually deepens the decline even further!

And as we do so, rainfall levels pushes downwards further.  On the surface, it would look like as if public and private sector initiatives and project implementation efforts are not taking off (see Table 2).

Table 2: What are the consequences (from over 20, 30, 40 year periods ago) of a negatively reinforcing water cycle on the following?

Growing of crops and raw materials (primary industries)  Negative
Food security  Negative
Sustained growth of secondary industries  Negative
Sustained growth of tertiary industries  Negative
Capacity to diversify and develop a manufacturing base  Negative
Competitiveness / Growth of profit margins of retail sector organizations  Negative
Growth of tax revenues from agriculture, manufacturing &  retail sectors  Negative
Growth of wages  Negative
Growth of employment in the formal sectors  Negative
Growth of household incomes  Negative

The reality is not merely at the mercy of the terrains we live in.  They are also the consequences of our actions.

What is happening?

While these cycles are natural systems, they are leading us (yes, even the humans within the system) to take decisions, that reinforce the direction the cycle is already heading into.  It is the self-seeking nature of the cycle that causes that to us.

Unknown to us, our thinking is now becoming set within these cycles.  It happens to the best of us.

It is easy to blame organizations out there.  It is harder to blame our thinking here.  Systemic Thinking offers a way to catch ourselves being trapped in such thinking.

So, should we take off from the next corporate retreat with a solution that we come up with, or would we need to first uncover together the circle of causality that keeps returning these problems to us?

You are right!  We need to be mindful of the latter.

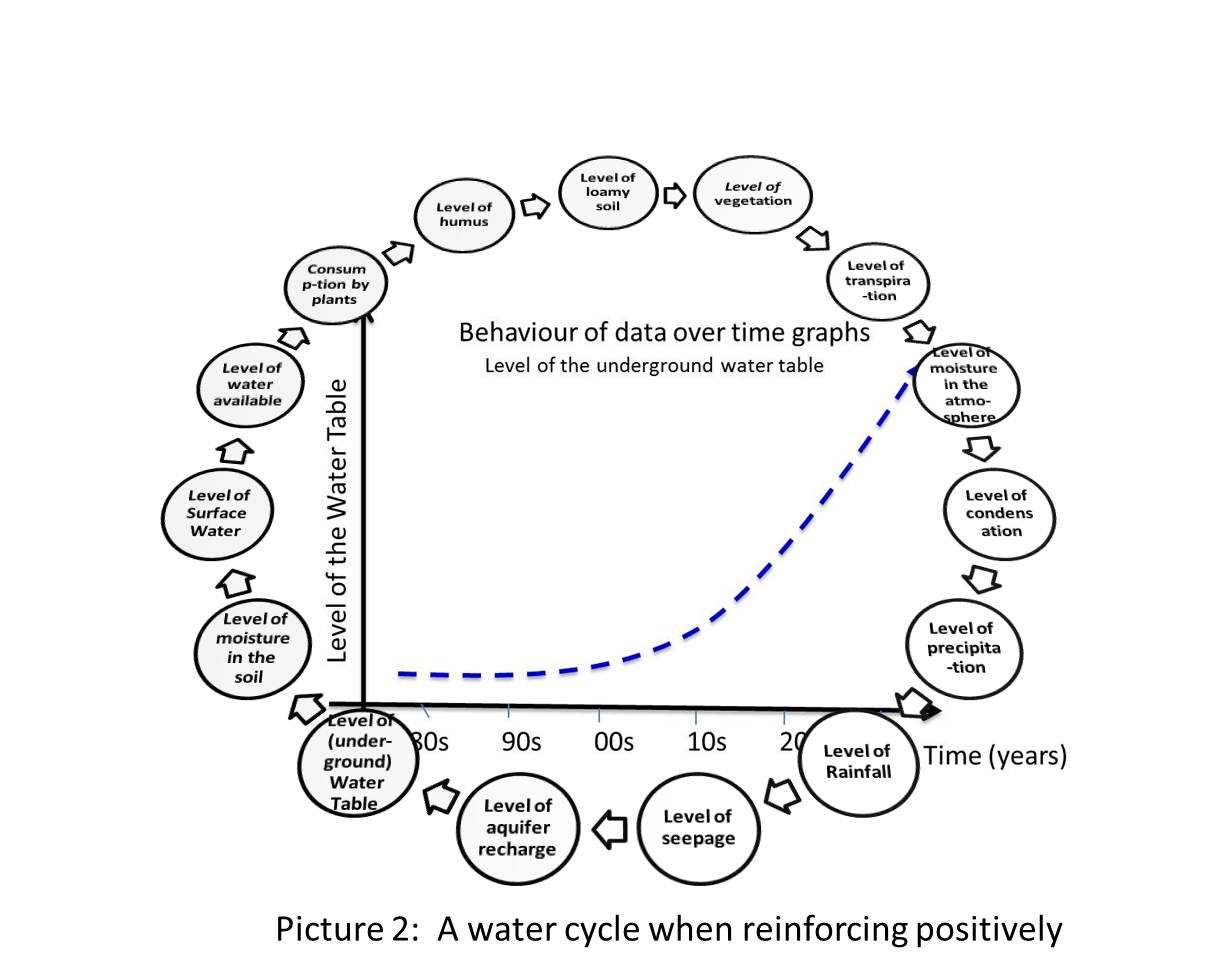
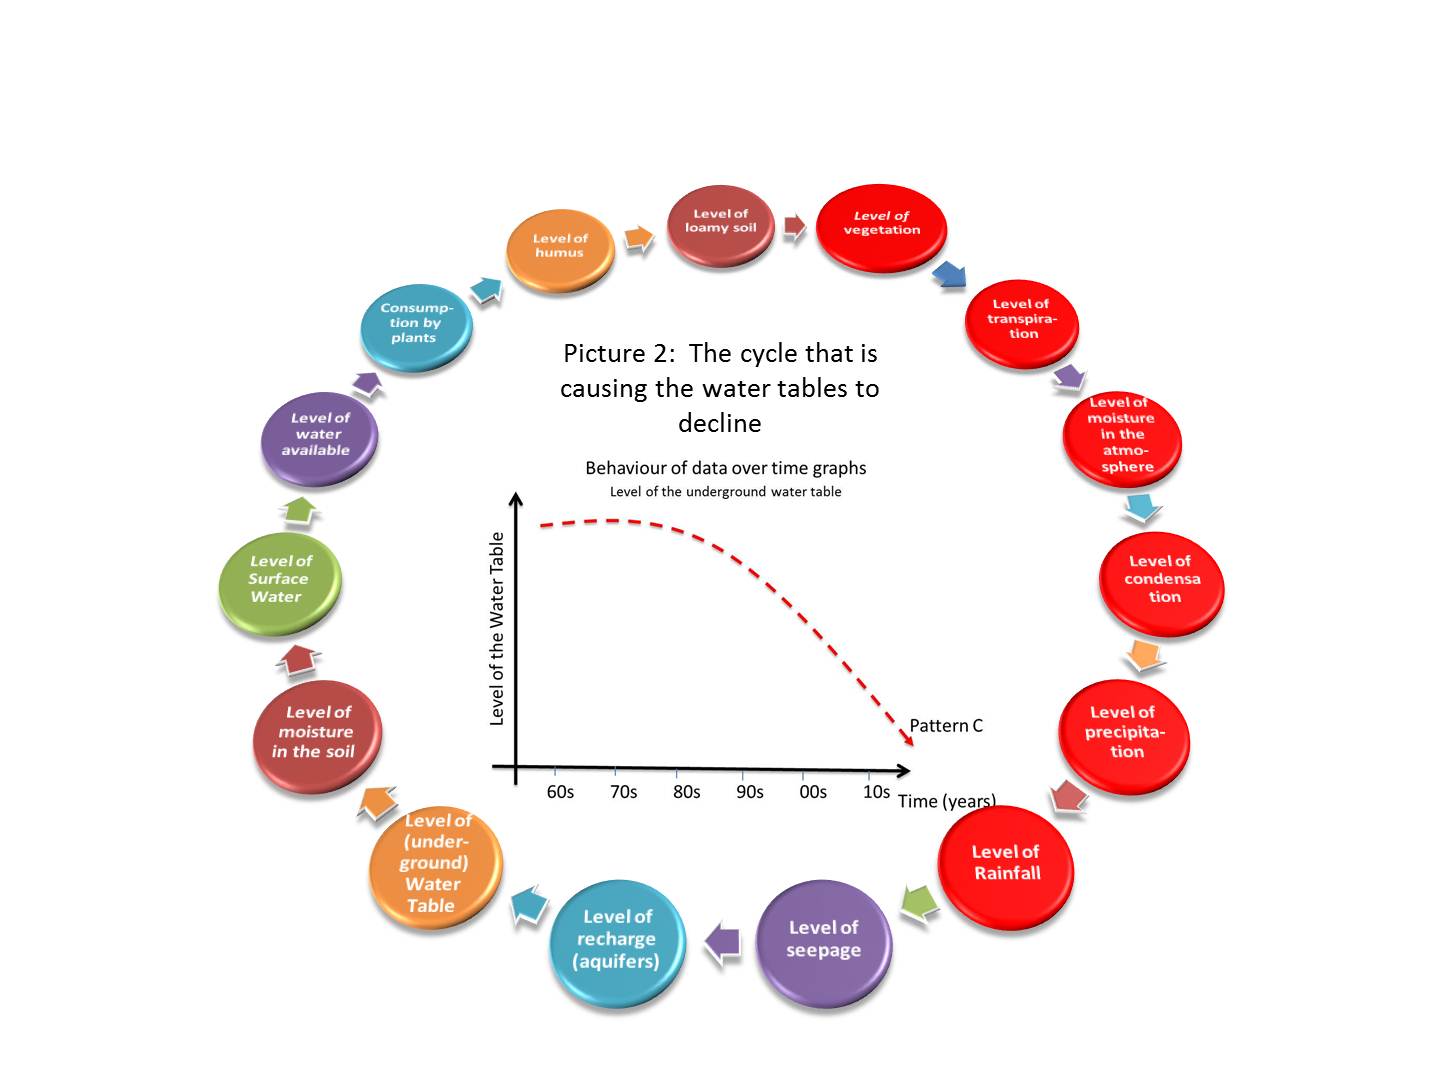
What would we need to do, to solve the problem of water shortages then?  The clue is in the circle of causality (see Picture 2).

20121209Picture2

Take another look at the cycle the parts before “Level of Rainfall” (bottom right corner).  What do you see is leading up to it?  Does it say “Level of vegetation and (top right corner) and further up in the cycle, “levels of surface and underground moisture”?

That becomes a systemic solution.  “Have more greens, will rain more”.

This is the final segment of this five part series of this article.   In the New Year, we will work on understanding the persistent nature of HIV, its causes and its effects and how we may turn it around.

Ms Sheila Damodaran, an international strategy development consultant for national planning commissions welcomes comments at sheila@loatwork.com.  For upcoming programmes, refer to www.loatwork.com/Senior_Leadership_Introduction.html.

Newspaper Column #7: Have Greens, Will Rain! – Part IV


As it appeared in the Sunday Standard, Botswana on  Sunday December 2, 2012 edition.

All is not what it seems

So was your answer similar to or different from that of your friends?

In last week’s discussion (Part III) we saw gradual increases in rainfall levels rose levels of vegetation as well.   Vegetation begins to grow in sustained ways.

Still, this is linear thinking.  Rainfalls cause vegetation.  As farmers, most of us know this.

However, the key to understanding persistent or stubborn issues such as water shortages is when we see causality as a cycle (Part II).  At this point, the thinking shifts from linear to being systemic.

So, I left you with a question to complete the process of thinking.

Should levels of vegetation (along with surface waters) increase, what do you think will be their consequence on rainfall levels?

Would we see declining levels of rainfall? Or could such levels increase (gradually) over time?  Which types of vegetation would encourage rainfalls?  And which ones don’t?

Check if you got the following answer.  I am sure you did!

This is a story over time.

As more plants consume water and we see vegetation grow over time, we will begin to see a genre of plants that are broadleaved.  As more of such plants thrive on the lands, such plants transpire water vapour into the atmosphere.

The more persistent are those levels, the higher the likelihood of levels of atmospheric moisture rising across the region.  However, one plant, one hose-pipe or one dam does not make that change happen.  Instead one would have to imagine, miles and miles of such vegetation happening across the region.

20121202Picture1

What do you think will be the result?

The higher atmospheric moisture now begins to encourage precipitation and eventually rainfall.  Hence my title here, “have greens will rain”.

Positive Cycle

For rains to fall from above, it needs to figure a way to move from the earth’s surface to the atmosphere.  Surface waters and vegetation when they come together facilitates that process.  We as humans are parts of that instrument.  The result will be more levels of rainfall over time.

Additionally, as more plants grow out their life cycle, at the end of their life, they decompose and add nutrients to the earth.  This is key in helping the soil transform gradually from sandy to become loamy.  The land learns to become greener.  Potentially, we could even see the desert turn on its back.

As the supply of available water increases, cost of using it, will usually come down.  The reverse (Part I) is also true.  When the supply diminishes, the cost goes up.  Unfortunately, we will not be able to push these prices down, till we figure a way to increase its supply.  The answer can start in our backyards.  Literally, for everyone.

So, increased levels of vegetation, raises the levels of rainfall.  That’s your cycle (see Picture 2)!  In this case we refer to them as virtuous cycles.

20121202Picture2

The reverse is also true.

Negative Cycle

When plants do not consume water (see also Picture 2), over time, they gradually learn to do the opposite of all of the above, as they fight or adapt to stay alive.

These adaptations may include developing layers of wax or hairs on the leaves and stems or shrinking the size of its leaves to become thorns.  This is intended to prevent water losses so as to keep the water for themselves. This runs contrary to the nature of water, which is to flow.  These plants have adapted the inherent nature of water for its survival.  It does so at the expense of the system (or we say it has become individualistic).

The ultimate drought-resistant plant is cactus that grows in the hearts of most deserts of the world.  Think what you see when you crack a cactus open.  We see trapped water.  The little water it takes in, it keeps it for itself.

When they begin to appear in our environment, it suggests that the soil on the surface has long lost its ability (to build loamy soil) to support sustained vegetation.  Such variety of plants begin to thrive but causes rainfall levels to decline.  This is since, they do not transpire.  This causes the land to become even more dry which in turn encourages more of such plants.  This latter view is often hidden from us until we surface this thinking as a cycle.  Unlike earlier, these cycles are now becoming vicious in nature.

These vicious cycles do two things.

If we are not watching it, these cycles cause the issue to recur.  They bring the problem back defying our efforts to correct it and do so with greater intensity in each iteration of the cycle.  They typically throw our action plans off their courses.  We see project implementation efforts as if they were failing.

These are what we see on the surface.  That is the self-seeking nature of these cycles of causality.  All is not what it seems.

Winning the Cycle

So how would we deal with such systemic directions and expect to win it?

To take care of the problem of water shortages, we would then have to take care of the water cycle.  The whole cycle.  Not parts of it.

What we saw here today is while your household may start greening your backyard, the combined effect of doing this collectively can be very powerful for a region on both the causes and consequences of rainfall for the region.  This answer is not for just one country.  We need to figure a way not to give up or be afraid to reach this out there in the region to everyone.  I am sure you see that!

Given these, what would you say are the implications of some typical action plans that we make (and this happens to all countries), on such a cycle?  Such as:

  • Recommending the growth of drought-resistant varieties of crops?
  • Producing livestock that depend on greens?
  • Production of brews?
  • Drilling or deepening of boreholes?  Dam construction?

In each instance, would you see the rainfall levels increase or could it decrease over time?  Would water table levels increase or decrease? What would be their consequences on growing of crops, on food security, growing of raw materials and in diversifying and developing a manufacturing base in the country?  On employment?

Well, I am sure; you and your friends will figure these questions out!

This and their impact on the economy will be the subject of discussion next week in the final part of this series of the column on “Have Greens, Will Rain!”  Till then have a lovely week discovering and learning!

This is the 4th segment of a five part series of this article.  Each part will build on the earlier article to an eventual conclusion.  We invite you to participate in the column as well as do your ‘own homework’ – searching and discussing the issue to build your own conclusions.  Next month, we look at HIV, its causes and its effects.

Ms Sheila Damodaran, an international strategy development consultant for national planning commissions welcomes comments at sheila@loatwork.com.  For upcoming programmes, refer to www.loatwork.com/Senior_Leadership_Introduction.html.

Newspaper Column #6: Have Greens, Will Rain! – Part III


As it appeared in the Sunday Standard, Botswana on  Sunday November 25, 2012 edition.

What goes around comes around. The Good and Bad.

 Today we move to the more exciting bits of this series!

We will uncover the vicious cycle causing water tables to decline and learn how they contribute to growing aridness to seeing the economy turn around.

The take-away from last week was if we take care of this long-term position, it will take care of the fast-changing short-term worlds for us (food security to household incomes).   We ignore this; the cycle brings the problem back harder and faster.  But such long-term positions do not happen by accident.  There is a reason.

I left you with a question at the end of the article.

What is the circle of causality that is pushing the water table down?

What did you see?  Perhaps you saw different versions of it.  Looking carefully, they were not quite circles but were straight-line thinking.   Linear thinking makes up parts of circular causal thinking.

So, let’s take a few examples.

Sometimes I get, the water table is down because our consumption levels have gone up.  This is because population numbers and therefore its related activities have gone up.  And this is because … and sometime we stop here.  In half-jest I proceed by adding, that ‘while fertility rates are up we are not dying fast enough’.  At this point, the class roars into laughter.  Mostly at the ludicrous reasoning.

We also know this is so, because we know of countries, whose population numbers and life expectancy are way higher than ours, yet do not see declining water table levels (see Picture 1).

Tips

So, here’s yet another tip.  Any causal factor used in a vicious cycle has to stand the tests of space and of time.  The above reasoning has not withstood the test of space.

At other times I see, water tables are going down because the rainfall levels are going down, and rainfall levels are going down because global warming levels are up.  Global warming levels are up because ….

Usually at this point, I would pause the group and question it.  Does this line of reasoning suggest that before the advent of global warming, while the water tables may have been higher then, than it is today, were its levels rising with each year.  Which means to say the water tables in 1960s or 70s were higher than it was in the 50s?

Stillness settles in the room.  Sometimes, it is because we do not know if this is true, mostly because we have not seen the data.  But again, it sounds like another ludicrous reasoning.  The reason is not passing the test of time.

So, what have been your thoughts about the cycle?  Had it looked like the above?  Not to worry.  It happens to the best of us.

So, what then is the circle of causality that is causing the water table to go down?  To uncover the cycle, we would need to learn to watch reality like watching a movie – as if without shutting our eyes.  Snapshots will not do.  So here we go.

Watching the reality like watching a movie

Rainfall is a part of the story.  Yes?  As more rains fall on the earth’s surface, they run off into rivers and seas.  And where they fall on land it sinks through the soil and seeps downwards.   As they do so, they help to recharge underground aquifers which in turn help to cause the water tables to rise.

The reverse is also true.

The less rains fall, the less there are seepages and recharges the water tables fall instead.  Here we have come back to last week’s question.  But notice; be it whether it is good news or bad news, the causality is the same.  So for now, we will continue watching the cycle as if it is positive.

Let’s go back to where we left off the cycle.  When the water tables rise, what does that lead to happening next?

Here, imagine the water tables across the region rising through the underground soil.  As they do so, we see more moisture in our soils and as they emerge through the surface, we would now have surface water.  They could either become a pond or your dam.  The more the underground water rises, the bigger the pond.  And so is the reverse.

What happens when surface water rises?  Just as when water levels drop in our dams, we impose water restrictions.  Well, we may say, this time we allow consumption of water … by humans, animals and plants.

When we do not have enough water, notice who we take off the list first?  Did you say plants?  That’s usually true or we introduce plants that resist droughts.  Then we try by as much as possible to share the available water resources between humans and animals.

To continue the thinking, we take it off from where we see plants consume water.  Should we leave them out of the story; it will be less than about the whole.  So, let us say plants consume water.  What happens to the cycle next?

We are now more than half-way around the cycle.  Remember we started with rising rainfall levels?  And we have now reached partway around the cycle to increased vegetation (see Picture 2).

When the vegetation increases over time alongside with surface water, what do you think will be their impact on rainfall levels in the next cycle?

These will be the subject of discussion in Part IV of this series in next week’s column “Have Greens, Will Rain!”  Well, I am sure; you and your friends will enjoy closing the cycle!  You may notice different responses along gender or age lines.  Try it out and notice.

Would rainfall levels decline?  Or could they increase?  What do you think?

Thinking ahead, what will be the impact of this causality on economic diversification?

Don’t forget the tips!

Till then have a lovely week discovering and learning!

This is the 3rdof a five part series of this article.  Each part will build on the earlier article to an eventual conclusion.  We invite you to participate in the column as well as do your ‘own homework’ – searching and discussing the issue to build your own conclusions.

Ms Sheila Damodaran, an international Strategy Development Consultant in the use of systemic thinking for managing national persistent issues, welcomes comments at sheila@loatwork.com.  For upcoming programmes, refer to www.loatwork.com/Senior_Leadership_Introduction.html.

Newspaper Column #5: Have Greens, Will Rain! – Part II


As it appeared in the Sunday Standard, Botswana on  Sunday Nov 18, 2012 edition

Cycle?  What cycle?

In Part I last week, we were concluding that the water tables in the region were possibly declining.

This series of articles in November is a dedication to this subject.

It explores issues of primary industry (raw material) development to water consumption choices and their effects on families, the nature and the economies.  In short, it underscores the story of diversification of any economy.

All of this will be discussed as we take a trip around the water cycle in this series of the column.

Water tables even if they are underground are part of the water cycle, originating when part of the rain that falls on the Earth’s surface sinks through the soil and seeps downward to become groundwater.  Groundwater will eventually flow out of the ground, discharging into streams, springs, lakes, or the oceans, to complete the water cycle.  (See Picture 1)

When asked how high is the water table and how it has behaved over time, most of us picked Pattern C (refer to last week’s article.  See also red line here in Picture 1 below (refer to ‘Long-term depletion’, the line marked AB)).

That it has shown a general downward trend.

Such long-term trends become evident when we study past data spanning several decades.  They usually escape the best of us when our attention is on what’s happening today (refer to the lines CD).

Here’s the implication of seeing such patterns over time.

The long-term depletion worsens the position of each short-term variation.  We now have a persistent issue but is working its way to the levels of a crisis in the long-term.   Such issues usually resist change and defy our best planning and implementation efforts beyond the short-term.  It is a costly management process.

And if we imagined the water cycle, it would have begun to show signs of weakening intensity.  The local weather conditions could see the likes of droughts or even floods.  Of course, these conditions would reverse with long-term augmentation or increase.

In systemic thinking, we pay attention to these long-term positions rather than the short-term.  This is because of the following reasons:

  • It is these long-term positions that determine what happens in our day-to-day realities.  Ignore them and the realities get worse.  These will help us become more realistic in our planning and implementation efforts;
  • The reasons that cause the long-term position are often very different from those that cause short-term positions; and so,
  • When we find those reasons, they will present areas that will allow us to turn the situation around.  For good.  It saves our resources.

Boiled Frog

To get there, it helps that the country as a whole learns to see and understand such patterns together, with the disciplined eye of a hawk.  All of the time.  Should we not, then like a boiled frog, it would lead us to deeper crisis unawares.  We become the boiled frog instead.

And I left you with a question.  How do we know for sure, that the water tables are indeed declining?

I am sure you have figured this one out.

You might say, well it is when we notice farmers dig their bore-holes deeper.  And they do so, from time to time.  You are right!  This is an indication that the water table for his side of the land is behaving more like Pattern C and as the pattern continues to unfold the land becomes drier (a crisis is looming).

Does anyone know how deep some of the bore-holes in the Kgalagadi and possibly Namibia are?  They did not start that way.  They became that way.

The reverse, however, is true for the forests in the Amazon.  Both are happening at the same time each with its deliberate direction and goal.  This is what we, otherwise, call reality.

Uncovering the Cycle

However, most management concepts did not clarify that our straight-line goals are not designed to fight trends such as AB.  They are designed to fight the shorter-term trends like CD.  The latter, is an important view of the military and the fire-fighters.  Crisis management.

Now, if the long-term position is true, i.e. if the water tables are going down, then we have a circular causality in our hands.   This requires very different management tact.  We would need to uncover the elements of the cycle to address these long-term positions.

Therefore, rather than ask what we should do about it, the next question here is what is causing the water tables to go down?

Meaning to say, if we say the water table is going down (in the long term), what is causing that?  And in turn what is causing the cause?  And so on.  Think cycle.  Get the idea?

And remember, even when you think you have got to the “root cause”, in this work, we say, even the root cause has a cause.  Nothing exists without a reason.   It is whether we see the reason or we don’t.  In short, the 5Whys methodology does not work for persistent problems.

Do not forget to also go the other way in the cycle!  Should the water table go down, there are consequences.  Yes?  And then what are the consequences of the consequences?

Here’s a tip.  Should the circle not close in itself, then it is not the ‘right’ circle of causality.  Start again but with a different set of reasons.  This is a trick we use, before we understand more deeply the tools of this work.

Go ahead and try it!  There is something inherent about wanting to see vicious circles, as hard as it feels like to get there; it captures our curiosity and intrigue.

So, … what is the circle of causality that is causing the water table to go down?

Well, I am sure, you and your friends will keep trying and enjoy getting there!  This will be the subject of discussion next week in Part III of this series of the column on “Have Greens, Will Rain!”

Till then have a lovely week discovering and learning!

This is the 2nd of a five part series of this article.  Each part will build on the earlier article to an eventual conclusion.  We invite you to participate in the column as well as do your ‘own homework’ – searching and discussing the issue to build your own conclusions.

Ms Sheila Damodaran, an international Strategy Development Consultant in the use of systemic thinking for managing persistent issues at regional and sectoral levels, welcomes comments at sheila@loatwork.com.  For upcoming programmes, refer to www.loatwork.com/Senior_Leadership_Introduction.html.

Newspaper Column #4: Have Greens, Will Rain! – Part I


As it appeared in the Sunday Standard, Botswana on  Sunday Nov 11, 2012 edition.

How high is the Water Table?

One of my favorite subjects of the work that I do here is working with the water cycle.

Well, all of us learned about it in school.  In Grade 5.

Evaporation leads to rainfall.  Rainfall leads to seepage and runoffs.  Runoffs into rivers and lakes lead to evaporation, and so on.

Except the one difference in a systemic approach is it recognizes that this cycle is not a static process.

This means they do not remain active at the same levels of intensity over time.  The intensities are dynamic.  We did not learn about this fact in school.

And therefore, the cycle has the potential to either cause the rainfall levels to increase or decrease over time.  These trends are not clear in the short-term.  The patterns become distinct over longer periods of time, usually in years.  But the shift is definitely happening.

We call it by different names including the likes of global warming today or periods of draughts or seeing unreliable rainfalls or when we have periods of more than average rainfalls.  Their persistent behaviour over time is in effect the consequence of the water cycle in silent action.

It is silent because we do not see the water cycle directly as it is unfolding before our eyes.

Cycles can go two ways.  They can either reinforce positively or negatively.

The next four articles in November is a dedication to this subject and it explores a range of issues from primary industry production to crop or raw material production to dairy and cattle production, water availability, water consumption choices and their effects on families, the nature and the economies.  All of this will be discussed as we take a trip around the water cycle.

Where I came from, in Singapore, we typically have quite a bit of rainfall and so; it was not as much an issue in my mind, until of course when we experience floods there.

Singapore sits right on the equator and so year round, it enjoys a hot and humid tropical weather.

The nature of water is to flow

The inherent nature of water is to flow.   The more it flows out naturally, the more it comes back to us.  Naturally.  When it is trapped, it dries up.

This is a subject that has become dear to my heart as I spent more time in the country.

And then something struck me.  That the excess of or lack of rainfall is not only as a result of the terrain.  There was also the inter-play of the reinforcing nature of these water cycles.  Its intensity to reinforce positively or negatively will vary with its surroundings.

A case in point is the spread of the forests in the Amazons of South America.  These span to the same latitude as that of Botswana.

[Insert picture of world map here – see Picture I below]

Chicken and egg

Question.  Is the Amazon green because it has more rainfall?  Or does having more greens cause more rainfall in the Amazons?  Or does it happen because both exist together?  Like the chicken and egg.  Both would need to be there for them to reinforce their continued growth.

One way to appreciate the existence of the cycle as a causality of rainfall levels is to take an issue that is related to it and watch its behaviour for persistence.

If it is persistent, we would see the peaks peaking higher or the troughs digging deeper each time.  This requires us to plot the past behaviour of the issue on an x-y axis.  The X-axis is always time.  The Y-axis plots the levels of its behaviour.

Should there be a persistent decline or incline on these graphs, then we know that these cycles or circles of causality are definitely at play.

So for the purpose of this exercise, we will take a factor.  Let us say the level of the water table.

What would you say has been the behaviour of this factor, in this part of the world over a forty-year period?  The further into time we plot these behaviours, the more it becomes clearer to us the persistent nature of these issues.

Would you say the water table levels have remained constant for the past forty years (Refer to Picture 2, Pattern A)?  Or would you say it has increased during the same period (Pattern B) or would you say, it looks more like Pattern C, i.e. the water table has declined over the years?

Which pattern would you pick?

[Insert Graphic 2 here]

Did you pick Pattern C?  Most of us do so, resoundedly.  I have not had a dissenting view to that choice since I had been doing these programmes.

Now, if pattern C is true, then we have a circle of causality in our hands and it is causing problems to recur right here on this land.  To take care of the problem of water shortages, we would have to take care of the water cycle.  The whole cycle.

But before that.  How can we say for sure that it is Pattern C?

Keep wondering.  This will be the subject of discussion in Part II of this series of the column on “Have Greens, Will Rain!”.  I am sure you will be listening to what we see and hear around us every day as you figure this question out.

Till then have a lovely week of discovery and learning!

This is the 1st of a four part series of this article.  Each part will build on the earlier article to an eventual conclusion.  We invite you to participate in the column as well as do your ‘own homework’ – searching and discussing the issue to build your own conclusions.

Ms Sheila Damodaran, an international Strategy Development Consultant in the use of systemic thinking for dealing with persistent issues at regional or sectoral levels, welcomes comments at sheila@loatwork.com.  For more information, refer to www.loatwork.com.

Newspaper Column #3: Is unemployment, the real problem? The Story of Supply of Labour – Part III


As it appeared in the Sunday Standard, Botswana on  Sunday Nov 4, 2012 edition.

Labour is a cost

It can assist to generate revenue but it is firstly, a cost.  When we add them up, it can rack up into billions of dollars.  Easily.

Hence a situation of ‘that we have labour’, will not be enough reason why ‘jobs will be created’.  The jobs need to be paid.  When the money dries up, including borrowings, so does the job.  This will happen in the same way for any country.

The supply of labour however remains unchanged.  They are either more who are employed or more who are unemployed.

Next, think bottleneck.

When the supply of labour exceeds the demand for it, the demand becomes the ‘neck’ of the bottle.  It narrows the uptake of the supply. Competition and waiting for jobs are the inevitable consequences of the bottleneck.  As we release the bottleneck competition disappears.  And so would unemployment.

We would therefore require solutions on both sides of the ‘neck’ to solve the problem of persistent unemployment.

In the past two week’s editions of this column, we introduced two factors that influence persistent unemployment.  Should we create new jobs (i.e. there is demand for labour), unemployment goes down.  Should however, the numbers of births and immigration (i.e. the supply of labour) go up over time, so does unemployment.

We also discussed that the ability of sectors to create jobs is influenced by the health of profit margins of three interrelated industries, i.e. the primary, secondary and tertiary industries.   We discussed when the primary industry grows; they help to grow the secondary industries which in in turn help to grow the tertiary industries.

At this point, unemployment becomes resolved.  Hard as it may sound, it is a solution we cannot ignore.  The easy way out, would lead us back in, one way.  Back to the problem.

In today’s edition of the column, we explore the story of the supply side of unemployment and its solution.

This becomes important to help us see solutions that are digging us in deeper into the problem.  It will be ironical that what we had hoped will help the situation could actually be making them worse.  Things become better before they become worse.  At that point, we would have a situation spiralling out of hand.

A case in point is, if there are more of us than there are jobs available, skilling people without creating jobs will not make unemployment go away.  I know we do not like to hear this.  And neither do I.

Jobs do not stay vacant.  They are going to others.  And yes, while the best man may win, there is another man (or woman) out there.  That is the point.

If the problem does not budge despite resources, then it is a sign that all what we have done was to apply a solution to the consequence of the problem but not to its cause.  To deal with the cause, we would need to pull ourselves away from the fire to notice where the gas pipe is coming from.  A fireman cannot help us at this stage.

Supply of Labour

What causes the increase in the supply of labour?

One might say, well that’s easy.  It is caused by migration.  Well, that is certainly true.   For the short term.  Migration is just that.  Sometimes they are in.  And sometime they are out.

Sustained long-term increase in the supply of labour is caused by the rates at which locals add births to the population numbers within the country.   This impact is pre-determined.  It cannot be changed,  its effects are not felt immediately but they were set into motion twenty years ago.  They are felt twenty years later when the babies have grown into young adults and are about to join the employment pool of the country.

We therefore do not connect the problem to the cause since they are both distant in time and space from each other.  And when we do not see this relation, we disregard the cause and take the easier way out.  We look at immigration.  This happens for any country.

And so, if unemployment is persistent today, then this is an indication that numbers of those born twenty to thirty years ago and have now joined the labour pool, had been pushing up slowly but steadily.   Yesterday, we rejoiced each birth in our families.  Of course, we were not watching their total consequences on the nation for tomorrow.  Well, not yet.

As a nation, how many persons have we added to the pool of supply in the past forty years?  Yes, it may feel late to ask such a question.  It is meant as a way to face reality.

Let us say, should we produce 5,000 children per month, and that makes it 60,000 babies born in a year, then we can reasonably expect that twenty years from now (and 1.2 million people later), when they grow up, we would need to be preparing for an additional 60,000 jobs (given gender equality) for that cohort.

This is in addition to those already employed prior to them.  If we are seeing 30,000 retirees, we are still looking at creating an additional 30,000 or more new jobs for the cohort.  And do not forget these 60,000 do not stay at producing another 60,000.  Yes?  How many will they produce in ten to fifteen years from now?  That will become tomorrow’s reality.

How much would an additional 30,000 jobs (for that year) cost us?  Don’t forget the other years and other employees.

Who created the children?  You are right.  We did!

Who will create the jobs for them?

Creating Jobs

In a recent project on unemployment in a country, we saw the population of 35 year olds and younger, ballooned six folds in a thirty-year period.  On the other hand, job creation had not risen by anywhere near as much.  The population had disregarded these economic factors.  Of course, we can say, economic and bedroom choices do not always mix.

At rates of six-fold increases, just that layer of the population would quite easily add over another 1/3 million persons by the next generation.  These are figures before immigration.

So what is happening?

In short, we are now attempting to “fight” the problem somewhat oblivious to these realities. We saw the fire. But not what caused it! We had hoped that the supply of labour could influence the demand for labour. But that is just not economics.

Still, I wonder if, as citizens, we can totally absolve ourselves from not understanding these figures and how they play up in our everyday lives.   What do you think?

At some point we would no longer be able to shut our eyes to this.  The reality would soon wake us up, as as we see our children stay unemployed.

Have we come back full circle here?  Who designed this circle of causality?  Is this unique for one country?

What should we do today?

As citizens should we know what these numbers look like for the country?

Understanding this trends, profoundly changes the game plan in many ways.  Firstly, it allows the problem to be solved where it started (the community), not where it ended (government).  There is leverage here, as it allows the greatest changes to happen with the least amount of effort.

I have tended to believe that should citizens understand these numbers, they would become clearer at steering the country out of this problem.  Even by themselves.  These may include making choices such as coming up to speed in ways to create jobs rather than wait for jobs to be created.  Or consider seeking employment outside the country.  It is the go-getter attitude by such individuals that will eventually help draw revenue to any country and themselves.

That’s for today.  How may we better prepare ourselves for tomorrow?

Families are key

We could actually become better at matching birth with job creation rates.  Knowing these trends, may free us as families, to consider channelling resources to the building of the primary industries of the economy.  This is a strong system of production of raw materials for all levels of the economy.  Farmers, and growers of raw materials, who see this impact beyond putting food on their table for their family, are beginning to pay attention to this systemic reality.  Production is now greater than consumption in the country.

When they do so, the family is now taking a step towards ensuring that jobs are more likely to be created at other levels of the economy, for the children we produce.  We may find that as more resources are allocated to primary industry production (and less to child production) we become better at learning to manage our population numbers more in line with the capacity of the country to produce jobs for our children.  There is an order in which causality happens.

Unemployment, at that point, stops becoming a problem.

How do you see this issue?  Given the above, do we need to understand the picture that is happening for the country today?  What’s stopping families allocating resources to primary industries?

Go forward another twenty years from now.  What trends would you like to see?  For our families?  The economy?  And our country?  For employment?

Hope this inspires discussion amongst your family and friends for ways you see us resolve this issue.

English: US Whig poster showing unemployment i...
English: US Whig poster showing unemployment in 1837 (Photo credit: Wikipedia)

Newspaper Column #2: Is unemployment, the real problem? The story of Demand for Labour – Part II


As it appeared in the Sunday Standard, Botswana on  Sunday Oct 28, 2012 edition.

Supply of Labour

Industries (be they by locals or foreigners) do not exist for the sole purpose of employing citizens.  Hard as it may be to accept this point, it really is not that difficult to see the reason.

What is harder to see is an unemployed economy will affect the growth of his industry.  Not immediately.  But eventually it will.  Think most political revolutions. It is a sign of a vicious circle.

In last week’s edition of this column, we uncovered two factors that influence persistent unemployment in any country.   These were:

  1. The rates of growth of demand for labour (by employers) vs.
  2. The rates of growth of supply of labour (by employees)

As the supply of labour (rising birth and migration rates) persistently exceeds demand, unemployment grows.  This does not mean that our attempts at correcting the problem will not be successful.  They will not be successful for the long-term.

On the other hand, as the demand for labour (number of new jobs created) persistently exceeds the supply, unemployment would decline (and literally disappear by itself).

This week, we explore the demand – a side commonly used by most of us when focussing on the problem of unemployment.  In the next edition of this column, we will get around to supply.

But before we continue, what does the picture of growing demand for labour look like?  We might say, well, that is obvious.  We would see companies and industries recruit and persons as employees of their organizations.  That’s where most of us would stop.

But that would not be quite enough here.  We should see increasing numbers employed for the long-term.  Possibly even for decades.  And it happens primarily in the private sector.  They are key. If these three conditions do not happen, then real and deliberate growth in demand for labour has not quite happened.  Yet.

But what influences the demand for labour to grow consistently (rather than ad-hoc)?

It would require industries and the country to post a healthy growth of its income margins or profits.  Year-on-year.

Margins / Profits = Level of Revenue Earned – Level of Costs Incurred

This difference needs to grow sustainably.  Where revenues grow and costs decline, the industry is well positioned to create new jobs each year and pay for higher wages in other years.  The reverse is also true.  When the margins are negative, we would face sustained unemployment.

What would cause the margins to grow sustainably for any industry?

Asking this question is deliberate in helping the mind steer itself to the inevitabilities.

Does sustainable growth of margins happen because we are able to apply “do more with less” strategy, really well?  Or, is it because sales have picked up for that industry.  Well, yes, partly.

However, here’s the inevitable.

The extent to which we see sustained growth of margins depends on the extent margins or profits grow across ALL the three levels of industries in any economy, i.e. primary, secondary and tertiary industries.  These three share a very tight systemic relationship!

As we take care of the whole, not parts of the economy, the nation grows.  We all know that.  AndI know we can turn this knowledge around with our hands and feet.

So what causes sustained systemic growth of all three types of industries?

Think tomato sauce.  The cost of manufacturing and eventually retailing that sauce would depend on the cost of the transport and distribution systems (secondary industries) needed to transport the raw materials to the factory or retail sites as well as the cost of producing the raw material itself (i.e. from seed to fruit by the farming industry).

The transport industry, in this regard is secondary to manufacturing while farming of tomatoes is primary to both transport and manufacturing.

Should however, the costs of the primary and secondary industries for each unit of product produced increase over time, the  tertiary industries would not be able to reverse those costs, much less grow without incurring further costs and will have their work cut out for them to stay afloat, much less see their margins grow in sustained ways.  That is the reality.  The experience will otherwise be like juggling balls.  It will be hard to take our eyes off them because we do not know when they will fall.

When these costs are passed on to the customers or citizens, it makes it harder for them to find ways to fund continued private sector development efforts.  Here we have now come full circle.

In most cases, the primary industry refers to raw material production, in particular crop production.  As we grow our raw materials (as we have achieved with sorghum production), its secondary (farm and brew trucks) and tertiary (brew production and retail) industries will begin to grow as well.

Just as the white farmers in South Africa in the primary industries (vegetables, fruits, dairy and livestock production) have done for the Chinese and the Indians in the secondary and tertiary industries there (as well as here in major supermarket chains).   This relationship, however, did not happen overnight.  It took almost one hundred and fifty years in the making in South Africa (and not forgetting two centuries before that in India).

So for a nation to thrive (not survive), think the root of a plant.  When the root thrives, so does the plant.  When it dies, so will it and the other healthy roots around it will suffocate the plant out.  Removing the top of the plant will not cause it to go away.  The root will bring it back.

I am sure you see it!  When the profit margins do not grow for all of the three industries, the number of new jobs created does not grow.  Instead, unemployment grows.What is the implication of these to employment, you ask?

Where are we today as a nation on this graph?

Which industries are dominant for the nation?  Which ones are not?  Which industry do you see as driving the others?  Would you like to be a part of or lead from that seat?  I am sure you can!

What would cause the health of primary industry or production of raw materials to grow over time?  This will be the subject of another column.  But till then, I wish you, happy thinking and discussing.

So is unemployment the real problem or could it just be the tip of another problem? The iceberg. How do you see this issue?  Go forward another twenty years from now.  What could these trends look like then?  Could this possibly affect the sovereignty of a nation?  For any nation?

The 3rd instalment in this three part series of this article will appear in the next edition of this column.  It will explore the supply side of the equation of labour and unemployment.   Watch this space.

Newspaper Column #1: Is unmployment the real problem – Part I


As it appeared in the Sunday Standard, Botswana on  Sunday Oct 21, 2012 edition (maiden print).

This is the 1st of a three part series of this article.  Each part will build on the earlier article to an eventual conclusion.  We invite you to participate in the column as well as do your ‘own homework’ – searching and discussing to build your own conclusions.

When unemployment persists (hard as it is to admit it is happening)

Persistent unemployment, in any country is a consequence of two factors.

The rate of increase of supply of labour (birth rates from twenty years ago) relative to the rate of increase in the demand for labour (job creation rates of today).  In jest, it is a mismatch of rates of child creation of the past vs. rates of job creation today.

Should the rate of demand for labour exceed supply year on year; we would have full employment of the locals and perhaps be able to employ foreigners as well.  However, should supply of labour persistently outgrow demand; we would now have a classic case of persistent unemployment.

When we, as citizens, learn to watch these two behaviours of change as a nation over time then we should expect to resolve the issue of unemployment.   For good.

When we don’t, and we are oblivious to the reason, all we can expect to do is to play a catching-up game but not solve the problem.  It stays on the charts as a stubborn problem, usually on the President’s table, worsening over time.  This is, despite efforts from all quarters to run ahead of the problem or get to the root of the issue.  Not to say, we hear persistent disgruntlement amongst the locals about the lack of employment opportunities for the youth or for those employed the lack of pay rises and we harbour fears of jobs being taken away by foreigners.

So,

Sustained Growth of Supply of Labour > Sustained Growth of Demand for Labour

= Sustained Unemployment

[Insert graphic here]

These two factors are not directly related to each other, but they each

 influence unemployment, separate as they may be.

But what led things to get this far?

What causes the demand for labour to decline relative to the supply of labour?  And what causes the supply of labour to increase relative to the demand for it?

First let’s explore the supply side.

Here’s a case in example.  In the ten years to 2010, Vietnam saw its population numbers grow from 80 to 89 million.  Growth of population numbers and more typically birth and migration numbers influence the supply side of this equation.  Job creation on the other hand, did not see such levels of growth.  The result is, we see runaway unemployment in the country.

Closer to home, while, population numbers in the country do not compare anywhere close to those we see in Vietnam, still when we look beyond the overall numbers, there are interesting data that we cannot ignore.

We know the overall population numbers have grown somewhat from 1.5 to 2 million levels over a decade.  Given however, the concerns of mortality rates one may conclude that our population numbers have not really changed all that much to warrant the unemployment levels we see in the country.

But realistically … has the supply of labour declined over time?

Births rates from twenty years ago, leads to the supply of labour and therefore the unemployment numbers we see today.

When we remove population and mortality figures and see our fertility rates, we may notice that these numbers have not been all that low.  In fact, typically in most populations, each generation outnumbers the previous one.  Think of population pyramid, where the numbers of young born are in numbers greater than older persons in the population.  But also see population pyramids for more recent decades assuming wider bases than those in previous ones.

Such trends are not apparent when we gloss over overall population data.  Yes, there is migration data.  But we cannot shut our eyes to these sheer levels of increase.

Do we know by how much such numbers have grown?  In the country?  In the region?

A separate question is, when should we start noticing such increases?  Would it be when the young turn 20 years old and are now looking for a job and they complain they cannot find one?

That will be too late!

We would now instead be dealing with “a fire” in our hands.  Youth unemployment rather than employment.  Yet it really is a problem that had its embers simmering for the past 20 years.  Quietly but surely.  But we were not watching it, till the embers had blown over and we now have a fire in our hands.  At this point, we say, we have a problem.  A burning platform.  But the signs were long there.  If we push this now, the system will push back.

Ok it has not.  And … has the demand for labour increased by such levels during this period?

If it has, we should not see sustained unemployment.  This is indicative that the demand for labour has not matched such levels.

How much has it increased by?  Perhaps more importantly, how much would it need to increase by?  Two-folds?  Six-folds?  What do you see are the answers?  What is making it difficult to get there?

Interestingly, should we think carefully about both sides of the equation, that is, the jobs and the children we create are influenced by the same segment of the population.  The Adults.

While perhaps we may argue that these’ activities are carried out’ by different sub-segments of the adult population, it is still the sole prerogative of this group.  The problem may not belong to any one part of this group, i.e. government or private sector or families.  That sounds like the bad news.  That it was our fault (in any generation).  But the good news is if we created the problem, then we also have the ‘power’ in our hands and in our hearts to turn it around (yes, even as a citizen) for the nation.  Together.

So is unemployment, still the real problem?  How do you see this issue?  Go forward another twenty years from now.  What would these trends look like then?

Yes, you are right given this, the reality looks painful for our children too.  But I also know, if anyone can turn this around, it is us!

The 2nd and 3rd articles in this three part series will appear in the next edition of this column.   It will seek to explore the story of the demand and supply sides of labour respectively more deeply and what causes them to either grow or decline over time.

END

#998

Countries by birth rate in 2008World map showing countries by nominal GDP per...

While this is her maiden newspaper column, Ms Sheila Damodaran is an avid writer on her blogs and website.   An international consultant in the use of systemic thinking for regional or sectoral strategy development, she welcomes feedback on her column as well as requests for types of persistent issues you wish to see discussed in her column at sheila@loatwork.com.  For more information, refer to www.loatwork.com.

Hello World! The grass can be greener on your side.


One day my neighbor as he passed by my garden, noticed how the grass in my garden appeared greener than the ones in his garden.  The next day he approaches his gardener and asks, “Tell me my man, why is the grass in Sheila’s garden greener than the one in mine?”

In all humility, the gardener turned and faced his boss, and said, “That’s because, Sir, Sheila feeds her grass with fertilizers (food) that then waters (water) them to allow them to turn greener (health)”.

The boss, my neighbour, realized at once what he had to do.

He turns to his gardener, “Come on my man, let’s go to the nursery.  We need to get those fertilizers to feed the garden so that the grass on this side too will be green!”