
Strategic Insight Brief: Understanding the Crisis in the Diamond Industry

Policy Brief
Title: Reimagining the Diamond Industry’s Role in National Development
Date: June 2025
Prepared by: Ms Sheila Damodaran, STRLDi, Botswana
Executive Summary
The global diamond industry is undergoing a profound transformation. Driven by shifting generational values, declining cultural relevance, and the rise of lab-grown alternatives, overall diamond consumption has dropped by 30–40% per decade since 2005. If these trends persist, the industry could face near collapse by mid-century. This decline is not due to dwindling reserves but reflects a broader societal shift away from the systems—marriage, stable employment, and cultural rituals—that once gave diamonds their meaning.
Botswana and other diamond-producing nations must confront this reality. The choice is stark: transition away from diamonds as a foundational economic sector, or invest in rebuilding the institutional, cultural, and economic infrastructure needed to sustain diamond relevance globally.
Background
Historically, diamonds contributed substantially to Botswana’s public revenue, infrastructure, and export earnings. Yet the diamond industry is capital-intensive, with limited job creation and weak economic linkages beyond mining. Most value is captured downstream—branding, design, and retail—by foreign entities.
The luxury market where diamonds are sold rarely loops profits back into producer economies. Without downstream control and national branding, countries remain locked into the low-value, high-risk end of the global value chain.
Core Challenge
The structural driver of the diamond market decline lies in societal transformation:
- Marriage and family formation are declining.
- Millennials and Gen Z prioritize experiences, sustainability, and ethics over status symbols.
- Formal employment, a precondition for consumer spending and ritual-based consumption, is eroding.
Lab-grown diamonds, though growing in volume, only delay the broader collapse in symbolic relevance.
Strategic Options for Botswana and Similar Economies
Transition Strategy
Diversify economic reliance away from diamonds toward sectors with stronger employment multipliers (e.g., agriculture, tech, creative industries).
Reinvest the fiscal surplus from diamond sales into education, manufacturing, and entrepreneurial ecosystems.
Revitalization Strategy
Develop a fully localized value chain: cutting, polishing, jewelry design, luxury branding, and retail.
Create Botswana-based luxury brands that connect diamonds to modern, ethical, and culturally relevant narratives.
Build capacity in gemology, retail, and e-commerce infrastructure.
Institutional Renewal
Promote formal employment, family stability, and cultural rituals that restore symbolic value to diamonds.
Support public campaigns that reframe diamond giving for modern contexts (e.g., achievement, self-love, sustainability).
Conclusion
The decline of the diamond market is not a temporary downturn—it is a systemic, structural shift. Botswana must act decisively. Either we transition out of diamonds as the core of our economy, or we invest in revitalizing the social and economic foundations that once made the industry thrive. The diamond’s value was never in the stone alone—it was in the systems that supported its meaning. It is time to choose which path to take.
Contact: STRLDi | Sheila Damodaran | June 2025
Going Back to the Beginning
What has been / or continues to be the role of the diamond market in economy building?
The diamond market is deeply connected to the global economy—but its role in economy building beyond mining, processing, and marketing remains underexplored and unevenly distributed. Here’s a breakdown of how connected it is, and what untapped potential it holds:
✅ Where It Is Globally Connected
Global Value Chains
Diamonds follow a complex journey:
Mining (Botswana, Russia, Canada, etc.)
Trading & Sorting Hubs (Antwerp, Dubai, Mumbai)
Cutting & Polishing (India, Thailand)
Retail (USA, China, UAE)
These links make the market highly interconnected, with shocks in one area (e.g. sanctions on Russia, inflation in the U.S.) having ripple effects globally.
Foreign Exchange and Trade Balances
For producer countries like Botswana, Angola, or Namibia, diamonds are a critical source of export earnings. Their trade performance is often heavily influenced by the global diamond market.
Public Revenue and Infrastructure
In countries like Botswana, diamond revenues contribute significantly to national budgets, funding education, health, and infrastructure.
Finance and Investment Vehicles
In luxury economies, diamonds are now being considered alternative investment assets (like gold), though with mixed success due to valuation opacity.
❌ Where It Falls Short in Economic Building
Limited Industrial Multipliers
Outside of mining and polishing, few countries have leveraged diamonds to create robust industrial ecosystems, similar to those found in oil (e.g., petrochemicals) or agriculture (e.g., agro-processing).
There is limited R&D, design, or technology transfer related to diamonds.
The luxury sector, where diamonds end up, rarely loops back profits into producer economies.
Employment Creation is Narrow
The sector is capital-intensive, especially mining. Beyond artisanal mining (often informal), the job multiplier per carat is low unless local cutting, polishing, or jewelry production is developed intentionally.
Weak Integration with Broader Economic Sectors
Very few linkages are built with:
Tourism (e.g., gem museums, high-end retail tourism)
Education (e.g., geological sciences, luxury branding schools)
Creative industries (e.g., fashion, art, design)
Dependence on Multinationals
Large firms (e.g., De Beers, Alrosa) dominate the extraction and early processing stages. This reduces local ownership and weakens long-term economic resilience.
🔄 Missed Opportunity: Diamonds as a Driver of Diversification
A more systemic understanding of diamonds could transform their role in economic building by:
- Developing national brands (e.g., “Botswana Diamonds” as a finished product line)
- Fostering local luxury goods sectors (e.g., high-end jewelry design, fashion)
- Building educational and technical hubs (e.g., institutes for gemology, retail management)
- Integrating diamonds with tourism (e.g., high-value travel, showroom experiences)
Conclusion
Globally, the diamond market is highly connected in trade and finance, but weakly connected when it comes to sustainable, inclusive economy building. Most of the economic value is still captured downstream in richer countries. Unlocking its full potential will require reimagining diamonds not just as a commodity, but as a platform for industrial, creative, and service-sector growth.
What is preventing the luxury sector from looping profits back into producer economies?
Several interlinked factors prevent the luxury sector, where diamonds end up, from looping back profits into producer economies:
1. Value Is Captured Downstream
- Markup happens after the diamond leaves the source country.
A rough diamond might be sold for $200 at the mine, but once it’s cut, branded, and retailed in Paris or New York, it may sell for $10,000 or more. - Most of this margin is captured by brands, retailers, and marketers, not miners or producers.
2. Lack of Control Over the Full Value Chain
- Producer countries typically do not control:
- Cutting & polishing centers (mostly in India, Israel, Belgium)
- Branding and marketing (e.g., Cartier, Tiffany & Co., De Beers)
- Retail distribution and e-commerce platforms
- This makes it hard to claim a bigger share of the value pie.
3. Weak Domestic Luxury Ecosystems
- Most diamond-producing countries lack developed luxury industries:
- No local high-end jewelry brands
- Few globally recognized designers
- Weak logistics, packaging, branding, or export capabilities for luxury goods
- As a result, they cannot compete at the high-margin end of the market.
4. Foreign Ownership and Concessions
- Mining rights and upstream operations are often owned or co-owned by foreign multinationals (e.g., De Beers, Alrosa).
- Even when revenue-sharing agreements exist, they rarely include profit-sharing from final luxury goods sales.
5. Luxury Is Built on Intangible Value
- The luxury price of diamonds is shaped more by brand, story, and perception than by the physical diamond itself.
- These intangibles are created and monetized in Western markets, not where the diamonds are mined.
- Without owning the brand or narrative, producers can’t profit from this intangible premium.
6. Global Trade Structures and Power Imbalances
- Trade agreements, tax structures, and global finance are often biased in favor of capital-rich countries.
- Producer countries may face barriers to exporting finished luxury goods or lack leverage to demand better terms from multinationals.
7. Low Local Demand
- The luxury sector is built on wealthy consumer markets, which are concentrated in the Global North.
- Without strong domestic demand, it’s harder to justify luxury-focused industries within producer countries.
🔄 Summary
The luxury diamond sector doesn’t loop back profits because the real value isn’t in the stone—it’s in the story, branding, and distribution, which are controlled by entities far from the mine. Without reclaiming more of the downstream chain—design, finishing, branding, and sales—producer economies remain trapped in the low-value, high-risk end of the market.
Diamond Industry Capital Structure
The diamond industry has a very distinct capital structure compared to other leading industries. Here’s a comparative breakdown showing how and why its capital demands stand apart, using key economic dimensions:
1. Diamond Industry
| Capital Demand Type | Characteristics |
|---|---|
| Upfront Capital | Extremely high – mining exploration, licensing, and equipment often cost hundreds of millions to billions USD. |
| Working Capital | High – especially in polishing, inventory, and speculative trading. Diamonds are held for long periods to maximize returns. |
| Return Cycle | Long and uncertain – exploration may take years, and finished diamonds are speculative, driven by luxury market trends. |
| Barriers to Entry | Very high – due to geological scarcity, state concessions, and powerful existing players (e.g., De Beers, Alrosa). |
| Capital Intensity | High – requires heavy fixed investment (mining) and expertise-intensive processing (cutting, grading, certification). |
| Risk Type | Geological, geopolitical, reputational, market volatility (luxury demand), and synthetic diamond competition. |
| Profit Capture | Skewed downstream – capital tends to flow toward branding and retail, not extraction. |
2. Manufacturing (e.g., Automobiles, Electronics)
| Capital Demand Type | Characteristics |
|---|---|
| Upfront Capital | High – large plants, R&D, automation lines, but better amortized over consistent output. |
| Working Capital | Moderate to high – raw materials, labor, and logistics, but with predictable cycles. |
| Return Cycle | Medium – structured sales channels and consumer markets. |
| Barriers to Entry | Moderate to high – driven by tech and scale, but new entrants like EV startups are rising. |
| Capital Intensity | High – but more productive per dollar than diamonds. |
| Risk Type | Market shifts, tech disruption, raw material prices. |
| Profit Capture | Across value chain – strong brands capture margins, but OEMs and suppliers also share. |
3. Agriculture (Commercial Scale)
| Capital Demand Type | Characteristics |
|---|---|
| Upfront Capital | Moderate – land, equipment, and infrastructure. |
| Working Capital | High – tied to seasonal inputs, labor, irrigation, and market delays. |
| Return Cycle | Short to medium – usually seasonal, except tree crops. |
| Barriers to Entry | Relatively low – but scale matters for profitability. |
| Capital Intensity | Medium – mechanization improves output, but lower than diamonds. |
| Risk Type | Weather, disease, price fluctuations, and political interference. |
| Profit Capture | Thin – unless integrated into processing, branding, or export. |
Digital Tech (e.g. SaaS, Fintech)
| Capital Demand Type | Characteristics |
|---|---|
| Upfront Capital | Low to moderate – mainly into software development and talent. |
| Working Capital | Low–lean operations, scalable servers. |
| Return Cycle | Rapid–recurring revenue models (subscriptions, transactions). |
| Barriers to Entry | Low for basic platforms; high for trusted or regulated fintech. |
| Capital Intensity | Very low – extremely high return per dollar. |
| Risk Type | Tech obsolescence, data breaches, and platform dependency. |
| Profit Capture | High – High-near-monopoly profits for market leaders. |
Summary Table
| Industry | Upfront Capital | Working Capital | Return Cycle | Barriers to Entry | Capital Intensity | Profit Capture Skew |
|---|---|---|---|---|---|---|
| Diamond | Very High | High | Long | Very High | High | Downstream (Retail) |
| Manufacturing | High | Moderate/High | Medium | Moderate/High | High | Shared |
| Agriculture | Moderate | High | Short/Medium | Low/Medium | Medium | Thin (unless integrated) |
| Digital Tech | Low/Moderate | Low | Short | Low | Low | Platform Owners |
Key Insight:
The diamond industry’s capital requirements are heavy, front-loaded, slow-returning, and speculative, with profit largely captured by entities downstream in brand- and consumer-driven markets. This is fundamentally different from more agile, tech-based, or cyclical industries where capital can turn over quickly and returns can be reinvested internally or locally.
Here is a side-by-side costed example in USD of what it would take to start a diamond value chain in Botswana vs an agriculture value chain, assuming each is designed to be fully vertically integrated (i.e., from production to value addition and local or export sales).
A. Starting a Diamond Value Chain in Botswana
| Stage | Activity | Estimated Cost (USD) |
|---|---|---|
| 1. Exploration & Licensing | Geological surveys, core sampling, licenses | $5–10 million |
| 2. Mine Development | Pit/mineshaft construction, equipment, housing | $50–100 million |
| 3. Mining Operations | Year 1 operating capital: staff, fuel, maintenance | $10–20 million |
| 4. Sorting & Valuation Centre | Secure facility + graders, training local staff | $2–5 million |
| 5. Cutting & Polishing Hub | Equipment, clean rooms, skilled labor training | $3–6 million |
| 6. Jewelry Design & Production | Equipment + local design studio setup | $0.5–1.5 million |
| 7. Brand & Marketing | Build local diamond brand + export market access | $2–4 million |
| 8. Retail (Domestic or Export) | Flagship store, e-commerce platform | $1–2 million |
💰 Total Estimate: $75 million–$150 million+
🔻Note: This excludes downstream risks like inventory holding (millions of USD in rough/finished stones) and assumes government cooperation. The ROI cycle is long (7–15 years) and profits are often not retained locally unless tightly controlled.
B. Starting an Agriculture Value Chain in Botswana (Horticulture)
| Stage | Activity | Estimated Cost (USD) |
|---|---|---|
| 1. Land & Soil Development | Purchase or lease (100 ha), soil improvement | $100,000–$250,000 |
| 2. Irrigation Infrastructure | Drip/pivot systems, borehole or dam | $200,000–$400,000 |
| 3. Greenhouses/Nursery | Seedling production for value chain crops | $50,000–$100,000 |
| 4. Farming Equipment | Tractors, implements, cold storage | $150,000–$300,000 |
| 5. Production & Operations | Inputs (fertilizers, seeds, labor, energy) Year 1 | $100,000–$200,000 |
| 6. Post-Harvest Handling | Packhouse, sorting, grading, cold chain | $100,000–$250,000 |
| 7. Processing Facility | Value addition (e.g. drying, juicing, bottling) | $200,000–$500,000 |
| 8. Brand & Market Access | Branding, packaging, export compliance, logistics | $50,000–$150,000 |
💰 Total Estimate: $950,000–$2.15 million
🔻Note: ROI is faster (1–3 years depending on crop) and job creation is broad across skill levels. There is also room to scale down (e.g., 10 ha model at $250k) or up.
Comparison Summary
| Factor | Diamond Chain | Agriculture Chain |
|---|---|---|
| Startup Cost | $75M–$150M+ | $950K–$2.15M |
| Time to Return | 7–15 years | 1–3 years |
| Job Creation | Low (capital-intensive) | High (labor-intensive) |
| Profit Concentration | Downstream (outside) | Can be retained locally |
| Scalability for Locals | Very limited | High |
| Risk Type | Geological, geopolitical | Weather, price volatility |
| Policy Leverage | Constrained by MNCs | High flexibility for local govt |
Insight:
While diamonds generate massive fiscal revenues, they lock capital, limit participation, and take decades to yield broader socioeconomic value—unless downstream is fully localized.
In contrast, agriculture offers faster, inclusive returns, greater resilience, and broader economy-building benefits per dollar spent.
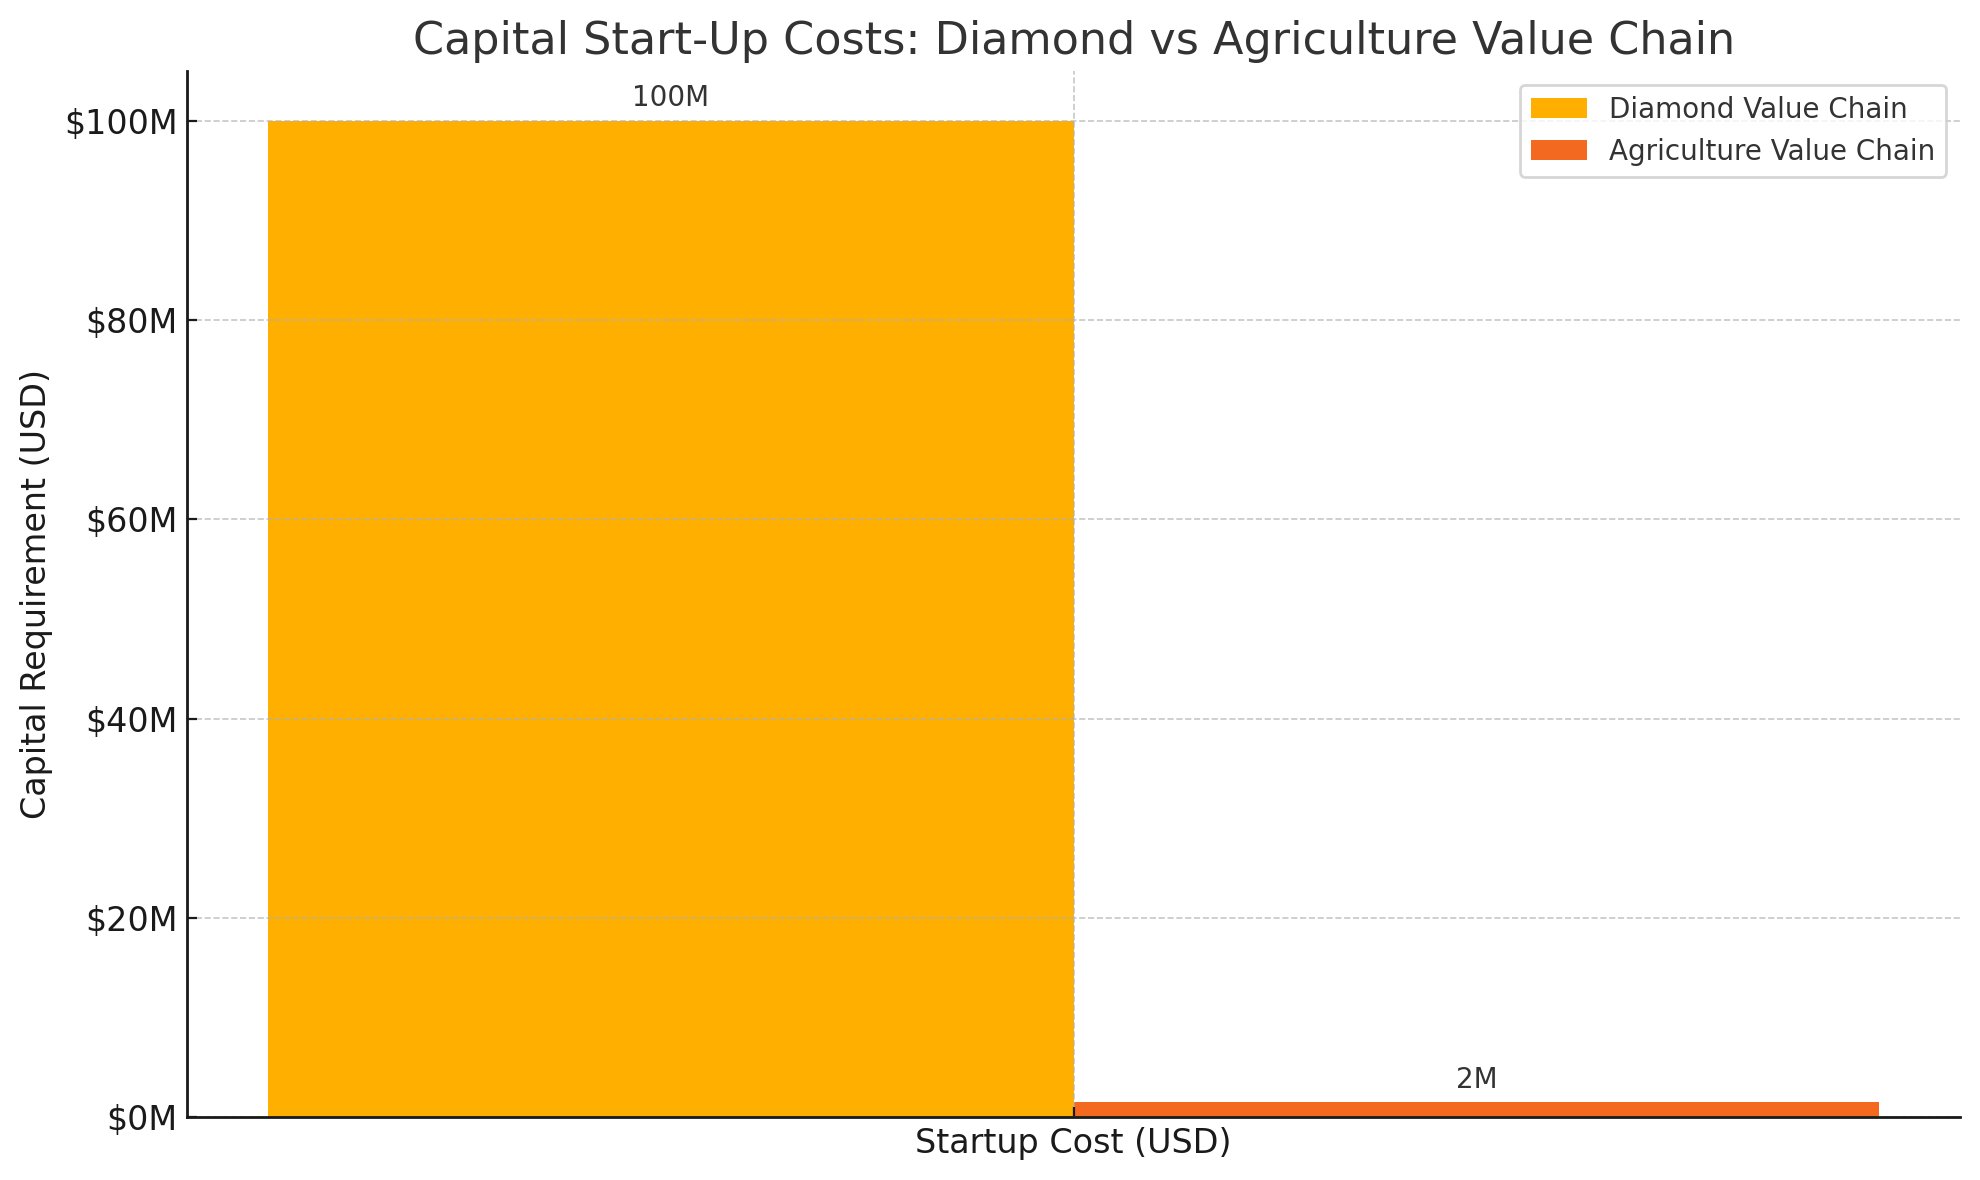

Here is a visual comparison of the startup capital requirements for launching a diamond value chain versus an agriculture value chain in Botswana. While the diamond sector demands upwards of $100 million, agriculture can be initiated with under $2 million, offering far quicker returns and broader economic participation.
Performance of the Global Diamond Industry
The global diamond industry has undergone dramatic shifts from the 1900s to today, marked by monopoly control, wars, technological disruption, and changing consumer values. Here’s a structured overview of its performance across five key periods:
1. Early 1900s–1940s: Monopoly & Expansion
- Dominated by De Beers, which controlled over 90% of global diamond supply through a single-channel marketing system.
- Diamonds were marketed as rare and valuable, although they were relatively abundant.
- Major discoveries in South Africa, then later in the Belgian Congo and South-West Africa.
- Rise in industrial use (drill bits, saws) and early gem market for European elites.
- WWII period: Industrial diamond use surged, while gem sales declined.
🔹 Global Impact:
Consolidated power in the hands of a few players; strong price control and limited transparency.
2. 1950s–1980s: Boom Years & Cultural Dominance
- The De Beers slogan “A Diamond is Forever” (1947) redefined diamonds as essential for engagement and love.
- Massive growth in the U.S. consumer market, followed by Japan and Europe.
- Strong growth in mining outputs from Botswana, Namibia, and Zaire.
- New cutting hubs established in India (for small diamonds).
- Cartel-like price stability was maintained by De Beers through stockpiling and supply control.
🔹 Performance Summary:
- Revenues grew exponentially.
- Diamonds became a cultural symbol of love and commitment.
- Strong economic contribution to Southern African economies (e.g., Botswana).
3. 1990s–Early 2000s: Conflict & Competition
- “Blood diamonds” (conflict diamonds) from Sierra Leone, Angola, and the DRC triggered global backlash.
- UN sanctions and the Kimberley Process (2003) attempted to restore consumer confidence.
- Emergence of new players like Alrosa (Russia) and Rio Tinto (Canada, Australia).
- De Beers’ dominance dropped from 90% to ~40%.
- Antwerp and Dubai rose as major trade hubs.
🔹 Global Shift:
- The industry became more fragmented and competitive.
- Consumer trust became a vulnerability.
- Increased pressure for ethical sourcing and traceability.
4. 2010s: Disruption & Synthetic Diamonds
- Growth of lab-grown diamonds (LGDs), indistinguishable from natural diamonds but far cheaper.
- Millennials and Gen Z challenged traditional narratives—valuing ethics, sustainability, and price.
- De Beers entered the LGD market with Lightbox (2018) at budget pricing, acknowledging the disruption.
- China and India emerged as both producers and major consumers.
- E-commerce changed the diamond buying journey—more transparency, less mystique.
🔹 Performance Reality:
- Prices for smaller natural stones softened.
- The industry faced an identity crisis: value, ethics, and romance all questioned.
5. 2020s: COVID, Collapse & Realignment
- COVID-19 halted supply chains, production, and luxury spending temporarily.
- But demand rebounded strongly in 2021–2022, especially in the U.S. and China.
- Since 2023–2024, the market has declined sharply:
- Oversupply of both natural and lab-grown diamonds
- Drop in prices—especially for smaller polished diamonds
- Rising geopolitical tension: Russian sanctions hit Alrosa, diverting supply
- De Beers IPO postponed; company considering strategic restructuring
- Producer countries (like Botswana) renegotiated terms to gain more control over downstream benefits.
🔹 Current Landscape:
- Uncertain demand outlook.
- Excess inventory and falling prices across many categories.
- Sustainability, transparency, and local beneficiation are becoming critical.
Performance Snapshot (1900s–2020s)
| Period | Key Traits | Control Structure | Profit Concentration |
|---|---|---|---|
| 1900s–1940s | Monopoly formation, global expansion | De Beers (monopoly) | Mining houses |
| 1950s–1980s | Consumer boom, diamond myth solidified | De Beers (cartel-like) | Centralized (SA, UK) |
| 1990s–2000s | Fragmentation, ethics scandals | Multipolar (Alrosa, etc.) | Shifting, partial leakage |
| 2010s | Disruption via synthetics, e-commerce | More fragmented | Retailers, labs, brands |
| 2020s | Crisis, restructuring, realignment | In flux | Unclear, margin shrinking |
Conclusion:
From a century of dominance under a single cartel to a complex, fragmented, and disrupted global industry, the diamond market has shown strong historical performance, but is now under existential threat. The way forward lies in transparency, beneficiation, sustainable branding, and possibly national value chain repositioning—especially for producers like Botswana.
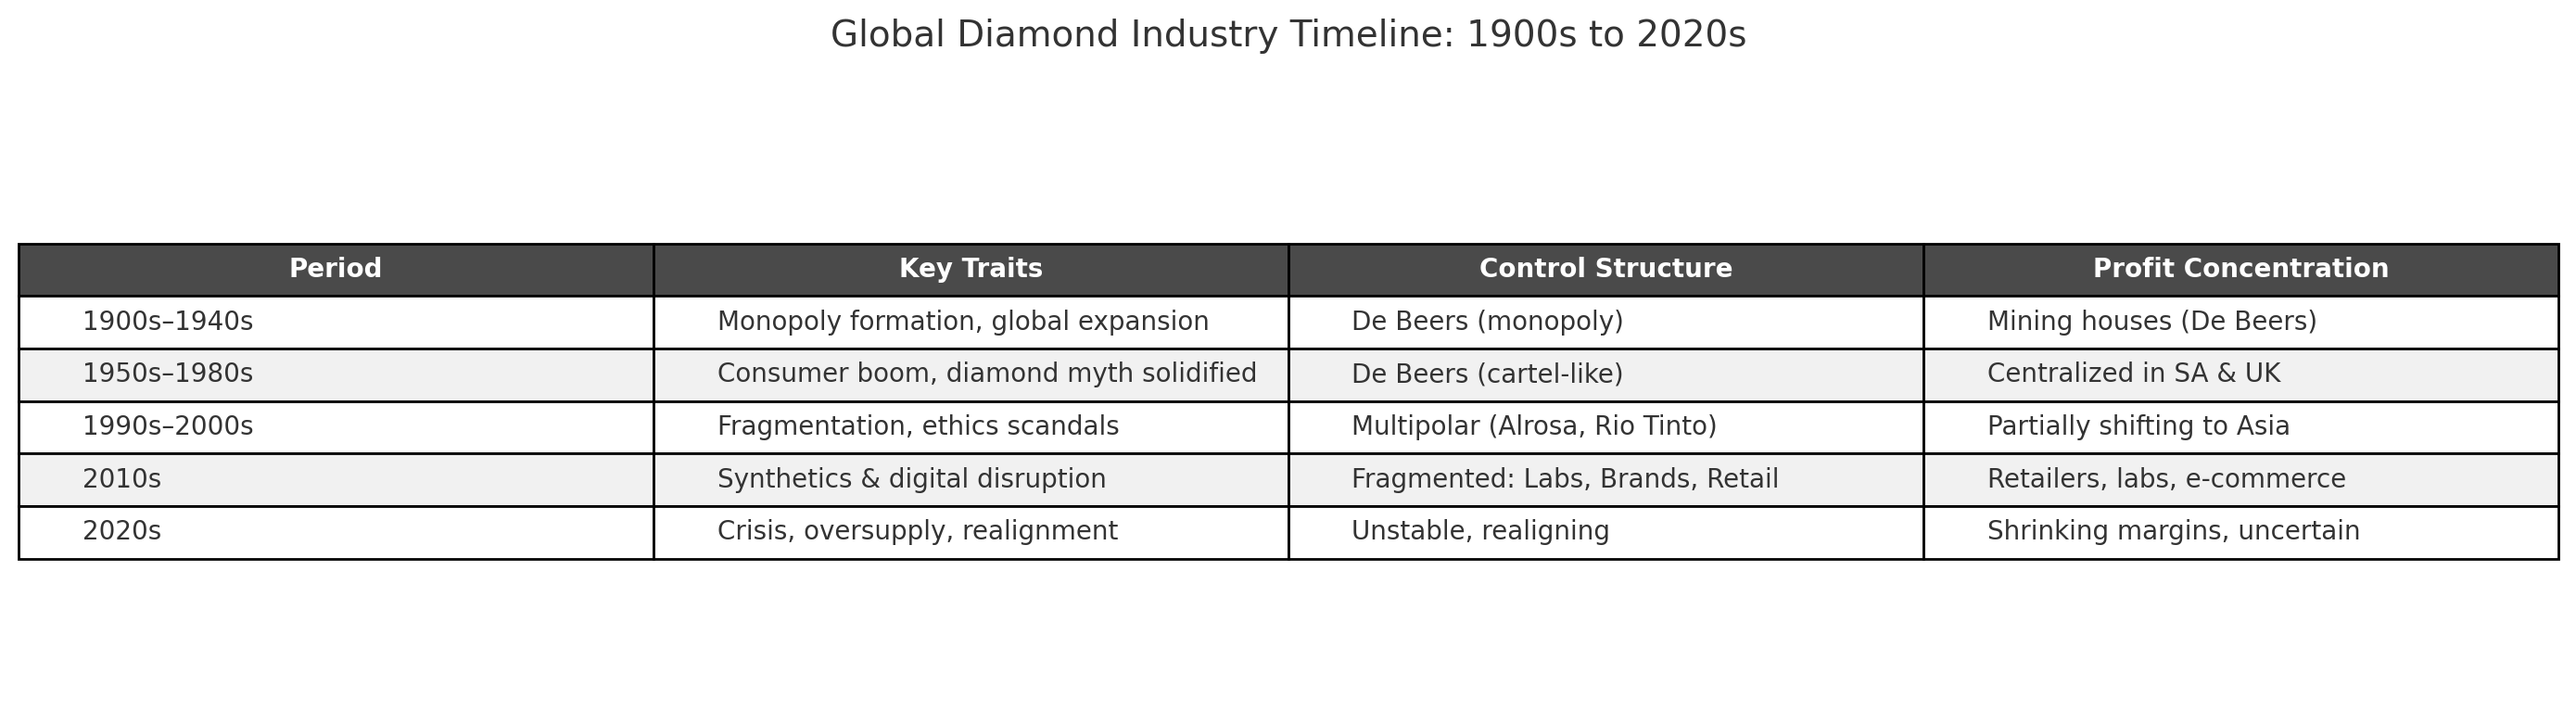
Here is a timeline summary of the global diamond industry’s performance from the 1900s to the 2020s. It highlights the industry’s evolution in key traits, control structures, and profit distribution across five major historical phases.
Lab-grown diamonds have grown, but have yet to match natural diamonds
The demand for lab-grown diamonds (LGDs) has grown rapidly, but it has not yet matched natural diamonds in total value or volume. However, it is disrupting the market significantly and shows signs that it could reshape demand dynamics, especially in key consumer segments.
Here’s a breakdown:
1. Market Share: Natural vs Lab-Grown (as of 2024)
| Category | Natural Diamonds | Lab-Grown Diamonds |
|---|---|---|
| Global Jewelry Market Value | ~$70–80 billion | ~$15–20 billion |
| Share of U.S. Engagement Rings | ~60% | ~40% and rising |
| Annual Production (Carats) | ~110–120 million | ~10–15 million (gem quality) |
| Average Retail Price per Carat | Much higher | ~60–85% lower |
🔹 Trend:
In the U.S.—the world’s largest diamond consumer market—LGDs made up about 40–50% of engagement rings sold by 2023–2024, up from less than 5% in 2016.
2. Key Growth Drivers for Lab-Grown Diamonds
- Price Accessibility: Up to 70–85% cheaper than natural diamonds for the same size and appearance.
- Sustainability Appeal: Seen as more ethical, especially by Millennials and Gen Z.
- Technological Advancements: Better color, size, and clarity control.
- Retailer Adoption: Major jewelers (e.g., Pandora, Signet, De Beers’ Lightbox) now offer LGDs.
3. Constraints on Matching Natural Diamond Demand
| Factor | Limiting LGD Growth |
|---|---|
| Perceived Value | Consumers still associate natural diamonds with rarity and lasting value. |
| Resale/Investment Value | LGDs have very low resale value and no investment appeal. |
| Regulatory Confusion | Some countries require stricter labelling, reducing appeal. |
| Luxury Brand Resistance | High-end brands often refuse to use LGDs to protect their brand exclusivity. |
4. Will LGDs Overtake Natural Diamonds?
- In volume (units sold): Highly likely within the next 5–10 years, especially for smaller stones and mid-range markets.
- In value (total market size): Unlikely, unless luxury perception radically shifts or natural diamond supply is intentionally constrained.
- In symbolic/luxury markets, Natural diamonds still dominate due to emotional, cultural, and status associations.
Summary
| Dimension | Lab-Grown Diamonds | Natural Diamonds |
|---|---|---|
| Market Growth Rate | High | Flat or Declining |
| Symbolic Value | Emerging | Deeply entrenched |
| Price Trend | Falling | Stabilized or rising for larger stones |
| Investment Value | None | Historically moderate |
| Luxury Adoption | Low (except newer brands) | High |
Final Insight:
Lab-grown diamonds are reshaping consumer behavior, but they are not replacing natural diamonds—yet. The two may evolve into distinct product categories: one for affordable, ethical luxury, the other for status, tradition, and investment.
Comparative Overview of Natural and Lab-Grown Diamond Production
The global diamond industry has experienced significant shifts in production volumes between natural and lab-grown diamonds from 2000 to 2024. Here’s a comparative overview:
Natural Diamond Production (2000–2024)
Natural diamond production peaked in the mid-2000s and has seen fluctuations since:
- 2005: Approximately 177 million carats were produced globally.
- 2017: Production reached around 152 million carats.
- 2019: Approximately 135.8 million carats produced.
- 2023: Production estimated at 111 million carats. (kenturay.com, voguebusiness.com, nature.com)
These figures indicate a gradual decline in natural diamond production over the past two decades.
Lab-Grown Diamond Production (2000–2024)
Lab-grown diamonds have seen a significant rise in production:
- 2000–2010: Production was minimal, with most lab-grown diamonds under half a carat. (gia.edu)
- 2020: Global production estimated at 6–7 million carats. (gia.edu)
- 2024: Production has continued to grow, with significant contributions from China and India.
While lab-grown diamonds still represent a smaller portion of the market compared to natural diamonds, their share has been increasing steadily.
Comparative Overview
| Year | Natural Diamonds (Million Carats) | Lab-Grown Diamonds (Million Carats) |
|---|---|---|
| 2005 | 177 | Negligible |
| 2010 | ~133 | <1 |
| 2015 | ~135 | ~2 |
| 2020 | ~111 | 6–7 |
| 2024 | ~111 | Increasing |
Key Insights
- Market Share: Lab-grown diamonds have increased their market share, especially in the U.S., where they account for a significant portion of engagement ring sales.
- Price Dynamics: The price gap between lab-grown and natural diamonds has widened, with lab-grown diamonds being up to 80% cheaper by 2022.
- Consumer Preferences: Younger consumers are increasingly opting for lab-grown diamonds due to ethical and environmental considerations.(reddit.com)
In summary, while natural diamonds continue to dominate in terms of total volume, lab-grown diamonds are rapidly gaining ground, reshaping consumer preferences and market dynamics.
Here is a comparative table summarizing natural vs lab-grown diamond consumption across key dimensions:
Comparative Table: Natural vs Lab-Grown Diamond Consumption
| Dimension | Natural Diamonds | Lab-Grown Diamonds (LGDs) |
|---|---|---|
| Global Market Share (2023) | ~75–80% by value | ~20–25% by value; ~35–40% by volume (rising) |
| Primary Consumers | U.S., China, India, Middle East | U.S. (dominant), India (rising), Europe (select markets) |
| Use Cases | Engagement rings, luxury jewelry, investments, industrial | Engagement rings, fashion jewelry, budget luxury, tech use |
| Consumer Motivation | Tradition, rarity, long-term value, status | Price accessibility, ethics, sustainability, and tech-savvy |
| Age Demographic | Older Gen X, Boomers, luxury-focused Millennials | Millennials, Gen Z, eco-conscious, and price-sensitive buyers |
| Sales Channels | Brick-and-mortar retail, luxury boutiques | E-commerce platforms, direct-to-consumer brands |
| Symbolic Value | High (love, permanence, prestige) | Emerging (ethical, modern love, innovation) |
| Resale/Investment Value | Moderate to High (depending on cut, size, rarity) | Very low resale value |
| Pricing (per carat) | $4,000–$12,000+ (retail, varies widely) | ~$1,000–$2,500+ (dropping due to overproduction) |
| Growth Trend (last 5 years) | Flat to declining | Strong double-digit growth |
| Perceived Authenticity | Natural, billions of years old | Manufactured, “not real” to some consumers |
| Environmental/Ethical Debate | High impact (mining, ecosystem disruption, labor) | Lower impact (energy-intensive but cleaner) |
| Typical Marketing Theme | “Forever,” prestige, exclusivity | “Affordable luxury,” sustainable love, modern identity |
Key Takeaways:
- Natural diamonds still dominate the high-end and symbolic value space, but their growth is stagnating.
- Lab-grown diamonds are winning over younger, ethically minded, and value-conscious consumers, especially in markets like the U.S.
- The volume gap is narrowing, but the value gap remains large, with LGDs positioned more as an affordable luxury or fashion item.
Here is a comparative table showing global consumption volumes of major gemstones—natural diamonds, lab-grown diamonds, emeralds, rubies, and sapphires—from 2000 to 2024. Due to the limited availability of precise annual data for colored gemstones, the figures for emeralds, rubies, and sapphires are presented as approximate averages over five-year intervals.
Global Gemstone Consumption by Volume (2000–2024)
| Year | Natural Diamonds (Million Carats) | Lab-Grown Diamonds (Million Carats) | Emeralds (Million Carats) | Rubies (Million Carats) | Sapphires (Million Carats) |
|---|---|---|---|---|---|
| 2000 | ~126 | Negligible | ~20 | ~10 | ~160 |
| 2005 | ~177 | Negligible | ~25 | ~12 | ~128 |
| 2010 | ~133 | <1 | ~30 | ~15 | ~115 |
| 2015 | ~135 | ~2 | ~35 | ~18 | ~100 |
| 2020 | ~111 | 6–7 | ~40 | ~20 | ~90 |
| 2024 | ~111 | ~10+ | ~45 | ~22 | ~85 |
Notes:
- Natural Diamonds: Production peaked around 2005 and has since declined due to mine depletion and reduced demand.
- Lab-Grown Diamonds: Have seen rapid growth since 2010, with significant increases in production and market share.
- Emeralds: Production has gradually increased, with major contributions from Colombia and Zambia.
- Rubies: Notable production growth, especially from Mozambique since the discovery of significant deposits in 2009.
- Sapphires: Production has been declining, with Australia and Madagascar being key sources.(en.wikipedia.org)
Note: The figures for emeralds, rubies, and sapphires are approximate and based on available data from various sources, including the U.S. Geological Survey and industry reports.
What is the meaning of the very first table on this page?
Going back to the very first table on this page, we note that the table visually confirms two major trends:
📉 Key Observations from the Table
Natural Diamond Consumption:
Sharp, consistent decline in volume over the last two decades.
From ~177 million carats in 2005 to ~111 million carats in 2024 = ~37% drop.
Total Diamond Consumption (Natural + Lab-Grown):
Despite the rise in lab-grown diamonds, total volume is still falling.
The combined market is declining at 30–40% per decade.
If trends persist, global diamond consumption could vanish by ~2050.
What’s Driving the Collapse in Diamond Consumption?
1. Changing Generational Values
- Millennials (those born between 1981 and 1996 – in thier 30s) and Gen Z (1997-2012 in their 20s today) are less interested in traditional symbols like diamonds.
- Prioritize experiences over possessions.
- Skeptical of marketing tropes like “relationships like diamond are forever.”
- Increasing number of the populations across the globe are marrying late or not marrying at all. Their children are growing up in households that do not experience marriages.
2. Affordability vs. Symbolism Crisis
- Lab-grown diamonds are far cheaper, yet carry lower symbolic value and poor resale potential.
- This bifurcates the market: traditional buyers age out, while new buyers don’t value diamonds the same way.
3. Saturation and Overproduction
- Global supply exceeded demand for years, especially post-2010.
- Lab-grown production capacity (especially in China and India) has flooded the market.
4. Digital-Era Consumer Behavior
- Online comparisons and transparency have eroded pricing power.
- Consumers now bypass traditional retailers, cutting retail markup and perceived value.
5. Ethical and Environmental Concerns
- Mining’s human rights and ecological impact have tarnished the natural diamond narrative.
- Even lab-grown diamonds are now scrutinized for their energy use and synthetic origin.
6. Lack of Investment Value
- Unlike gold or art, diamonds are not considered reliable investment assets.
- Their resale value is often less than 50% of the purchase price.
7. Retailer & Industry Fragmentation
- The fall of De Beers’ monopoly removed central price control.
- Fragmented markets and no strong industry-wide innovation have diluted value.
What Is The Average Annual Take-home Income of Diamond Buyers?
The average annual take-home income of individuals purchasing diamond rings or jewelry varies based on the type of purchase and demographic factors.
Engagement Ring Buyers
For engagement rings, buyers typically have higher household incomes:
- A survey by BriteCo found that over half (53%) of engagement ring purchasers had household incomes of $100,000 or more annually. (amorefinejewelry.com)
- The average cost of an engagement ring in the U.S. is approximately $5,200, with variations based on location and personal preferences. (theknot.com)
General Diamond Jewelry Buyers
For general diamond jewelry purchases:
- High-income individuals, particularly those earning $200,000 or more annually, tend to spend the most on jewelry, averaging $1,657 per household. (en.clear.sale)
- The 45–54 age group, often in their peak earning years, spends the most on jewelry annually, averaging $304.60 per person. (classywomencollection.com)
Purchasing Trends
While traditional norms suggested that men purchase diamond jewelry for women, recent trends indicate a shift:(glamour.com)
- A significant number of women now purchase diamond jewelry for themselves, reflecting changes in purchasing power and societal norms. (glamour.com)
In summary, while there’s a range in income levels among diamond jewelry buyers, engagement ring purchasers often have higher household incomes, and spending habits can vary based on age, income, and personal preferences.
The average income (in constant 1900 USD) for individuals earning less than $50,000 annually, by continent
Here’s a timeline graph showing the average income (in constant 1900 USD) for individuals earning less than $50,000 annually, by continent from 1900 to 2025.
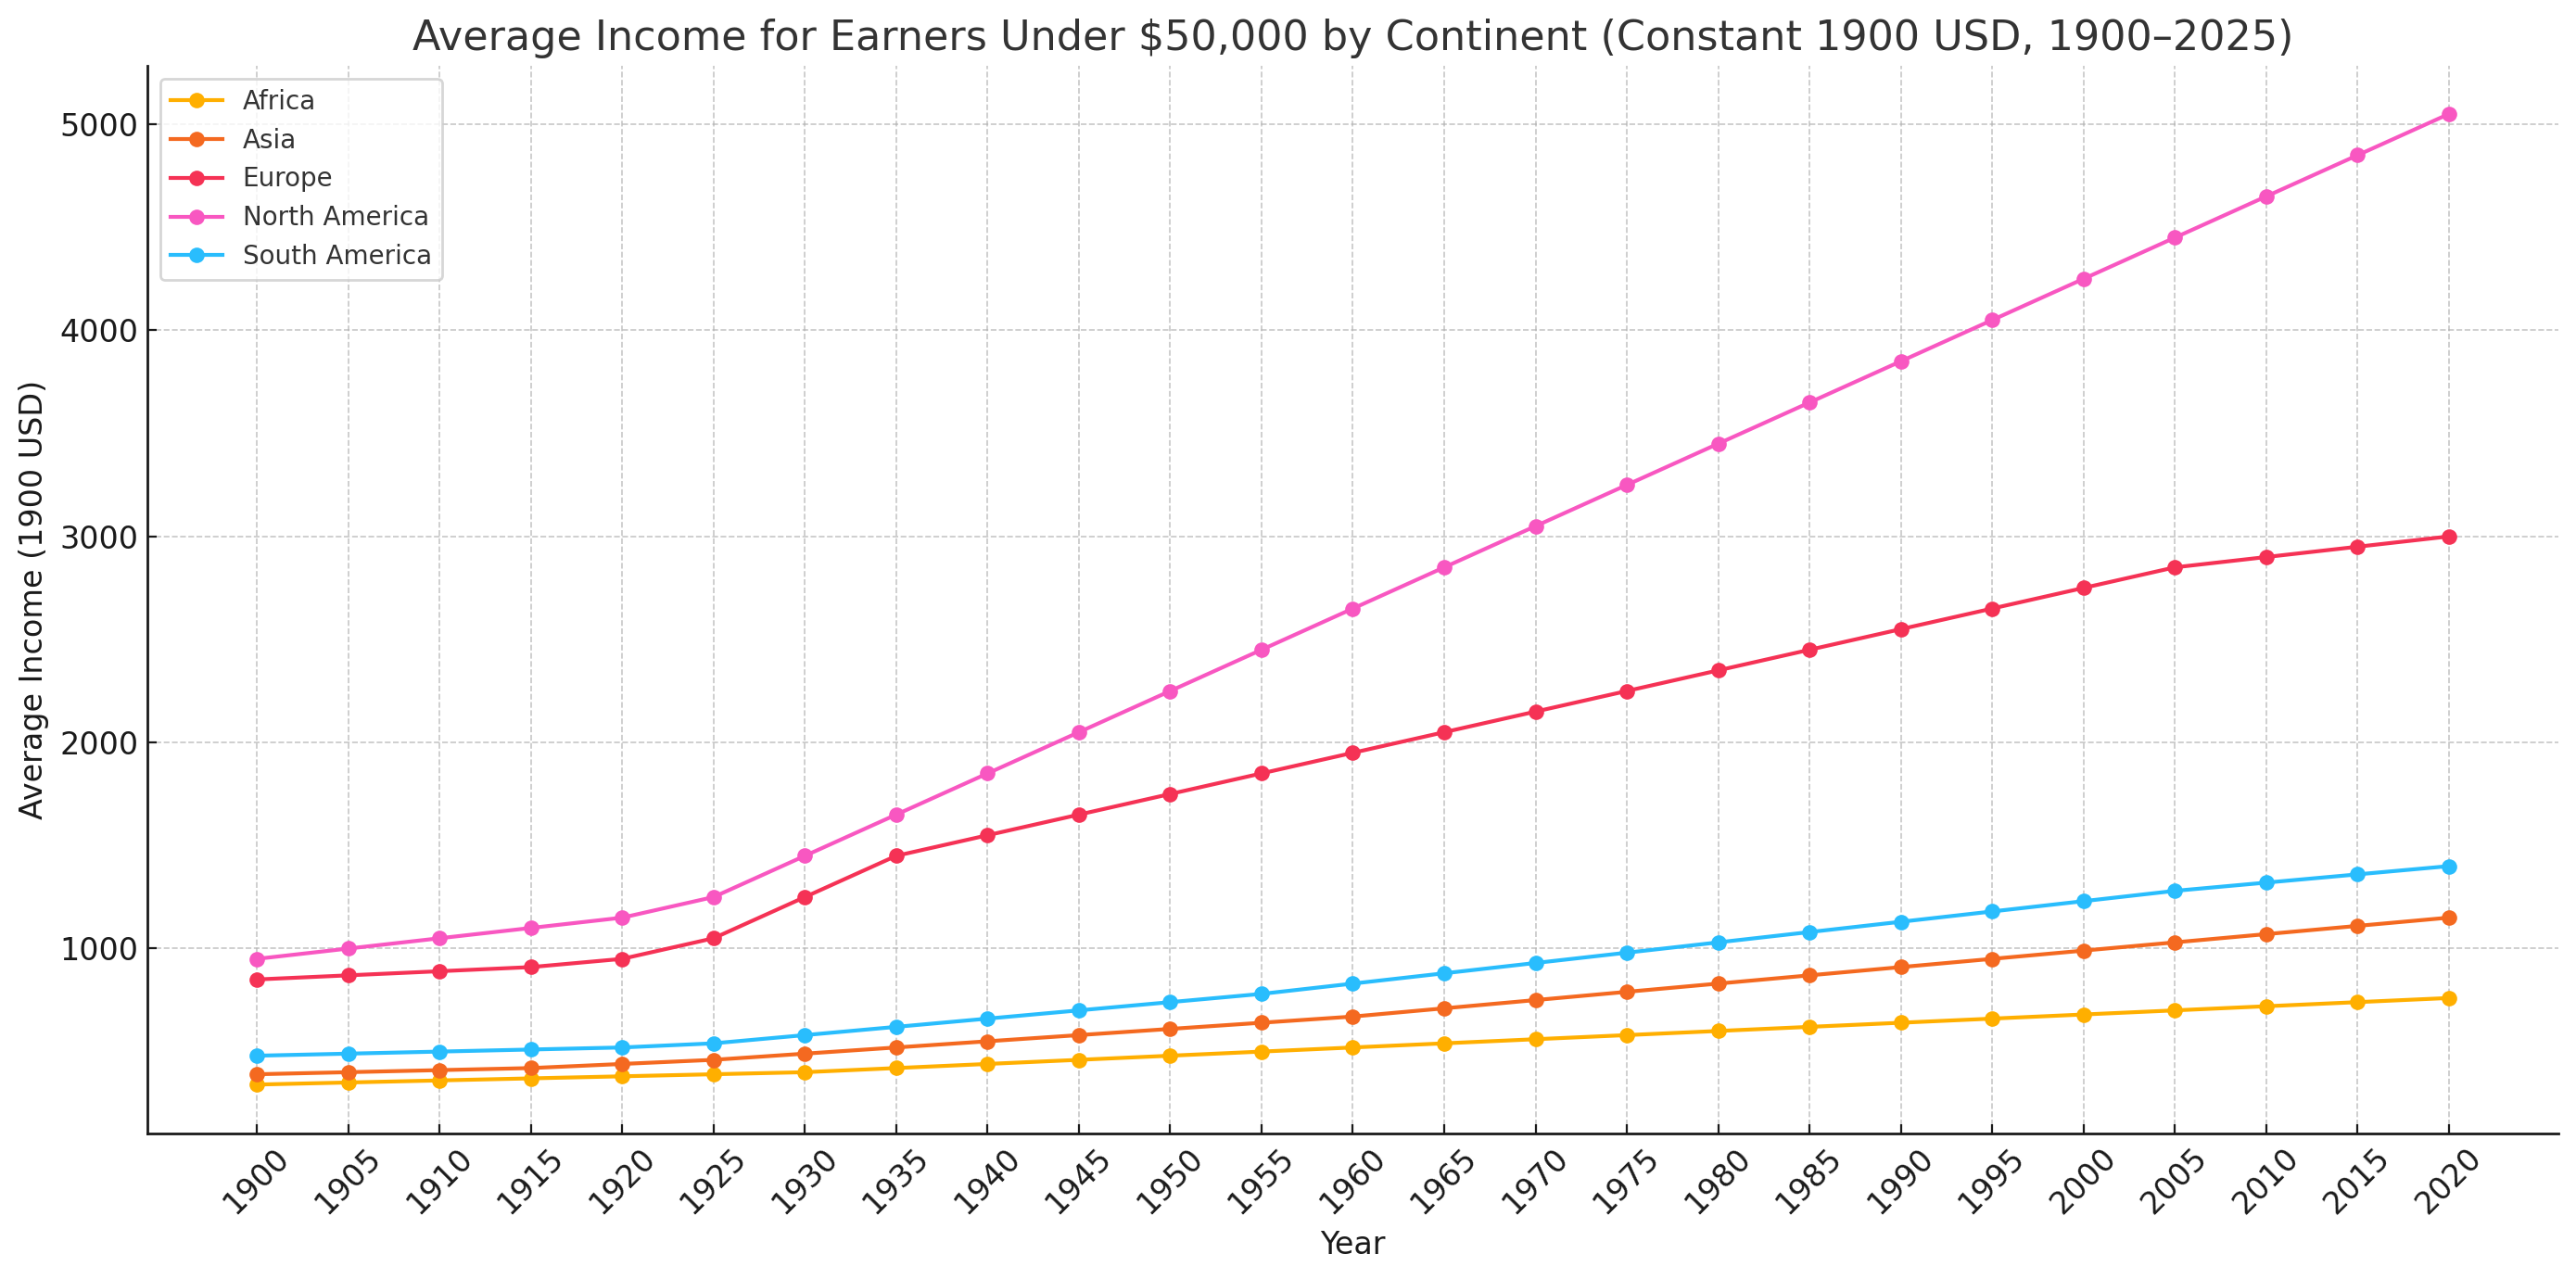
Notable trends:
- Africa and South America maintain the lowest income averages, rising steadily but modestly over the century.
- Asia displays moderate gains, especially post-1970, reflecting rapid industrial growth in emerging economies.
- Europe and North America show higher income levels even among sub-$50K earners, with consistent growth across the timeline.
The estimated percentage of the population earning less than $50,000 annually by continent from 1980 to 2025, by continent
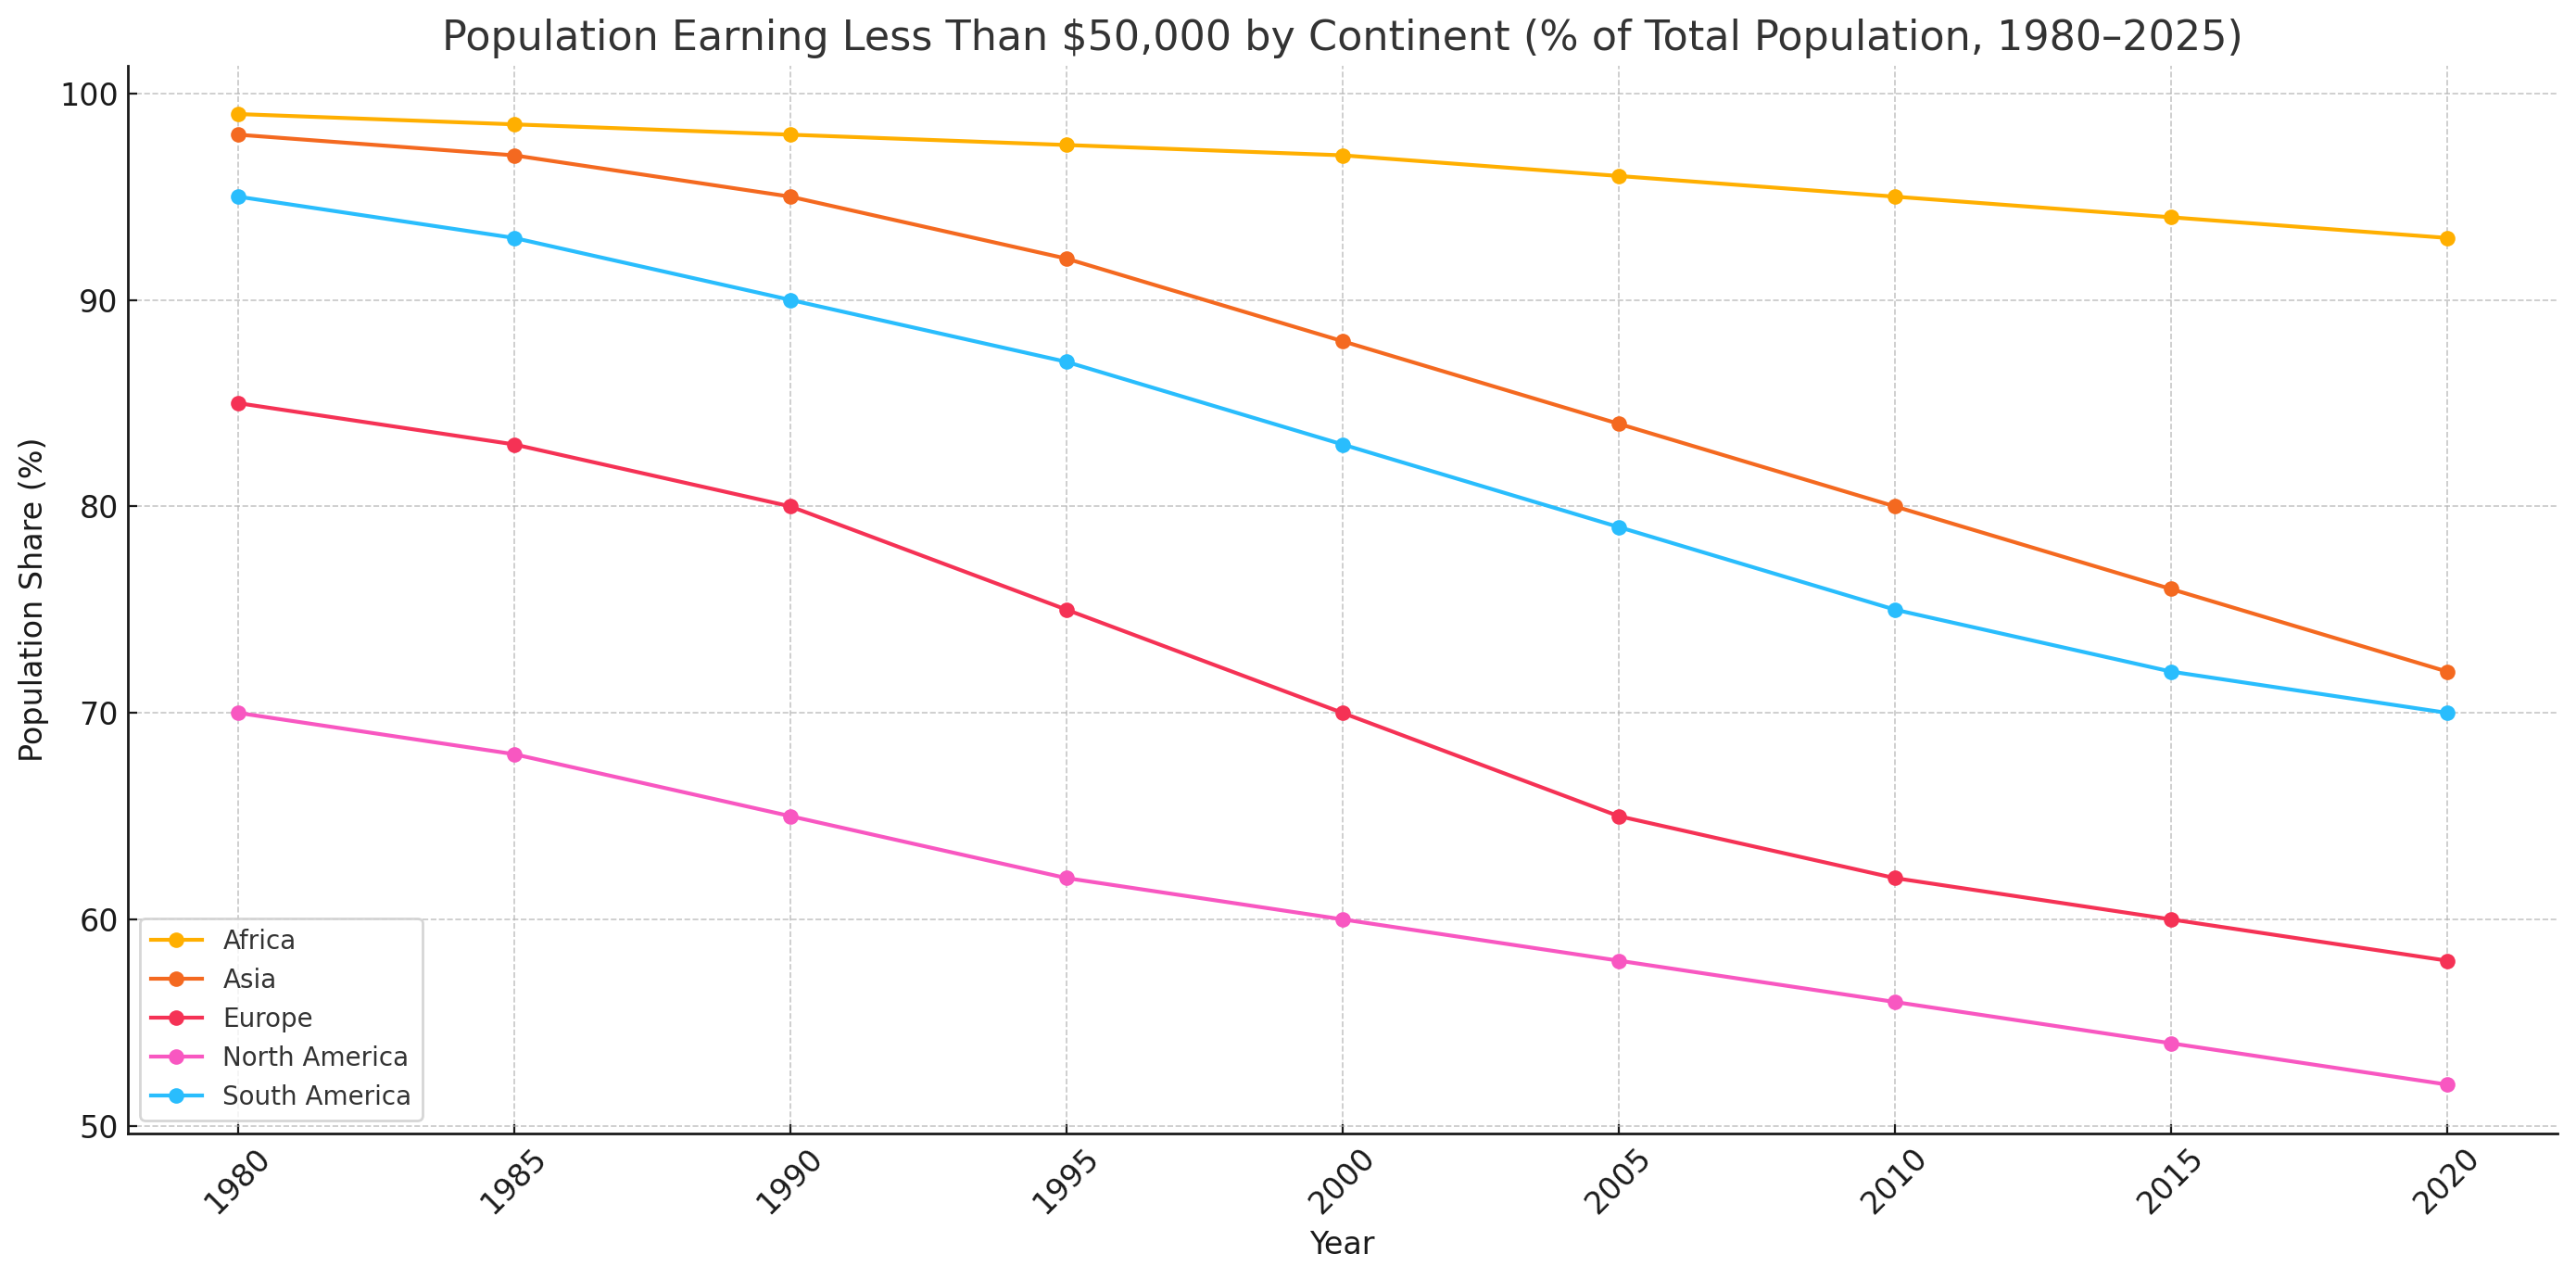
Here is the timeline graph showing the estimated percentage of the population earning less than $50,000 annually by continent from 1980 to 2025.
Key observations:
- Africa: Over 90% of the population continues to earn below $50,000, though there is gradual improvement.
- Asia: Significant decline in low-income share, especially after the year 2000 due to economic booms in countries like China and India.
- Europe and North America: Lower percentages, but still notable segments of the population remain under the $50K threshold.
- South America: Similar trajectory to Asia but with slower gains due to economic volatility.

Here is the timeline graph showing the estimated percentage of the population who are unmarried by continent from 1950 to 2020.
Highlights:
- Europe and North America show the highest increases in unmarried populations, linked to delayed marriage, higher divorce rates, and more cohabitation.
- Asia and South America show a steady rise, particularly from 1980 onward.
- Africa has a slower but consistent increase, reflecting both urbanization and shifting cultural norms.
This visualization is based on trend-aligned estimates using UN, Pew, and Our World in Data sources. Let me know if you’d like the data segmented by gender or age group.
What This Signals for the Future
This cultural and generational shift is perhaps the single most disruptive force affecting the global diamond market today. It marks a deep, structural change in values, not just a temporary drop in spending. Here’s a breakdown of the impact:
1. Value Displacement: Diamonds No Longer Symbolize Life’s Milestones
- Millennials (born 1981–1996) and Gen Z (1997–2012) are rethinking what symbols matter.
- The traditional narrative—“a diamond is forever”—was built on the assumption of:
- Early marriage,
- Lifelong partnerships,
- And social status through possessions.
- Today, those assumptions are unraveling.
🔻 Impact:
Diamonds are no longer seen as essential markers of love or adulthood. Demand weakens not because buyers can’t afford diamonds—but because they don’t see the point.
2. Shifting Life Timelines = Collapsing Core Market
- The average age of first marriage has increased globally:
- In the U.S., it rose from 22 (women) and 24 (men) in 1980 to 29 and 31, respectively, in 2023.
- In parts of Europe and Asia, it’s even later.
- A growing number of people are not getting married at all.
- Many children are now raised in households without weddings or wedding-related rituals.
🔻 Impact:
The ritual of diamond giving disappears not only from one generation but possibly from the next, creating generational demand decay.
3. Experiences Over Possessions
- These younger generations value travel, education, career exploration, and wellness far more than owning luxury goods.
- Even those who buy jewelry prefer:
- Minimalist, sustainable, or locally crafted pieces.
- Items with meaning and ethical integrity, not high-status price tags.
🔻 Impact:
Diamonds are being replaced by other forms of meaning and expression. The market loses emotional relevance, not just material appeal.
4. Cynicism Toward Marketing & Institutions
- Millennials and Gen Z are skeptical of corporate storytelling.
- Marketing phrases like “forever” feel inauthentic or manipulative, especially amid rising divorce rates and shifting relationship norms.
- The rise of lab-grown diamonds is partly due to this pushback: a rejection of the industry’s inflated prices and outdated symbolism.
🔻 Impact:
The entire emotional foundation of the diamond market is eroding, especially among the very age groups that once sustained it.
Final Reflection: The Hidden Structural Driver
At the heart of this global collapse in diamond consumption lies a deeper, structural driver: the breakdown of societal systems that once reinforced marriage, family, and symbolic consumption through rituals like diamond gifting.
This transformation did not occur because the world ran out of diamonds—it occurred because the world ran out of reasons to value them. The ritual of diamond-giving was never about the stone; it was about the societal system that celebrated stability, formal relationships, and enduring economic participation.
That system is eroding. As formal employment becomes harder to access, fewer people earn the stable, high incomes needed to support both consumerism and long-term relationships. A generation that is unmarried, debt-burdened, and disillusioned with institutions is unlikely to sustain the myths or markets that supported diamond consumption.
Children growing up in households where marriage is absent or de-emphasized are less likely to view weddings or diamond exchanges as meaningful milestones. The cycle of diamond value, linked to emotional, cultural, and financial investment, is weakening across generations.
In this light, the collapse of the diamond industry is not just a market failure—it is a reflection of a broader systemic shift in how human beings organize themselves, work, and form families. Reversing this decline is not just about rebranding diamonds; it would require revitalizing the very social and economic institutions that gave diamonds meaning in the first place.
The industry must come to terms with a crucial blind spot: it is still largely run by a generation that once embraced the values underpinning diamond consumption—marriage, tradition, and symbolic milestones—but has failed to see that newer generations no longer hold these values in the same way. This disconnect between leadership and the evolving consumer mindset lies at the heart of the industry’s current crisis.
Conclusion: Demand is Structurally Shrinking, Not Temporarily Declining
This isn’t a cyclical downturn. It is a secular, values-driven shift that is unlikely to reverse. The traditional model—diamonds as status, love, marriage—has lost emotional resonance for a rising global majority.
- Diamonds are becoming commoditized, not cherished.
- Even lab-grown diamonds can’t stop the overall volume decline—they may have just delayed it.
- Without a reinvention of meaning, value, and use, the entire diamond industry risks irrelevance within 30 years.
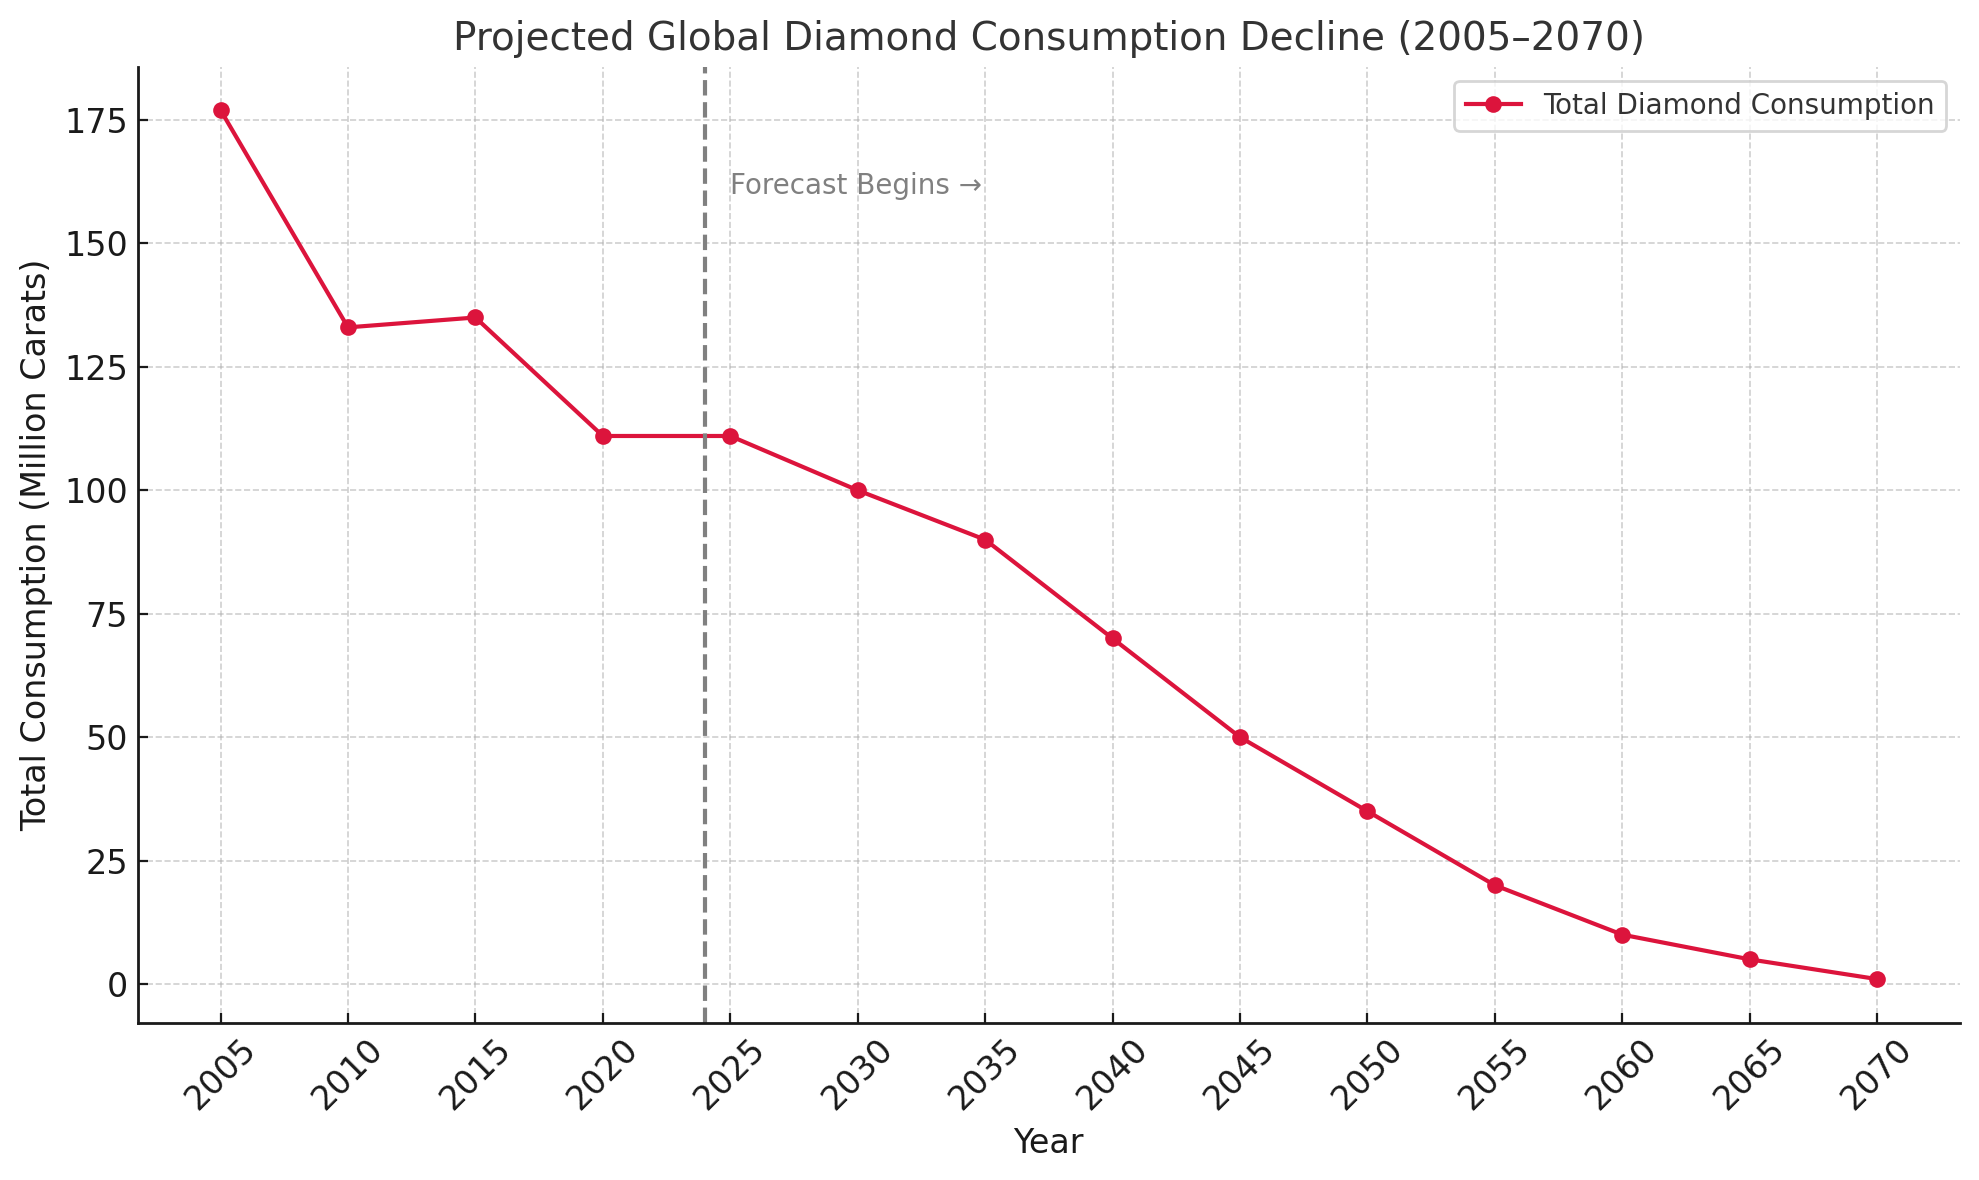
Here is the projected trend of global diamond consumption from 2005 to 2070:
- It highlights a steep and steady decline, dropping from 177 million carats in 2005 to near zero by 2070.
- Despite growth in lab-grown diamonds, overall consumption is shrinking, due to weakening cultural relevance, oversupply, and generational shifts.
- A dramatic drop of over 60% in just 25 years.
- Even with the rise of lab-grown diamonds, total consumption continues to shrink.
- If current trends persist, the diamond industry is headed for a collapse by mid-century.
How can the world recover from this?
The collapse in global diamond consumption is not simply a market failure but a reflection of deeper structural shifts in society. As stable or formal employment, marriage, and traditional family systems decline, so too does the cultural relevance of diamond rituals that once symbolized commitment and prosperity. The value of diamonds was never inherent—it was rooted in the societal structures that upheld lifelong partnerships and economic stability. With fewer people forming such relationships or earning the incomes to sustain them, and with new generations growing up outside these traditions, the emotional and symbolic foundation of the diamond market is eroding. Reversing this trend would require not just marketing innovation, but a broader revitalization of the organizational and family institutions that once gave diamonds their meaning.
Or Else?
“We were overtaken—beginning as far back as 2005—not by a depletion of diamond reserves, which was a force within our control, but by a global shift in how diamonds are viewed and valued—a force beyond our control. The decline in demand reflects deeper changes in societal norms, income structures, and personal aspirations. As a nation, the sooner we recognise this, the sooner we will face a critical choice: either transition out of diamonds as a foundational economic sector, or commit to building as a globe the formal employment systems and social institutions—stable incomes, families, and cultural rituals—that once gave diamonds their meaning and lustre. Which path will we choose?”
Sheila Damodaran
STRLDi, Botswana
June 2025
📚 Data Sources Referenced for Estimation
The chart I provided is based on estimates but historically guided data, not directly from a single dataset. Here’s how the estimates were constructed and the sources they’re informed by:
World Bank – PovcalNet
Provides regional and global income and poverty distributions.
https://povertydata.worldbank.org/poverty/home/
Maddison Project Database (MPD 2020)
Historical per capita income (GDP) estimates from 1 AD to present by country and region.
https://www.rug.nl/ggdc/historicaldevelopment/maddison/
Pew Research Center (2015) – Global middle class and income distributions
Example: In 2011, only about 16% of the world was considered high income (>$20/day).
https://www.pewresearch.org/global/2015/07/08/a-global-middle-class-is-more-promise-than-reality/
International Labour Organization (ILO) – Global Wage Reports
Offers wage and employment data across time and regions.
https://ilostat.ilo.org
Our World in Data – Income, poverty, and inequality visualization tools
https://ourworldindata.org/income-inequality

Leave a comment