In Cereal, Horticulture & Meat Production
Early Signals, Not Yet a Systemic Map
We do not yet have access to the extensive national data collection that underpinned the unemployment study. However, we have identified substantive datasets for Botswana and the region through FAOStats, which form a solid initial foundation. Using these, we are currently developing a case study to examine these dynamics at a global scale.
That said, the work would benefit significantly from deeper, locally anchored data. I would strongly welcome the opportunity for the Ministry to co-lead in organizing the data infrastructure. The region, more broadly, could also participate in strengthening the infrastructure. This is needed to support a systems thinking inquiry of this kind. Such collaboration would bring greater analytical depth. It would also ensure national and regional ownership of the insights that emerge.
At this point, our thinking is guided by what is publicly available through internet-based searches. While this has allowed us to outline key directions, we are acutely aware of the limitations. For that reason, I ask that you handle this information with professional discretion. Please do so until we are in a position to confirm and consolidate findings more robustly.
A distinctive aspect of our approach to systemic mapping is its ability to trace causal influences. It does this both at a specific point in time, but importantly, also traces these influences across time. This allows us to surface structural patterns. These include feedback loops, delays, and reinforcing behaviors. Such patterns often underpin not just the problem, but its persistence. We can begin this work with 20-year datasets. However, having a longer time series makes the causal structure more robust. This long-view perspective is especially important for policymakers seeking interventions that are not only responsive but also transformative.
Introduction
If the stories and explanations we’ve been using haven’t helped solve the problem, it’s time to take a step back. We need to ask new questions. Sometimes, we need to look deeper—or in entirely new directions—to find what’s really going on. Only then can we start telling a new story, one that brings real and lasting change.
**“We may not control the weather with the press of a button—but we are already influencing it, profoundly. The systems we built to extract water have altered rainfall patterns. This includes deforestation, exposed-field farming, and over-irrigation. These actions have weakened the water cycle. The question isn’t whether human action affects weather; it’s how we choose to act.
When we start to treat water as a partner, we create landscapes that invite rain. It’s not just a resource. Moist soils, living roots, and transpiring plants cool the land, seed clouds, and stabilize local climates. It’s not about control—it’s about cooperation with the natural systems we depend on.”**
— Adapted for regenerative agriculture and water cycle resilience messaging
What Nature Speaks: Rethinking Water Use and Agriculture in Botswana – Summary
- High water use, low returns: Botswana’s agriculture consumes large volumes of water but contributes minimally to GDP.
- Cereal crops as a key outlier: While beef and horticulture align with global water-use norms, cereal crops are often drought-resistant. However, they use far more water and have lower productivity.
- Not poor practice, but environmental exposure: The inefficiency stems from exposed-field farming in a semi-arid climate, leading to extreme evaporation.
- Drought-resistance as a false solution: Over-reliance on drought-tolerant crops may suppress transpiration, disrupt rainfall cycles, and accelerate land degradation.
- Yields and GDP suffer: Reduced rainfall and deteriorating soils weaken crop yields and reinforce the sector’s underperformance.
- A call to ecological cooperation: The article urges a shift from controlling nature to partnering with it through regenerative practices.
- Time to reintroduce water-cycle crops: Non-drought crops—especially horticultural varieties—can cool the land, restore rainfall patterns, and build resilience.
- Toward a regenerative future: By designing agriculture to regenerate rather than extract, Botswana can improve climate stability. It can also boost productivity and enhance long-term economic contribution.


🔁 From Efficiency to Regeneration: Rethinking Water Use and Crop Strategy in Botswana
Dr. Rasbash’s analysis in “Thirsty Farms, Empty Returns” The Gazette, 28 May, 2025 (pg 24) highlights a critical issue. Botswana uses a lot of agricultural water. However, it experiences low economic returns.
We, like Dr Rasbash, noticed a significant deviation in water consumption per tonne of agricultural produce in Botswana. This is evident when compared to global benchmarks (for details refer to Part III below). The most striking difference, however, is in cereal production. Beef is the most water-intensive product. However, both beef and horticultural crops show water usage broadly comparable to international standards. Cereal crops, on the other hand, diverge sharply.
If so, this discrepancy may not be a reflection of poor farming practices, inefficient irrigation, or crop selection per se. Rather, it stems from the environmental context in which these crops are grown. Unlike horticultural crops, cereals in Botswana are typically cultivated in open fields without protective cover. The country’s semi-arid to arid climate causes a substantial loss of applied water due to evaporation. For details refer to: Comparison of Average Annual Evaporation by Climate Zones in Part III below. High solar radiation and ambient heat drive this evaporation process.
This insight now invites us to go beyond technical adjustments. It compels us to ask deeper questions:
What keeps the sector from understanding inefficiencies despite repeated episodes of the issue?
The answer may lie in the assumptions we’ve internalized about what defines “productive” agriculture in dryland conditions.
Rainfall cycles and cooler climates are supported by vegetation that actively contributes to transpiration. These plants boost atmospheric moisture. These traits are less common in drought-resistant crops (for details, refer to Part I below). By designing agricultural systems that collaborate with natural water cycles, Botswana can enhance resilience. These systems work with nature. They do not resist it. (For details on the consequences of resisting it, refer to Part II below). This approach allows Botswana to move toward climate-resilient productivity and long-term food security.
Too often, agricultural solutions default to scaling up drought-resistant crops—an understandable and technically sound response to erratic rainfall. However, this approach risks masking a deeper systemic challenge. While drought-resistant crops will buy us time, they cannot reverse the underlying drivers of desertification. Nor can they rebuild climate resilience if soil health continues to decline and vegetation cover is reduced. These conditions weaken the land’s capacity to retain water. They disrupt critical feedback loops in the water cycle. This disruption ultimately contributes to declining yields. It also fosters the perception that agriculture underperforms in driving national GDP.
Crops that promote transpiration and atmospheric moisture, on the other hand, include many horticultural varieties. These crops will initially require time to re-establish after years of disuse. However, they offer long-term potential to help restore local rainfall cycles and moderate surface temperatures. When grown under protective systems and supported by regenerative practices, they:
- Improve soil structure and organic matter to retain moisture,
- Reduce surface temperatures through better vegetative cover,
- Ultimately lead to fewer heatwaves and more stable growing conditions leading to better yields and more stable climates.
- Enhance transpiration, which supports cloud formation and rainfall,
This is not just a shift in crop choice. It is a recalibration of agriculture’s role. The focus is changing from resisting climate change to regenerating the conditions that make farming viable in the first place.
Instead, we should view agriculture as a partner in the water cycle, not just a consumer of it.
It’s true—we cannot “control” the weather in the way we control machines or systems with switches and dials. But we’re already influencing it, profoundly—just not always with awareness or intention. The very technologies and land-use systems we designed to maximize extraction have altered rainfall patterns. This occurs through deforestation, large-scale irrigation, or monocropping. They have also increased surface temperatures and weakened the water cycle.
The question is not whether human action affects the weather—it clearly does. The question is how we choose to act.
Think of it like a forest. No single tree controls the climate, but together, their presence regulates humidity, encourages rainfall, moderates temperature, and stabilizes soil. Likewise, agriculture, land cover, and soil practices can act like an ecological switchboard.
We see measurable improvements when we treat water as a partner in productivity. It’s not just a resource to be extracted. Moist soils reduce land temperatures. Vegetation increases transpiration, which adds moisture to the air. This feedback is slow, subtle, and cumulative. They are real and supported by growing evidence in agroecology, climate science, and satellite data.
We may not press a button to make it rain tomorrow. However, we can build landscapes that invite rainfall over the seasons. In doing so, we move from technological control to ecological cooperation—from managing components to designing for outcomes.
Without this shift, efforts at water efficiency—however well-intentioned—may end up reinforcing the vulnerabilities they aim to fix.
“Efficiency without regeneration risks accelerating the very vulnerabilities we aim to overcome.”
Ultimately, this calls for a paradigm shift. We need to move from maximizing extraction to optimizing contribution. Land, water, and communities should be healthier each season than the last. Botswana’s agricultural strategy must evolve from technical reform to systemic redesign, aligning with ecological processes rather than resisting them.
PART I
The Impact of Crops That Transpire Less
Crops that transpire less can significantly alter the local and regional water cycle, especially when adopted widely across a landscape. Here’s a breakdown of the key impacts:
1. Reduced Moisture Recycling (Less Local Rainfall)
Transpiration contributes to atmospheric moisture, which can return as local or regional rainfall.
- When crops transpire less, less water vapor enters the atmosphere, leading to:
- Lower humidity
- Reduced cloud formation
- Decreased local rainfall, especially in semi-arid and continental interiors
🔹 Impact: This can contribute to longer dry spells and a feedback loop of aridification, especially in areas already vulnerable to desertification.
2. Lower Evapotranspiration = Slower Water Cycling
Evapotranspiration (ET) = evaporation from soil + transpiration from plants.
- Lower ET = slower movement of water from soil to atmosphere.
- This can:
- Reduce cooling of the land surface (because ET consumes heat)
- Potentially increase surface temperatures during the day
🔹 Impact: Hotter days, reduced rainfall, and possible heat stress for crops and livestock.
3. Increased Soil Moisture Retention (Short-term Benefit)
Less water is lost to the atmosphere. As a result, soils may stay moist longer. This initially improves drought resistance and reduces irrigation needs. This initially improves drought resistance and reduces irrigation needs.
🔹 Impact: In the short term, this supports water conservation.
In the long term, if this leads to reduced rainfall, it can backfire.
4. Landscape-Level Hydrological Shifts
When drought-resistant, low-transpiration crops replace native vegetation or high-transpiration crops, they:
- Disrupt ecosystem-level water cycling
- Potentially lower groundwater recharge (fewer rain events = less infiltration)
- Shift local climate patterns due to changes in surface albedo* and humidity
🔹 Example: Large-scale planting of low-transpiration crops across a savanna could reduce the frequency of convective afternoon rains.


*Albedo is a scientific term. It refers to the reflectivity of a surface. Specifically, it describes how much sunlight (solar radiation) a surface reflects back into the atmosphere instead of absorbing it.
Simple Definition:
Albedo is the fraction of incoming solar energy that is reflected by a surface.
It is measured on a scale from 0 to 1:
- 0 = No reflection (total absorption, like black asphalt)
- 1 = Full reflection (perfectly reflective, like fresh snow)
Examples of Albedo in Nature and Land Use:
| Surface Type | Typical Albedo |
|---|---|
| Fresh snow | 0.8 – 0.9 |
| Dry sand/desert | 0.3 – 0.4 |
| Grassland/crops | 0.2 – 0.25 |
| Forest (dark vegetation) | 0.1 – 0.2 |
| Water (angle-dependent) | 0.05 – 0.1 |
| Black soil/asphalt | 0.04 – 0.1 |
Why It Matters in Agriculture and Climate:
- Higher albedo = more solar radiation is reflected = cooler local temperatures.
- Lower albedo = more solar radiation is absorbed = warmer local temperatures.
For example, deforestation lowers albedo because darker soil absorbs more heat, potentially intensifying local warming.
In agriculture, mulching, crop type, soil exposure, and canopy density each impact the albedo of a farming landscape. These factors influence microclimates and water loss.
Would you like a visual example or its role in climate feedback loops?
Summary Table
| Effect | Low-Transpiration Crops Impact |
|---|---|
| Local Rainfall | ↓ Decreases |
| Humidity | ↓ Decreases |
| Soil Moisture (Short-term) | ↑ Increases |
| Groundwater Recharge (Long-term) | ↓ Decreases |
| Temperature Moderation | ↓ Less evaporative cooling |
| Water Use Efficiency | ↑ Increases |
Implications for Agricultural Planning in Botswana
- Drought-resistant, low-transpiration crops help in the short term. However, relying on them without reforesting, mulching, and soil regeneration can be risky. It’s important to balance these crops with plants that transpire more. Otherwise, it may lead to a drier, hotter, and less predictable climate.
- Strategic planning must balance plant-level efficiency with landscape-level water cycle stability.
KEY INSIGHTS:
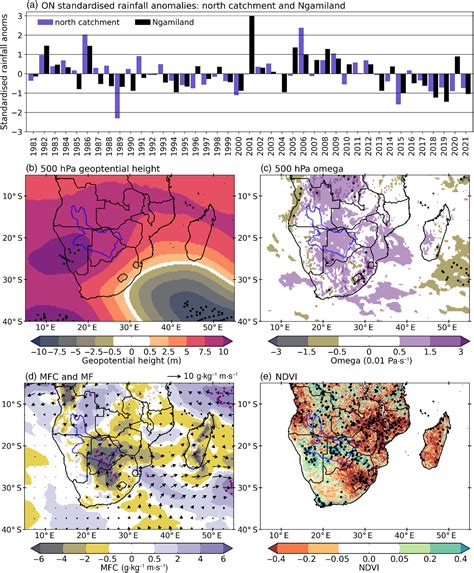
Declining Rainfall in Key Production Areas:
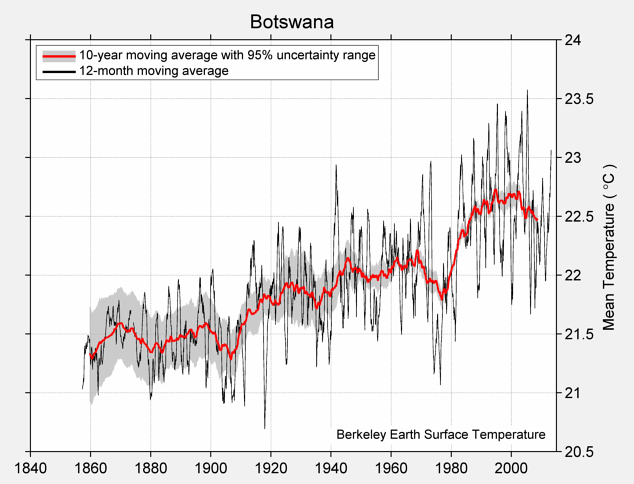
Rainfall levels in Botswana have declined in specific cereal- and livestock-producing regions over the past 15 years. Other areas have remained unaffected, according to historical data from the Botswana Meteorological Department. This challenges the idea of a uniform global warming effect. It suggests that localized environmental degradation may be happening. This degradation is likely linked to agricultural land use and possibly deforestation.
Limitations of Cereal Investment Narratives:
There is a common assumption that increasing investment in cereal production alone can reverse national declines. However, efforts to regenerate ecological conditions must occur in parallel. This includes maintaining moisture levels and soil structure. Otherwise, such strategies may prove unsustainable, even for drought-resistant crops.
Escalating Desertification Risks:
Desertification is not static—it is steadily progressing. Without systemic change, even crops bred for resilience will eventually become non-viable. Long-term adaptation strategies must go beyond input substitution and address root climatic trends.
Rationale for Regenerative and Horticulture Focus
In response, STRLDi advocates for a regenerative agriculture strategy, particularly through horticulture. Horticulture is initially vulnerable to erratic weather. However, it offers a critical advantage by actively contributing to atmospheric moisture and soil regeneration. Over time, this enhances local microclimates and can help reverse drying trends caused by extractive practices.
Balancing Competing Agricultural Priorities:
The solution is not to swing policy wholly toward one system or another. Instead, it lies in designing a balanced agricultural model. This model must meet food security targets and restore ecological function.
Data Gaps Undermine Strategic Action:
Preliminary FAOSTAT data indicate a countrywide decline in cereal production, aligning with producer concerns over inconsistent field data. This may limit the Ministry’s capacity to regulate imports effectively or justify increased sectoral investment. Delayed payments to producers could be symptomatic of this deeper structural imbalance.
Recommendation:
There is an urgent need for a national effort to collect and analyze disaggregated, region-specific production and climate data. Policymakers, investors, and farmers need a systems-based understanding of Botswana’s agricultural future. This understanding will help them co-create a more resilient and self-sustaining agricultural sector.
Subject: Reflections on National Cereal Production and Data Trends
Dear Mr. Tema,
I had thus far refrained from commenting on the country’s cereal and meat production landscape. I felt it important to first examine more recent and comprehensive data sets in both sectors.
Fifteen years ago, I had noted that rainfall patterns were declining in certain areas. This was based on historical data from the Botswana Meteorological Department. These localities were known for cereal and livestock production. Interestingly, this trend was not mirrored in all parts of the country. This suggests that the issue may not solely be the result of a uniform global warming effect. Rather, it indicated possible localised environmental degradation. This could be linked to agricultural practices and land use changes. Such changes may include or even lead to deforestation. With more robust and longitudinal datasets, these causal relationships can be better defined and understood.
This point may appear subtle, yet it carries significant weight and is often overlooked in discussions. It illustrates how we identify high-leverage interventions. Specifically, it concerns the observed correlation between drought-resistant cereals and declining rainfall. The common conclusion is to increase investment in cereal production to counteract the decline—an understandable response. However, without addressing the underlying climatic shifts driving these patterns, we risk falling short of achieving true resilience. Long-term productivity gains are unlikely without confronting these deeper systemic changes.
I recall saying at that time that even drought-resistant crops will eventually be phased out. The climatic conditions they are meant to survive will worsen. Even they cannot withstand these changes. Desertification is not a fixed point—it is dynamic and constantly expanding. We must change land use, water retention strategies, and soil regeneration practices. Otherwise, we risk pursuing production targets in environments that are no longer viable.
This may help you understand why I have taken a regenerative agriculture approach. I have also placed emphasis on boosting horticulture production levels. Horticulture might initially suffer from the same drying effects of climate variability. However, when approached regeneratively, it presents a potential solution. It contributes to atmospheric moisture and enhances local microclimates. Unlike conventional cereal farming, it can help reverse some drying conditions. These conditions are caused by widespread cultivation of crops that, while drought-resistant, do not release moisture into the atmosphere. This occurs in combination with other extractive agricultural practices. The key, I believe, is not to swing the pendulum entirely in one direction. Instead, a practical balance should be found. This balance is between systems that nourish the land and those that meet the country’s food needs.
I have compiled an initial set of figures from FAOSTAT to begin exploring these patterns. While the current dataset is limited, the preliminary trends suggest a sustained nationwide decline in cereal production. This situation may partly explain why producer associations feel caught between competing pressures. They are unable to rely on consistent field-level data to inform the Ministry’s regulatory decisions. This is particularly true concerning the timing and scale of import restrictions.
The Ministry itself may also be facing a difficult balancing act. Without clear evidence of import substitution, justifying increased allocations to the sector becomes challenging. There is no significant drop in the national import bill for cereals. This, in turn, likely affects its capacity to pay producers promptly, further exacerbating trust and viability within the sector.
A more coordinated effort is needed. We need to gather and analyze disaggregated, locality-specific production and climate data (see inbox below). This effort would shape responsive policies. These policies would strengthen national food security and protect the economic interests of our producers.
Warm regards,
Sheila Damodaran
Managing Director
Systems Thinking Research & Leadership Development Institute (STRLDi)
Botswana
Tel: 75987534
May 14, 2025
PART II
GRAIN PRODUCTION, DEMAND AND CONSUMPTION TRENDS 1960S – 2020S
Comparing Botswana’s grain production and demand from the 1960s to the present shows a persistent gap. Domestic production consistently falls short of consumption needs. This disparity has necessitated substantial grain imports to meet the country’s food requirements.

📊 Grain Production Trends (1960s–2020s)
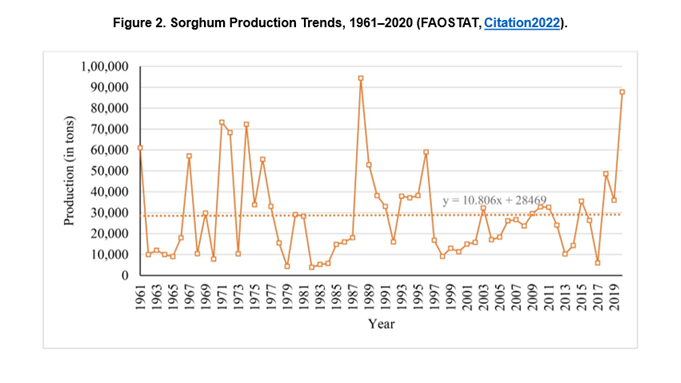
- 1960s–1980s: Grain production was generally low, with significant fluctuations due to droughts and limited agricultural infrastructure. For instance, in 1984, production dropped to a record low of 9,525 metric tons. (CEIC Data)
- 1990s–2000s: Efforts to improve agricultural output led to some increases in grain production. However, challenges such as inconsistent rainfall and limited agricultural infrastructure continued to hinder substantial growth.
- 2010s: Production levels varied, with some years witnessing improvements due to better rainfall and government support programs. For example, in 2017, the total grain production was 2,348 metric tons. However, by 2019, production had declined sharply to 583 metric tons, primarily due to drought conditions.
- 2020s: Recent data indicates a gradual increase in grain production. In 2022, cereal production was reported at 85,049 metric tons. By 2028, grain production could rise to 64,100 metric tons. This is an increase from 59,000 metric tons in 2023. It reflects an annual growth rate of 1.3%.
📈 Grain Demand and Consumption
While specific year-on-year consumption data is limited, it’s evident that Botswana’s grain demand has consistently outpaced domestic production. The country’s reliance on grain imports underscores this gap. For instance, in 2023, Botswana ranked 143rd globally in grain production, with Lesotho surpassing it by producing 59,000 metric tons. (Taylor & Francis Online, ReportLinker)
📉 Production vs. Demand Gap
The persistent shortfall in grain production relative to demand has led to a dependence on imports to ensure food security. Factors contributing to this gap include:
- Crop Production Choices Exacerbating Climate Variability
Botswana’s semi-arid climate and recurrent droughts have long posed challenges to agricultural productivity. Current crop production choices are adding to the problem. They limit the landscape’s ability to support moisture recycling. As a result, they decrease rainfall. In this way, agricultural decisions are not only shaped by climate variability but may also reinforce it.
📚 Data Sources for Detailed Analysis
For a more comprehensive year-by-year breakdown of grain production and consumption statistics in Botswana, the following resources are recommended:
- Statistics Botswana: Provides detailed agricultural survey reports and data. (Statistics Botswana)
- FAO GIEWS Country Briefs: Offers insights into food security and agricultural trends. (FAOHome)
- CEIC Data: Contains historical data on agricultural production and consumption. (CEIC Data)

| To check the extent increases were the result of proceeds from sales or capital injections. |


CEREALS PRODUCED IN PANDAMATENGA
Pandamatenga, situated in Botswana’s Chobe District, stands as the nation’s primary hub for cereal production. The area’s favorable conditions are ideal for large-scale, rainfed agriculture. These conditions include flat terrain, fertile Vertisol soils, and annual rainfall averaging around 600 mm. (Wikipedia, African Development Bank Group)
🌾 Major Cereals Produced in Pandamatenga
Sorghum: As Botswana’s staple grain, sorghum is extensively cultivated in Pandamatenga. In the 2022–23 season, the region produced approximately 42,100 tonnes of sorghum, marking an 11% increase from the previous year. This output significantly contributes to national self-sufficiency in sorghum production. (Mmegi Online)
Wheat: Traditionally a minor crop, wheat cultivation in Pandamatenga has expanded in recent years. During the 2022–23 season, there was a nearly 30% increase in wheat production. This indicates a growing importance in the region’s agricultural portfolio. (Facebook, Mmegi Online)
Maize: Maize is a significant cereal crop nationally. However, its cultivation in Pandamatenga is less prominent compared to sorghum and wheat. However, it remains an essential component of the region’s cereal production.
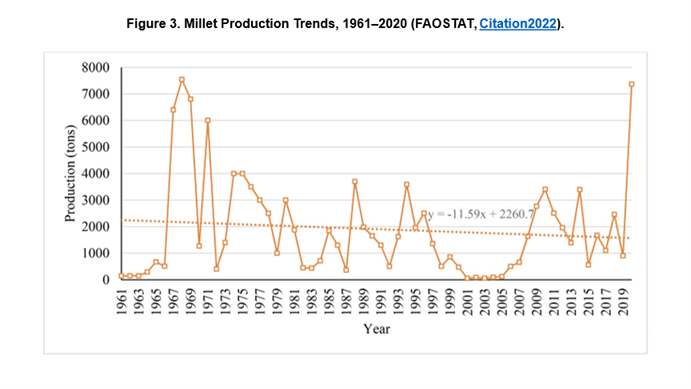
Millet: Grown on a smaller scale, millet contributes to the diversity of cereals produced in Pandamatenga. Its cultivation supports food security, especially in areas with variable rainfall.(chobedestination.co.bw)
🌱 Additional Crops
Beyond cereals, Pandamatenga’s farmers also cultivate various pulses and oilseeds, including cowpeas, chickpeas, mung beans, sunflower, and sugar beans. These crops not only diversify agricultural output but also enhance soil fertility through crop rotation practices. (Mmegi Online)
🏗️ Infrastructure and Development
To support and enhance agricultural productivity, significant investments have been made in infrastructure within the Pandamatenga region. Notably, 12 modern steel grain silos are being constructed. Each silo has a capacity of 5,000 metric tonnes. This aims to improve grain storage and management. This development is expected to motivate farmers to increase grain production, thereby promoting food security. (Guardian Sun, Daily News)
In summary, Pandamatenga’s strategic importance in Botswana’s agricultural sector is significant. It contributes substantially to cereal production, focusing on sorghum and wheat. These contributions are supported by favorable agro-climatic conditions and ongoing infrastructure development.
PART III
Water Use per Tonne of Produce: Botswana vs. Global Averages for Cereals, Meat & Horticulture
Here’s an updated comparison of water usage per tonne of agricultural produce. It includes cereals, meat, and horticulture. We have incorporated available data for Botswana. This is alongside global averages and leading producers.
Cereals
| Crop | Global Average (m³/tonne) | Botswana Estimate (m³/tonne) | Leading Producer (Country) | Leading Producer (m³/tonne) |
|---|---|---|---|---|
| Maize | 900 | ~1,500–2,000 | USA | 489 |
| Wheat | 1,300 | ~1,500–1,800 | USA | 849 |
| Rice | 3,000 | Not widely cultivated | India | 2,850 |
Note: Botswana’s estimates are approximations based on regional data and climatic conditions.
Meat
| Product | Global Average (m³/tonne) | Botswana Estimate (m³/tonne) | Leading Producer (Country) | Leading Producer (m³/tonne) |
|---|---|---|---|---|
| Beef | 15,500 | ~15,000 | USA | 13,193 |
| Pork | 4,900 | Limited production | China | 2,211 |
| Chicken | 3,900 | ~4,000–5,000 | USA | 2,389 |
Horticulture (Fruits & Vegetables)
| Product | Global Average (m³/tonne) | Botswana Estimate (m³/tonne) | Leading Producer (Country) | Leading Producer (m³/tonne) |
|---|---|---|---|---|
| Vegetables | 300–500 | ~500–700 | China | 300–400 |
| Fruits | 900–1,200 | ~1,000–1,500 | China | 900–1,100 |
Note: Botswana’s estimates are approximations based on regional data and climatic conditions.

Comparative Summary
- Meat: Beef production in Botswana aligns closely with global averages. However, the country is a net exporter of beef, indicating a relatively efficient production system.
- Horticulture: Water usage for fruits and vegetables in Botswana is higher than in leading producer countries. This suggests potential for improvement through efficient irrigation practices.
Regional and Global Productivity Insights
- Water Use Efficiency (WUE):
- Maize: Global average WUE is approximately 3.78 kg/m³. In Botswana, WUE is estimated to be lower due to climatic challenges.
- Cowpea: A study in Botswana reported a WUE of 3.72 kg/ha/mm under optimal planting conditions, indicating potential for efficient water use in legume production.
- Leading Producers:
- Cereals: The USA achieves high yields with efficient water use, particularly in maize production.
- Meat: The USA and Brazil are leading beef producers with varying water use efficiencies.
- Horticulture: China leads in vegetable and fruit production, benefiting from advanced irrigation and farming techniques.
A cow’s water consumption and elimination depend on factors like age, size, climate, lactation status, diet, and activity level. Here’s a breakdown for typical beef or dairy cattle under normal conditions:
Cow: Water Consumption and Elimination
Water Consumption (Intake)
| Cattle Type | Average Daily Water Intake (litres/day) |
|---|---|
| Adult beef cattle | 30 – 60 litres/day |
| Lactating dairy cow | 70 – 120 litres/day |
| Calf (young) | 5 – 15 litres/day |
🔹 In hot weather or when fed dry feed, water intake can increase by up to two times.
Water Elimination
Cattle eliminate water through:
- Urine
- Feces
- Sweating and breathing (insensible loss)
- Milk (in lactating cows)
Here’s an approximate breakdown:
| Route | Volume (litres/day) |
|---|---|
| Urine | ~10 – 30 litres |
| Feces | ~5 – 15 litres |
| Respiration & Sweating | ~5 – 15 litres |
| Milk (if lactating) | ~20 – 40 litres (milk is ~87% water) |
🔹 So, a lactating dairy cow might eliminate 60–100+ litres of water per day, much of it through milk.
Important Notes
- Water needs increase significantly in hot, dry climates like Botswana.
- High-protein diets increase water intake and urine output.
- Cattle must have constant access to clean water to stay healthy and productive.
Cereals: Water Consumption and Elimination
In plants like cereals (e.g., maize, wheat, rice), water is not “consumed and eliminated” in the same way as animals—but we can explain it in terms of:
1. Water Uptake (Consumption)
Cereal crops absorb water primarily through their roots from soil moisture. On average:
| Crop | Water Required per Tonne (m³/tonne) | Water per kg (litres) |
|---|---|---|
| Maize | ~900–1,222 m³/tonne | 900–1,220 litres |
| Wheat | ~1,300–1,440 m³/tonne | 1,300–1,440 litres |
| Rice | ~2,500–3,000 m³/tonne | 2,500–3,000 litres |
This includes all the water needed from planting to harvest: rainfall + irrigation.
2. Water Elimination (Loss)
Plants do not urinate or sweat, but they release water through a process called transpiration. Here’s how water is “eliminated”:
- Transpiration: Water evaporates through the leaf surface (stomata). This accounts for over 90% of water absorbed.
- Evaporation from soil: A large portion of irrigation or rainwater is also lost directly from the soil.
- Photosynthesis: Uses a small amount of water chemically.
So, if a maize plant absorbs 100 litres of water:
- About 95 litres are transpired into the atmosphere,
- <5 litres are retained in plant tissues and grain.
Key Insight
| Input Water | Transpired | Retained in Crop |
|---|---|---|
| 100% | ~90–95% | ~5–10% |
This is why improving soil cover, reducing evaporation, and managing irrigation are critical in water-scarce agriculture like Botswana’s.
Would you like me to compare this with root crops or horticultural crops next?
Vegetables: Water Consumption and Elimination
Vegetables, like cereals, use water for growth and lose most of it through transpiration. However, they generally require much less water per kilogram of produce compared to cereals or meat. Here’s a breakdown:
Water Use (Consumption) by Vegetables
| Vegetable Type | Water Use per Tonne (m³/tonne) | Water per kg (litres) |
|---|---|---|
| Leafy Greens | 200–300 m³ | 200–300 litres |
| Root Vegetables | 300–500 m³ | 300–500 litres |
| Tomatoes | ~214 m³ | ~214 litres |
| Cabbage | ~280 m³ | ~280 litres |
| Onions | ~300–400 m³ | 300–400 litres |
| General Average | ~300–500 m³ | 300–500 litres |
In comparison:
- Maize uses ~1,200 litres/kg
- Beef uses ~15,000 litres/kg
Water Elimination in Vegetables
Like cereals, vegetables “eliminate” water primarily through transpiration:
Water Balance in Vegetable Plants
| Water Taken In | Approx. Share |
|---|---|
| Transpired | ~90–95% of water absorbed |
| Retained in Tissues | ~5–10% (used in growth/harvested produce) |
So for every 100 litres of water absorbed:
- 90–95 litres are released back into the atmosphere through transpiration.
- 5–10 litres are stored in the edible parts of the plant (e.g., leaves, stems, roots).
Implications for Farming in Dry Regions
- Vegetables are water-efficient relative to cereals and meat.
- However, they are highly sensitive to water stress, especially during flowering and fruiting stages.
- Drip irrigation and mulching can significantly reduce losses and improve yields.
Would you like me to map vegetable water use by type for crops grown in Botswana?
Fruit Trees: Water Consumption and Elimination
Fruit trees, like other plants, absorb water from the soil and eliminate most of it through transpiration. Their water use is influenced by tree size, age, and type of fruit. The season and local climate also play a role, especially in semi-arid regions like Botswana.
Water Consumption by Fruit Trees
| Fruit Type | Average Water Use (litres/tree/day) | Water Use per Tonne (m³/tonne) | Water per kg (litres) |
|---|---|---|---|
| Citrus (e.g. oranges) | 60–120 L/day | 500–1,200 m³/tonne | 500–1,200 L/kg |
| Mango | 50–100 L/day | 1,600–2,200 m³/tonne | 1,600–2,200 L/kg |
| Apple | 40–80 L/day | 700–1,200 m³/tonne | 700–1,200 L/kg |
| Banana | 30–60 L/day | 800–2,000 m³/tonne | 800–2,000 L/kg |
| Papaya | 20–40 L/day | 500–1,000 m³/tonne | 500–1,000 L/kg |
| Average (Fruit) | — | ~900–1,200 m³/tonne | ~900–1,200 L/kg |
🛈 These are broad estimates under irrigation or rainfall conditions and can vary greatly based on soil and climate.
Water Elimination (Loss) in Fruit Trees
Most water is lost through:
| Pathway | Approx. % of Water Absorbed |
|---|---|
| Transpiration | ~85–95% |
| Fruit formation & storage | ~5–10% |
| Evaporation from soil | additional external loss |
Example:
If a mature mango tree consumes 100 litres/day:
- ~90–95 litres are transpired,
- ~5–10 litres are retained in leaves, branches, and fruit.
Water Use Across the Growing Season
- Water demand increases during flowering and fruit development.
- Drip irrigation systems significantly improve efficiency—reducing total water use by 30–50% compared to flood irrigation.
In the Context of Botswana
- Due to high evapotranspiration, water-efficient practices are crucial.
- Mango, citrus, guava, and moringa are among common fruit trees cultivated.
- Systems like rainwater harvesting, mulching, and timed irrigation are essential to balance productivity and water sustainability.
A Comparison of Average Annual Evaporation by Climate Zones
Here’s a comparison of average annual evaporation (potential evapotranspiration) across these climate zones:
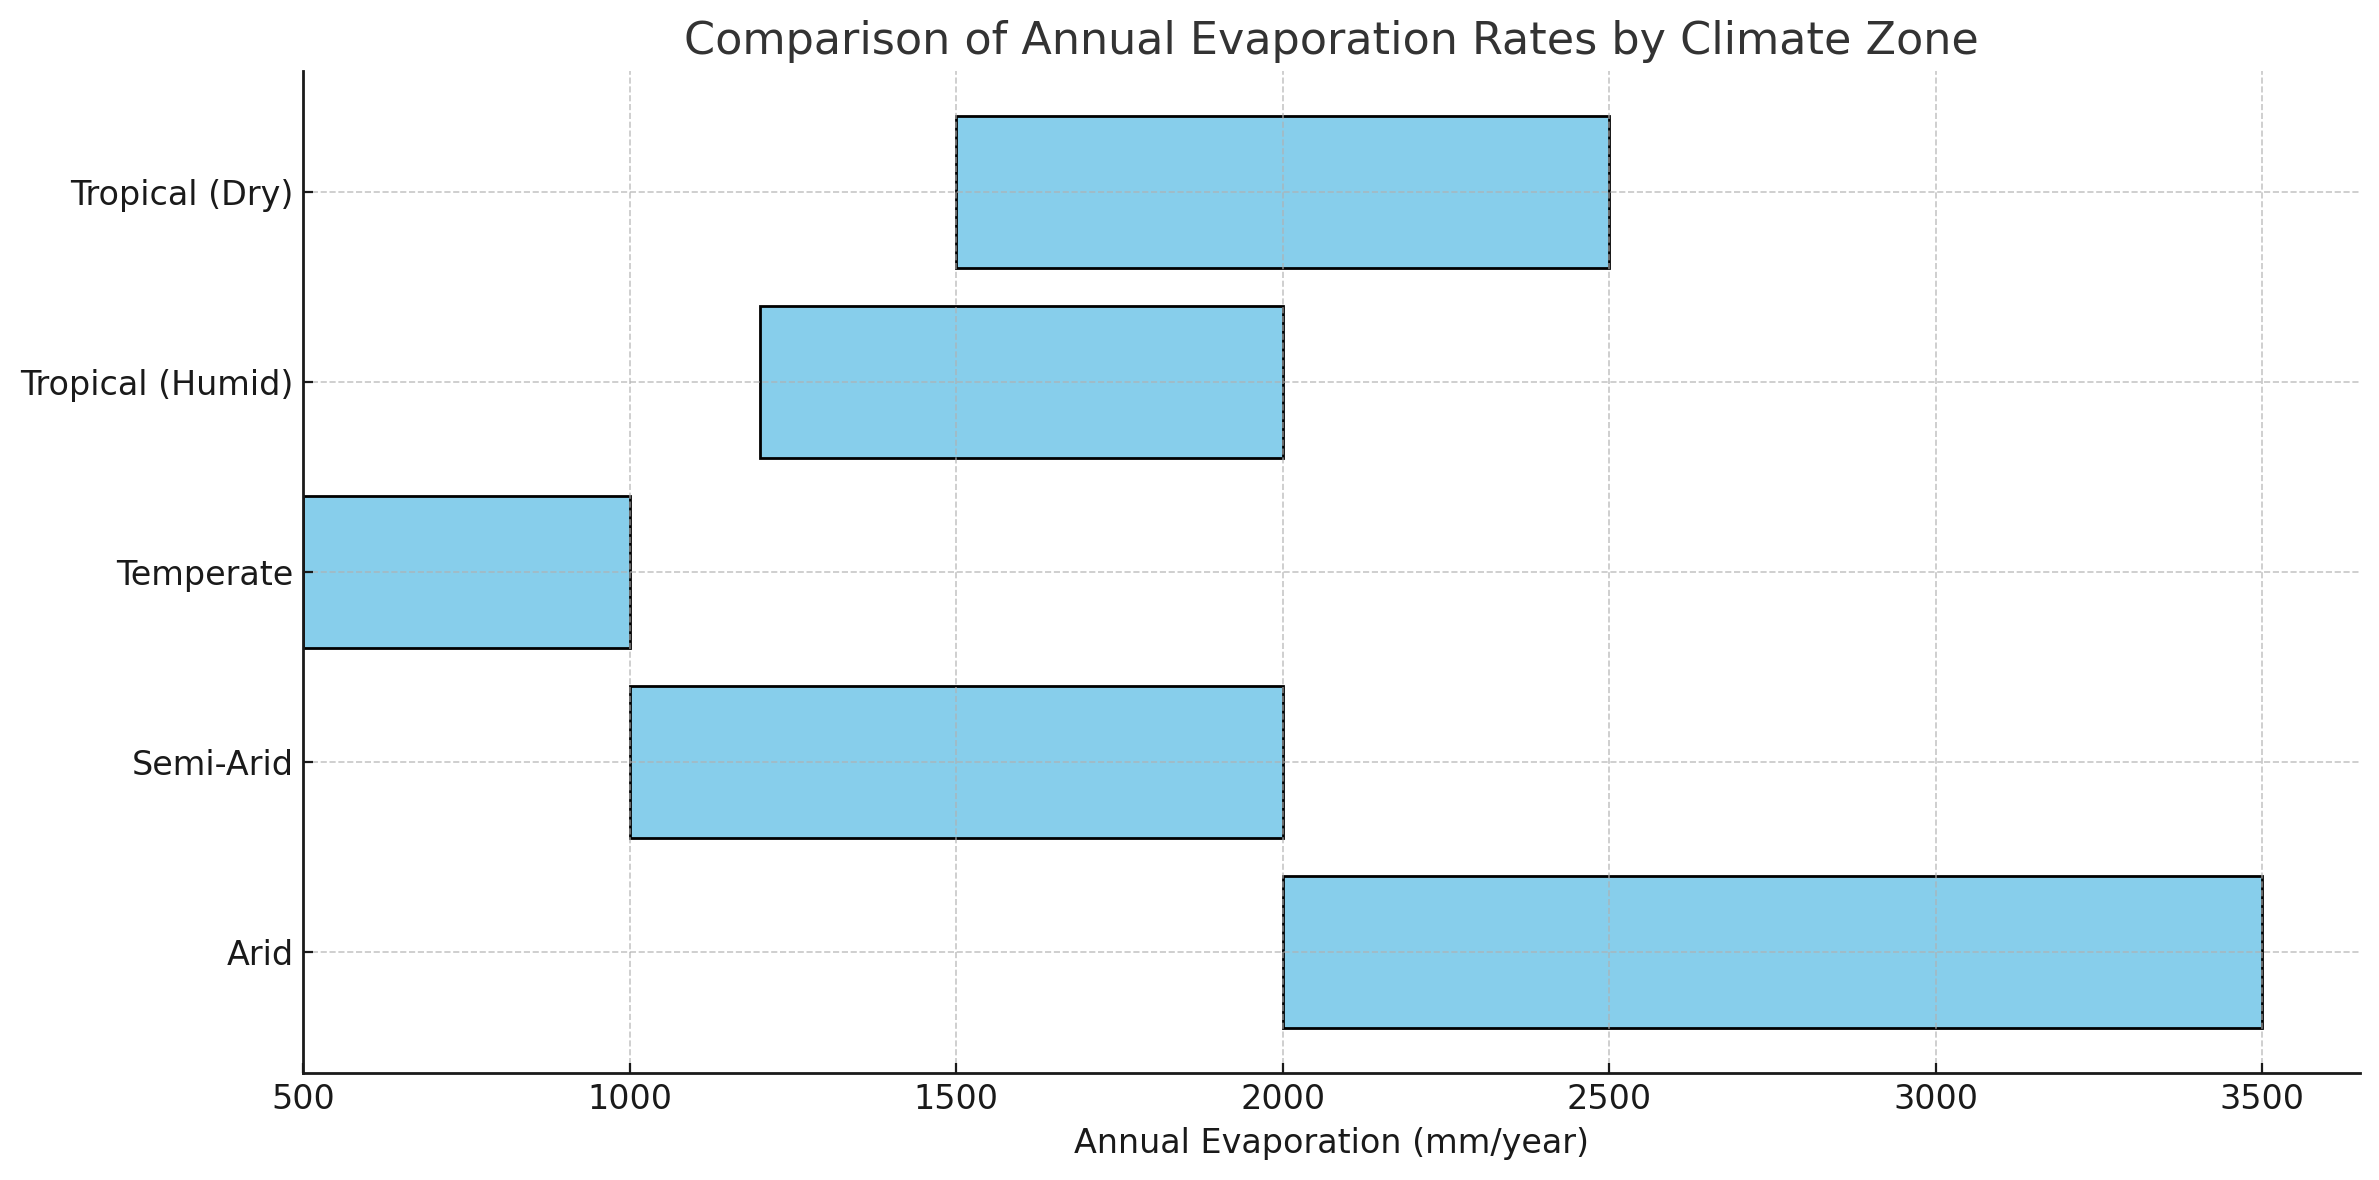
Evaporation rates vary greatly across arid, semi-arid, temperate, and tropical regions. This variation is due to differences in temperature, humidity, solar radiation, wind, and vegetation cover. Evapotranspiration specifically combines water loss from soil (evaporation) and plants (transpiration).
💧 Evaporation Comparison by Climate Region
| Climate Zone | Annual Evaporation (mm/year) | Description |
|---|---|---|
| Arid | 2,000 – 3,500 mm | Extremely high evaporation due to intense heat, low humidity, and sparse vegetation. Water evaporates faster than it can be replaced. |
| Semi-Arid | 1,000 – 2,000 mm | High rates, especially during dry seasons. Vegetation is limited, and soils are often exposed. |
| Temperate | 500 – 1,000 mm | Moderate evaporation. Seasonal rainfall and cooler winters reduce loss. Vegetation and soil moisture vary by season. |
| Tropical (humid) | 1,200 – 2,000 mm | High evaporation but often balanced by heavy rainfall and dense vegetation that retains soil moisture. |
| Tropical (savanna/dry) | 1,500 – 2,500 mm | High radiation and heat, with a distinct dry season. Evaporation can exceed rainfall in dry periods. |
🔹 Actual evaporation will be lower than potential when water availability is limited—especially in arid and semi-arid areas.
Key Takeaways
Arid zones have the highest evaporation potential, but actual evaporation is often constrained by lack of water.
Semi-arid regions like Botswana experience significant water loss, especially where soils are bare and vegetation sparse.
Tropical humid areas lose a lot of water, but rainfall often exceeds evaporation, maintaining balance.
Temperate climates are more water-efficient due to cooler temperatures and seasonal variation.
Key Takeaways
- Water Scarcity and Agricultural Sustainability
Botswana’s semi-arid climate demands efficient water use in agriculture. Adopting drought-resistant crops is a practical short-term response. However, relying on them should not be mistaken for a long-term guarantee of sustainability. Without complementary strategies, reliance on such crops alone may ultimately prove insufficient. It is crucial to address soil health, water retention, and broader ecological resilience. - Technological Adoption: Implementing modern irrigation systems and drought-resistant crop varieties can enhance water use efficiency.
- Policy Implications: Government initiatives focusing on water management and support for farmers can drive improvements in agricultural productivity.

DATA NOT AVAILABLE (1960s to now):
Demand data by crop and livestock product
Consumption data by crop and livestock product
Export data by crop and livestock product
Investment data by crop type
Locality-specific production data for each crop and livestock product
Wheat production trends
Poultry production levels
Beef production levels
Goat production levels
Horticulture production levels
Rainfall data by locality
[End of Document.]

Leave a comment