Africa is not just an emerging market. It is a strategic axis between East and West. With the world’s youngest population and growing global demand for value-added goods, the AfCFTA is our opportunity to lead.
No one needs to ask permission to trade—or even to exist. When we believe we do, we risk becoming either combative—going to war literally or fighting political and even business wars (even just hustling) or demanding inclusion by quota—or passive, content with the crumbs that fall our way after everyone has clawed at the little that comes our way.
The world does not respond to entitlement. It responds to competence—to the ability to produce, to meet global standards, and to deliver consistently.
When we build that competence, we will not need to knock on doors. The world will come knocking on ours.
STRATEGIC INSIGHTS ON REGIONAL ECONOMIC PLATFORMS: Structure, Integration, and Global Positioning
A comparative analysis of global regional economic platforms reveals critical patterns in their economic weight, trade behavior, and levels of integration. The findings challenge common assumptions and provide valuable guidance for policymakers, development agencies, and trade negotiators.
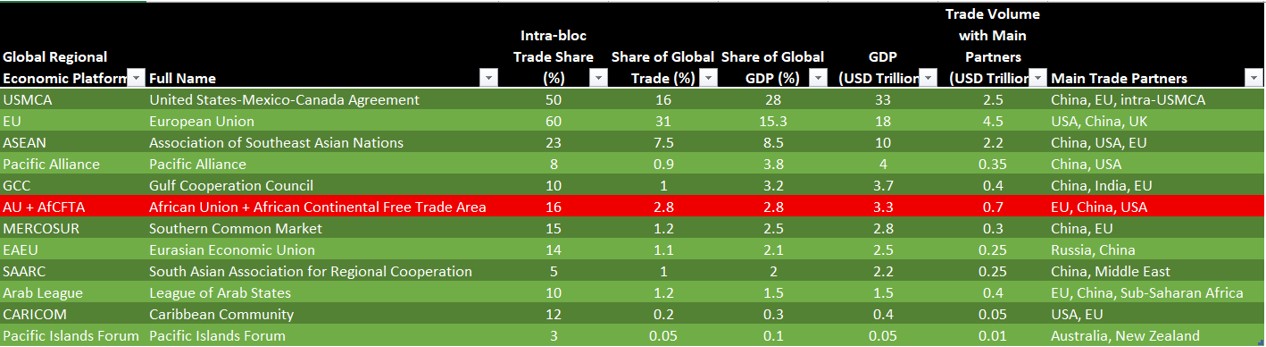
1. Internal Trade Builds Global Trade Power—Not Protectionism
Intra-bloc trade is not a sign of protectionism—it’s a strategic enabler of global competitiveness.
A review of trade data across platforms shows that regions with deeper internal trade integration are also the most active in global trade. This is visually confirmed by the scatter plot below:
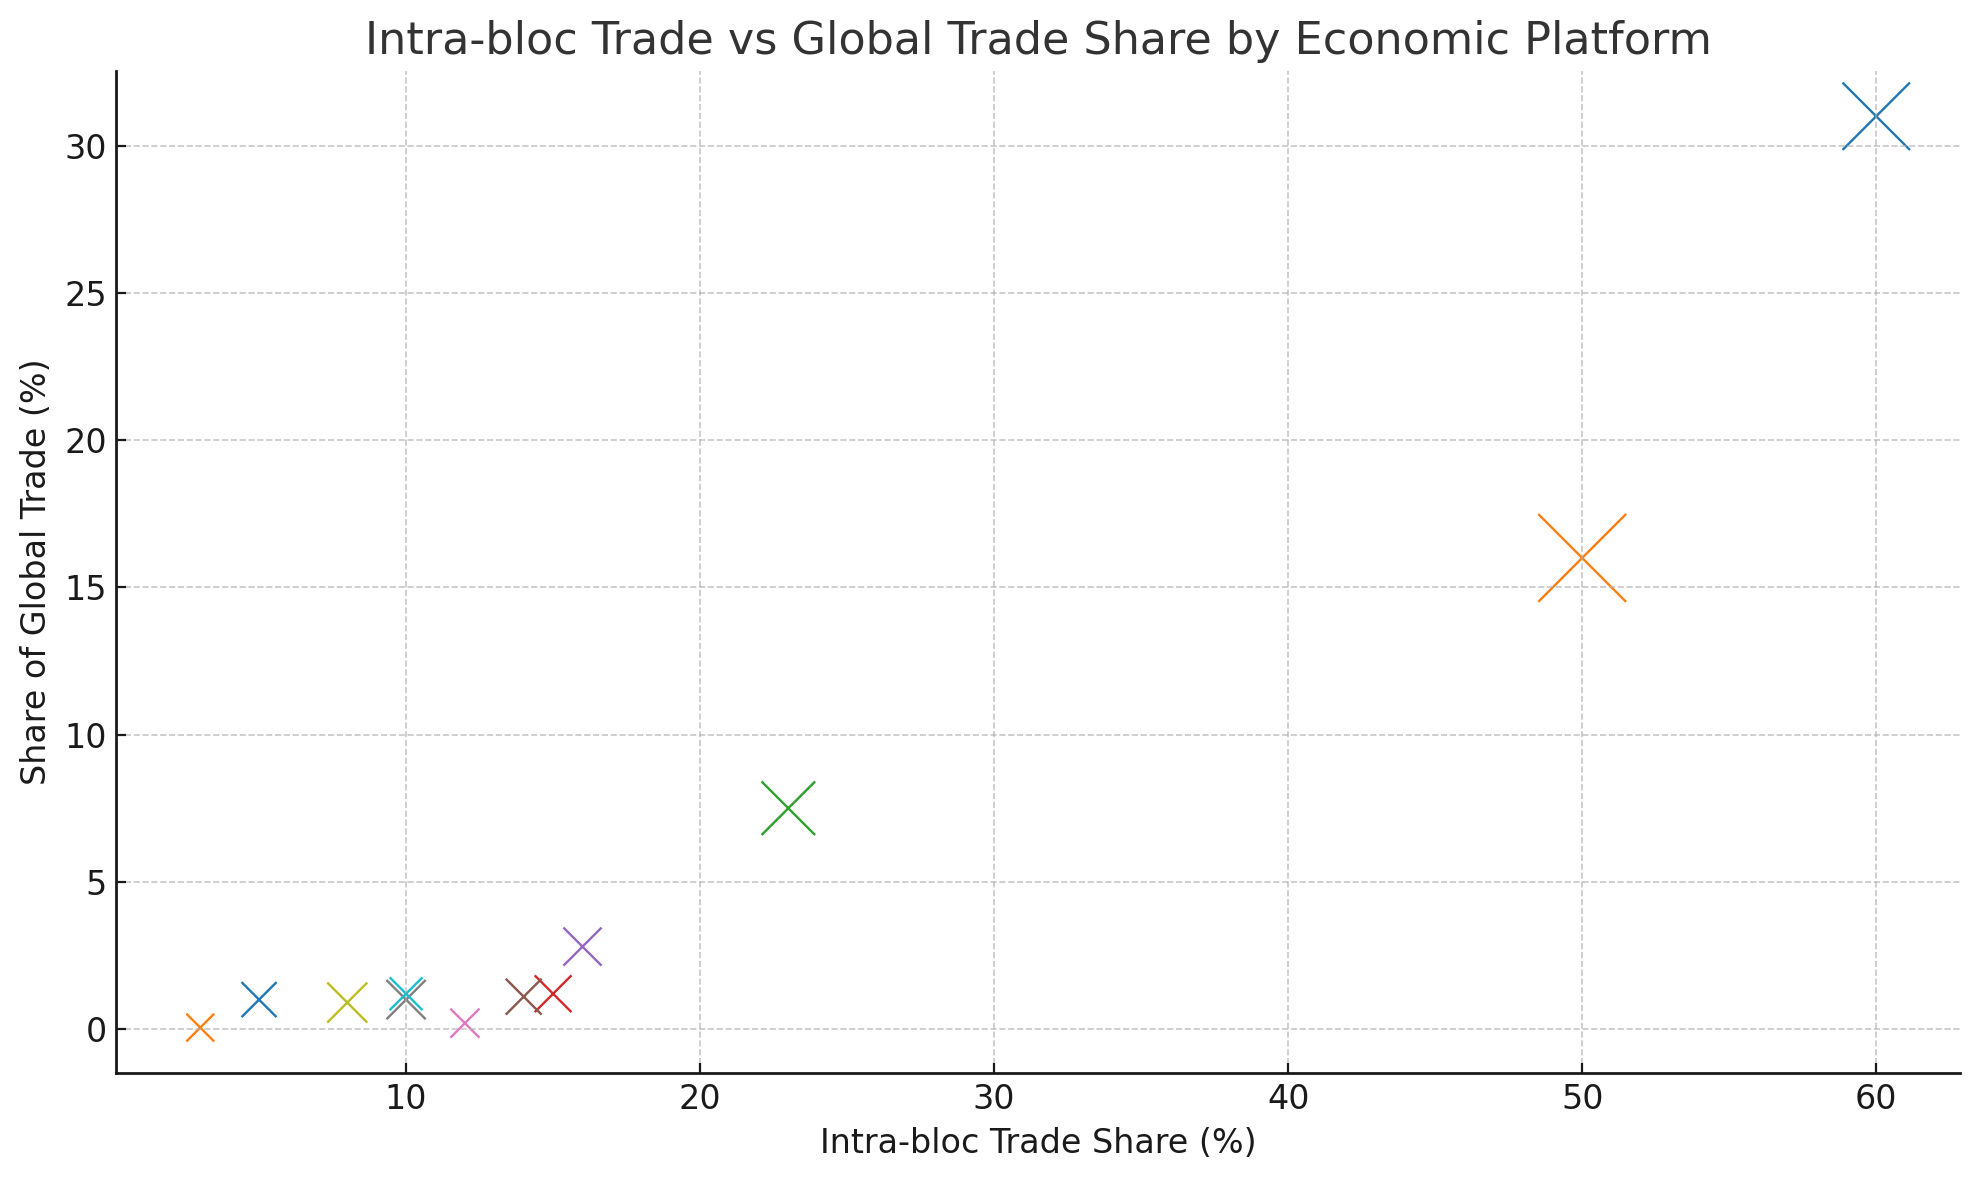
- The scatter plot illustrates a clear positive trend: economic platforms with higher intra-bloc trade tend to have a greater share of global trade. This supports your insight that internal trade integration enhances—not restricts—external global trade performance.
- The EU and USMCA lead in both intra-bloc and global trade, indicating that deep internal coordination amplifies external competitiveness.
- Blocs like ASEAN, with moderate internal trade, still excel globally through open regionalism and production network integration.
- In contrast, blocs with low internal trade shares (e.g. AU + AfCFTA, SAARC) also show weak participation in global trade, not due to openness, but due to capacity and integration gaps.
2. AU + AfCFTA: Low Intra-Trade = Limited Global Leverage
- Despite a combined GDP of $3.3T, the African bloc contributes only 2.8% to global trade.
- Intra-African trade remains under 16%, indicating fragmentation in supply chains, standards, and infrastructure.
- This low internal trade constrains global engagement, reinforcing Africa’s dependence on external markets.
3. High GDP ≠ High Integration
- USMCA (GDP: $33T) and the EU ($18T) are both economic giants.
- However, the EU stands apart with deep institutional coordination and 60% intra-bloc trade, indicating more advanced integration.
- USMCA, while economically powerful, maintains a moderate internal trade share (50%), reflecting more transactional cooperation.
4. ASEAN Punches Above Its Weight
- With a GDP of $10T and 8.5% of global GDP, ASEAN is responsible for 7.5% of global trade.
- It balances internal (23%) and external trade, demonstrating that regional cohesion and external agility are not mutually exclusive.
5. Underperforming Blocs Remain Marginalized
- Blocs such as MERCOSUR, GCC, CARICOM, and SAARC suffer from low intra-bloc trade (≤15%) and limited influence on global trade volumes.
- They face institutional, infrastructural, and policy harmonization challenges, limiting their regional economic consolidation.
6. Economic Integration is a Capability Multiplier
The data suggests a powerful causal relationship:
The stronger the internal market, the more capable the bloc becomes in negotiating, competing, and thriving in global markets.
Thus, policy focus should prioritize intra-bloc trade facilitation—through infrastructure investment, tariff alignment, digital customs, and mobility agreements—as a gateway to more equitable and sustainable global trade participation.
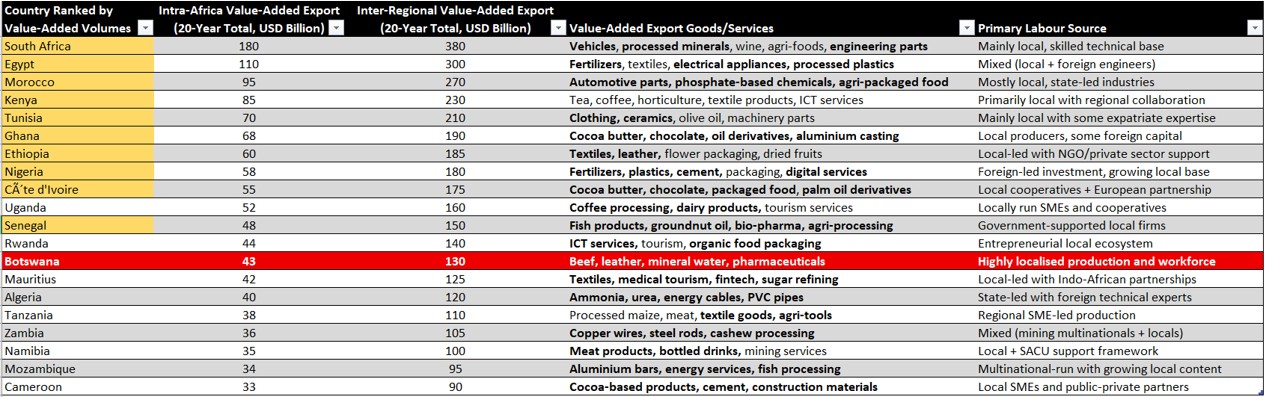
Here is the comparative table of the Top 20 African Union countries by value-added export volumes over the past 20 years, showing:
- Intra-Africa and inter-regional (global) export totals for value-added goods and services
- Examples of their key value-added exports
- Whether those exports are driven by local talent or expatriate labour
This helps identify which AU countries are advancing in industrial transformation, local capacity building, and trade diversification.
LESSONS FROM EU ECONOMIC PLATFORM
The European Union (EU) achieves a high level of integration depth compared to the African Union (AU) + AfCFTA due to a combination of historical, institutional, legal, economic, and political factors. Here’s a breakdown of the key differences:
🏛️ 1. Institutional Architecture
EU
- Has supranational institutions with real decision-making power:
- European Commission (executive)
- European Parliament (legislative)
- European Court of Justice (judicial)
- Enforces binding laws on member states through treaties (e.g. Treaty of Lisbon)
- Qualified Majority Voting allows collective decisions even when not unanimous
AU + AfCFTA
- Mostly intergovernmental (states retain sovereignty over implementation)
- Limited enforcement power; AU decisions are often recommendatory
- AfCFTA Secretariat focuses on negotiation and facilitation, not enforcement
💶 2. Economic Convergence
EU
- Members have similar levels of economic development (especially in the Eurozone)
- Shared currency (Euro) deepens economic interdependence
- Cross-border banking regulations, competition law, and fiscal oversight
AU + AfCFTA
- Wide disparities in GDP, infrastructure, and trade capacity
- No common currency across the continent
- Limited harmonization of financial and trade standards
⚖️ 3. Legal and Regulatory Harmonization
EU
- Deep integration via a common legal framework
- Common policies on environment, agriculture (CAP), transport, etc.
- Schengen Area allows free movement of people
AU + AfCFTA
- Focused on tariff reductions and trade facilitation
- Still in early phases of harmonizing rules of origin, customs, and standards
- Free movement protocols exist but are not widely ratified or enforced
📜 4. Historical Drivers
EU
- Built from a post-WWII peace project, with a strong motivation to integrate
- Decades of gradual integration since 1957 (Treaty of Rome)
- Crises (e.g. Eurozone crisis, Brexit) have led to deeper reforms
AU + AfCFTA
- Formed from post-colonial solidarity and Pan-Africanism
- Institutional development is younger and uneven
- Conflicts and political instability slow integration in some regions
💬 5. Political Will and Trust
EU
- High level of trust and alignment among founding members
- Shared democratic values and mutual accountability mechanisms
- Strong public support in many countries for EU benefits
AU + AfCFTA
- Member states often prioritize national sovereignty
- Political trust varies; some members skeptical of ceding power
- Varied governance systems and accountability levels
🧭 Summary Comparison Table
| Dimension | EU | AU + AfCFTA |
|---|---|---|
| Institution Type | Supranational | Intergovernmental |
| Legal Authority | Binding laws & treaties | Mostly non-binding agreements |
| Economic Similarity | High | Low |
| Currency Union | Yes (Eurozone) | No |
| Trade Infrastructure | Deep and integrated | Emerging |
| Movement of People | Schengen (free movement) | Partial, fragmented |
| Regulatory Alignment | High (single market) | Low to moderate |
| Years of Integration | 65+ years | ~20 years |
| Common Foreign Policy | Partially aligned | Not yet coordinated |
The European Union (EU) has a strong mandate and institutional framework that not only supports internal market integration, but also plays an active role in stimulating demand for EU-produced goods and promoting exports globally. In contrast, the African Union (AU) and AfCFTA have more limited authority and capacity in these areas. Here’s a detailed comparison:
🇪🇺 EU MANDATE: DEMAND CREATION AND EXPORT PROMOTION
1. Mandate to Support Internal Demand
- Through the Single Market, the EU:
- Eliminates barriers to trade in goods, services, capital, and labor.
- Harmonizes product standards and consumer protection laws.
- Promotes EU-based procurement (e.g. Buy European preferences in public tenders).
➡️ Effect: Creates a large, unified internal market (450+ million people), increasing demand for EU-produced goods.
2. Mandate to Monitor and Expand Global Demand
- The European Commission’s DG Trade:
- Analyzes global trade flows and demand patterns.
- Negotiates trade agreements (e.g. FTAs, Economic Partnership Agreements).
- Issues export forecasts, market access alerts, and global opportunity reports.
➡️ Effect: Member states receive early intelligence on market opportunities, which helps businesses and export agencies align strategy.
3. MOUs and External Trade Access
- The EU, via the Commission and High Representative for Foreign Affairs:
- Signs Memoranda of Understanding (MOUs) with non-EU countries and regions.
- These MOUs may include terms on:
- Preferred sourcing from EU
- Technology transfers
- Sector-specific trade access (e.g. agri-food, renewables, pharma)
➡️ Effect: EU countries benefit from market access that they would not be able to secure individually.
4. Institutional Promotion of EU Exports
- EU Export Helpdesk, Enterprise Europe Network, EU Global Gateway provide:
- Tools for exporters
- Matchmaking platforms
- Access to global tenders and investment opportunities
➡️ Effect: A coordinated export promotion system supports firms, especially SMEs, across all member states.
AU + AfCFTA: LIMITED CAPACITY AND SCOPE
1. Mandate Focused on Integration, Not Demand Stimulation
- AfCFTA is structured to reduce tariffs and harmonize rules, not directly stimulate internal demand.
- The AU does not have a binding mandate to:
- Coordinate procurement
- Promote domestic sourcing
- Set production standards continent-wide
➡️ Effect: Internal demand generation is left to individual countries and RECs (e.g. SADC, ECOWAS).
2. Weak Market Intelligence Infrastructure
- The AfCFTA Secretariat has limited:
- Capacity to analyze and disseminate global demand trends.
- Systems for forecasting export opportunities.
- There are no continent-wide databases comparable to the EU’s Export Helpdesk or TRACES.
➡️ Effect: African exporters rely heavily on external partners (e.g. China, EU, US) for market information and access.
3. MOUs are National, Not Continental
- MOUs and trade agreements are negotiated by individual AU countries, not by the AU or AfCFTA.
- AfCFTA does not have the legal authority to:
- Direct exports
- Negotiate continent-wide trade deals (yet)
➡️ Effect: Fragmentation—African countries may undercut each other or duplicate negotiation efforts.
4. Limited Export Promotion Mechanisms
- The AU has no central export promotion agency.
- Afreximbank, ECOWAS Bank, and some RECs promote trade, but not in a coordinated pan-African framework.
- SME export support is patchy and underfunded.
➡️ Effect: African firms face higher barriers to scaling exports than their EU counterparts.
Summary Comparison Table
| Feature/Function | EU | AU + AfCFTA |
|---|---|---|
| Internal demand stimulation | Strong through procurement, single market | Limited, no central mechanism |
| Global demand monitoring | DG Trade, export intelligence tools | Minimal capacity, no centralized system |
| Trade MOUs and market access coordination | EU-led MOUs & FTAs binding across bloc | Done by member states individually |
| Export promotion tools | Helpdesks, EEN, Global Gateway | Mostly at national or REC level |
| Legal authority to negotiate trade | European Commission (binding treaties) | AfCFTA Secretariat (facilitating only) |
| Procurement alignment (Buy regional/local) | Encouraged via EU directives | Absent or inconsistent across AU |
| SME support and global match-making | Integrated EU-wide networks | Limited, fragmented |
Strategic Insight
The EU is structured as a trade-and-demand-generating bloc, with the institutional power and instruments to influence both internal consumption and global export strategy.
The AU and AfCFTA, while visionary in scope, currently function as a facilitation platform—not a strategic trade bloc. Their ability to generate demand, direct exports, or coordinate external trade relations remains limited by intergovernmental design and institutional underdevelopment.
✅ EU: KEY SKILLS AND COMPETENCIES ENABLING EFFECTIVE TRADE GOVERNANCE
To carry out their strategic role in demand generation, export promotion, and trade diplomacy, the EU and its member countries possess a well-developed ecosystem of skills and institutional competencies—both at the supranational and national levels. These competencies are significantly more developed than those currently available in the AU and AfCFTA systems. Here’s a breakdown:
1. Trade Law and Policy Expertise
- EU Institutions (e.g. DG Trade, Legal Services) employ:
- International trade lawyers
- WTO and FTA negotiation experts
- Trade dispute arbitrators
🔹 Effect: Enables the EU to negotiate enforceable, rules-based agreements and protect interests through legal instruments (e.g. trade defense mechanisms, anti-dumping actions).
2. Market Intelligence and Economic Analysis
- The EU has extensive in-house and commissioned capacity for:
- Sectoral demand forecasts
- Global trade trend analysis
- Value chain mapping
- Tariff/non-tariff barrier assessments
🔹 Effect: Helps identify strategic sectors for investment and trade promotion (e.g. green tech, pharmaceuticals).
3. Standards and Regulatory Engineering
- Highly skilled regulatory experts who:
- Design harmonized product, environmental, and safety standards
- Lead global standard-setting bodies (e.g. ISO, Codex Alimentarius)
- Certify goods and trace compliance across borders (TRACES system)
🔹 Effect: Ensures EU exports meet global regulatory expectations and allows internal trade without friction.
4. Procurement and Industrial Policy Strategists
- Competencies in:
- Public procurement strategy
- Local content development
- SME industrial upgrading and supplier development
🔹 Effect: Instruments like Buy European, SME thresholds, and joint procurement initiatives foster intra-EU demand.
5. Trade and Economic Diplomacy
- Diplomats trained in:
- Bilateral and multilateral trade negotiations
- Strategic deployment of trade instruments (sanctions, quotas, aid-for-trade)
- Coordinated engagement through EU Delegations globally
🔹 Effect: EU presents a unified voice in WTO, UNCTAD, and regional platforms, enhancing leverage.
6. Digital and Institutional Infrastructure
- Skills in:
- Building and maintaining digital trade platforms (e.g. EU Export Helpdesk)
- Cross-border payment systems, customs facilitation, e-certification
- Export finance and insurance (via EIB, EBRD)
🔹 Effect: High ease of doing trade across borders, especially for SMEs.
7. Coordination and Consensus Building
- Institutional know-how in:
- Facilitating consensus across 27+ sovereign countries
- Structuring directives, policies, and votes (e.g. Qualified Majority Voting)
- Aligning national interests with EU-wide goals
🔹 Effect: Prevents fragmentation and enables implementation of common positions.
AU + AfCFTA: GAPS AND EMERGING COMPETENCIES
| Competency Area | Current State in AU/AfCFTA | Limitation |
|---|---|---|
| Trade Law and Negotiation | Present in pockets (e.g. UNECA, AfCFTA negotiators) | Thin pool, fragmented across countries |
| Market Intelligence | Emerging (Afreximbank, UNCTAD Africa reports) | Lacks centralized, real-time tools |
| Standards & Certification | SADCAS, ARSO initiatives underway | No continent-wide system yet |
| Industrial Policy | Some national-level efforts (e.g. Ethiopia, Rwanda, Morocco) | AU lacks mandate to coordinate |
| Trade Diplomacy | Regional blocs active (e.g. ECOWAS) | No unified African trade voice globally |
| Digital Trade Tools | AfCFTA e-commerce protocols and trade observatory (early stage) | Limited adoption, no export helpdesk equivalent |
| Procurement Strategy | Most countries use national tendering with little regional logic | Missed opportunity for intra-African sourcing |
| Institutional Coordination | RECs coordinate regionally | Weak coordination with AU/AfCFTA central bodies |
Summary: What the EU Has that Works
| EU Capability | Enables… |
|---|---|
| Legal and economic architecture | Binding and enforceable regional trade rules |
| Intelligence and foresight units | Strategic trade planning and investment direction |
| Regulatory capacity | Product traceability, consumer trust, global compatibility |
| Diplomacy with strategic autonomy | Leverage in global trade negotiations |
| Coordinated procurement power | Internal demand generation |
| Digital tools and trade platforms | SME participation, faster exports, data-driven governance |
Would you like a recommendation matrix for AU and AfCFTA showing how they can build these competencies in the next decade, and which partners or institutions could support those efforts?
AU–AfCFTA TRADE COMPETENCY DEVELOPMENT MATRIX (2025–2035)
Here is a Recommendation Matrix for how the AU and AfCFTA can build the institutional and human competencies needed to match the EU’s effectiveness in trade integration, demand generation, and global competitiveness. It outlines what to build, how to build it, who can help, and what it unlocks.
| Capability Area | What to Build | How to Build It | Key Partners & Enablers | Unlocks |
|---|---|---|---|---|
| 1. Trade Law & Policy | AU-wide pool of trade lawyers and WTO negotiators | – Fund AfCFTA legal fellowships- Establish continental Trade Policy School (via AfCFTA Academy) | UNCTAD, WTO, African Development Bank, GIZ | Stronger FTAs, binding protocols, unified African trade positions |
| 2. Market Intelligence & Foresight | African Trade Intelligence & Forecasting Centre | – Build a real-time export demand dashboard- Use AI and satellite data to track flows | UNECA, ITC, Afreximbank, McKinsey Africa | Early signals on export demand, global trend navigation |
| 3. Standards & Regulatory Engineering | Pan-African Product Standards Council | – Integrate SADCAS, ARSO, EACB into one harmonized system- Mobilize private labs and academia | ISO, WTO-TBT, TradeMark Africa | Trusted African goods in global markets; smoother intra-trade |
| 4. Industrial Policy & Supplier Upgrading | Regional value chain coordination teams | – Align RECs with AfCFTA industrialization roadmap- Build cross-border cluster funds | UNIDO, AfDB, ECOWAS, SADC, EAC | Targeted upgrading of firms for intra-African supply networks |
| 5. Trade Diplomacy | African Trade Diplomatic Corps | – Create a professional corps for trade envoys- Post to embassies, trade fairs, WTO missions | AU Commission, Ministry of Foreign Affairs (national), OIF, AUCIL | Unified African voice in WTO, G20, AfCFTA partner negotiations |
| 6. Digital Trade Infrastructure | AU Trade Gateway Platform | – Expand AfCFTA Trade Observatory- Create Export Helpdesk + Digital Certificate Portals | UNECA, Smart Africa, EU-Africa Digital Partnership | SME export access, customs automation, regional e-commerce |
| 7. Strategic Procurement Alignment | AU-AfCFTA Local Sourcing Framework | – Harmonize procurement regulations for cross-border sourcing- Introduce “Buy African First” incentives | African Union Commission, RECs, PIDA | Internal demand stimulation and regional supplier development |
| 8. Export Promotion & Market Access | Africa Export Matchmaking & Opportunity Network | – Set up market readiness accelerator programs- Partner with diaspora business networks | Afreximbank, ITC, ECOWAS TPO Network, diaspora chambers | Faster SME export growth, regional branding and market fit |
| 9. Financing & Risk Instruments | Regional Export Finance & Insurance Facility | – Pool sovereign guarantees- Expand Afreximbank products to all RECs | Afreximbank, Africa Trade Insurance Agency, AUDA-NEPAD | Risk reduction for exporters and regional infrastructure |
| 10. Consensus & Implementation Mechanisms | AU-AfCFTA Decision-Making Protocols | – Move toward qualified majority voting for trade implementation- Develop enforcement dispute resolution capacity | AUC Legal Counsel, African Court on Human and Peoples’ Rights | Timely, collective enforcement of trade reforms |
🎯 Strategic Outcome by 2035
If implemented, this roadmap would allow the AU and AfCFTA to:
- Shift from a coordination platform to a trade-generating bloc
- Achieve 35–40% intra-African trade share (up from ~16%)
- Lead unified trade negotiations with major global blocs (EU, US, China, BRICS)
- Stimulate domestic industrial upgrading and SME competitiveness
- Increase African export visibility and bargaining power in global value chains
10-YEAR IMPLEMENTATION ROADMAP
The 10-year implementation roadmap has been structured into three strategic phases: Foundation, Integration & Scaling, and Consolidation & Autonomy. It outlines the institutional and technical steps needed to transform the AU and AfCFTA into a globally competitive trade bloc by 2035.
Here is the 10-Year AU–AfCFTA Trade Competency Development Roadmap, outlining:

- Phases (2025–2035) by strategic priority area
- Lead countries and institutions are best positioned to drive each transformation
- Key actions for capability building
- Expected outcomes that contribute to a more unified and competitive African trade bloc.
CONTINENTAL RAW MATERIAL / AGRICULTURAL PRODUCE AND AGRO-PROCESSING SEGMENTATION
To meet rising global demand and leverage comparative advantages, Africa’s agro-export strategy should segment itself by:
- Agro-climatic zones
- Production volume
- Processing capability
- Export market match
🌍 Proposed Segmentation Model by Region
| Zone / Corridor | Key Countries | Agro-Produce Focus | Agro-Processing Opportunity | Recommended Processing Partners | Expected Production in 2035 (MT) | Expected Production in 2045 (MT) | Target Export Markets |
|---|---|---|---|---|---|---|---|
| West Africa Cocoa Belt | Côte d’Ivoire, Ghana, Nigeria, Togo | Cocoa, oil palm, cashew | Cocoa butter, chocolate, palm olein, nut oil | Morocco, Tunisia, South Africa | 3,500,000 | 5,500,000 | EU, USA, Middle East |
| Sahelian Livestock Corridor | Mali, Niger, Burkina Faso, Chad | Cattle, goats, hides millet | Meat processing, leather goods | Senegal, Nigeria, Ghana | 2,200,000 | 3,800,000 | North Africa, GCC |
| Horn & East Africa Highlands | Ethiopia, Kenya, Uganda, Rwanda | Coffee, tea, flowers, cereals | Roasted coffee, packaged teas, essential oils | Uganda, Rwanda, Egypt | 4,200,000 | 6,500,000 | EU, UK, China |
| Nile Agro Corridor | Egypt, Sudan, Ethiopia | Wheat, fruits, vegetables | Juices, dried fruit, frozen vegetables | 3,800,000 | 5,800,000 | EU, Russia, MENA | |
| North African Coastal Zone | Morocco, Tunisia, Algeria | Olives, citrus, tomatoes | Olive oil, canned tomatoes, citrus concentrate | Egypt, Senegal, Kenya | 3,400,000 | 5,000,000 | EU, Russia, Turkey |
| Central African Timber-Agro Zone | Cameroon, Gabon, Congo | Cocoa, timber, bananas | Chocolate, processed timber, banana flour | 3,000,000 | 4,500,000 | China, India | |
| SADC Fertile Plains | Zambia, Malawi, Zimbabwe | Soybeans, maize, tobacco | Animal feed, vegetable oils, nicotine extract | South Africa, Kenya, Tanzania | 3,700,000 | 6,000,000 | China, GCC, ASEAN |
| Kalahari-Limpopo Processing Corridor | South Africa, Botswana, Namibia | Beef, grapes, fruits | Wine, canned fruit, beef jerky, leather | Mauritius, Ghana, Botswana | 3,600,000 | 5,800,000 | EU, China, USA |
| Uganda, Rwanda | Bananas, dairy, horticulture | Kenya, Tanzania, Ethiopia | EU, COMESA, GCC | ||||
| Indian Ocean Island Belt | Madagascar, Mauritius, Comoros | Vanilla, sugar, spices. seafood | Packaged vanilla, brown sugar, essential oils | 1,800,000 | 3,000,000 | EU, Gulf, India | |
| Nigeria, Cameroon | Cassava, maize, soybeans | Ghana, Egypt, South Africa | ECOWAS, ASEAN, China | ||||
| Mozambique, Madagascar | Sugarcane, vanilla, seafood | South Africa, Mauritius, Kenya | EU, India, GCC |
🔁 Cross-Cutting Processing Hubs can also be established around:
- Ports (e.g. Mombasa, Abidjan, Durban)
- Special agro-economic zones (Nigeria, Ethiopia, Morocco)
NEW AGRO-PROCESSING OPPORTUNITIES IN AU
🧠 Additionally: What Africa Is Not Yet Producing but Should Build Toward
To meet future export market demand, population shifts, and changing global diets, AU countries should consider investing in:
| Product/Commodity | Why It’s Strategic | Who Should Lead |
|---|---|---|
| Plant-based proteins (pea, chickpea, lentil-based meat substitutes) | Rising global vegan/health demand | Ethiopia, Kenya, Nigeria |
| Bio-fortified foods (iron-rich beans, vitamin A maize) | Tackles malnutrition, aligns with donor support | Uganda, Rwanda, Zambia |
| Specialized dairy products (probiotic yogurt, infant formula) | Growing elderly and child populations | Kenya, Morocco, South Africa |
| Medicinal plants and supplements (baobab, moringa, African ginger) | Aging global population, wellness trends | Ghana, Botswana, Madagascar |
| Ready-to-eat packaged meals (e.g. jollof rice, injera kits) | African diaspora demand + global ethnic food markets | Senegal, Ethiopia, Mauritius |
| Functional beverages (cold-pressed juices, herbal infusions) | Youth and health markets | Nigeria, Egypt, Kenya |
| Biodegradable packaging materials (cassava starch, bagasse) | Eco-conscious consumer base | Mozambique, Malawi, Uganda |
Here is a comparative table of agro-processing partnerships between raw material-producing AU countries and recommended processing partner countries. The pairings are based on proximity, infrastructure, processing capabilities, and target export markets.
The New Agro-Processing Opportunities in AU tablehighlights emerging high-potential agro-industrial products. It includes:
- Why each commodity is strategic
- Leading countries for production
- Agro-produce base
- Recommended intra-AU processing partners
- Export market alignment
This complements the existing agro-zones by future-proofing Africa’s agro-industrial strategy to meet evolving global demand and demographic shifts. Let me know if you’d like this merged into a full strategic policy document or turned into a continental agro-industry development map.
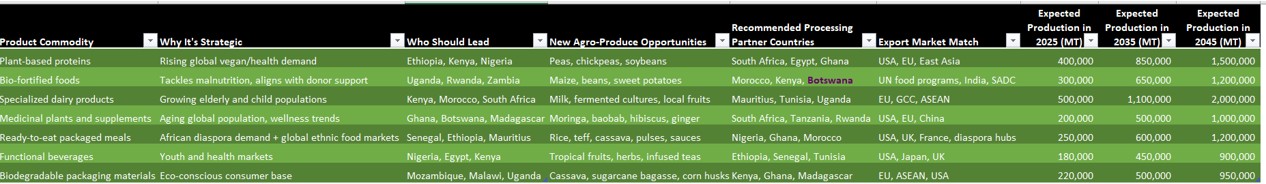
The updated table now includes forecasted production levels (in metric tonnes) for 2025, 2035, and 2045, giving a long-term perspective on how AU countries can scale emerging agro-industries. These projections align with expected:
- Global demand growth
- Continental industrial policy implementation
- Population and dietary shifts
To align Africa’s workforce with the industrial, agricultural, and trade transformation agenda of AU + AfCFTA, particularly to meet future global production and export demands, a significant shift in STEM education (Science, Technology, Engineering, Mathematics) is essential.
STRATEGIC FRAMING: WHY STEM IS CRUCIAL
STEM competencies drive:
- Agro-industrial innovation (e.g. food engineering, packaging tech)
- Infrastructure, logistics, and digital trade (e.g. AI for supply chain, port automation)
- Product development, quality assurance, and traceability
- Climate-smart agriculture and sustainability science
- Health, biotech, and export compliance (e.g. ISO/HACCP labs)
Current State of STEM Education in AU (Approximate Averages)
| Level | % of Students in STEM Tracks | Comment |
|---|---|---|
| Primary (STEM exposure) | ~10–20% | Mostly general science with limited practicals |
| Lower Secondary | ~15–25% | STEM courses taught but poorly resourced |
| Upper Secondary (STEM specialization) | ~12–18% | Dropout high, girls underrepresented |
| Tertiary STEM Graduates | ~25–30% of total grads | Dominated by life sciences, underrep in engineering/ICT |
📌 STEM Quality Issues: Most STEM curricula are theoretical, with limited lab work, outdated equipment, and little industry linkage.
Target STEM Participation Goals Aligned with AU + AfCFTA Needs
| Year | Primary (STEM exposure) | Secondary (STEM specialization) | Tertiary STEM graduates (% of total grads) |
|---|---|---|---|
| 2025 | 30% | 25% | 35% |
| 2035 | 50% | 40% | 45% |
| 2045 | 70% | 60% | 60% |
Grade & Competency Focus by Educational Level
| Level | Core STEM Competencies Needed | Application to AU + AfCFTA |
|---|---|---|
| Primary (Grades 1–6) | Curiosity, basic math, logic, nature science, digital literacy | Early orientation toward productivity, climate, trade |
| Lower Secondary (Grades 7–9) | Applied math, experimentation, coding basics, environmental science | Exposure to agro-tech, processing, energy, logistics |
| Upper Secondary (Grades 10–12) | Robotics, agri-science, biotechnology, trade systems, entrepreneurship | Readiness for industrial skilling or tertiary STEM |
| Tertiary / Vocational | Food engineering, quality control, supply chain, AI, export systems | Core skills for agro-processing, certification, innovation |
Policy Recommendations by Country Cluster
| Cluster | Countries | Specialization Focus |
|---|---|---|
| Agro-Export Leaders | Ghana, Kenya, Ethiopia, Morocco, Côte d’Ivoire | Food science, biotechnology, packaging, supply chain analytics |
| Industrial Hubs | South Africa, Egypt, Tunisia, Nigeria | Engineering, AI for manufacturing, automation, standards |
| Logistics & Trade Nodes | Mauritius, Botswana, Namibia, Senegal | Trade IT systems, customs tech, digital trade law |
| Emerging Agro Belts | Rwanda, Zambia, Malawi, Uganda, Cameroon | Smart irrigation, agro-mechanics, post-harvest tech |
🧠 Mobilization Strategy
| Driver | Action |
|---|---|
| Curriculum Reform | Integrate STEM with African productivity needs (AfCFTA-aligned modules) |
| Teacher Upskilling | Train 1M STEM teachers in 10 years, incentivize STEM in rural schools |
| Girls in STEM | Target 50/50 gender parity in STEM by 2045 via scholarships and mentorship |
| National STEM Missions | Launch national innovation contests, agri-STEM academies, trade simulation labs |
| Private Sector Linkages | Build STEM pathways to agro-industry, labs, certification, logistics careers |
CONCLUSION

The table outlines the specific actions and achievements expected under each scenario, linking trade growth outcomes with implementation milestones and STEM development across the African region.
Summary: Projected Trade-Driven Growth Outcomes for the African Union (2025–2045)
This roadmap analysis models four trade growth scenarios—ranging from current conditions to high-level integration efforts—showing their potential impact on income levels, job creation, and demographic alignment across the African Union (AU).
🔹 Key Insights
Trade and Integration Drive Income Growth
Per capita income across the AU could quadruple from USD 2,000 today to over USD 8,000 under a high-level effort scenario, driven by deeper intra-Africa and inter-regional trade rooted in manufacturing and agriculture.
Competency and Infrastructure Alignment Is Critical
Scenarios with stronger outcomes correlate with increased STEM readiness, harmonized trade systems, and robust digital infrastructure—all outlined in the Trade Competency Development Matrix.
Job Creation Potential Is Enormous
With strategic coordination, the AU could see up to 50 million new jobs created by 2045, alongside a working-age population approaching 1.3 billion—signaling the urgency of preparing this demographic through education, vocational training, and entrepreneurship.
Moderate Steps Can Still Deliver Impact
Even a moderate implementation of AfCFTA—activating trade corridors, regional procurement systems, and STEM capacity-building—could lift incomes by 50% and generate 20 million new jobs.
Demographic Advantage Must Be Matched with Opportunity
The AU’s population is expected to grow to 2 billion by 2045, with two-thirds in the working-age bracket. Without strategic economic transformation, this demographic edge may turn into a socio-economic liability.
This analysis confirms that trade policy alone is insufficient. Success depends on synchronizing it with investment in education, market systems, and regional trust-building, turning Africa into a globally competitive production and innovation hub.

Leave a comment