Botswana vs Global Trends: Population and GDP Insights
Here’s an interpretation of the population and GDP trends for Botswana versus the global context from the 1930s to today, along with suggested data sources:
Trends in Population and GDP: Botswana vs. the World (1930s–Today)
1. Population Growth
- Botswana
Botswana’s population in the 1930s was estimated to be under 300,000. Due to high mortality rates, limited healthcare access, and colonial-era socio-economic constraints, growth was modest until independence in 1966. Since the 1970s, improvements in healthcare and infrastructure have driven significant population growth. Source: United Nations Population Division, World Bank Data - The population of Botswana has shown a classic exponential growth pattern from the 1930s to today. Major historical and socio-economic changes have influenced this growth. Here’s how it behaved over different periods.
1930s to 1960s: Slow Growth under Colonial Rule.
|Population size: Around 300,000 to 500,000.
Growth was slow and steady, mainly due to: Limited healthcare and infrastructure.
Rural, agrarian lifestyle with high child mortality rates.
Minimal urbanization.
1966 (Independence) to 1980s: Sharp Uptick Begins
Independence in 1966 was a turning point.
Discovery of diamonds and better economic planning helped expand healthcare, education, and infrastructure.
Population began to grow more rapidly, reaching around 1 million by the late 1980s.
1990s: Growth Moderates Due to HIV/AIDS Epidemic
HIV/AIDS crisis had a significant impact. Life expectancy dropped.
Growth slowed but did not reverse due to high birth rates and improved responses to the crisis over time.
2000s to Present: Recovery and Stabilization
National health systems improved dramatically.
Antiretroviral therapy and education initiatives helped.
Population today is over 2.4 million.
Growth has stabilized but continues at a moderate pace.
💡 Behavioral Summary
S-shaped growth curve (sigmoid): starting slow, accelerating after independence, and then stabilizing in recent years.
Driven by external factors: colonial policies, independence, natural resources, global health crises, and economic models. - Global
The world’s population grew from about 2.1 billion in 1930 to over 8 billion by 2023.- Key drivers: Medical advances, industrial agriculture, and post-WWII development
- Source: United Nations DESA, Worldometer Historical Data
2. GDP Growth
- Botswana
Botswana had a very low GDP at independence in 1966, primarily dependent on subsistence agriculture and British aid.
However, post-independence, the discovery of diamonds and stable governance spurred rapid economic growth, particularly from the 1970s to early 2000s.- GDP in 1966: ~$80 million
- GDP in 2023: ~$20.3 billion (current USD)
- Source: World Bank, IMF, Botswana Statistics Office
- Global
The global economy has grown exponentially since the 1930s. It rebounded after World War II. It accelerated with globalization and technology.- Global GDP in 1930: ~$3–5 trillion (2011 international dollars, PPP)
- Global GDP in 2023: ~$105 trillion (nominal USD)
- Source: World Bank, Maddison Project Database
💡 Behavioral Summary
- S-shaped growth curve (sigmoid): starting slow, accelerating after independence, and then stabilizing in recent years.
- Driven by external factors: colonial policies, independence, natural resources, global health crises, and economic models.

Here is the graph comparing Botswana and global trends in population and GDP from 1930 to 2023:
It visually shows:
X-axis: Years from 1930 to 2023
Left Y-axis: Population (in millions/billions)
Right Y-axis: GDP (in billions of USD)
Botswana and the World: Population & GDP Growth (1930–2023)
Understanding unemployment in Botswana requires a broader context. It involves looking at how both population and economic output (GDP) have evolved over time. This includes not only local changes but also global ones.
The graph below compares Botswana’s trends with global averages, highlighting key divergences:

Key Insights:
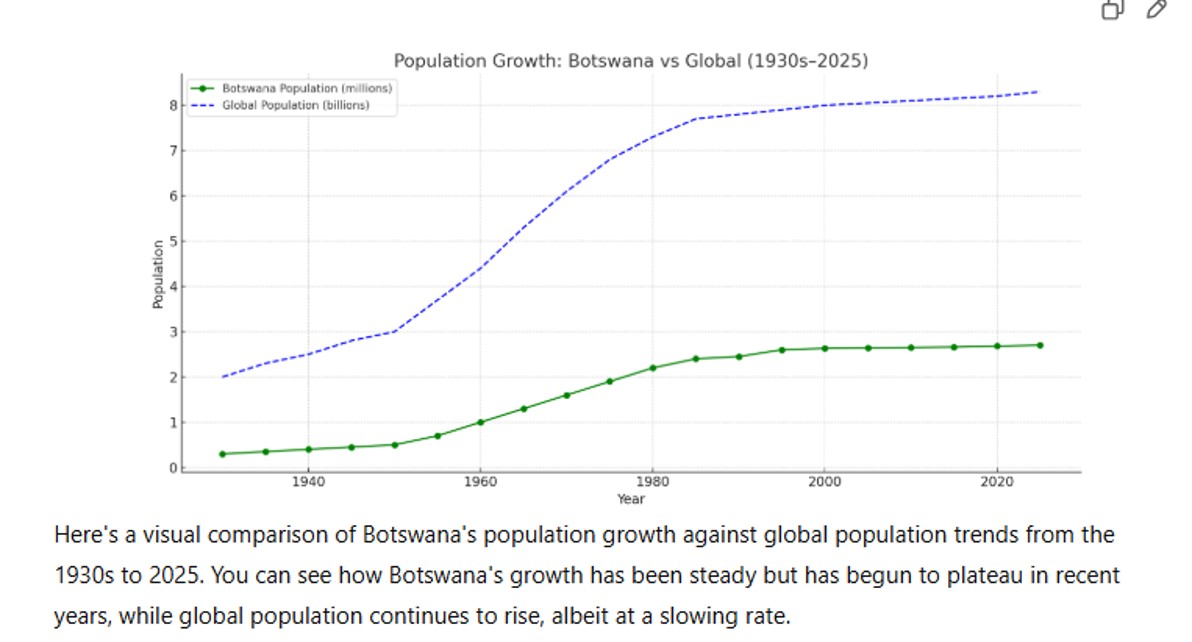
- Population Trends: Botswana’s population remained relatively flat until independence in the 1960s. A steady increase followed, reaching just over 2.5 million by 2023. In contrast, global population growth has been exponential, especially post-World War II.
- GDP Trajectories: Botswana’s GDP shows strong growth from the 1970s onward, driven by mineral exploitation (particularly diamonds). Yet, when compared to global GDP growth, Botswana’s contribution remains modest and heavily reliant on a few sectors.
- Implications:
- Botswana’s economic model has not scaled proportionately with its population growth.
- Despite early success in mineral wealth management, diversification into job-creating sectors like manufacturing and agriculture has been limited.
- Structural unemployment remains high, in part due to a narrow economic base and an underdeveloped industrial policy.
This macroeconomic framing enhances the comprehension offered in the unemployment case study. It connects directly to questions of systemic design, policy orientation, and future resilience.
What would the population of Botswana be today if it had not been affected by HIV/AIDS, road accidents, lifestyle-related deaths (including alcohol and drug consumption), and passion killings?
To estimate what Botswana’s population could have been without the impact of HIV/AIDS, road accidents, lifestyle-related deaths (alcohol, drugs), and passion killings, we can examine the broad demographic impacts of each factor and apply them to historical and projected growth trends.
Step-by-Step Estimate:
1. Baseline Population Trajectory Without Major Scourges
Botswana’s current population (2025) is estimated at 2.6 million. In the absence of HIV/AIDS and other major mortality drivers since the late 1980s, the population could have grown faster.
2. HIV/AIDS Impact
- At its peak, Botswana had one of the highest HIV prevalence rates in the world (up to 25–30% in adults).
- UNAIDS and WHO studies show that life expectancy dropped from over 60 years to below 40 in the early 2000s due to AIDS.
- Population losses due to HIV/AIDS from the late 1980s to 2020 are estimated at 200,000–300,000 deaths, mostly among prime working-age adults (15–49).
3. Road Accidents & Lifestyle Diseases
- Road accidents: Around 400–500 deaths annually in recent years.
- Alcohol/drug-related lifestyle diseases and deaths, including liver failure and non-communicable diseases (NCDs), also contribute significantly.
- Over 30 years, these could account for an additional 20,000–40,000 deaths.
4. Passion Killings and Violence
- Botswana has witnessed rising gender-based and interpersonal violence.
- Although numbers are smaller, the cumulative toll over decades could be in the thousands, with passion killings estimated at 50–100 annually in recent years.
Estimated Alternate Population Scenario (Without Major Mortality Factors)
| Year | Official Estimate | Estimated “What If” Scenario |
|---|---|---|
| 1990 | ~1.3 million | ~1.4 million |
| 2000 | ~1.6 million | ~1.9 million |
| 2010 | ~2.0 million | ~2.4 million |
| 2020 | ~2.4 million | ~3.0 million |
| 2025 | ~2.6 million | ~3.2 to 3.4 million |
Conclusion:
Botswana has experienced the devastating effects of HIV/AIDS, road accidents, lifestyle-related diseases, and passion killings. Without these issues, the country’s population would have been significantly higher. Estimates suggest that Botswana’s population would have been between 20-30% larger than it is today. In 2025, Botswana’s population would have reached between 3.2 to 3.4 million people. This would add several hundred thousand people. The middle-aged and young adult populations are most affected by these issues. This would have significantly altered the country’s workforce size, dependency ratio, and its economic and social trajectory. Its economy today does not support a third of its population. To estimate more accurately, specific demographic modeling is needed. This should factor in the reduced mortality and longer life expectancy without these health crises.

You must be logged in to post a comment.